It’s the most wonderful time of the year: we’re releasing the 2021 edition of the Social Media Industry Benchmark Report!
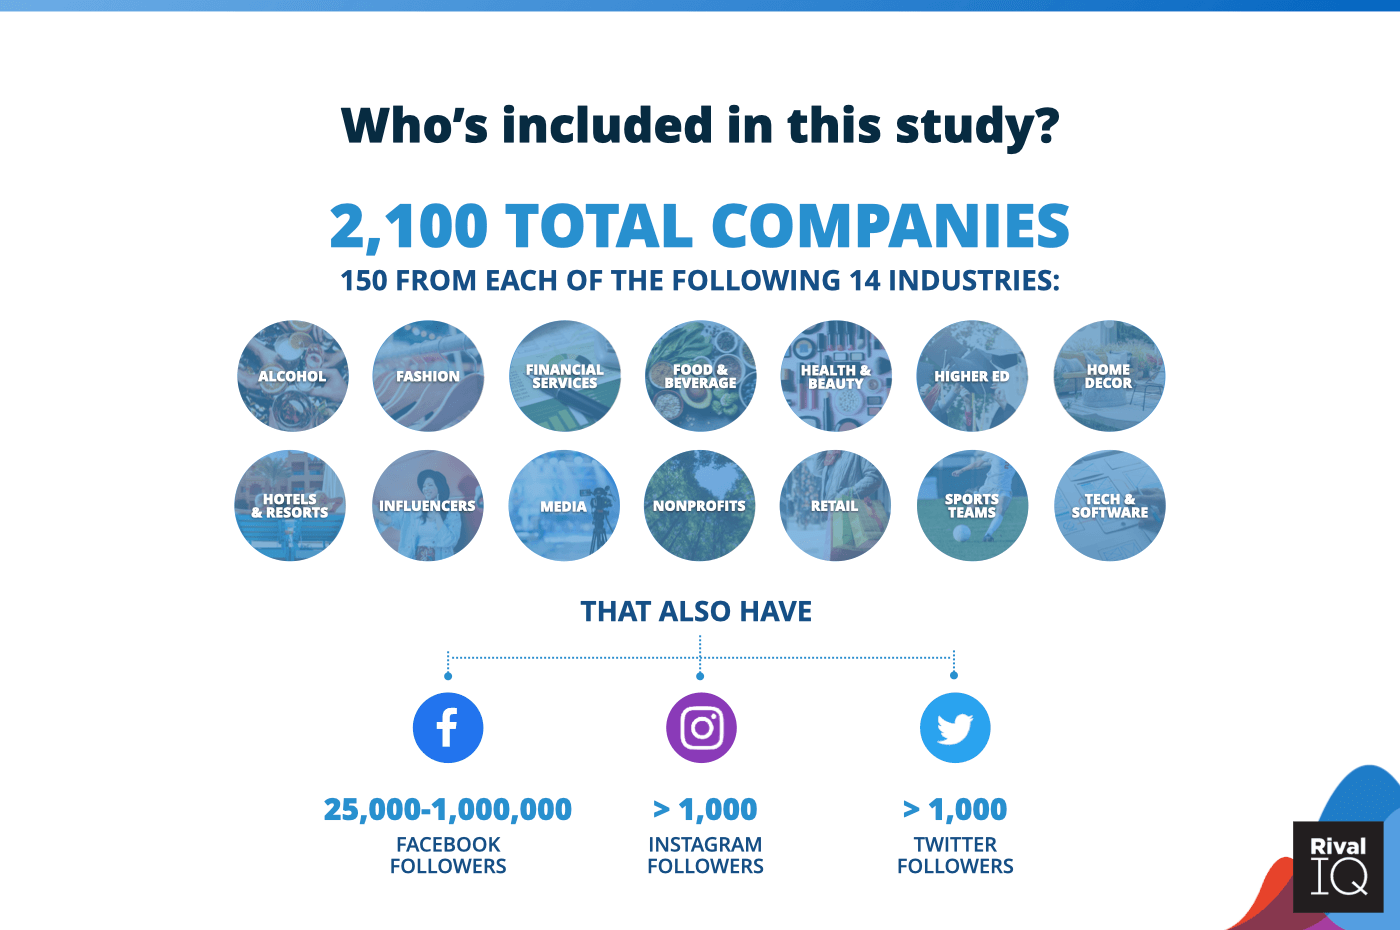
As usual, we’ve jam-packed this report with all the social media benchmarks and metrics that matter most to you for 14 top industries: Alcohol, Fashion, Financial Services, Food & Beverage, Health & Beauty, Higher Education, Home Decor, Hotels & Resorts, Influencers, Media, Nonprofits, Retail, Sports Teams, and Tech & Software.
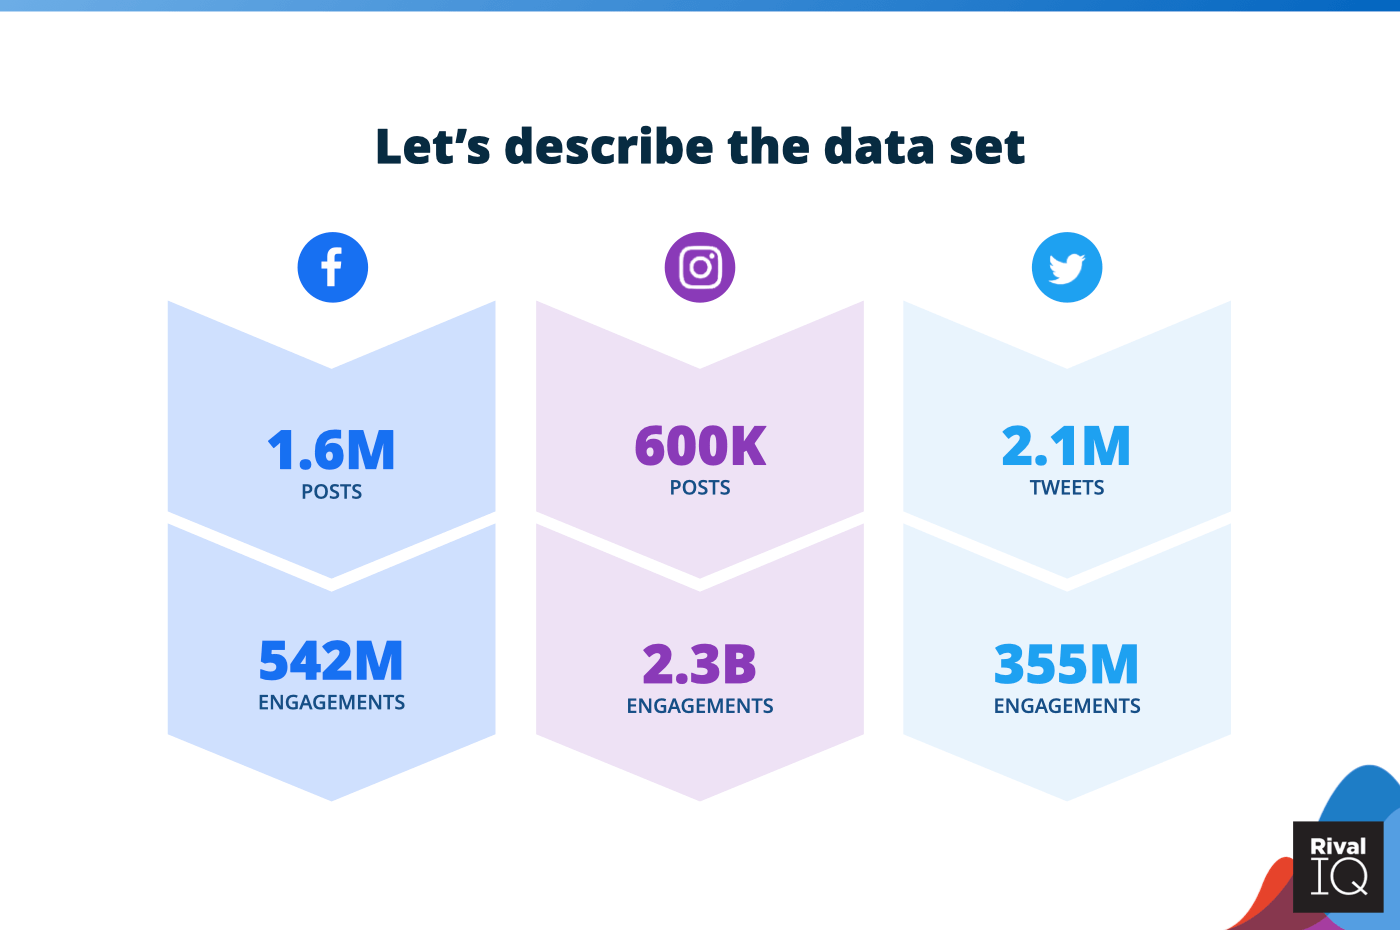
This report is a must-have for any digital marketer responsible for asking the question, “How am I really doing on social?” We looked at more than 2 million posts and 3 billion (yes, with a “b”) likes, comments, and favorites on Facebook, Instagram, and Twitter from top brands in every major industry to bring you the freshest social media benchmark data for posting frequency, post types, hashtags, and more.
Without further ado, let’s get benchmarking!
Social Media Benchmark Key Takeaways
| Engagement rates were flat on Facebook and Twitter, and down on Instagram. It’s a shame to see powerhouse channel Instagram on the decline, but nice to see brands connecting 1:1 more with followers on Twitter. |
|
| Posting frequency continues to decline. Brands are posting a little less often on every channel for the second year in a row. |
|
| Carousels are king on Instagram. Brands should look for opportunities to combine photos into carousels. Why? Instagram carousels often get re-served to users who don’t engage the first time, earning more impressions. |
|
| Diversifying hashtags between channels is key. What works on Instagram might not work on Twitter, so brands should do their research and experiment. |
|
| COVID was less of a player than one might think. No industry was immune to the effects of COVID-19 this year, but it didn’t lead to disastrous declines on social media for any industry in particular. |
All-Industry Social Media Benchmarks
All-Industry: Facebook
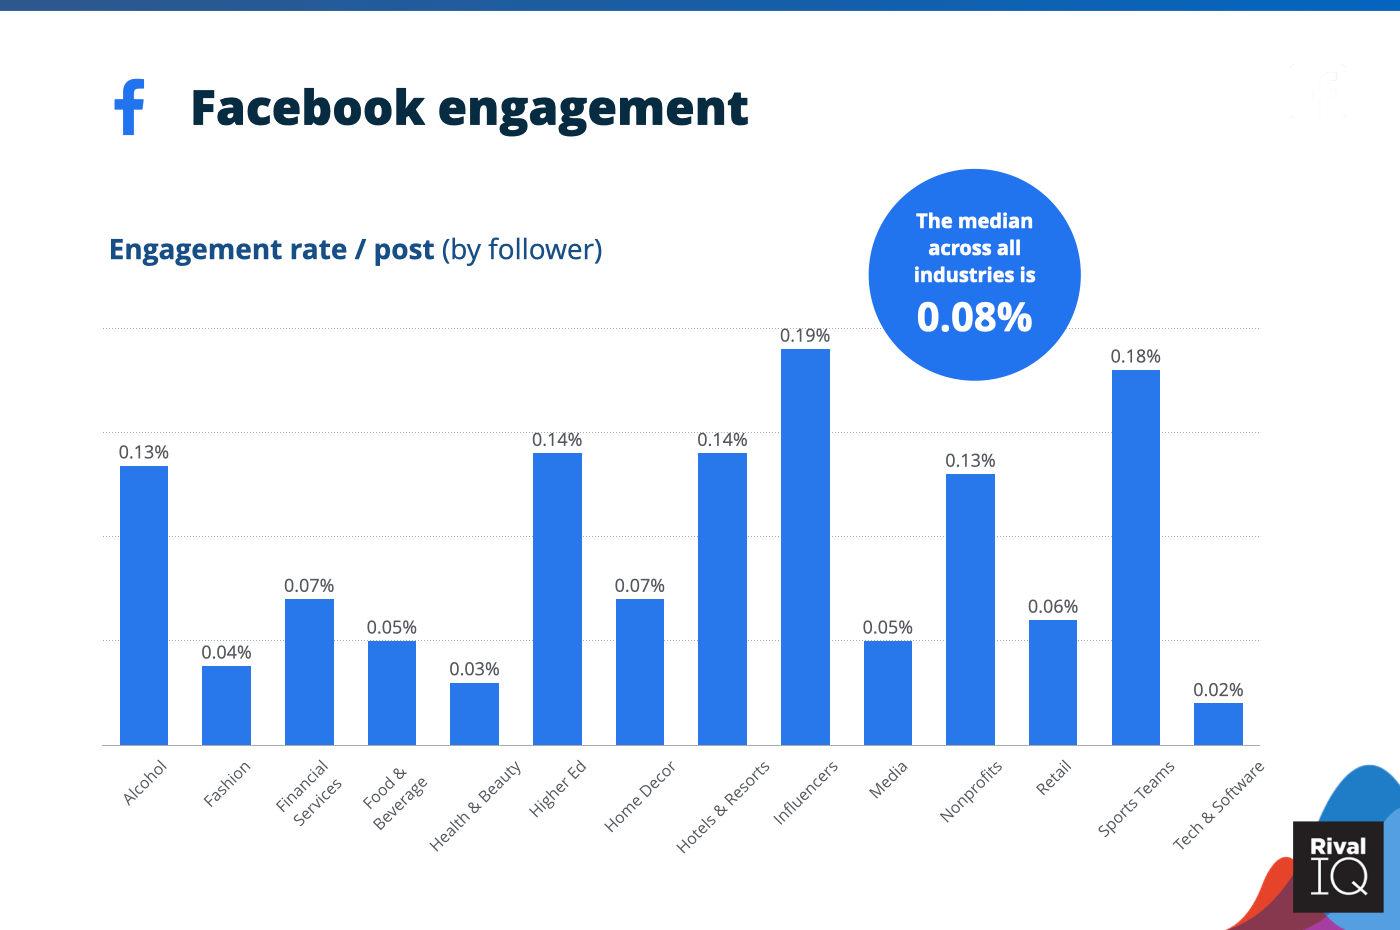
Average Facebook engagement rate per post, all industries
The all-industry Facebook median stayed pretty flat this year, though Alcohol, Hotels & Resorts, Influencers, and Nonprofits were all able to boost their engagement rates.
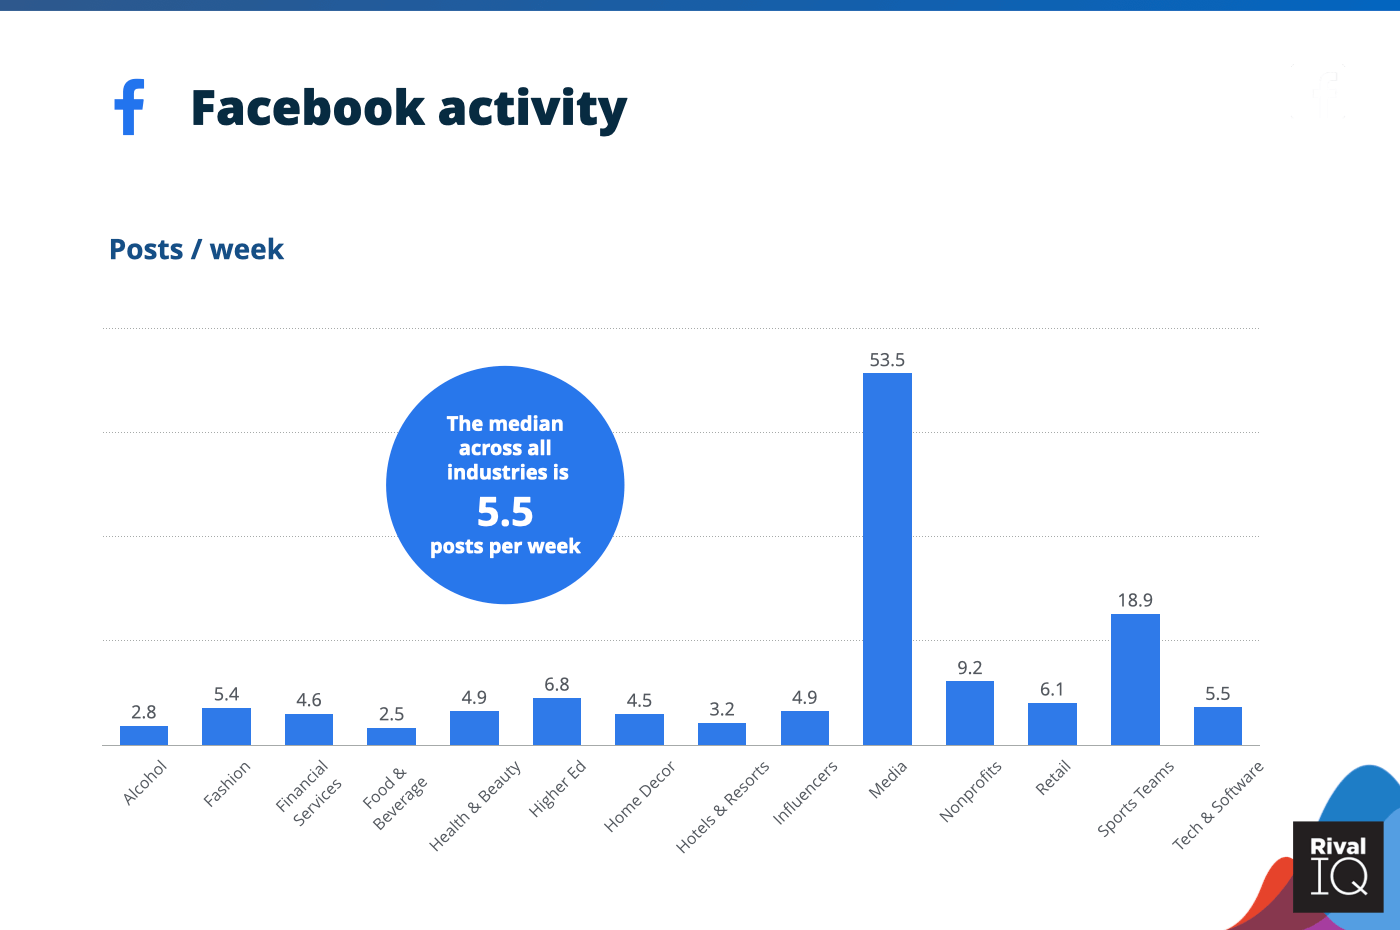
Average Facebook posts per week, all industries
Industries decreased their posting frequency on Facebook by 6% this year.
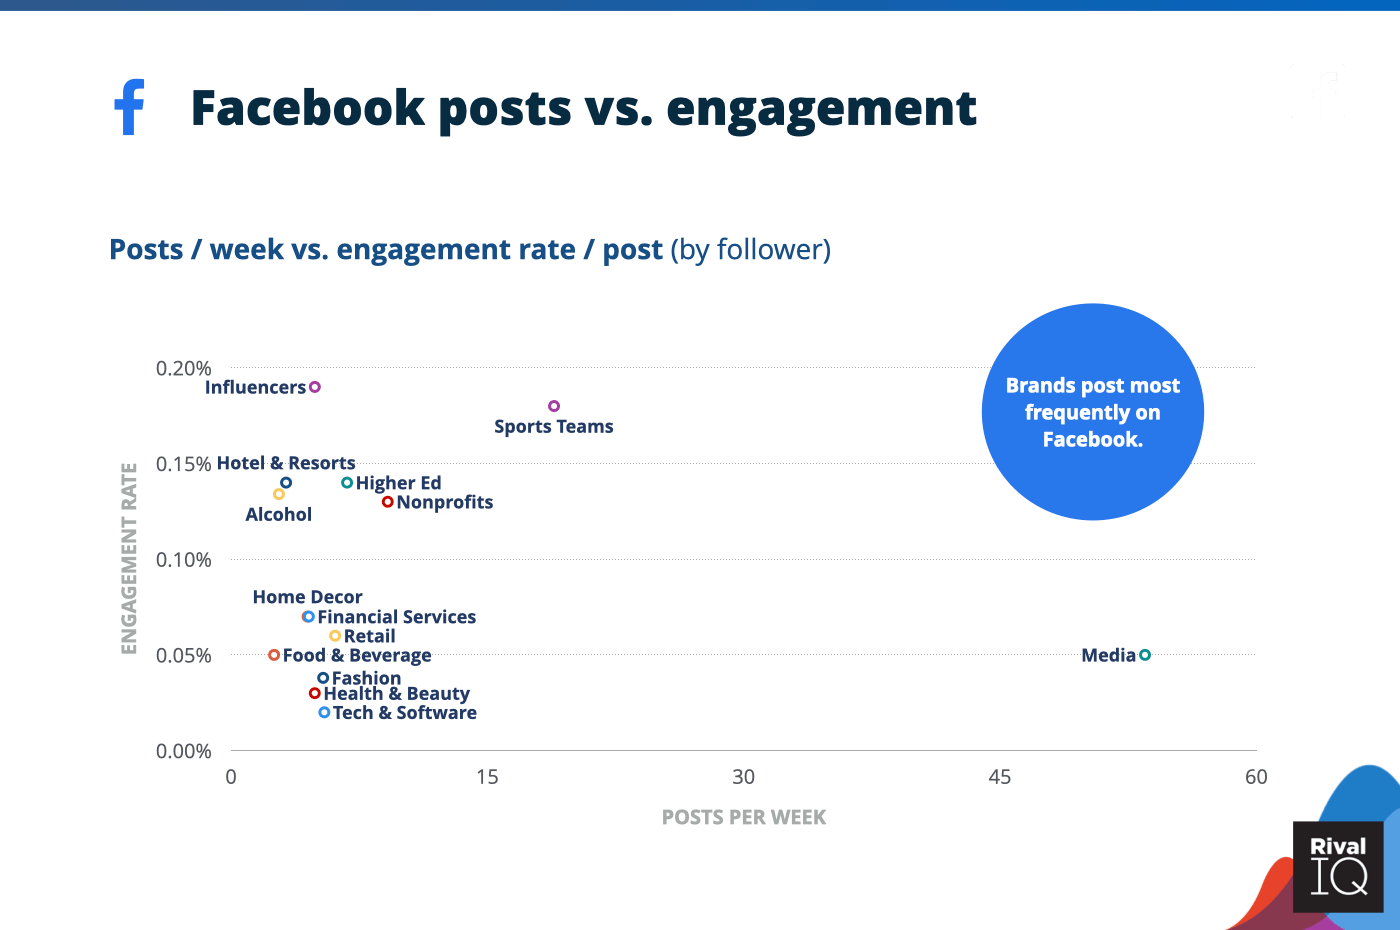
Facebook posts per week vs. engagement rate per posts, all industries
Influencers (infrequent posters) and Sports Teams (frequent posters) were both top performers on Facebook this year, suggesting there isn’t a universal posting frequency that’ll work for any brand.
All-Industry: Instagram
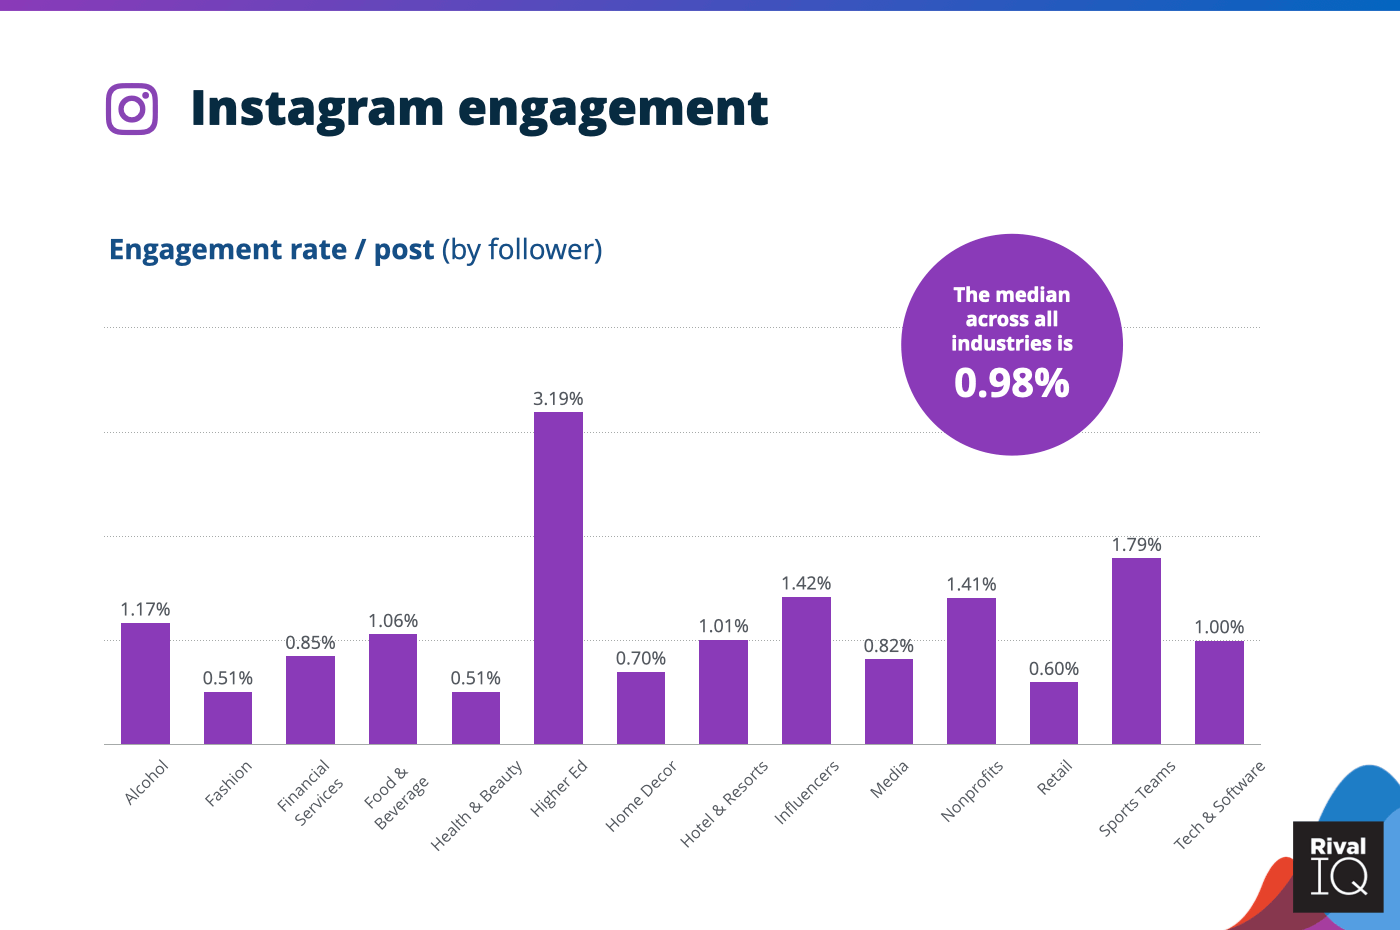
Instagram average engagement rate per post, all industries
Instagram engagement rates fell about 25% this year, but industries like Higher Ed and Sports Teams still managed to come out on top.
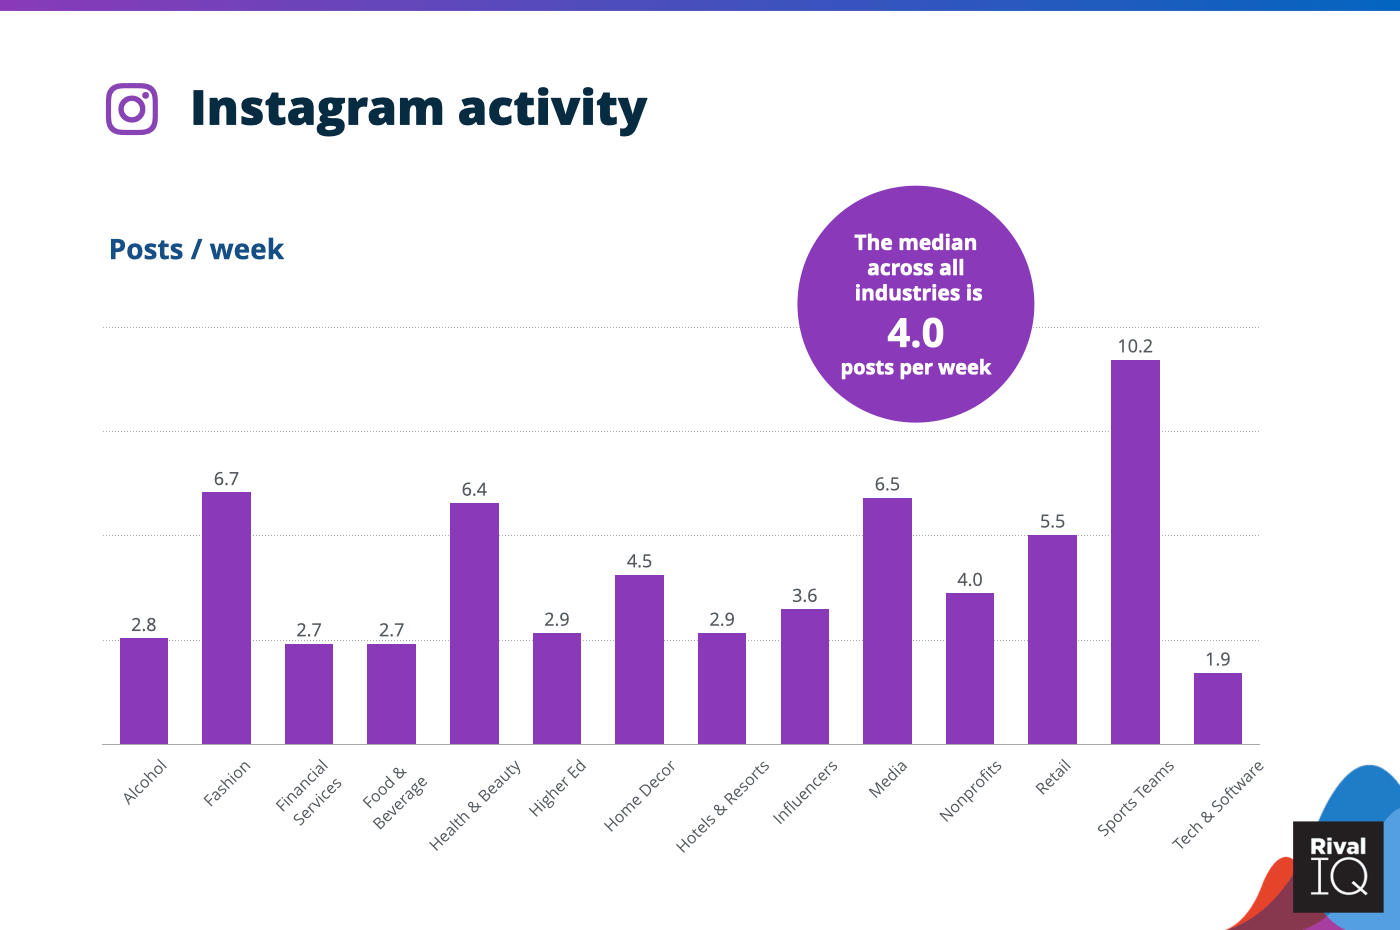
Instagram posts per week, all industries
The median posting frequency across all industries declined by just 8% on Instagram this year, suggesting brands are keeping up their posting on this channel. Instagram continues to divide the attention of viewers beyond feed posts with features like Reels and IGTV.
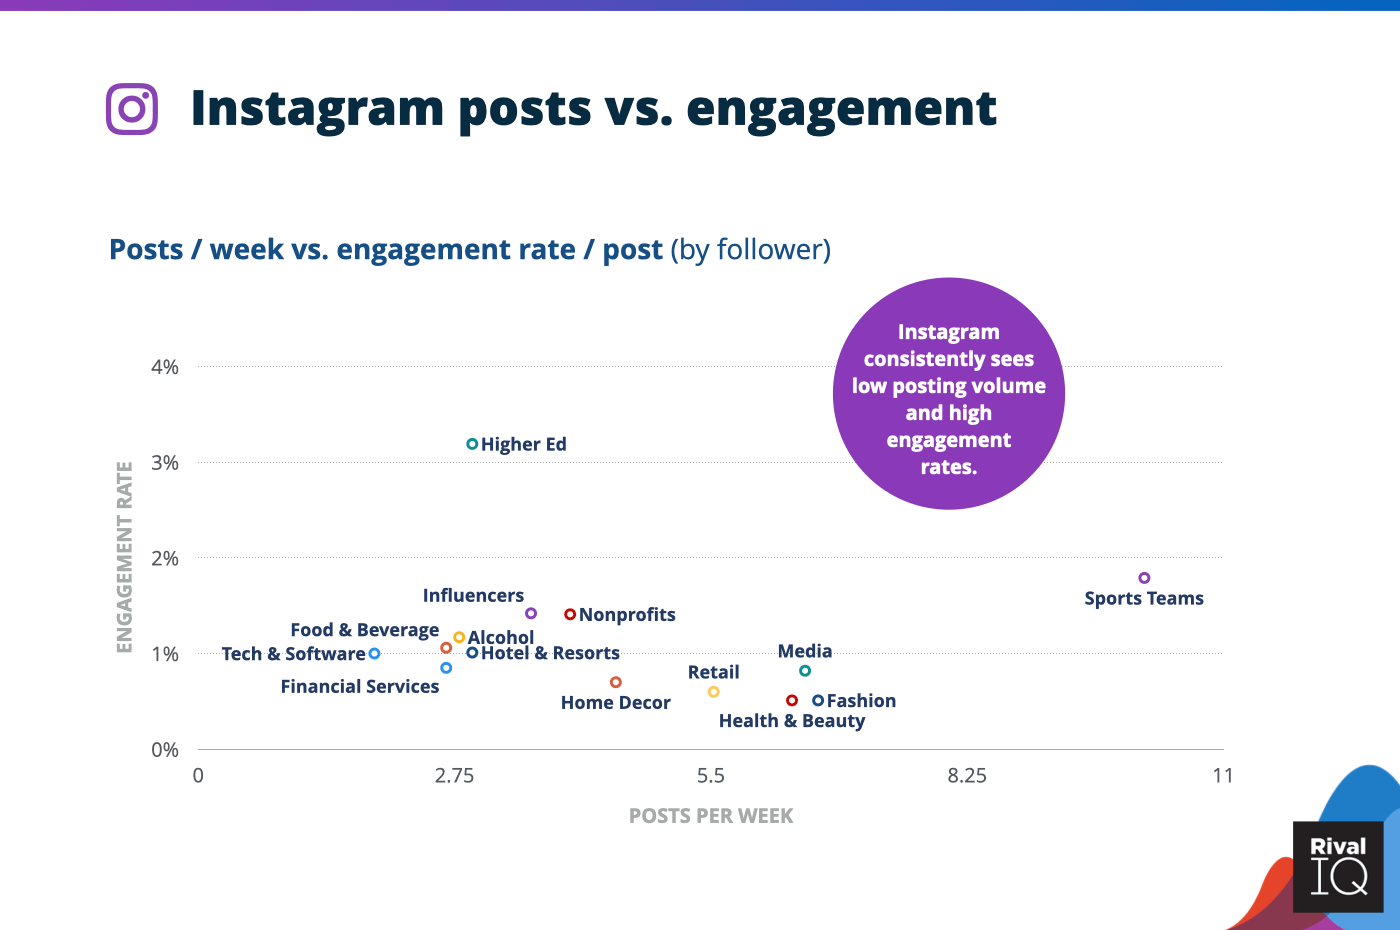
Instagram posts per week vs. engagement rate, all industries
Higher Ed was the clear engagement winner on Instagram despite below-median posting frequency, suggesting more isn’t always better on Instagram (though second-place Sports Teams might beg to differ).
All-Industry: Twitter
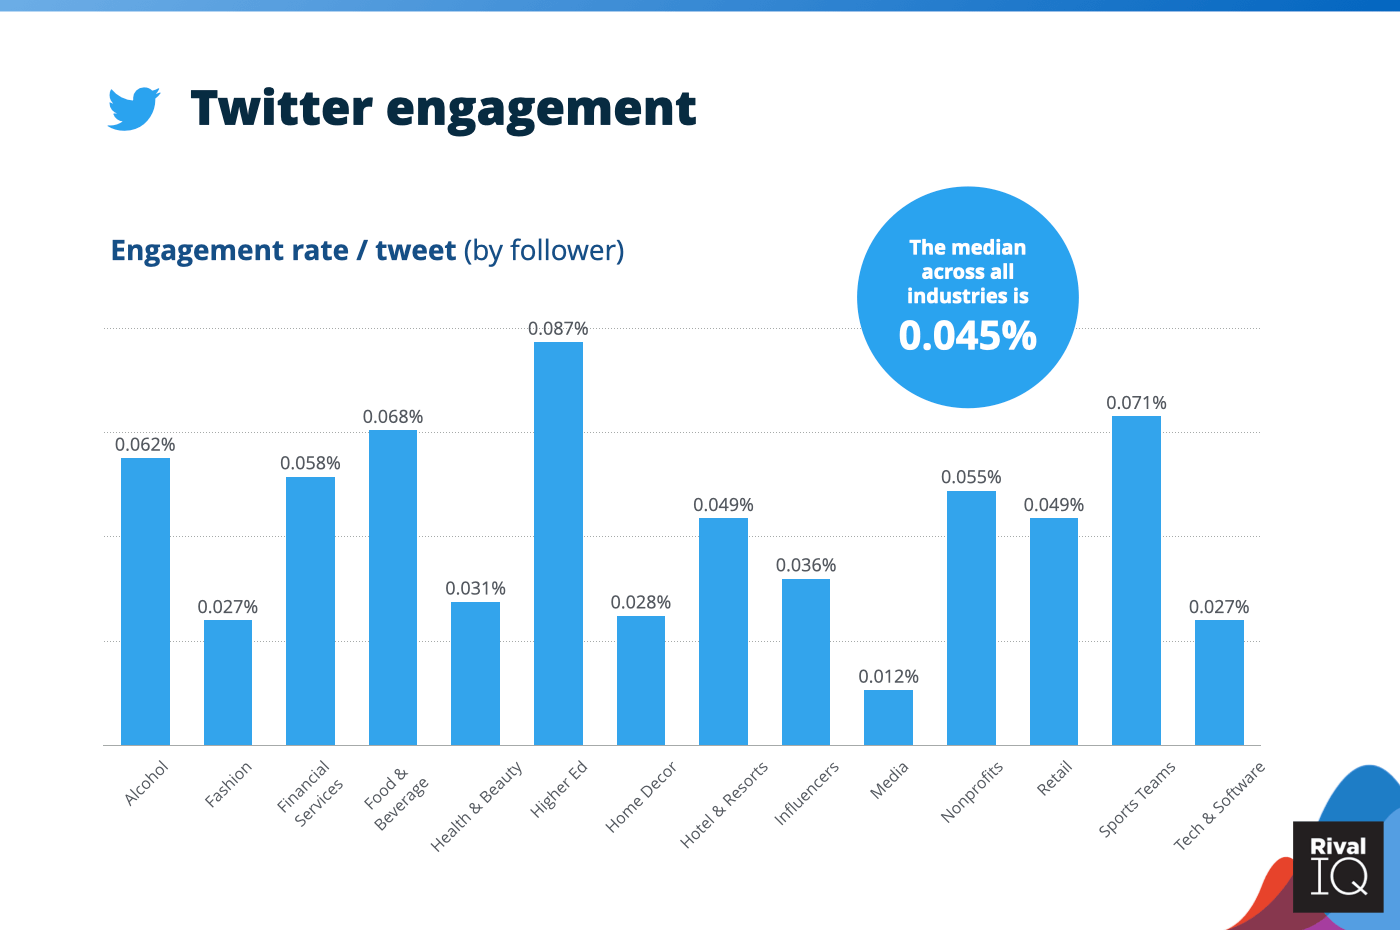
Twitter average engagement rate per tweet, all industries
Industries like Hotels & Resorts, Media, Retail, and Tech & Software were able to increase their Twitter engagement rates.
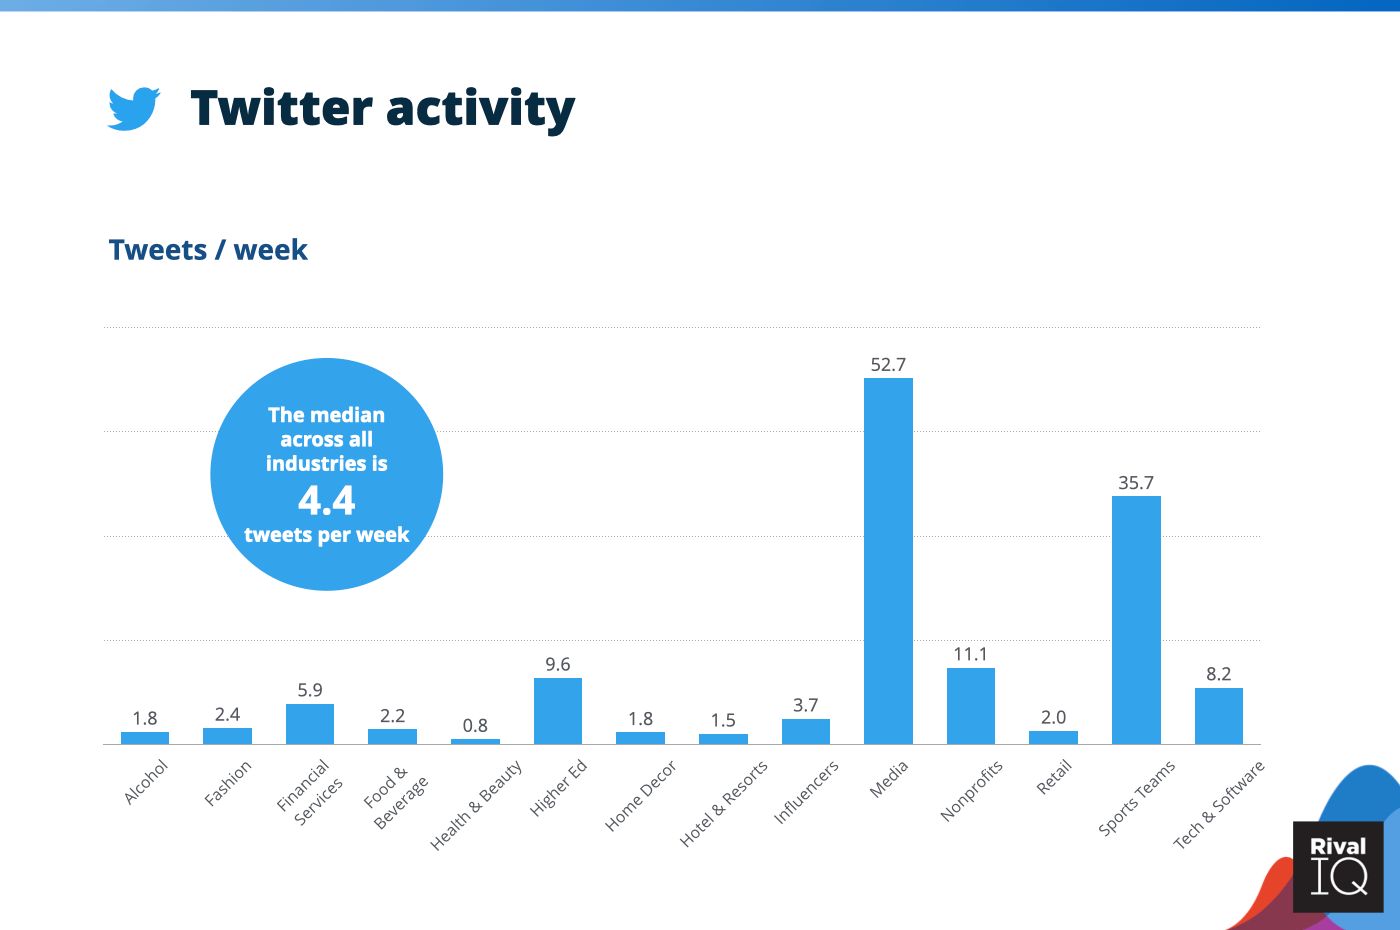
Twitter tweets per week, all industries
Tweeting frequency declined by about 20% this year, and Media and Sports Teams tweeted more than all the rest of the industries combined on Twitter.
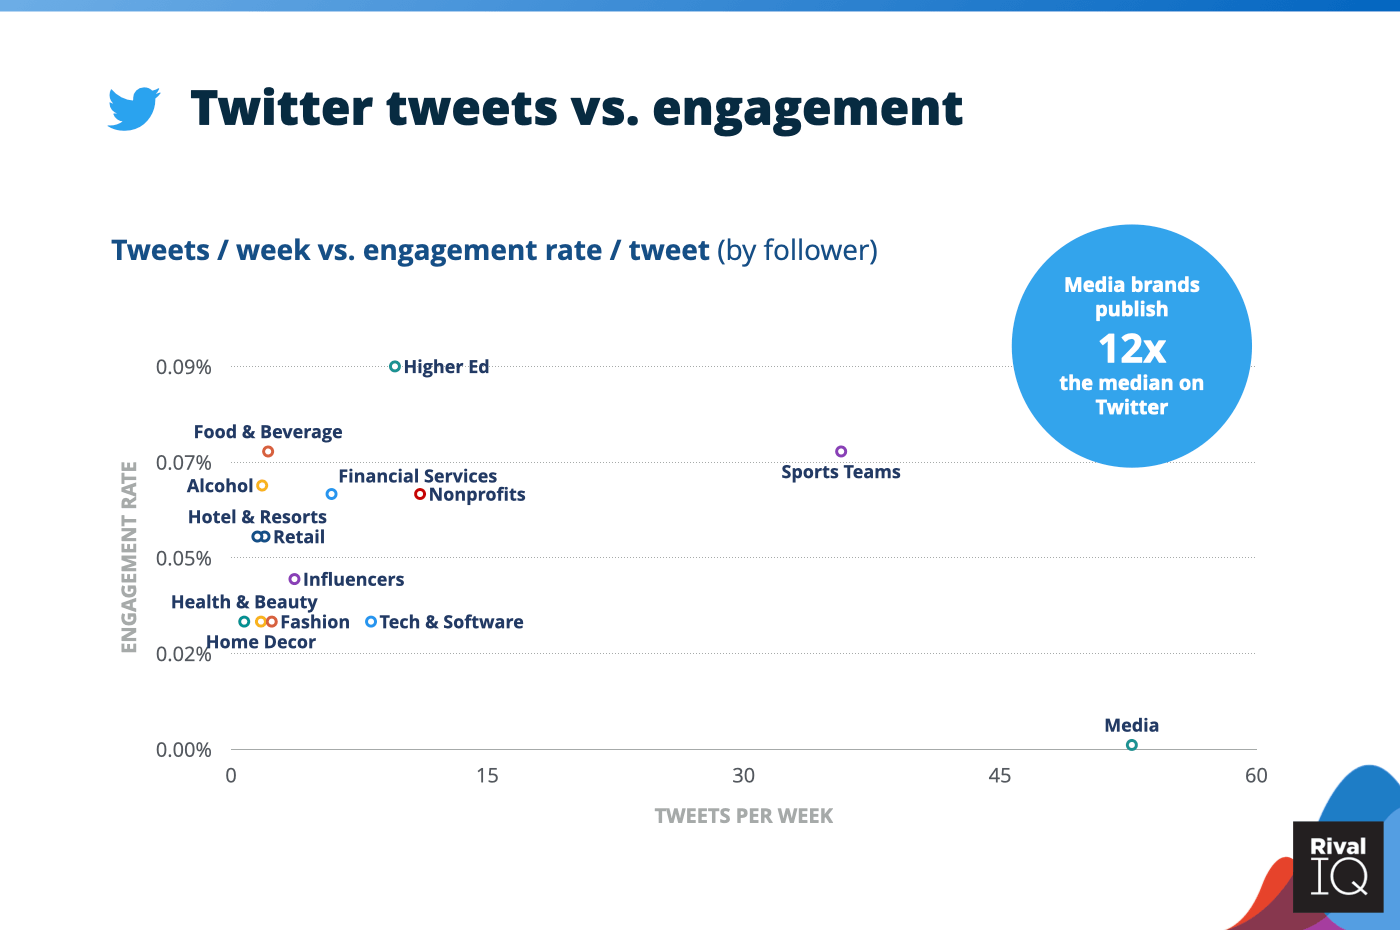
Twitter tweets per week vs. engagement rate, all industries
Frequent tweeters Higher Ed and Sports Teams saw strong engagement rates on Twitter this year, but last-place Media showed other industries what happens with too much of a good thing.
By the way, if you’re wondering if there’s a right time to post on social or an ideal posting frequency for your brand, we’ve got you covered.
Alcohol Social Media Benchmarks
Alcohol brands won the bronze on Twitter but were middle-of-the-road on Facebook and Instagram.
A few ways Alcohol brands can keep up the pace:
- Photos are the way to your followers’ hearts on Facebook and Instagram, but try changing it up on Twitter with more videos.
- Giveaways were a clear winner for Alcohol brands this year, so don’t be afraid to offer more contests across all channels next year.
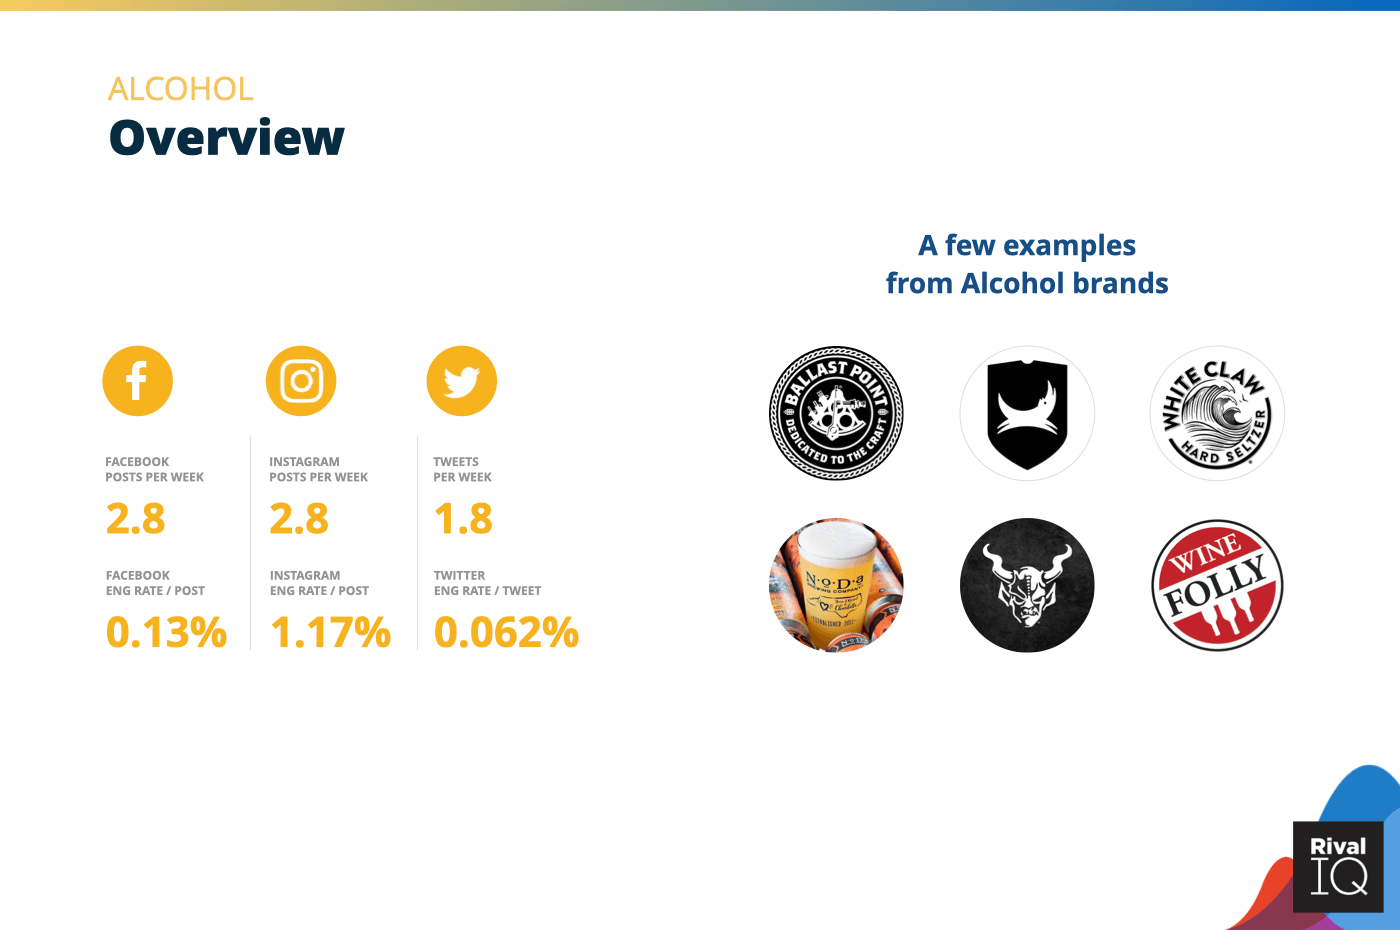
Overview of all benchmarks, Alcohol
Notable Alcohol brands in this year’s report include Ballast Point, BrewDog, White Claw, NoDa Brewing, Stone Brewing, and Wine Folly.
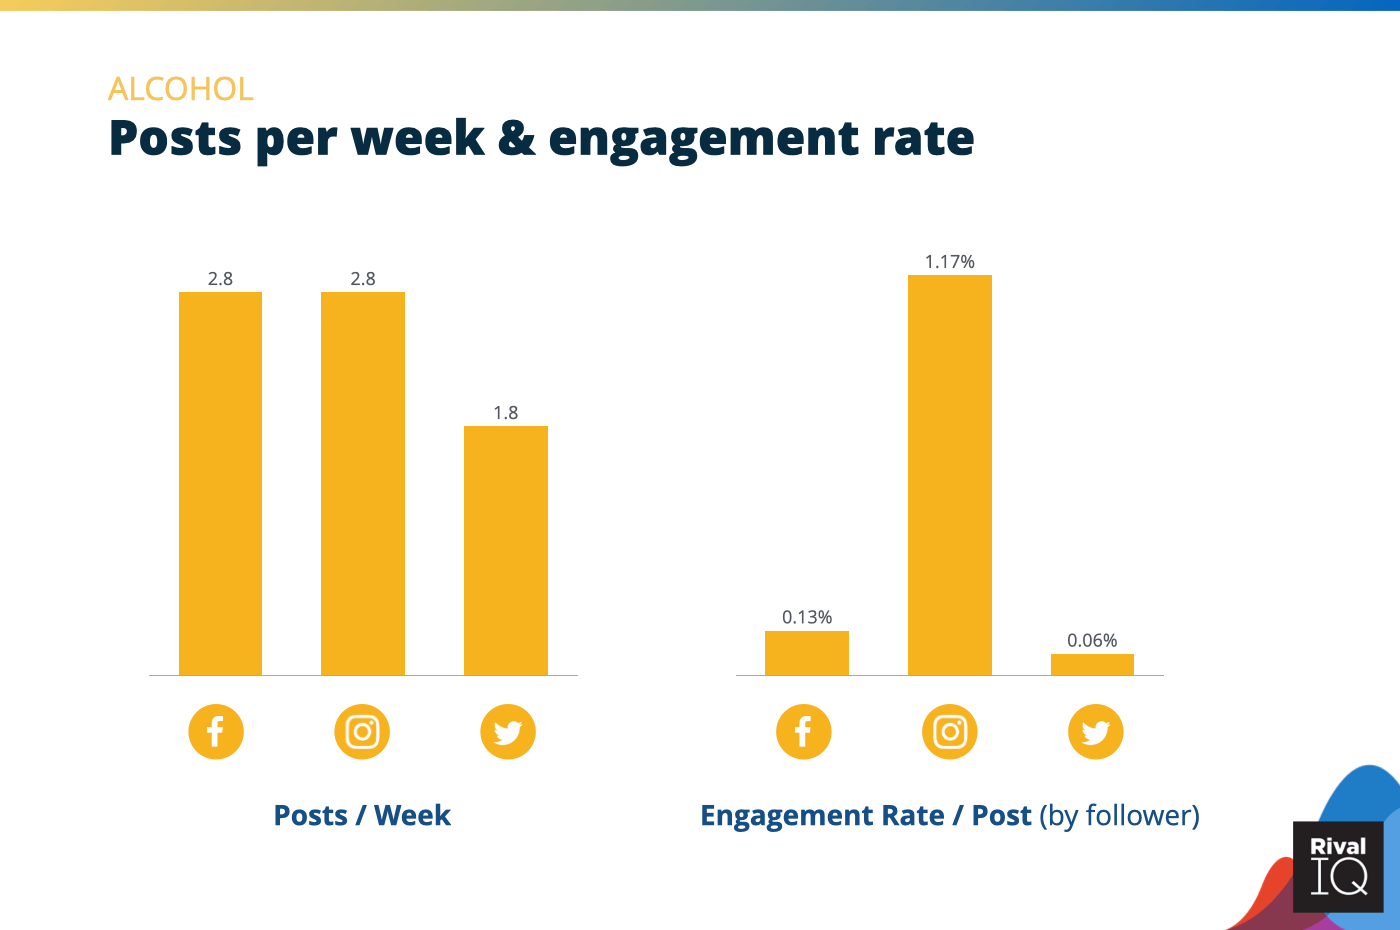
Posts per week and engagement rate per post across all channels, Alcohol
As with all our industries, Alcohol brands saw the most success on Instagram but still posted pretty consistently across all three channels. With 10x the engagement on Insta compared to Facebook, consider focusing efforts there.
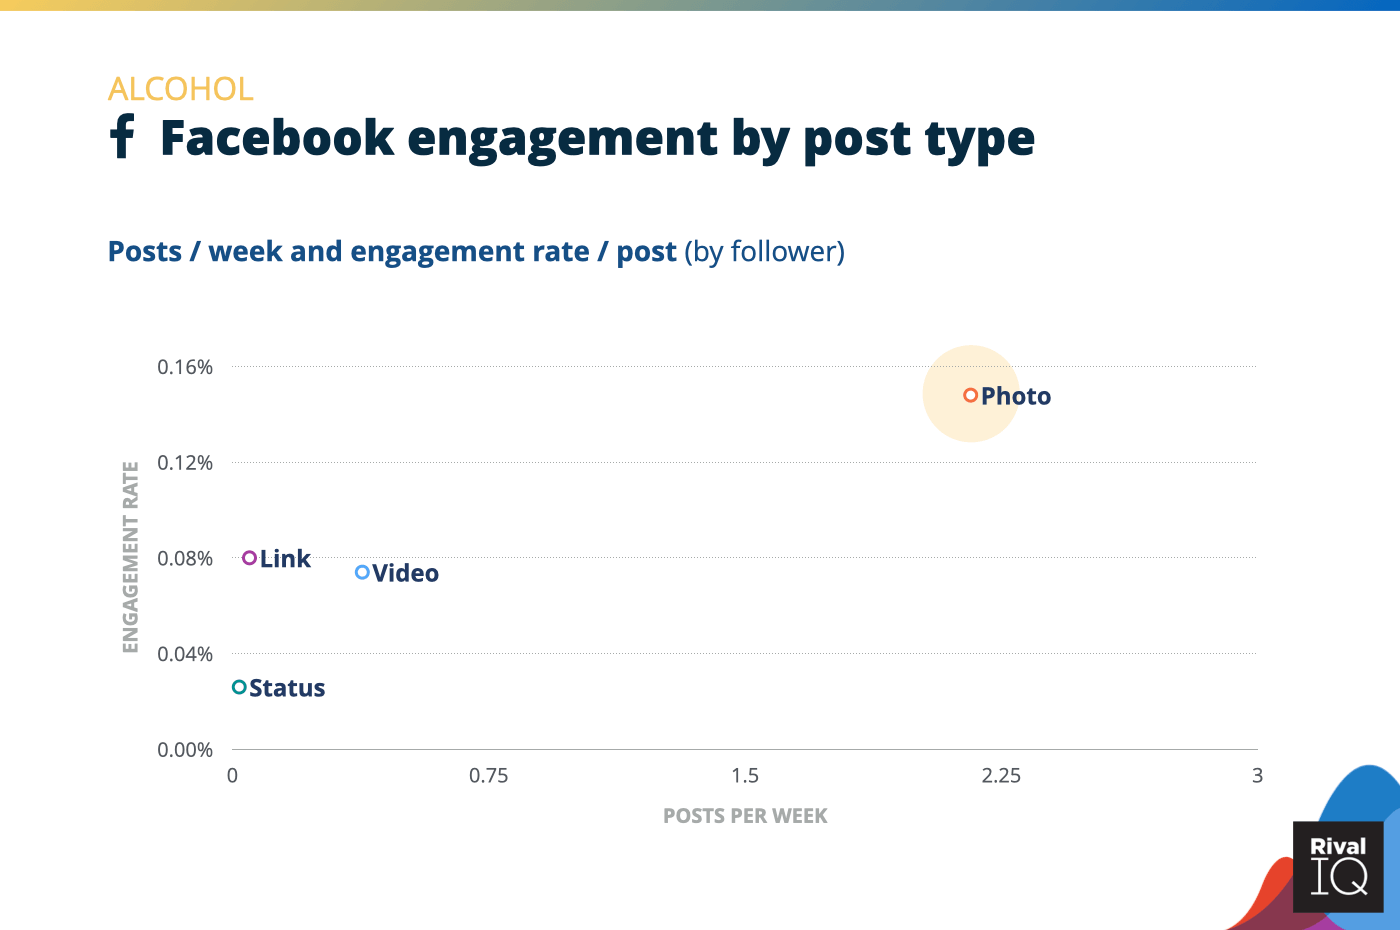
Facebook posts per week and engagement rate by post type, Alcohol
Alcohol brands made the most of photos on Facebook, which perform twice as well as the next leading post type.
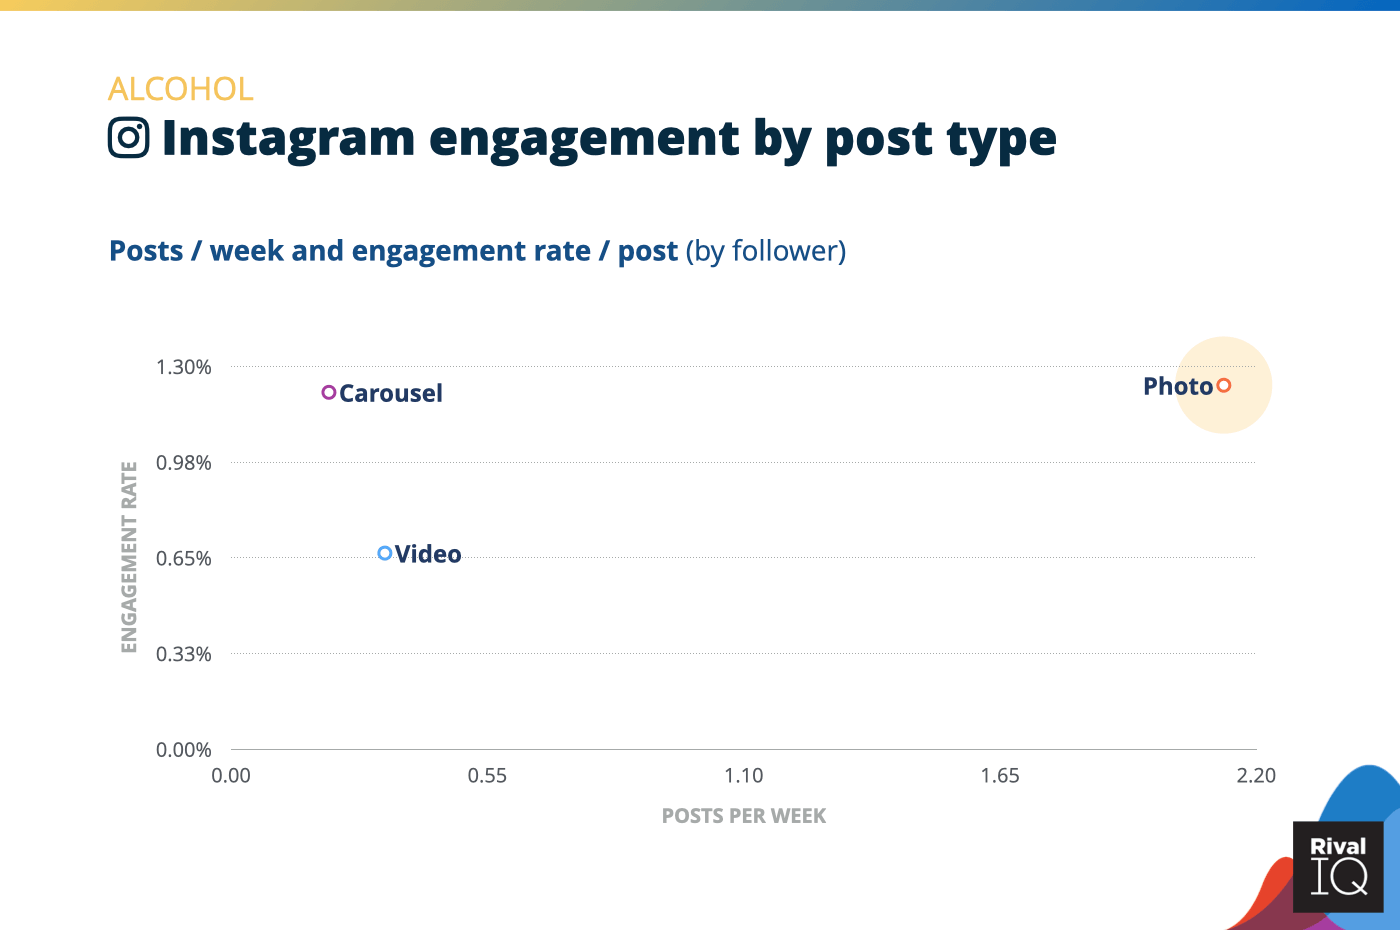
Instagram posts per week and engagement rate by post type, Alcohol
Alcohol brands saw identical engagement rates for photos and carousels on Instagram but were 6x as likely to post photos. Consider combining a few of those single-photo posts into high-performing carousels.
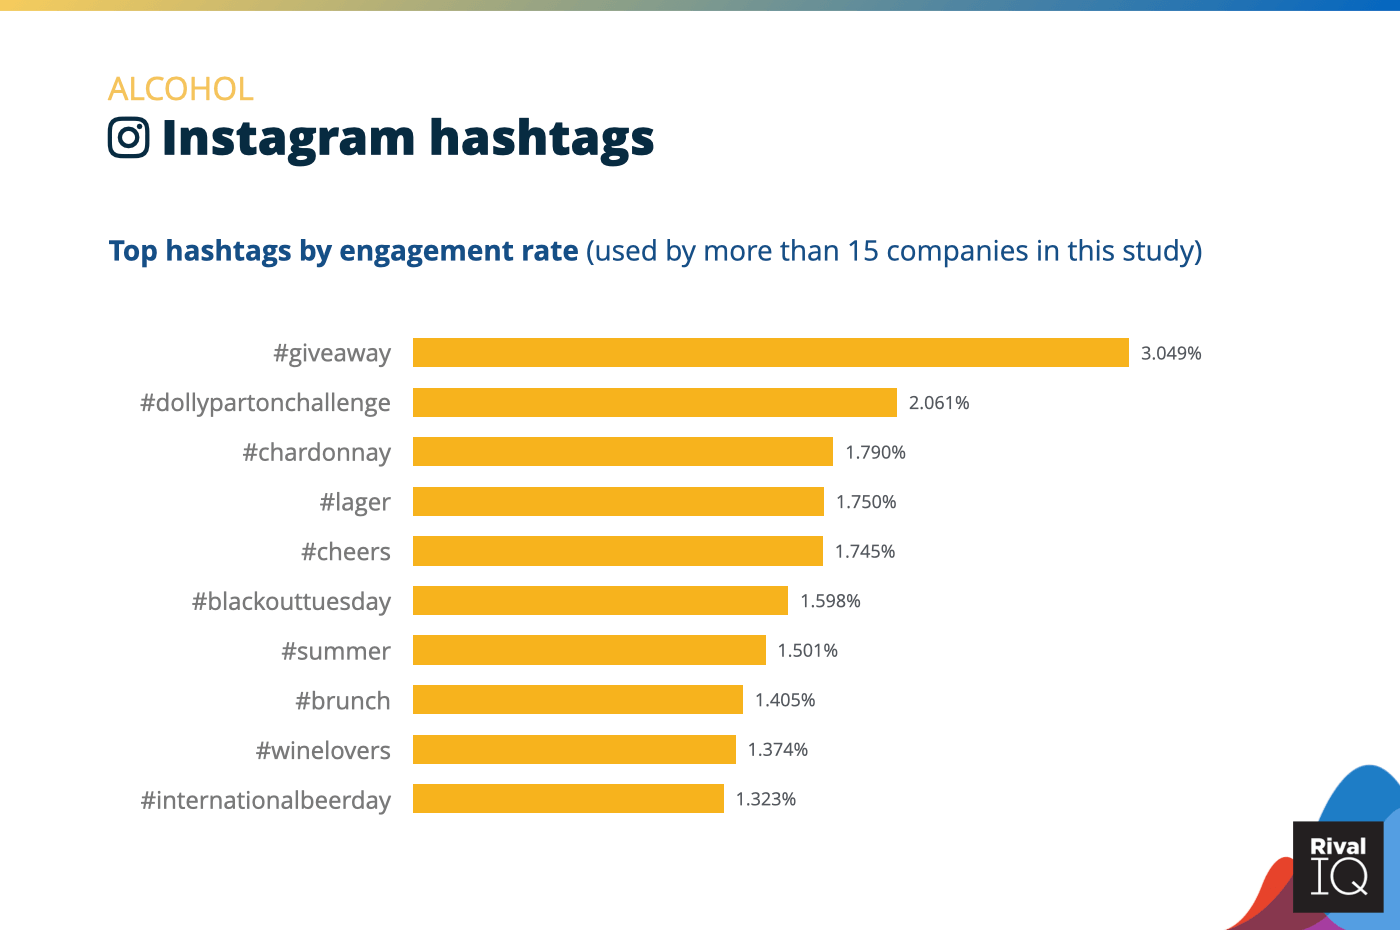
Top Instagram hashtags by engagement rate, Alcohol
No surprise here that posts featuring a #giveaway hashtag performed 50% better than the next best hashtag.

Twitter posts per week and engagement rate by tweet type, Alcohol
Video topped the Twitter engagement charts this year for Alcohol brands, but these brands were 4x as likely to tweet a photo instead of a top-performing video.
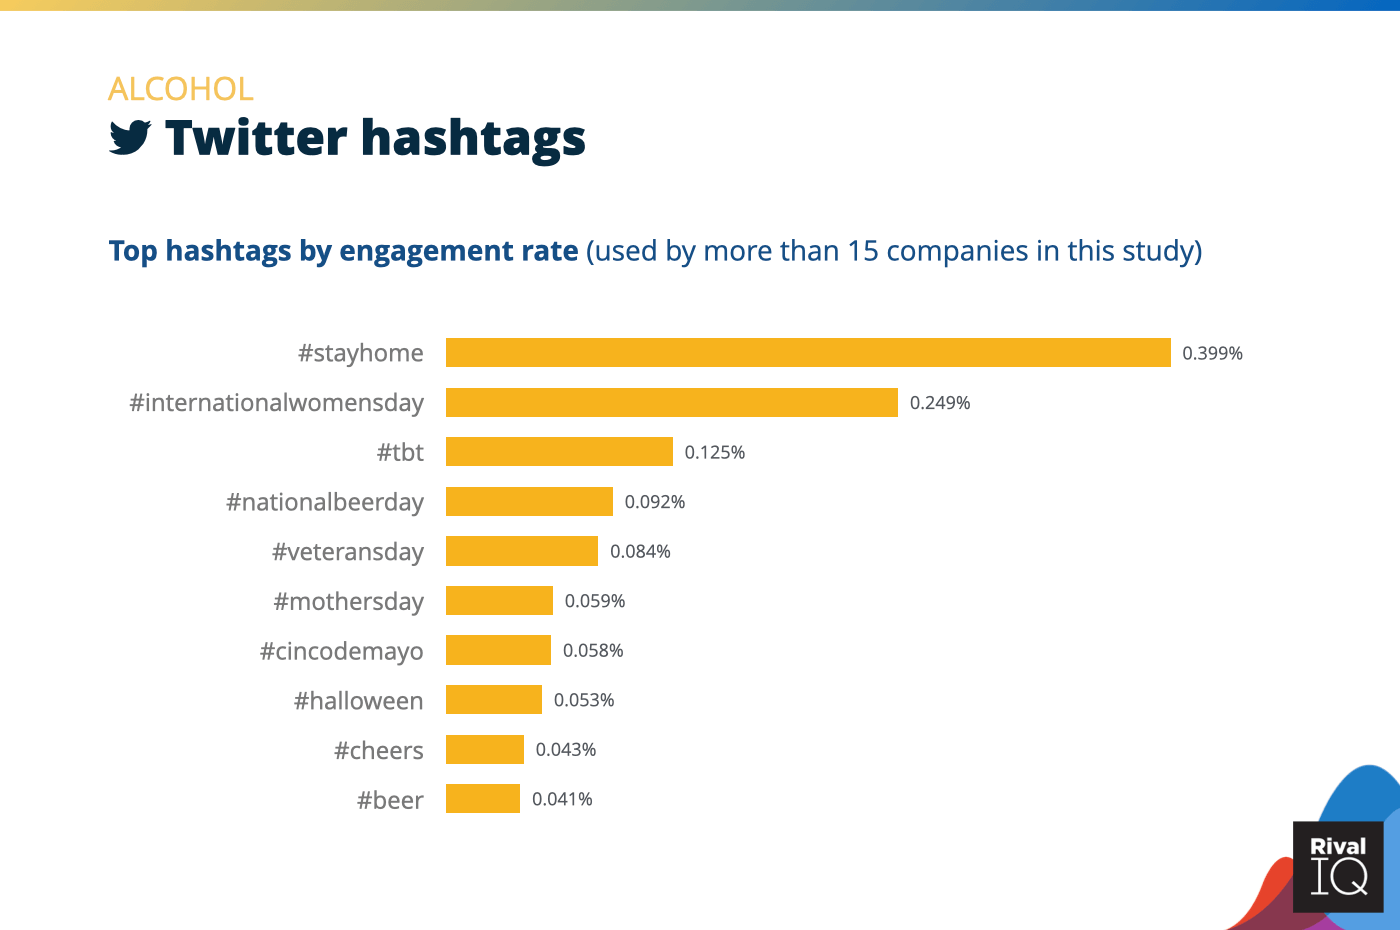
Top Twitter hashtags by engagement rate, Alcohol
When not reminding their followers to #stayhome, Alcohol brands were all about the holiday hashtags on Twitter this year.
Fashion Social Media Benchmarks
Fashion brands came in well below median engagement on Facebook, Instagram, and Twitter despite regular posting.
Some suggestions for Fashion brands:
- Carousels are key to any brand’s Insta success: they outperform photos and videos because Instagram often re-serves them to folks who didn’t engage with the post the first time around.
- Shoot for more hashtag research and experimentation on Twitter.
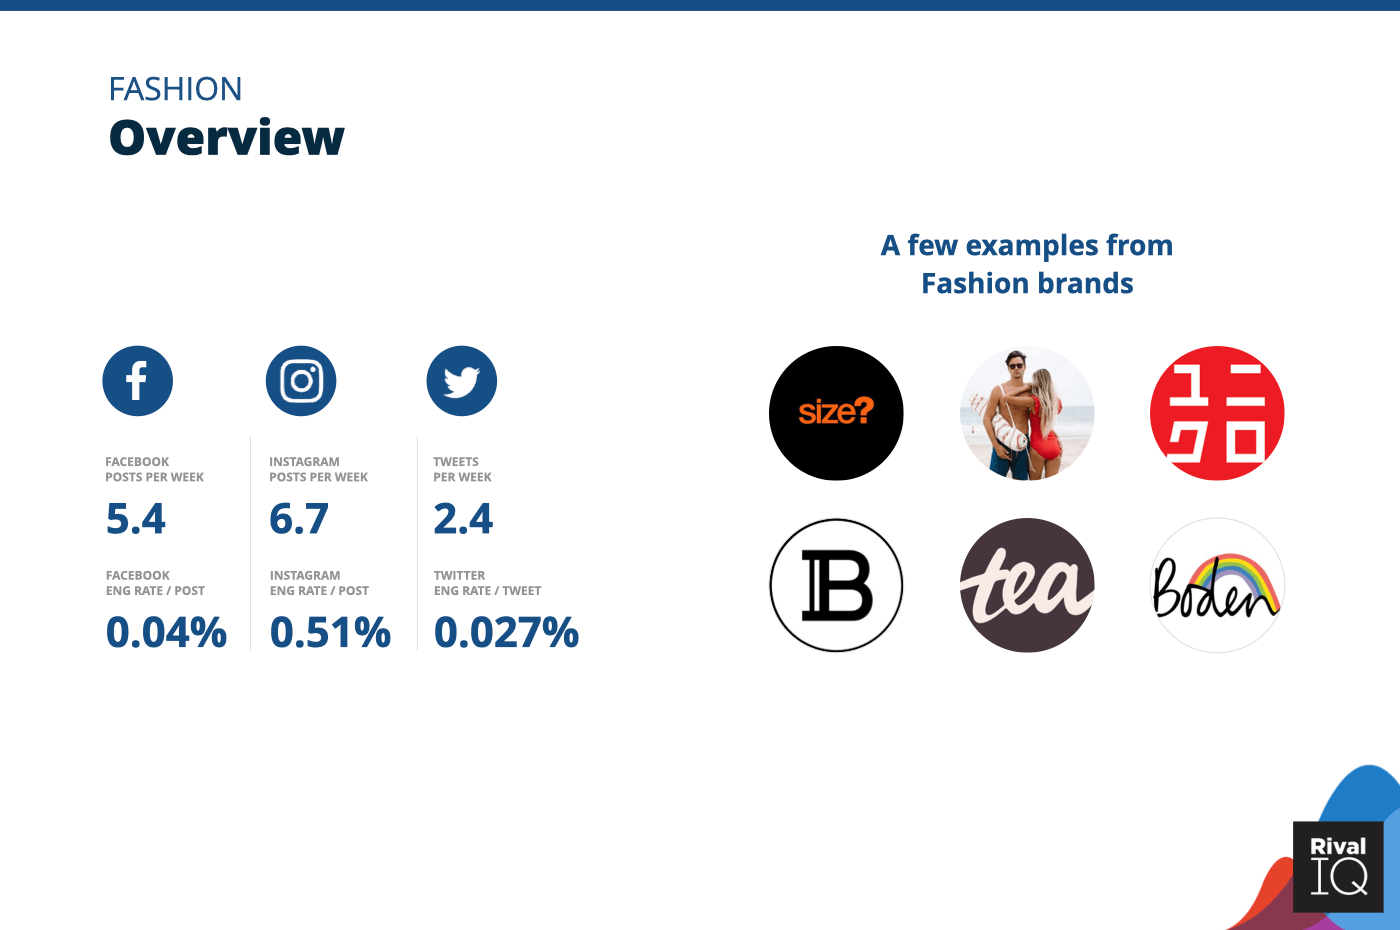
Overview of all benchmarks, Fashion
Notable Fashion brands include Size?, Albion Fitness, Uniqlo, Balmain, Tea Collection, and Boden.
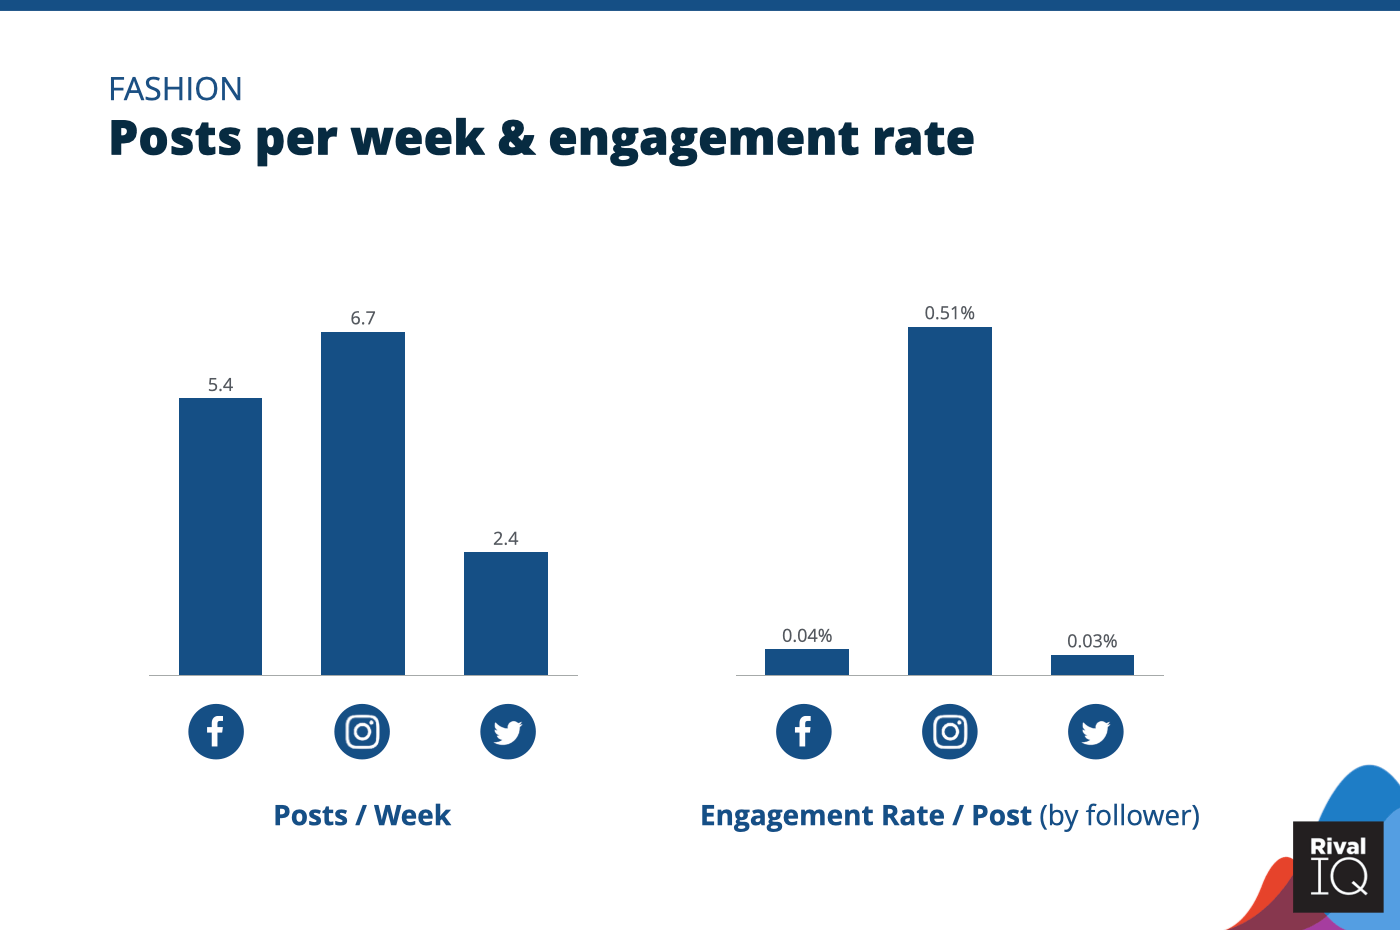
Posts per week and engagement rate per post across all channels, Fashion
Fashion brands saw low engagement rates on both Facebook and Twitter, but were twice as likely to post on Facebook.
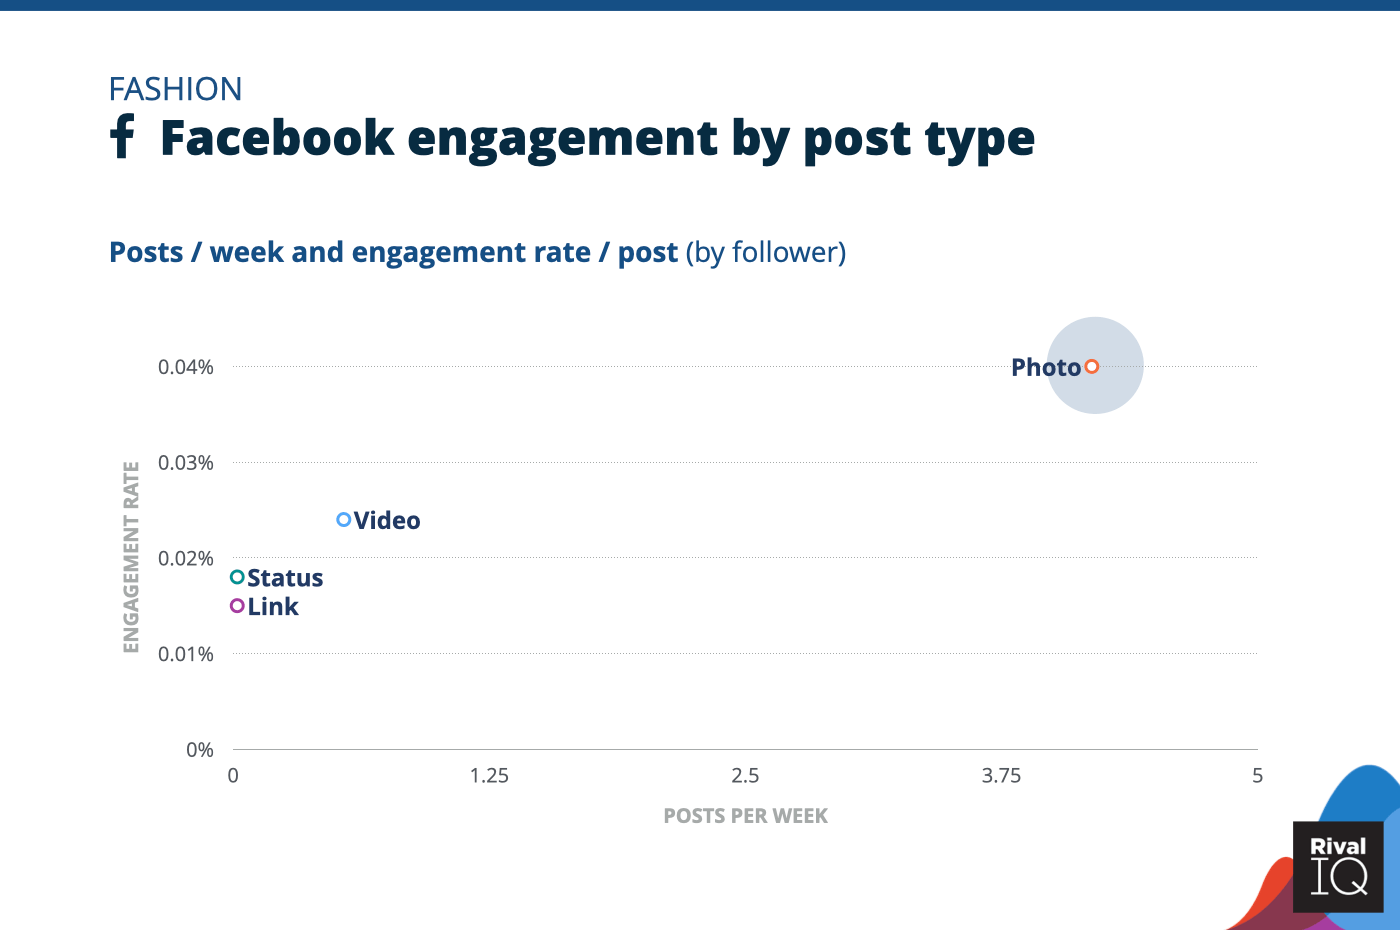
Facebook posts per week and engagement rate by post type, Fashion
Fashion brands are focusing their efforts on photos on Facebook, which is the way to go with 50% more engagement than any other post type.
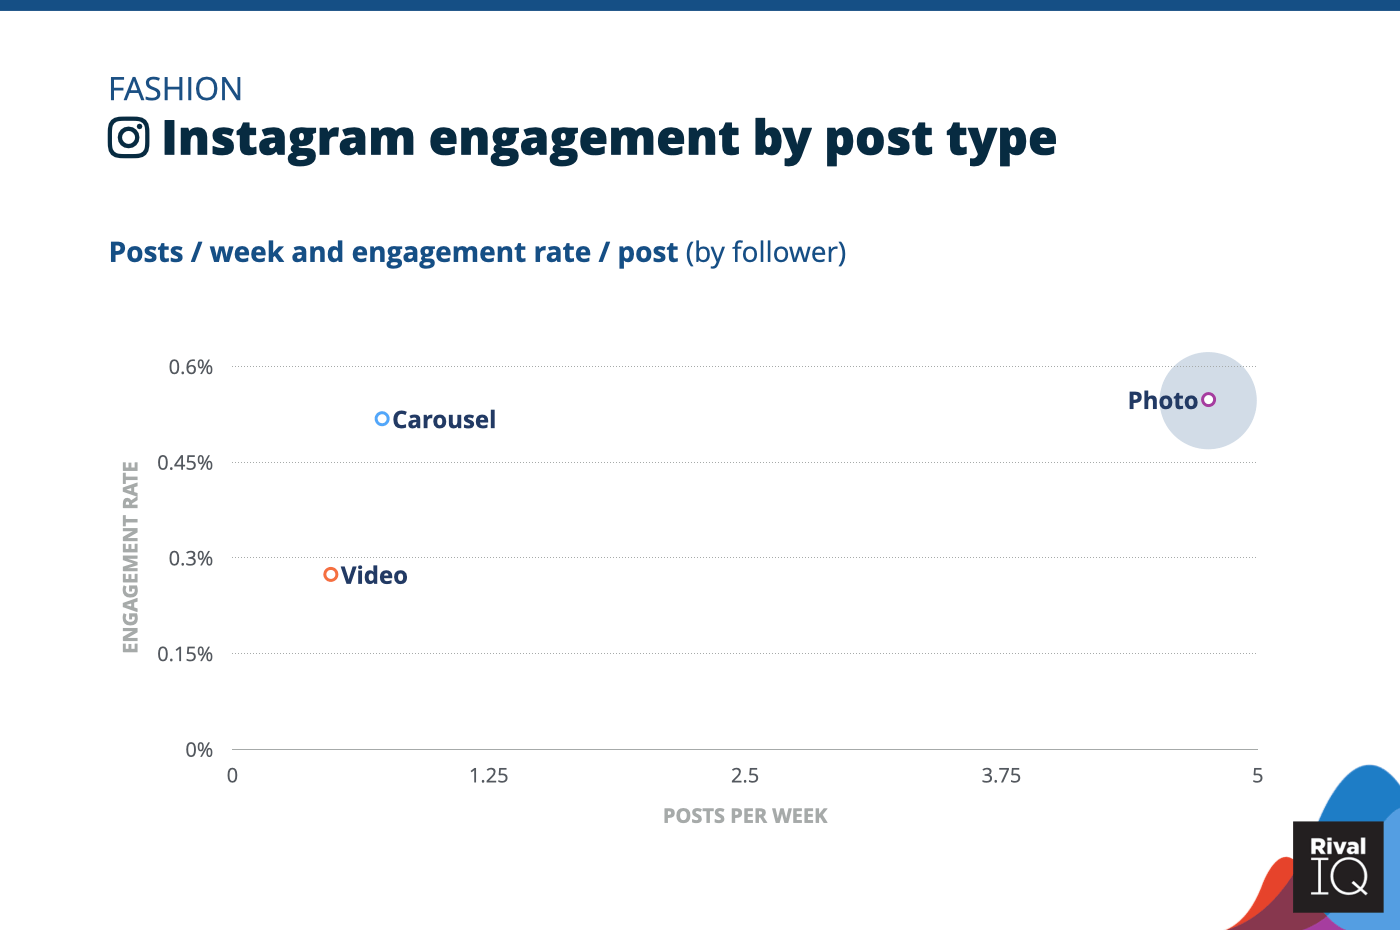
Instagram posts per week and engagement rate by post type, Fashion
Fashion brands saw nearly identical engagement rates for photos and carousels on Instagram this year, but were 4x as likely to post a photo. Try combining photos into carousels by theme to supercharge engagement rates.
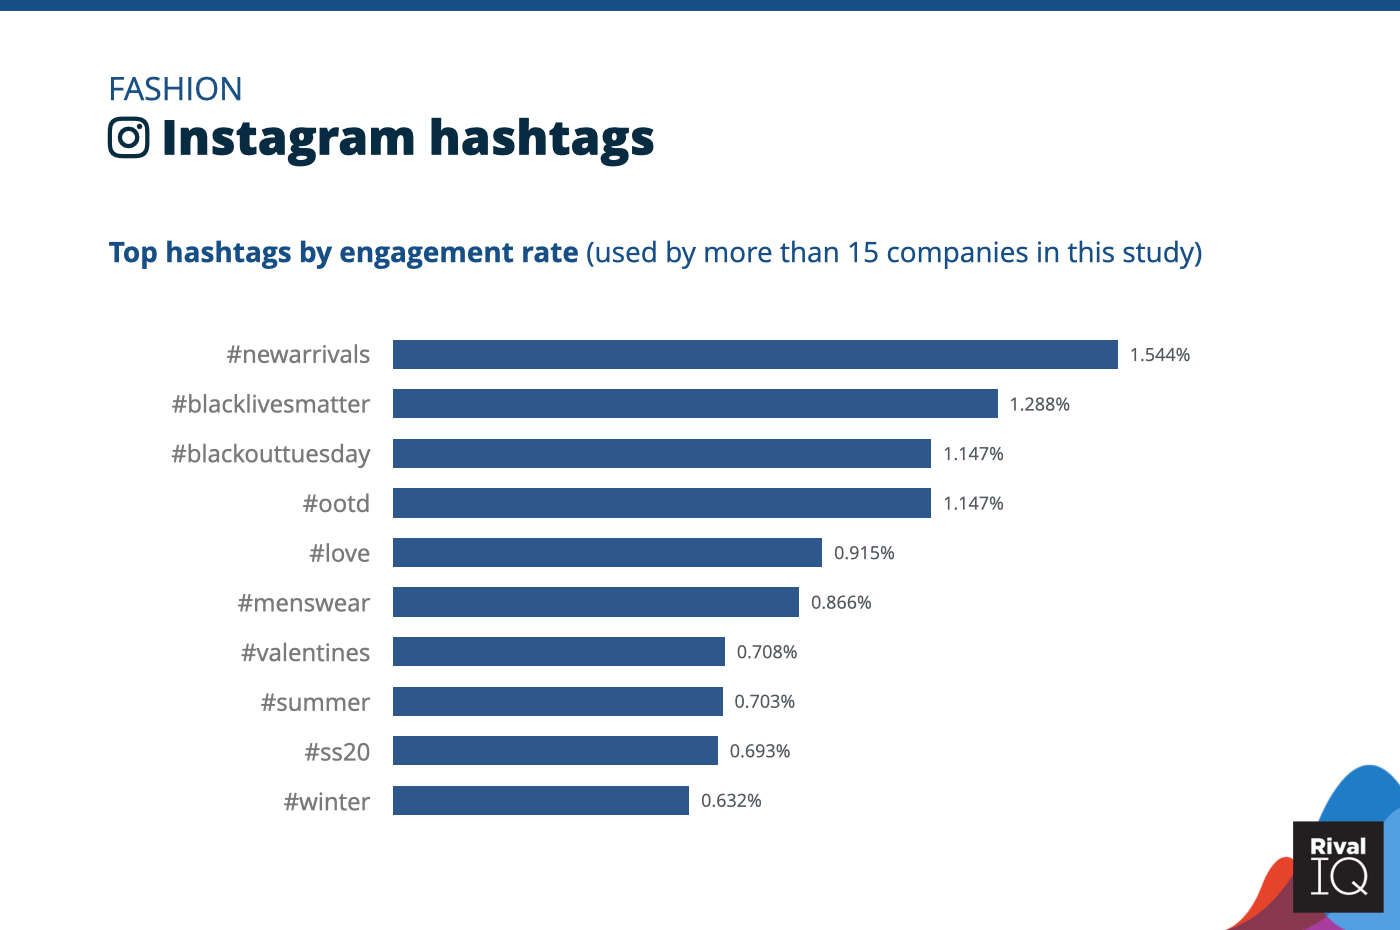
Top Instagram hashtags by engagement rate, Fashion
Like many other brands, Fashion was all about the holiday and seasonal hashtags on Twitter this year.
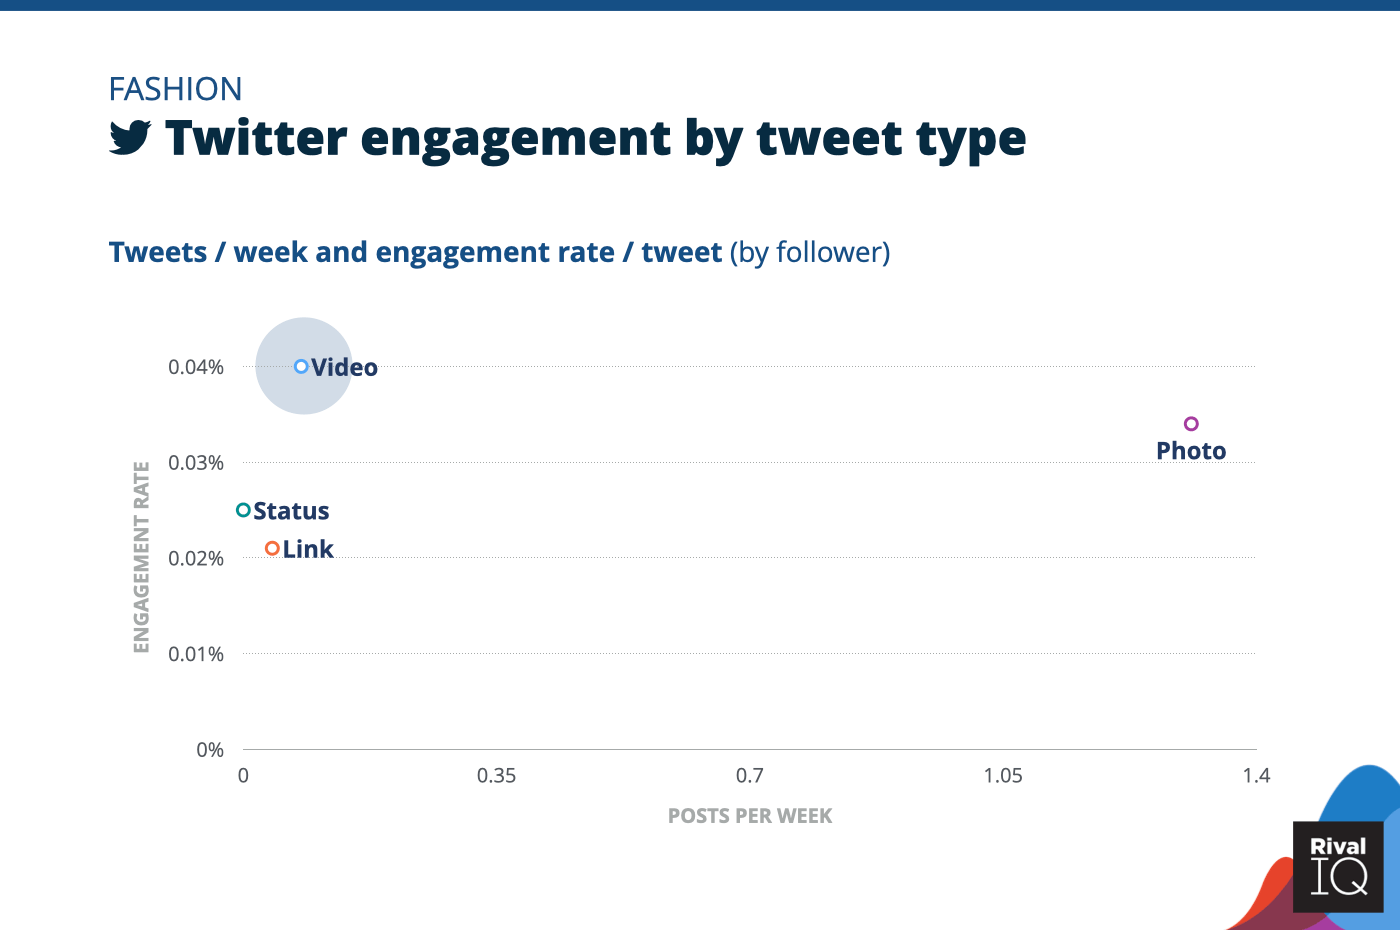
Twitter posts per week and engagement rate by tweet type, Fashion
Video was a top performer for Fashion brands on Twitter, but these brands were 16x more likely to tweet a photo.
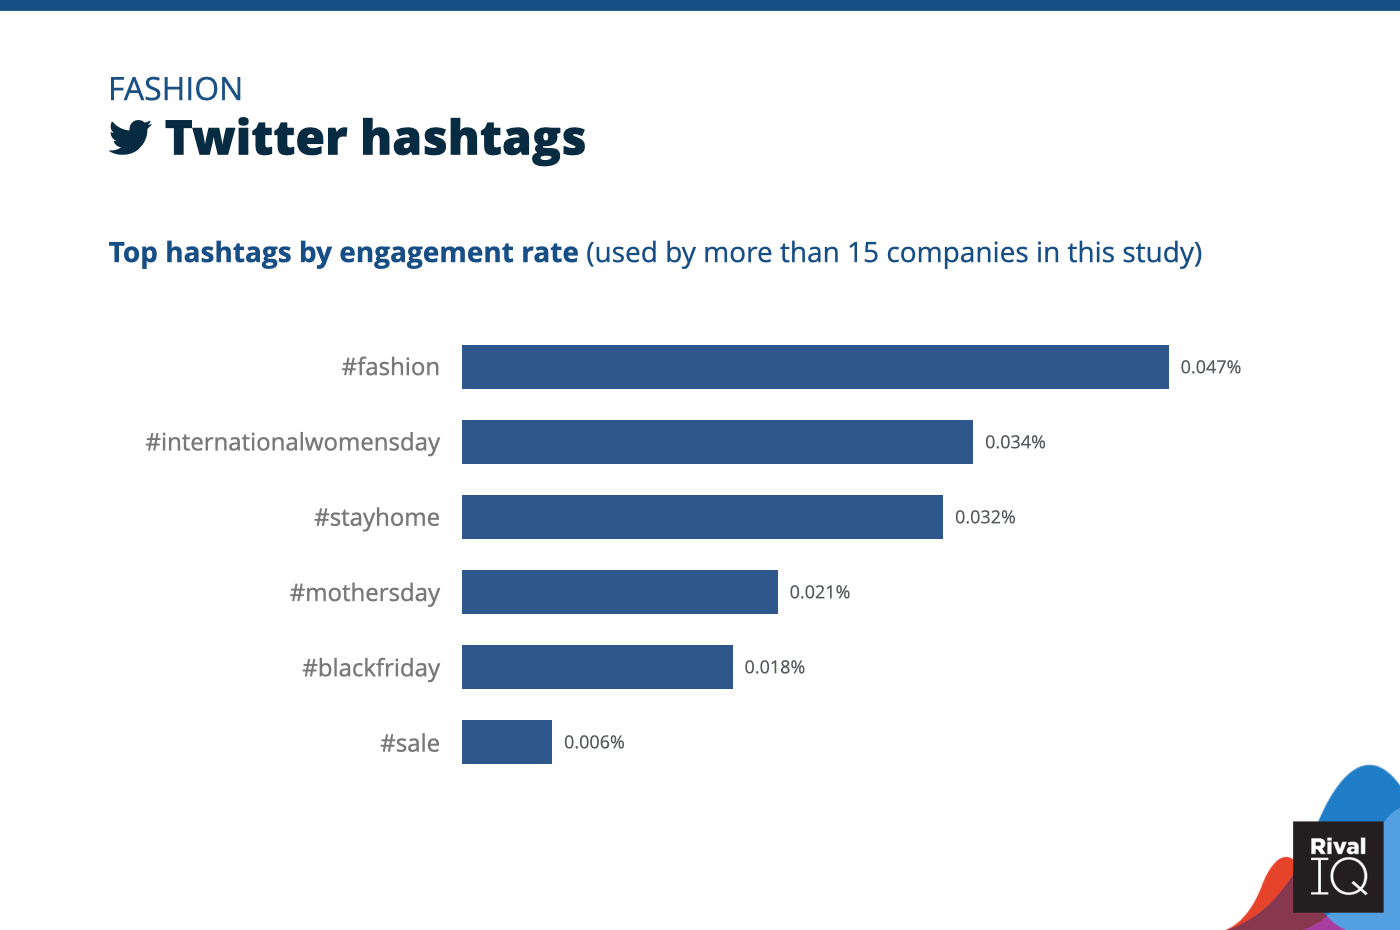
Top Twitter hashtags by engagement rate, Fashion
Fashion brands topped last year’s Twitter charts with contests and giveaways, but abandoned that strategy in 2020.
Financial Services Social Media Benchmarks
Financial Services were just under median performance on Facebook and Instagram but pulled ahead on Twitter.
A few ideas for Financial Services brands:
- Financial Services are posting lots of photos on all channels, but try bulking up this post type on Instagram to dial in performance there.
- Hashtags were all about the holidays on Instagram and Twitter this year, so keep up with content that aligns with the seasons.
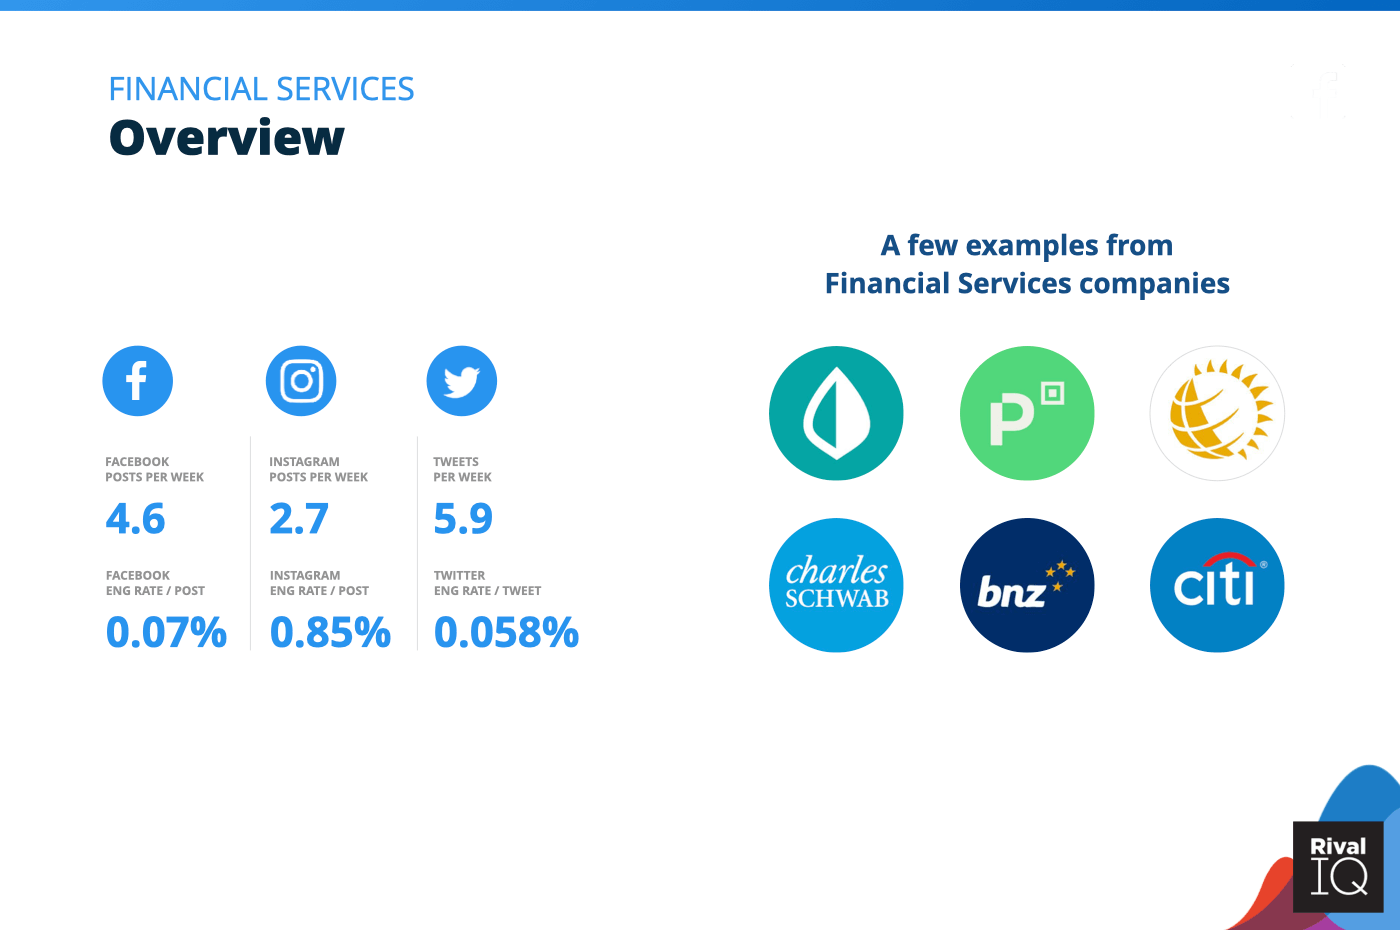
Overview of all benchmarks, Financial Services
Notable Financial Services companies include Mint, Picpay, Schwab, SunLife Phillippines, BNZ, and Citibank.
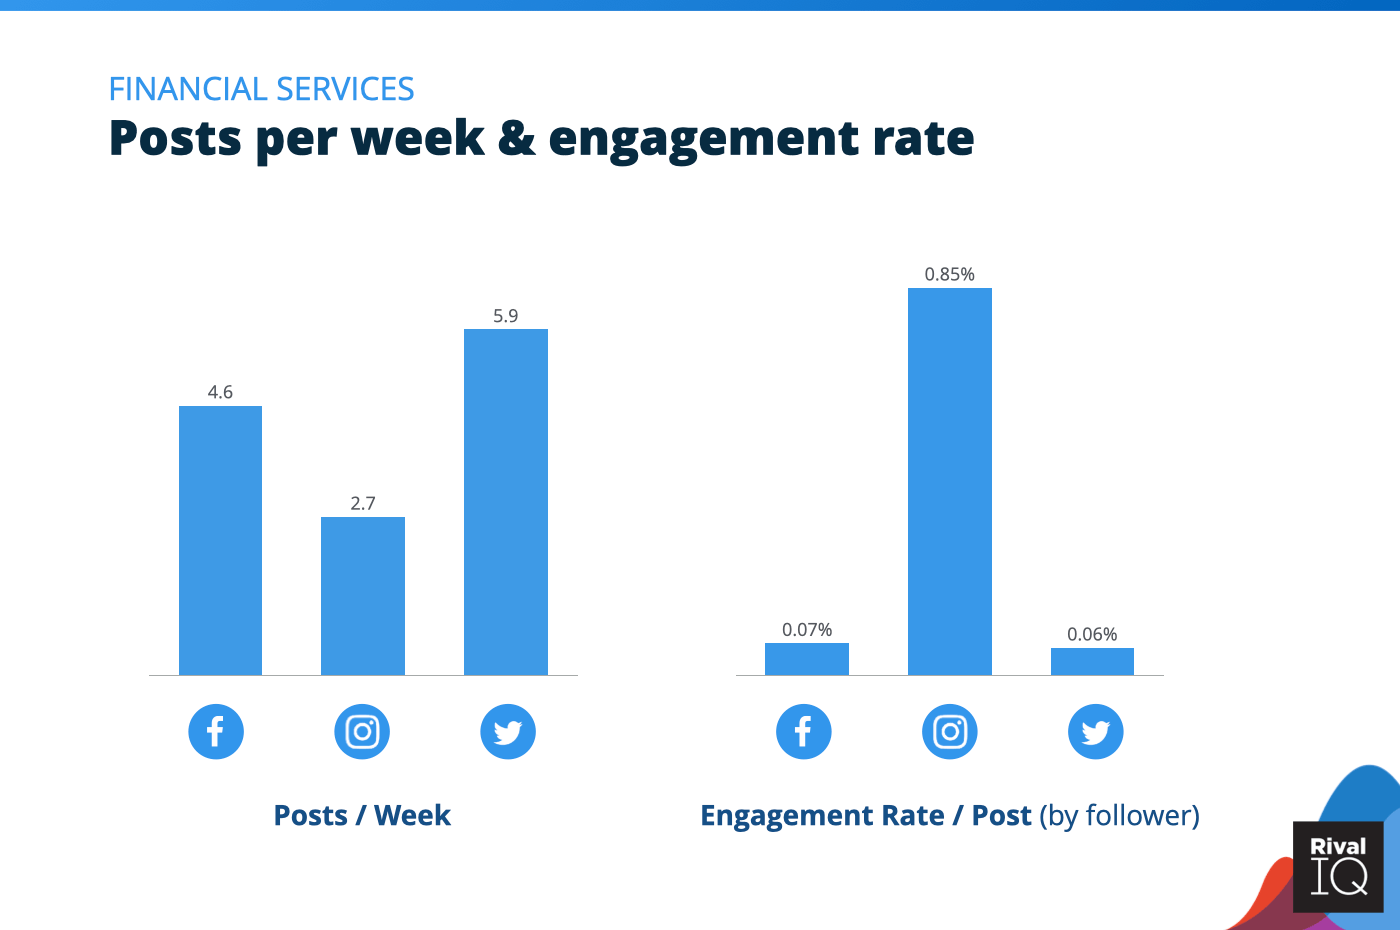
Posts per week and engagement rate per post across all channels, Financial Services
Financial Services sees engagement rates slightly above the median on Twitter, which helps explain heavy emphasis on tweet counts each week.
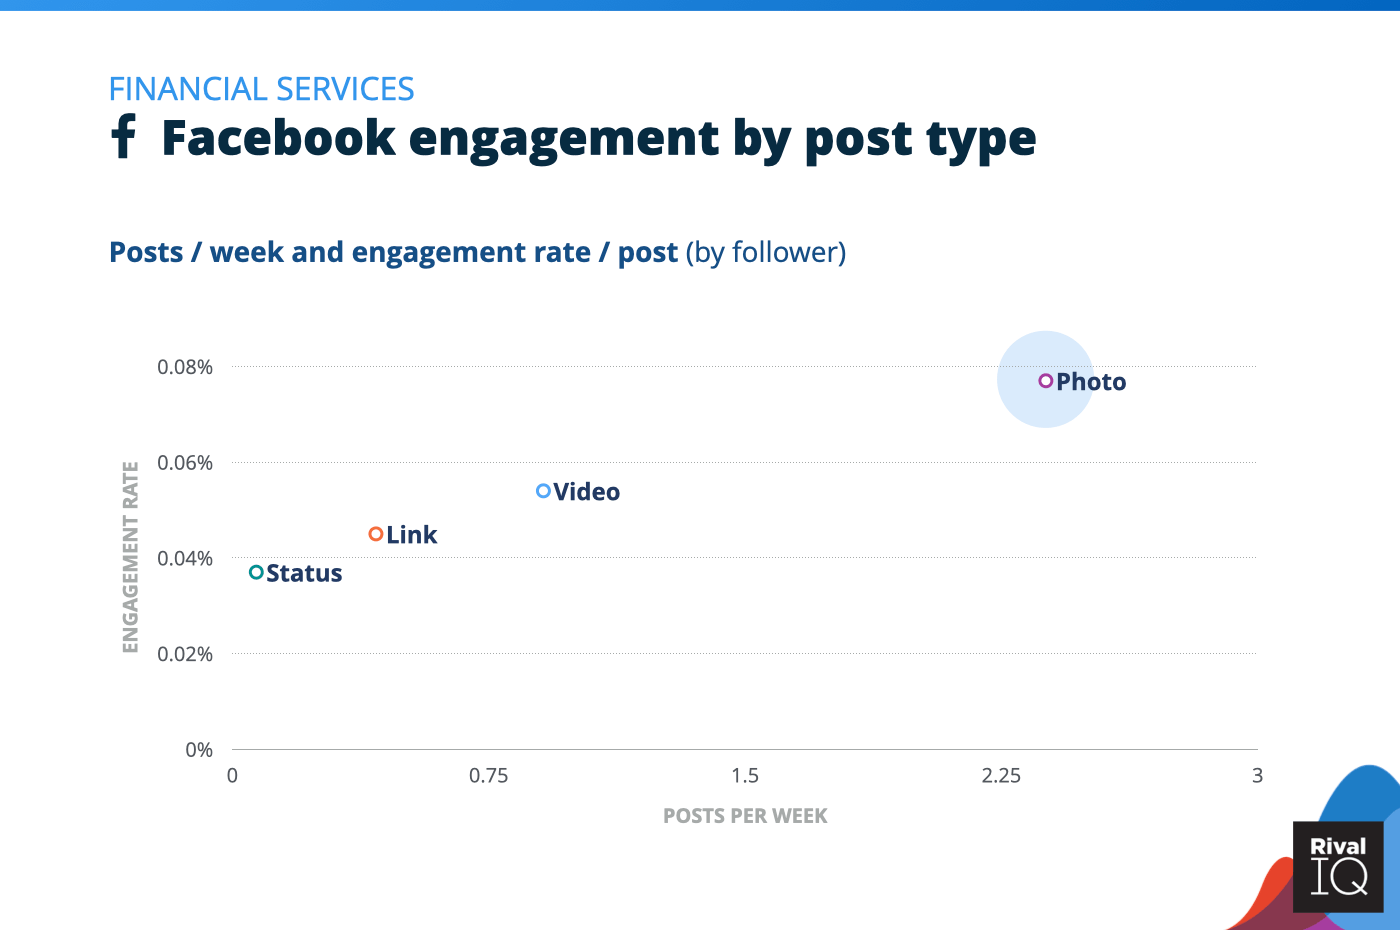
Facebook posts per week and engagement rate by post type, Financial Services
Financial Services brands are using Facebook strategically by focusing on high-performance photo posts and putting less emphasis on post types with lower engagement, like links and statuses.
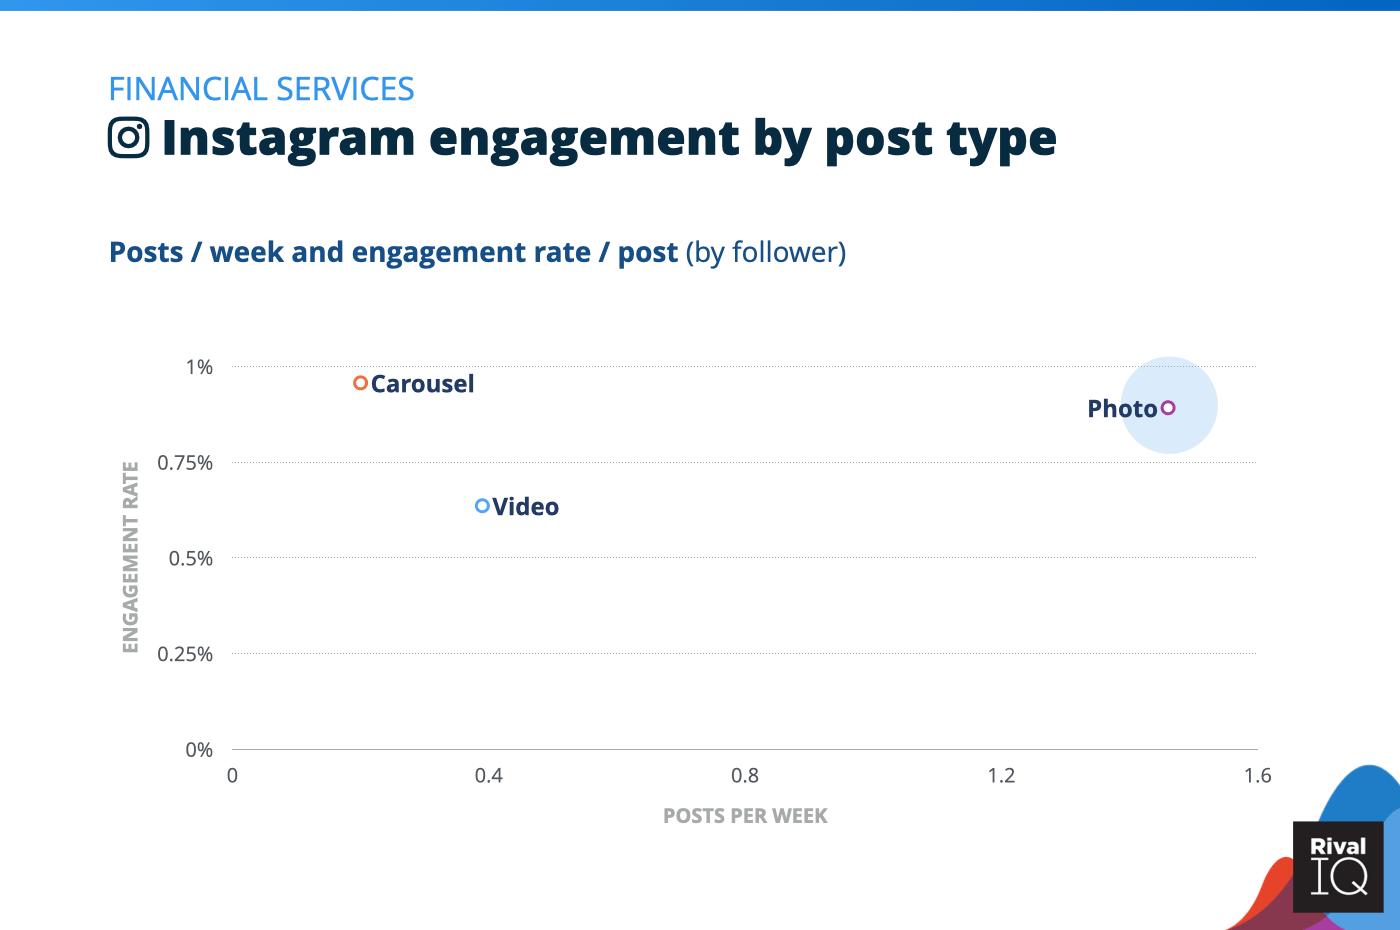
Instagram posts per week and engagement rate by post type, Financial Services
Financial Services saw the highest engagement rates on Instagram with carousels of any post type, but posted them least frequently of any post type.
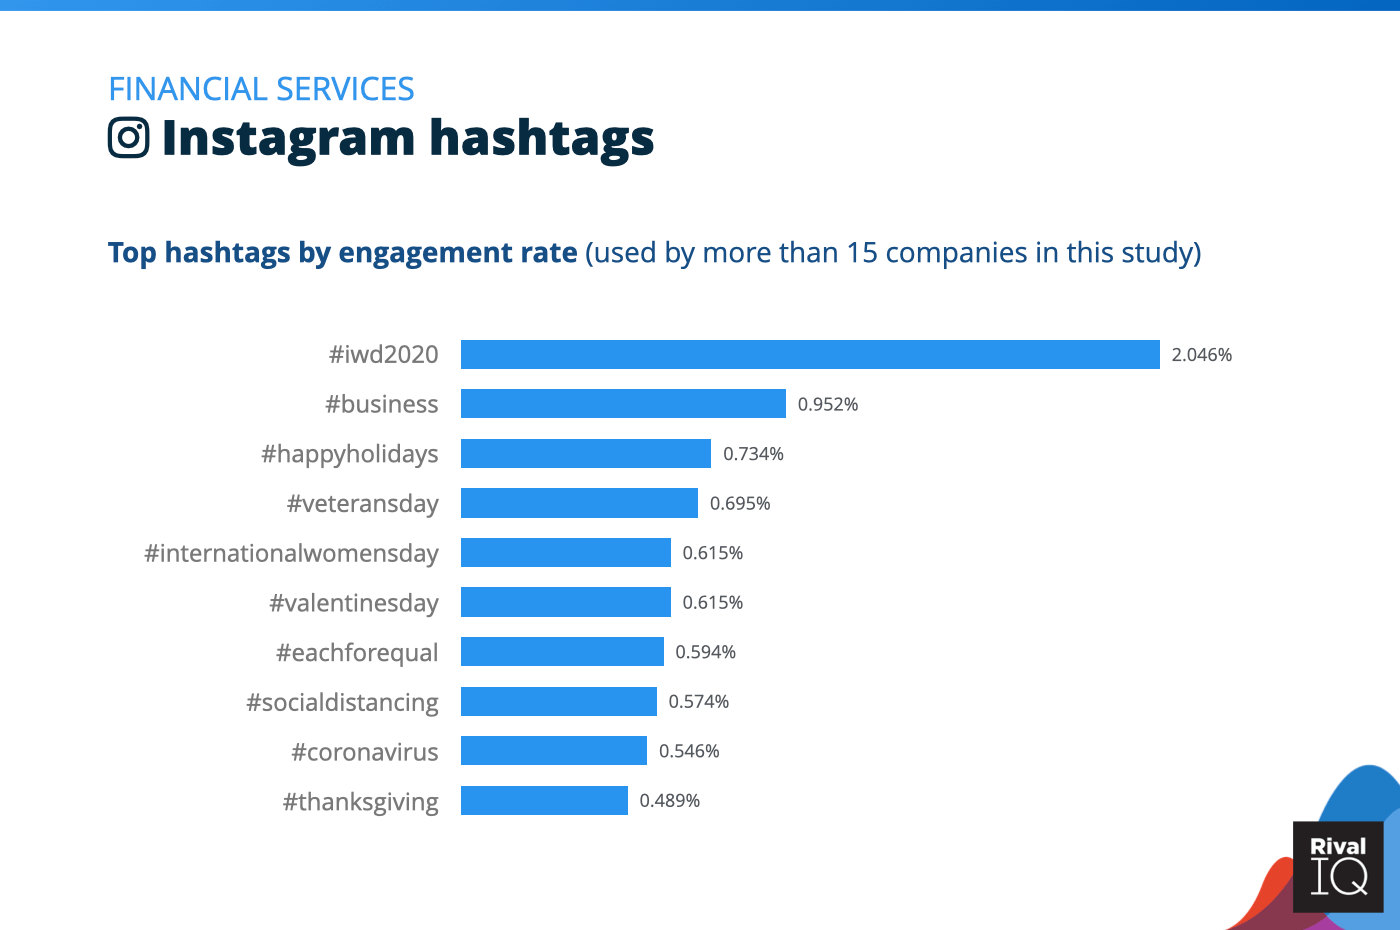
Top Instagram hashtags by engagement rate, Financial Services
The hashtag for International Women’s Day 2020 blew other Instagram hashtags out of the water for Financial Services brands.
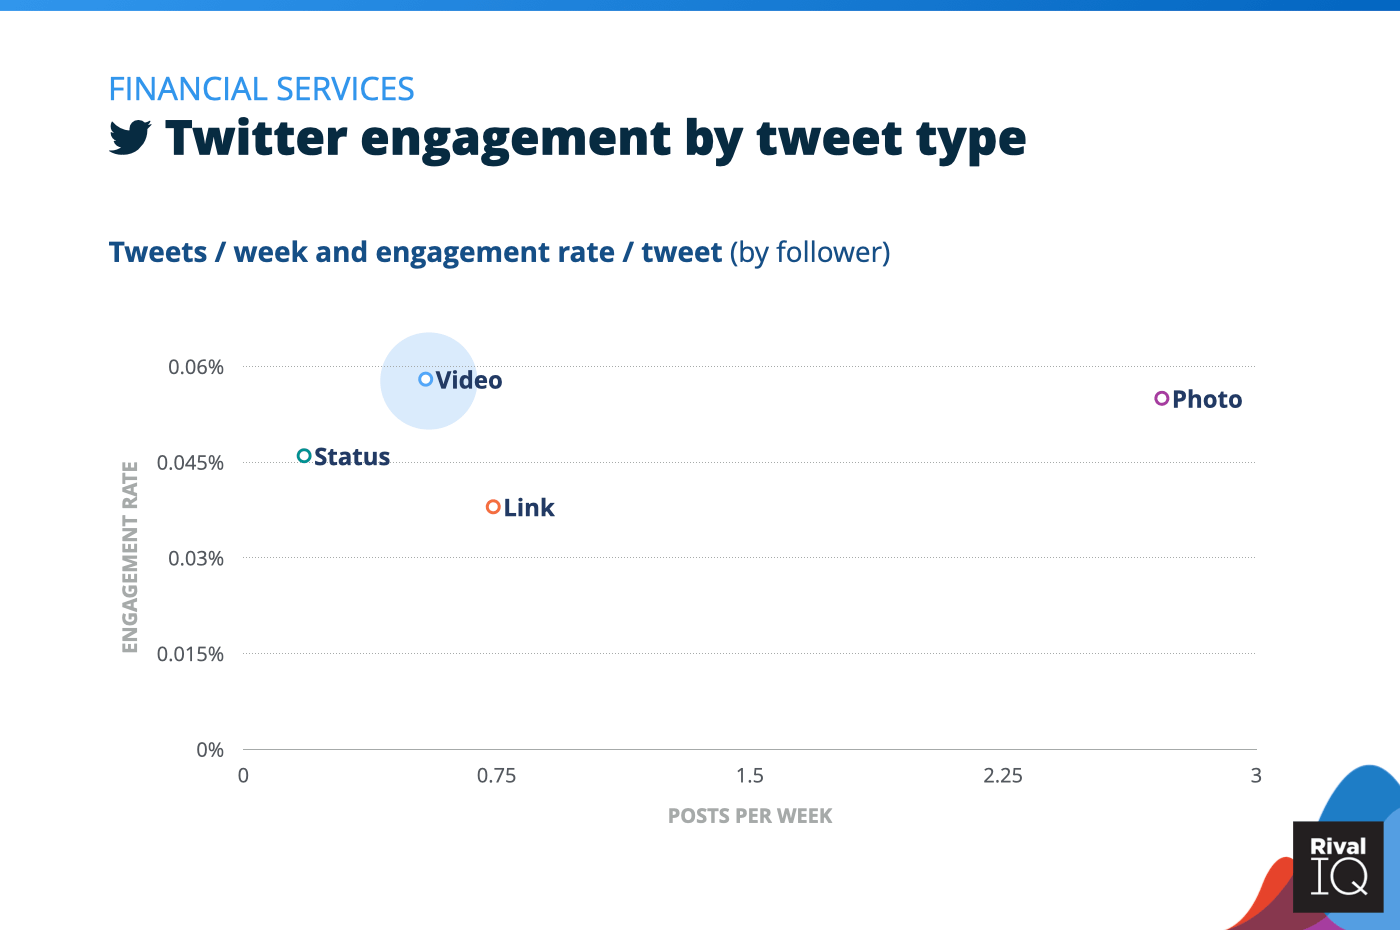
Twitter posts per week and engagement rate by tweet type, Financial Services
Financial Services were top performers on Twitter this year, but could widen that lead by focusing more on high engagement videos.
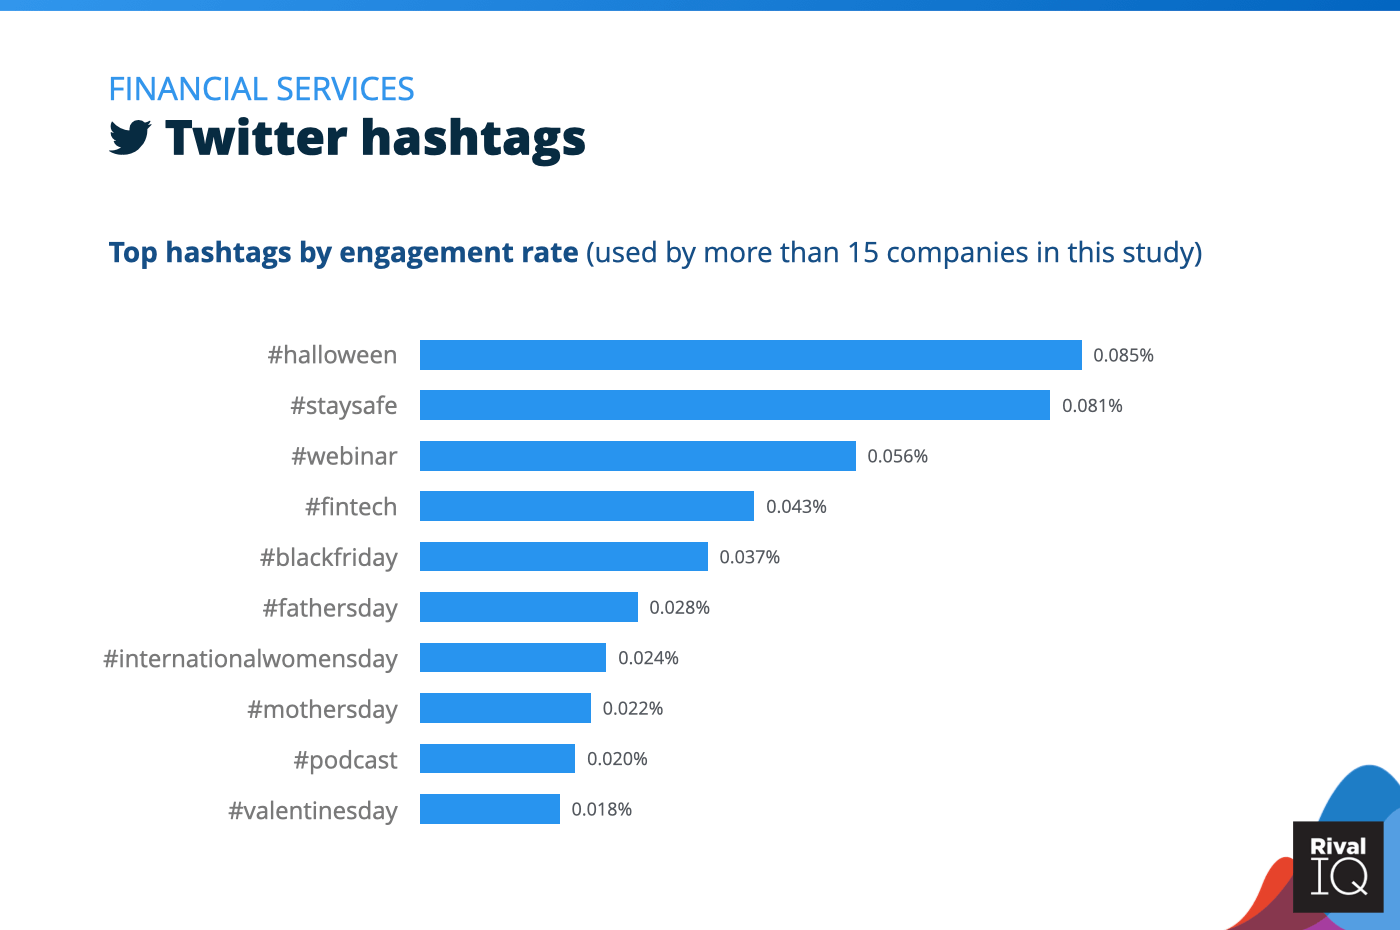
Top Twitter hashtags by engagement rate, Financial Services
Like on Instagram, holidays hashtags were a hit for Financial Services brands on Twitter.
Food & Beverage Social Media Benchmarks
Food & Beverage brands weren’t frequent posters on any channel, but managed to beat out many other industries on Twitter and Instagram while losing a little ground on Facebook.
Some ideas for improvement:
- Giveaways and holidays are the hashtag secret sauce for Food & Beverage brands.
- Food & Beverage followers favor more visual post types, so keep investing in photos and videos.
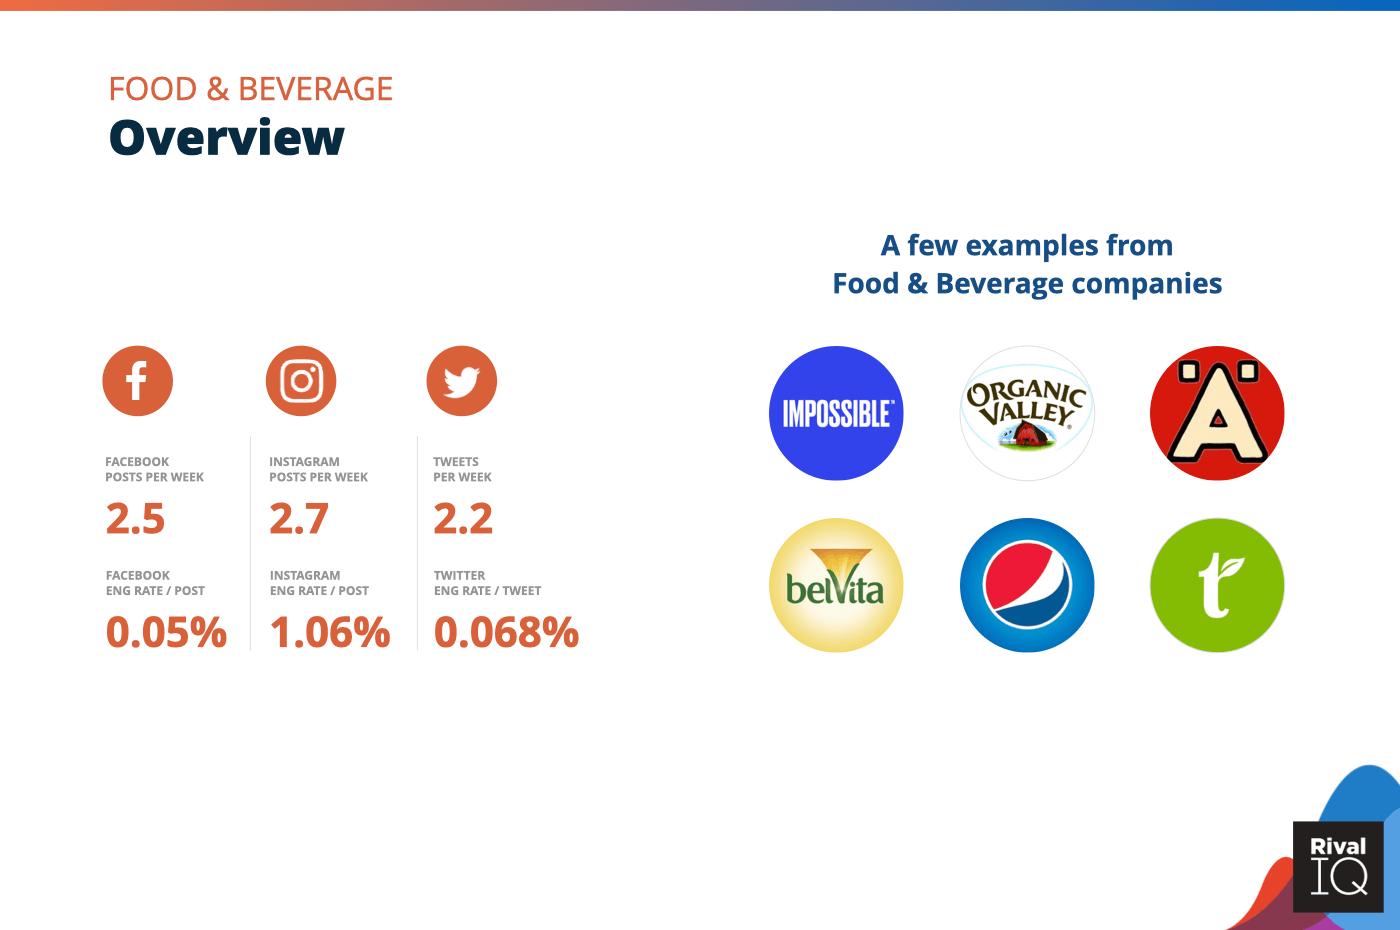
Overview of all benchmarks, Food & Beverage
Notable Food & Beverage companies include Impossible Foods, Organic Valley, Larabar, Belvita, Pepsi, and Honest Tea.
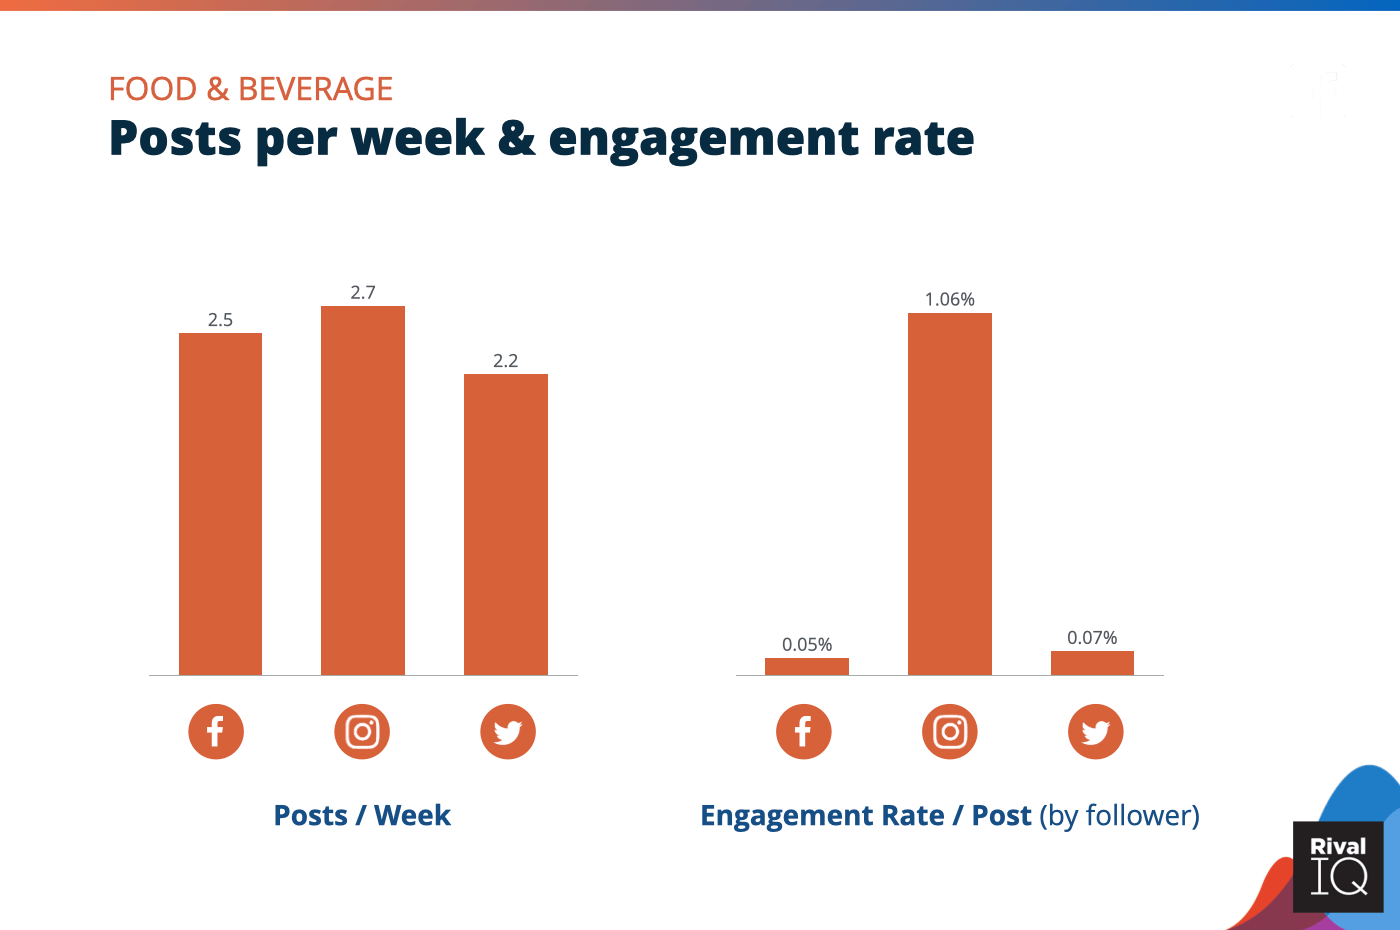
Posts per week and engagement rate per post across all channels, Food & Beverage
Food & Beverage brands saw above-median engagement rates on Twitter and Instagram but lagged a little on Facebook.
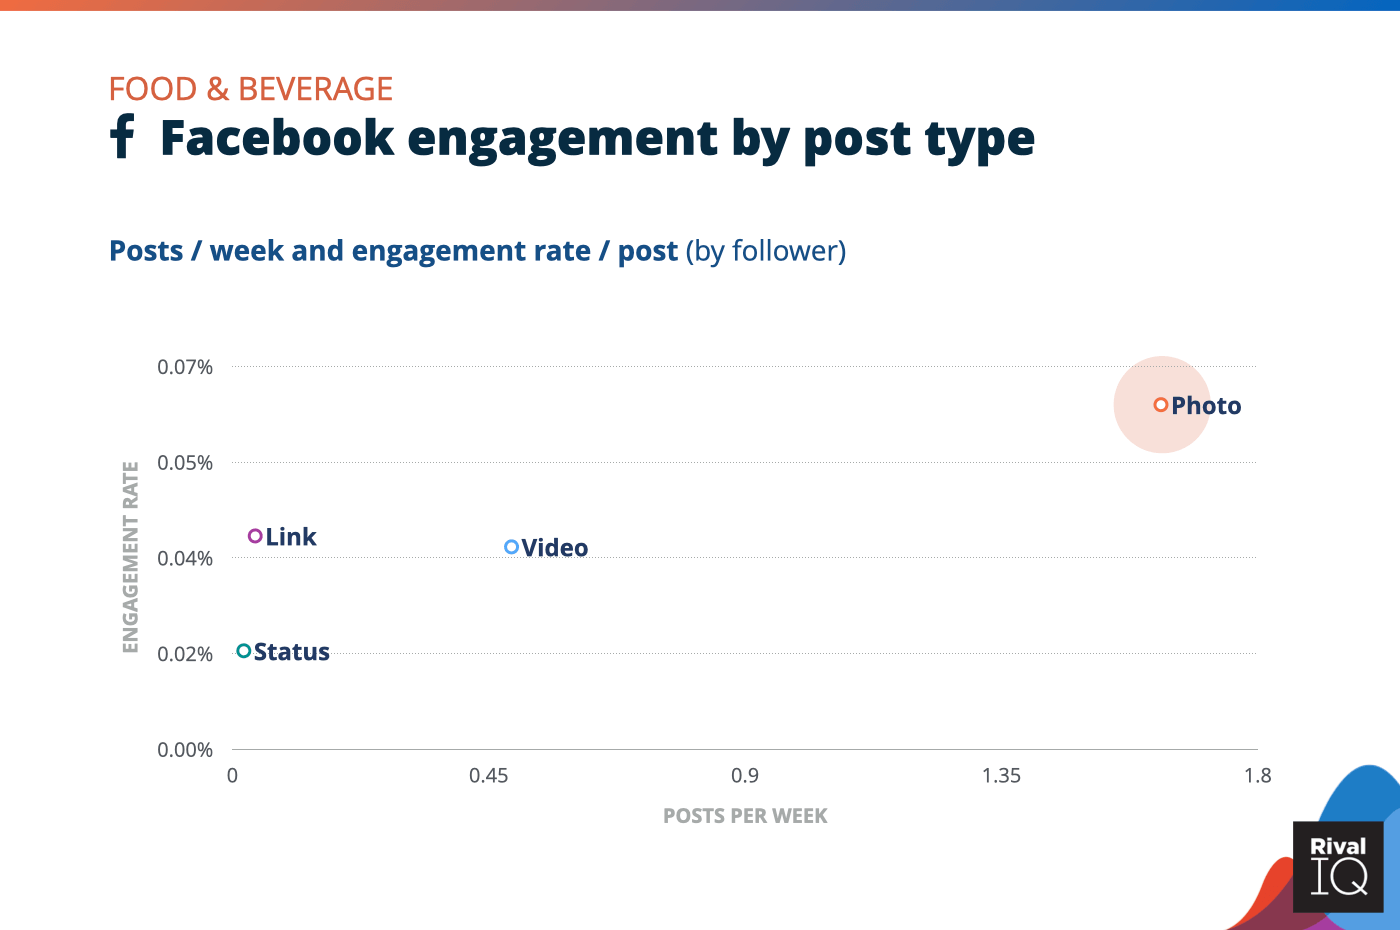
Facebook posts per week and engagement rate by post type, Food & Beverage
No surprise here that mouthwatering photos of tasty snacks and drinks won the day on Facebook for Food & Beverage brands.
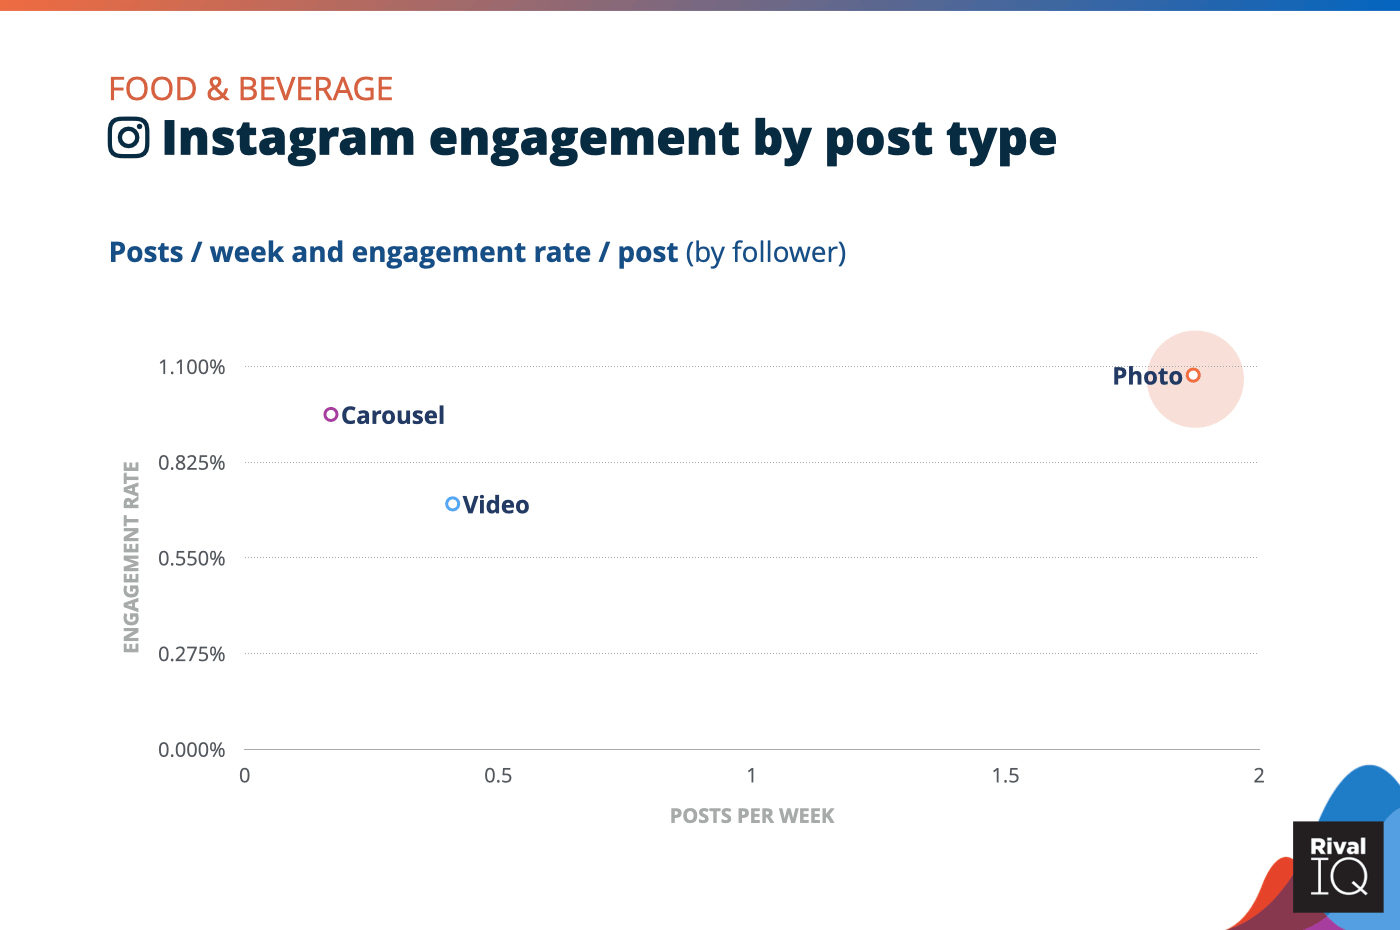
Instagram posts per week and engagement rate by post type, Food & Beverage
Photos were the highest-performing post type on Instagram for Food & Beverage brands this year.
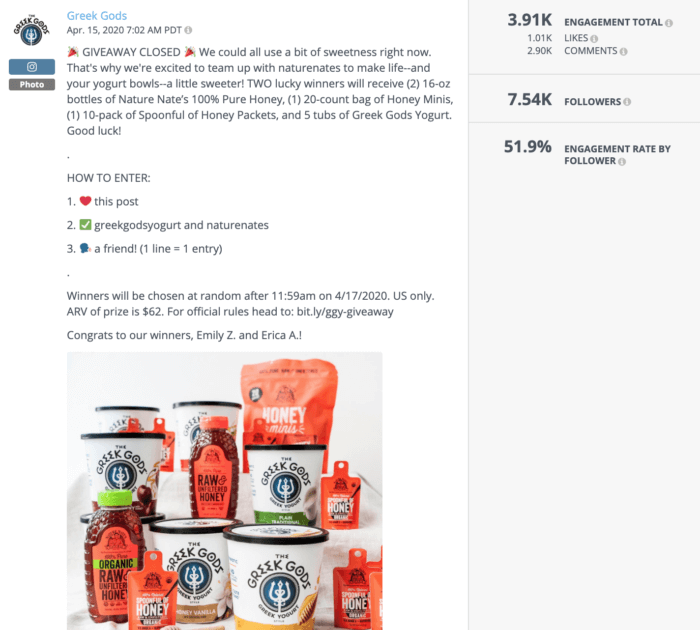
Food & Beverage brand Greek Gods rocked a whopping 4.88% engagement rate on Instagram this year thanks to delicious photos inviting followers to enter contests and giveaways.
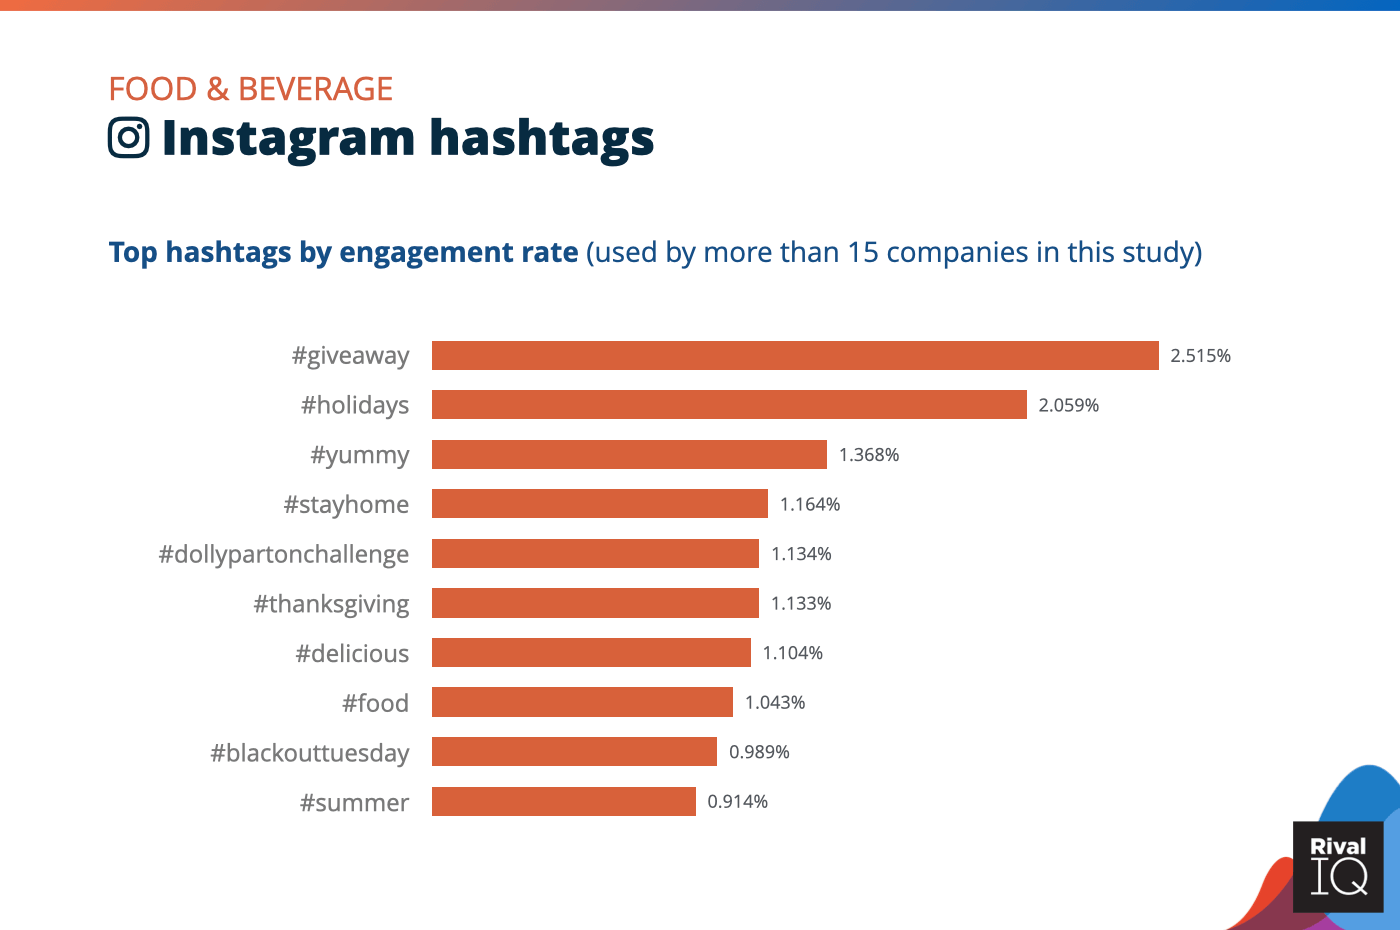
Top Instagram hashtags by engagement rate, Food & Beverage
Food & Beverage brands killed it on Instagram when posting about contests and giveaways.
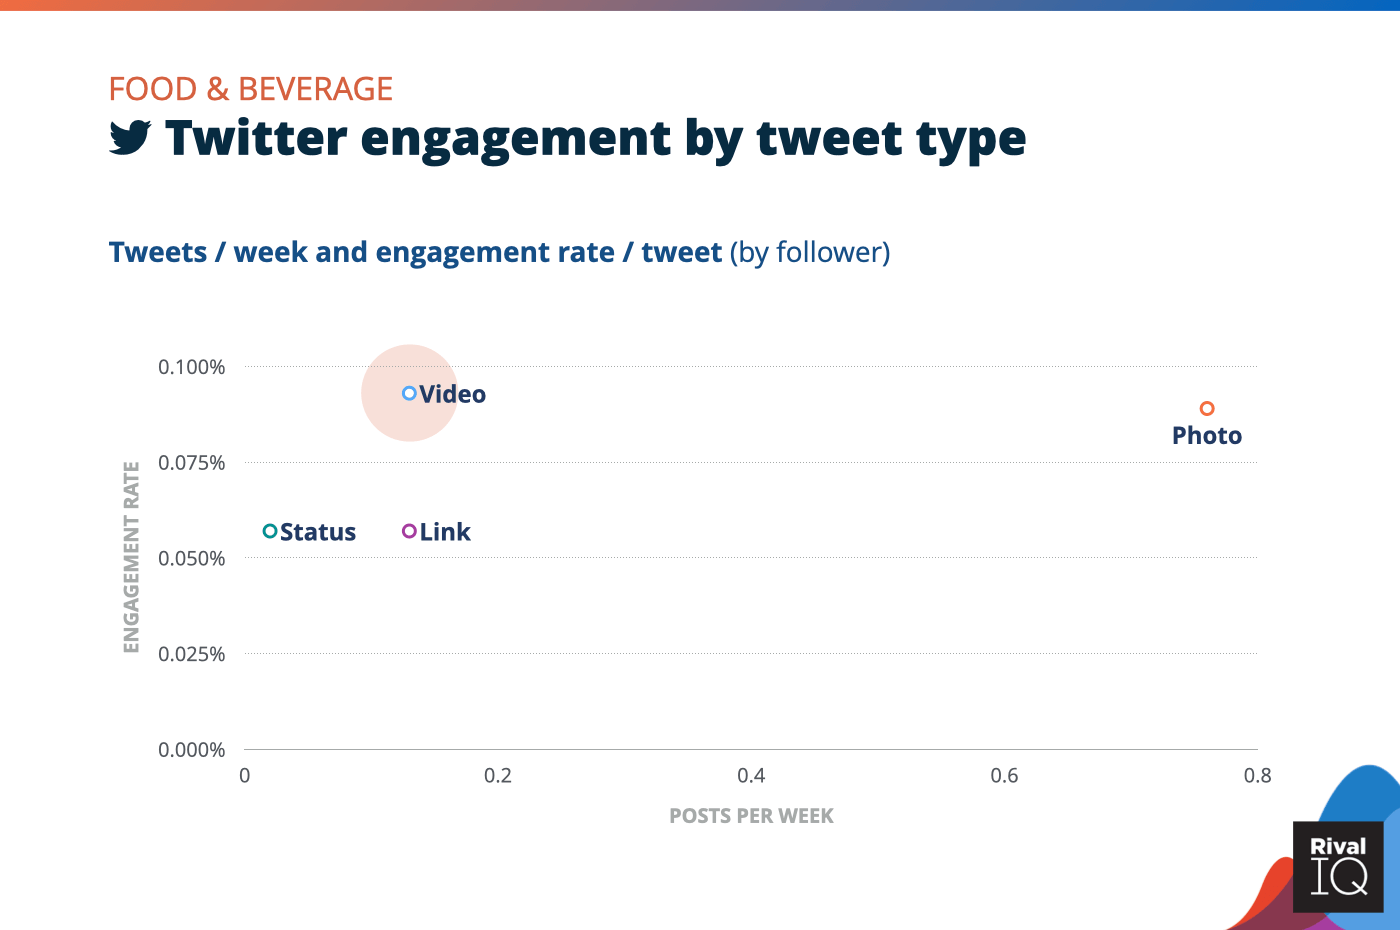
Twitter posts per week and engagement rate by tweet type, Food & Beverage
Video was a powerful tool for Food & Beverage brands on Twitter this year, so consider putting more resources behind this tweet type.
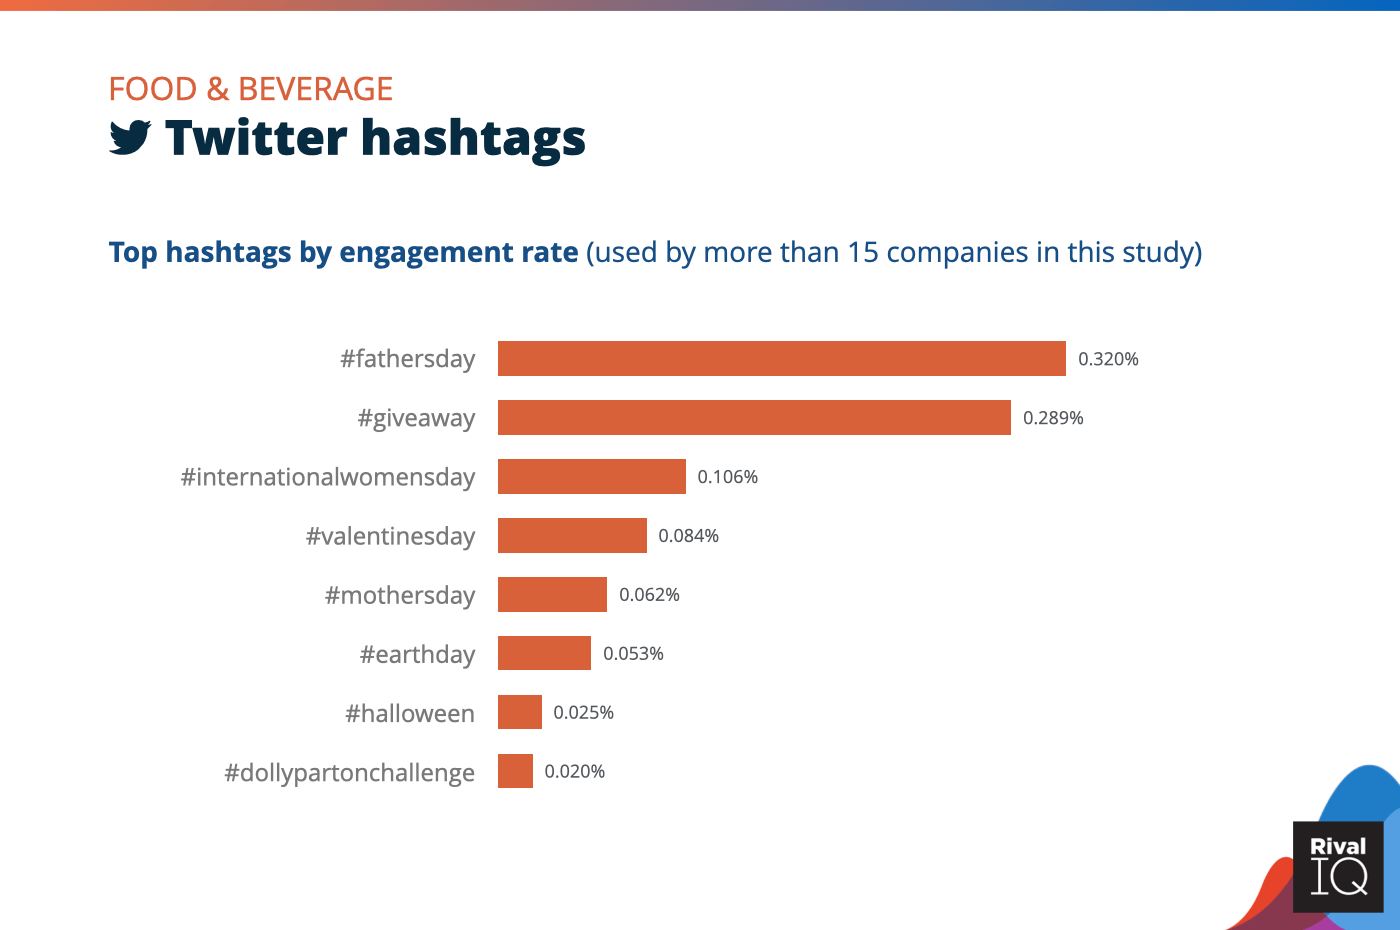
Top Twitter hashtags by engagement rate, Food & Beverage
Holidays were a big focus for Food & Beverage brands on Twitter this year, with contests and giveaways coming in hot as well.
Health & Beauty Social Media Benchmarks
Not for lack of trying (especially on Instagram), Health & Beauty saw below-median engagement across all social channels.
A few growth ideas:
- Photos perform well on Facebook and Instagram, so stick with what works.
- Contests and giveaways represented the most engaging hashtags on both Instagram and Twitter, so keep giving things away to your followers.
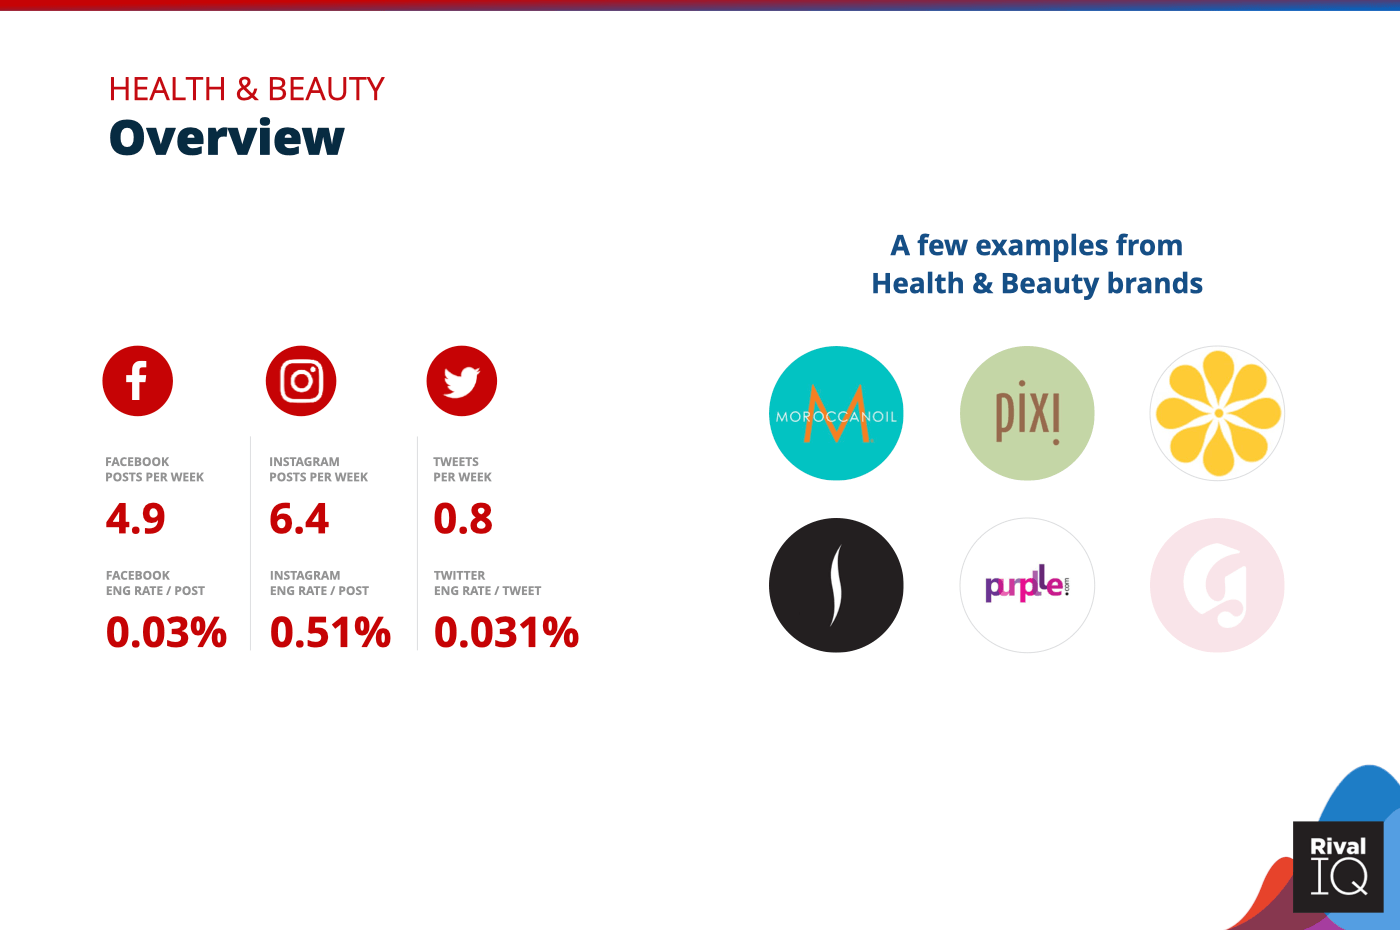
Overview of all benchmarks, Health & Beauty
Notable Health & Beauty companies include Moroccan Oil, PIXI Beauty, Fushi, Sephora, Purplle, and Glossier.
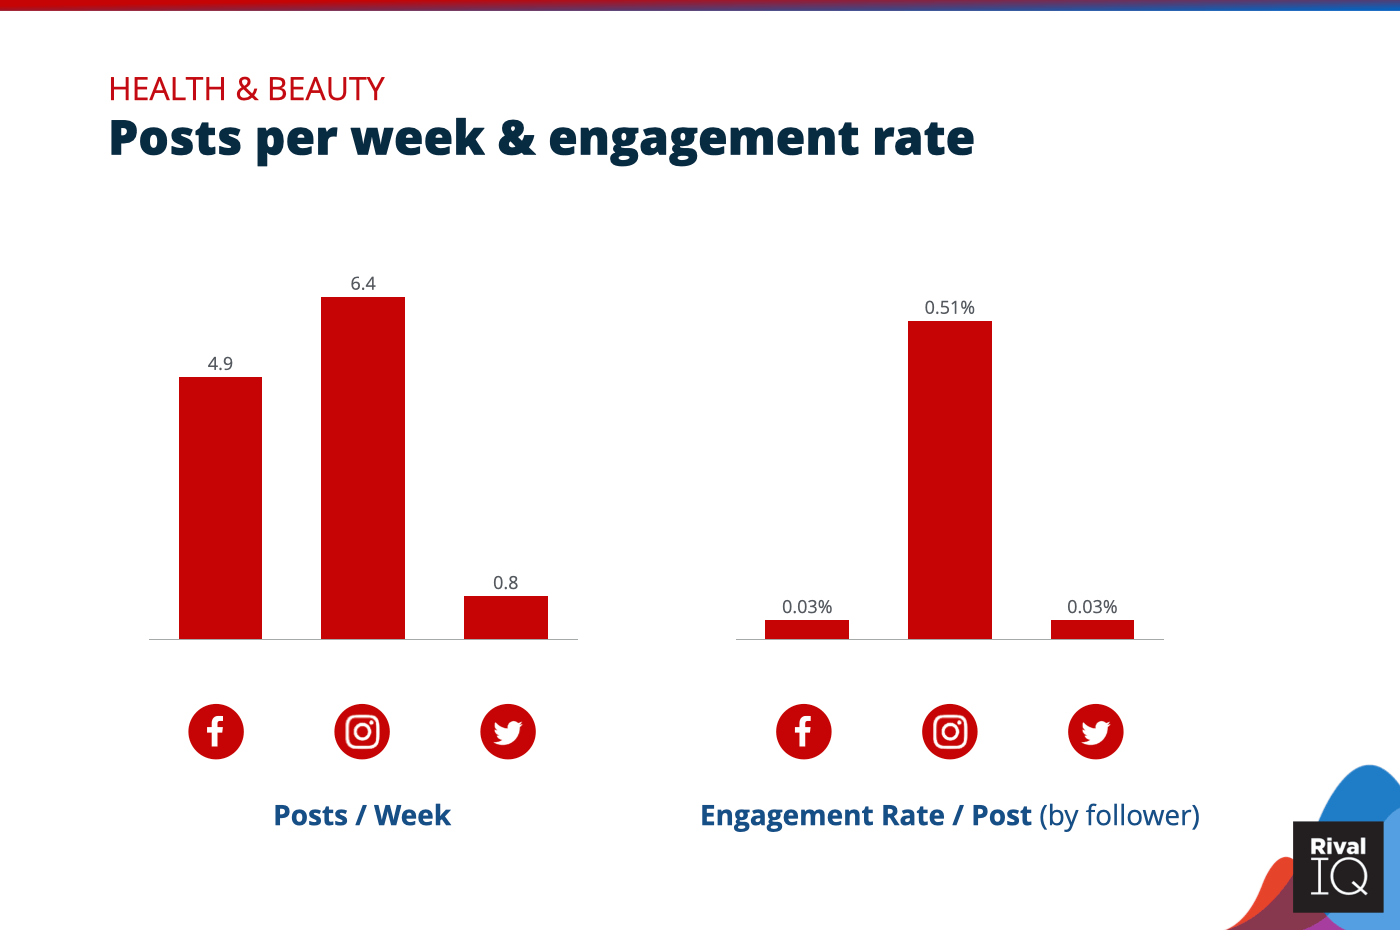
Posts per week and engagement rate per post across all channels, Health & Beauty
Health & Beauty brands saw below-median engagement rates despite median posting frequency across the board. ☹️
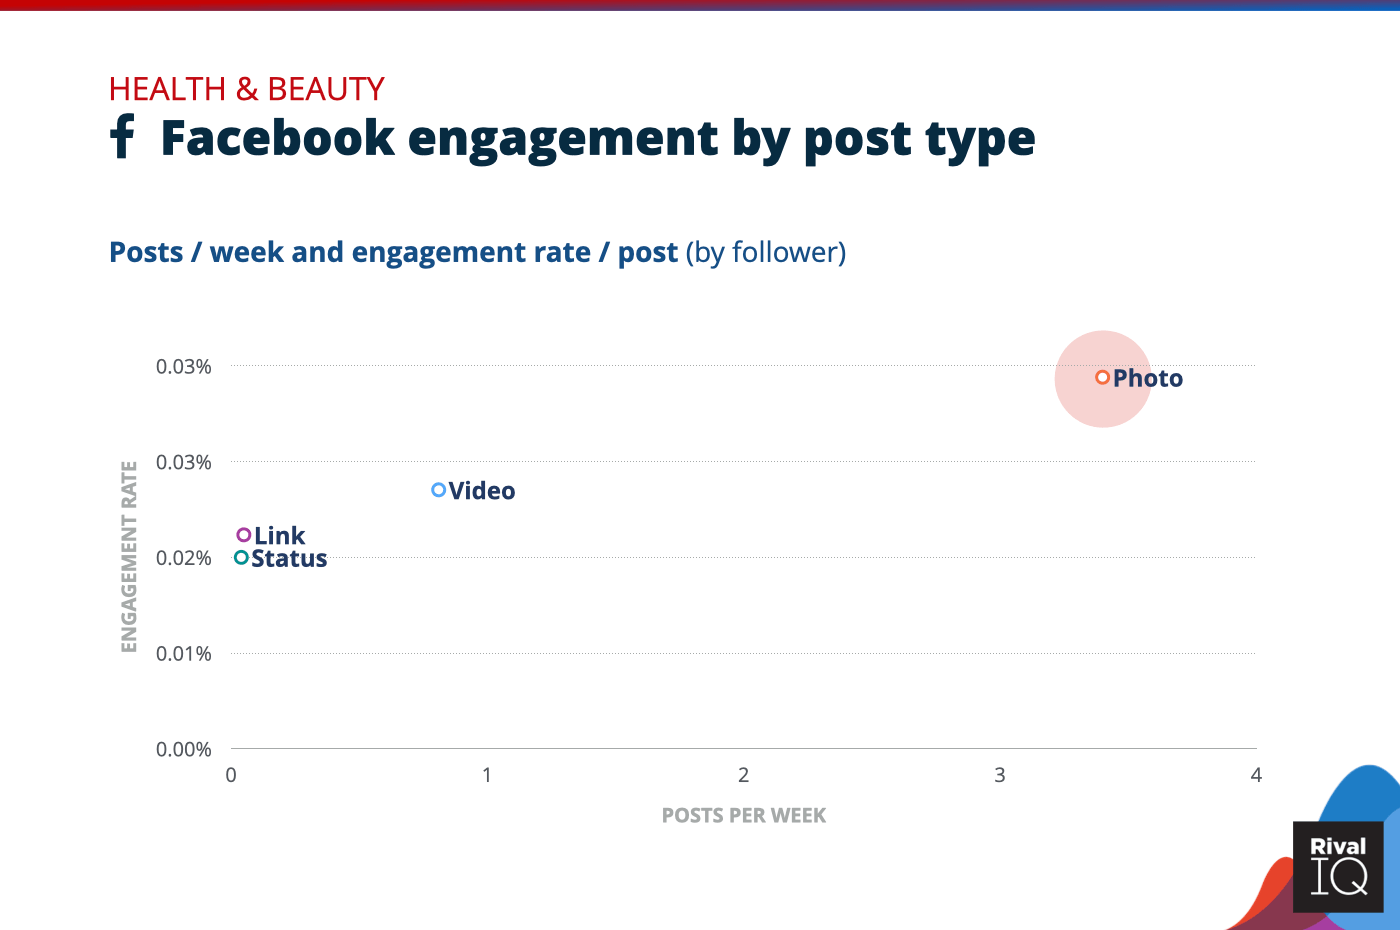
Facebook posts per week and engagement rate by post type, Health & Beauty
Photos dramatically outperformed other post types for Health & Beauty brands on Facebook.
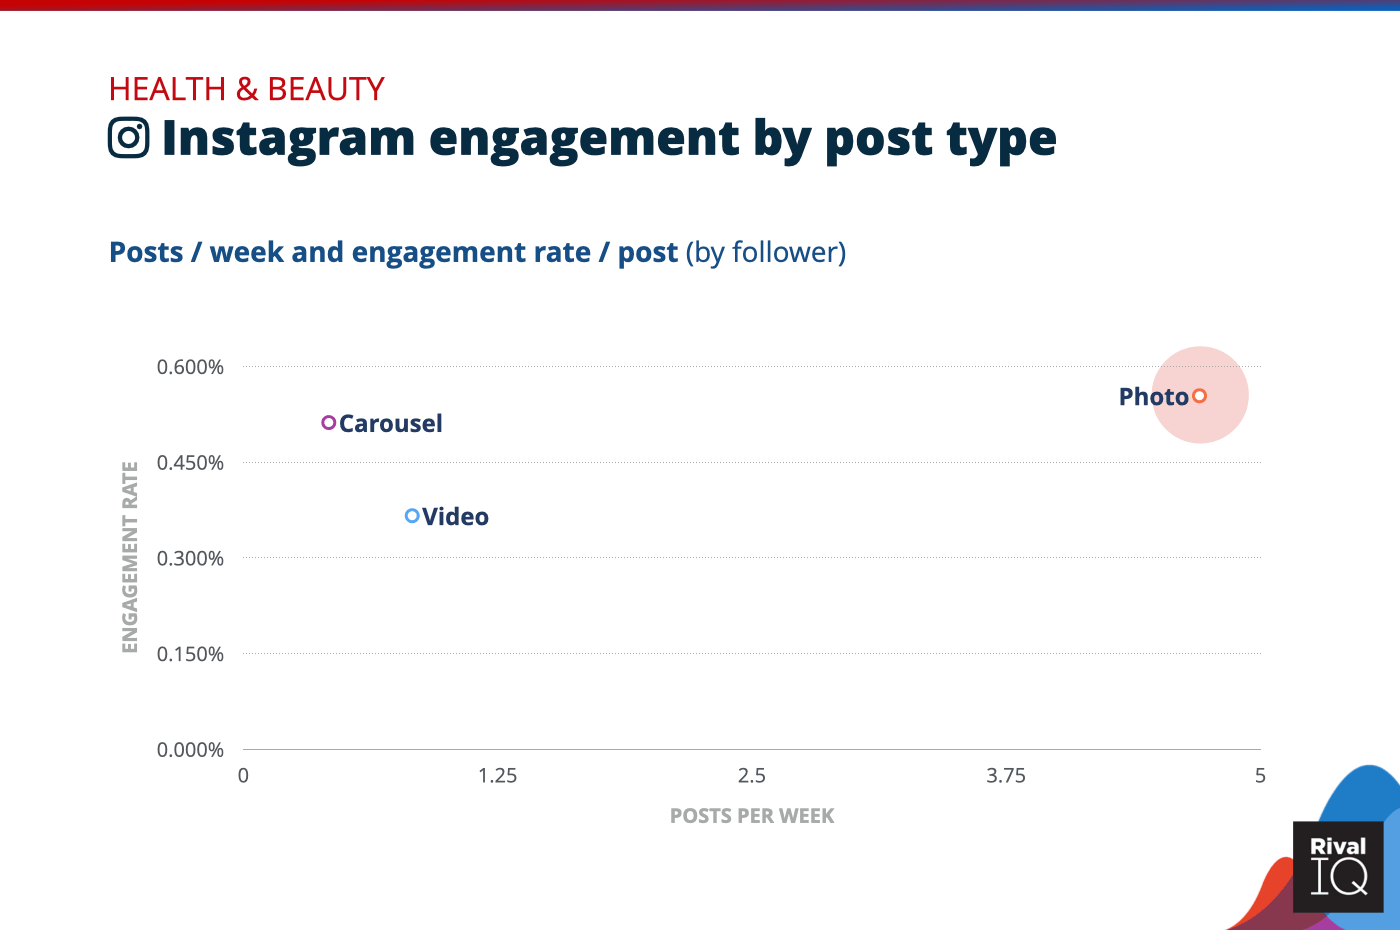
Instagram posts per week and engagement rate by post type, Health & Beauty
Photo and carousel posts were neck-and-neck for Health & Beauty brands this year, so it’s good to include a mix of both in your 2021 Instagram strategy.
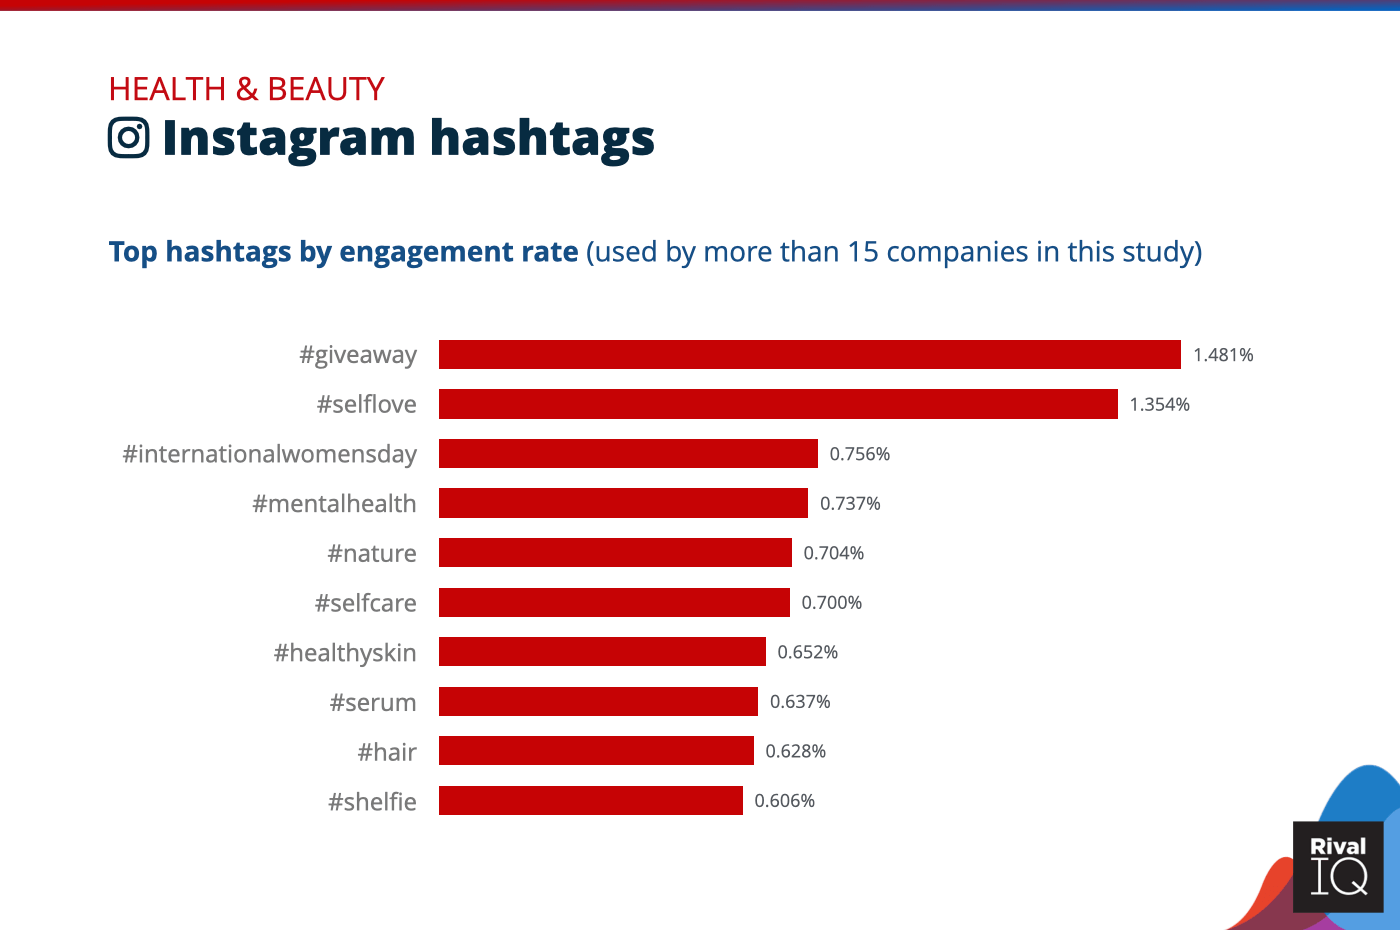
Top Instagram hashtags by engagement rate, Health & Beauty
Contests and giveaways topped the Instagram hashtag charts for Health & Beauty brands again this year. #selflove and #selfcare hashtags reminded followers to take a moment for themselves during this stressful time.
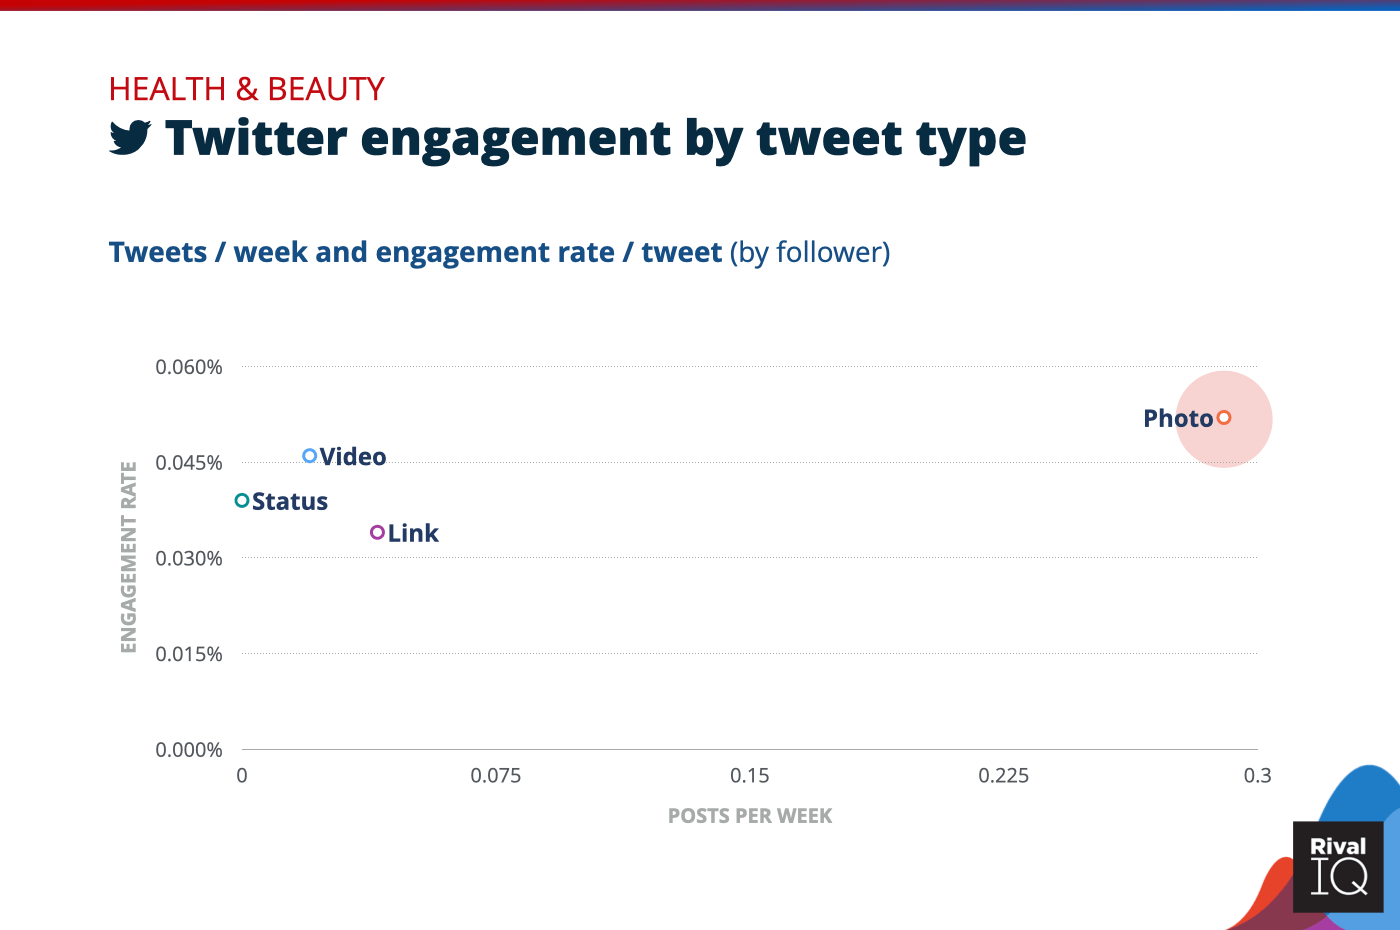
Twitter posts per week and engagement rate by tweet type, Health & Beauty
Health & Beauty brands were 7x as likely to tweet a photo as the next most frequent tweet type. This move is a smart one, since photo tweets garnered the highest engagement rates of any post type on Twitter.
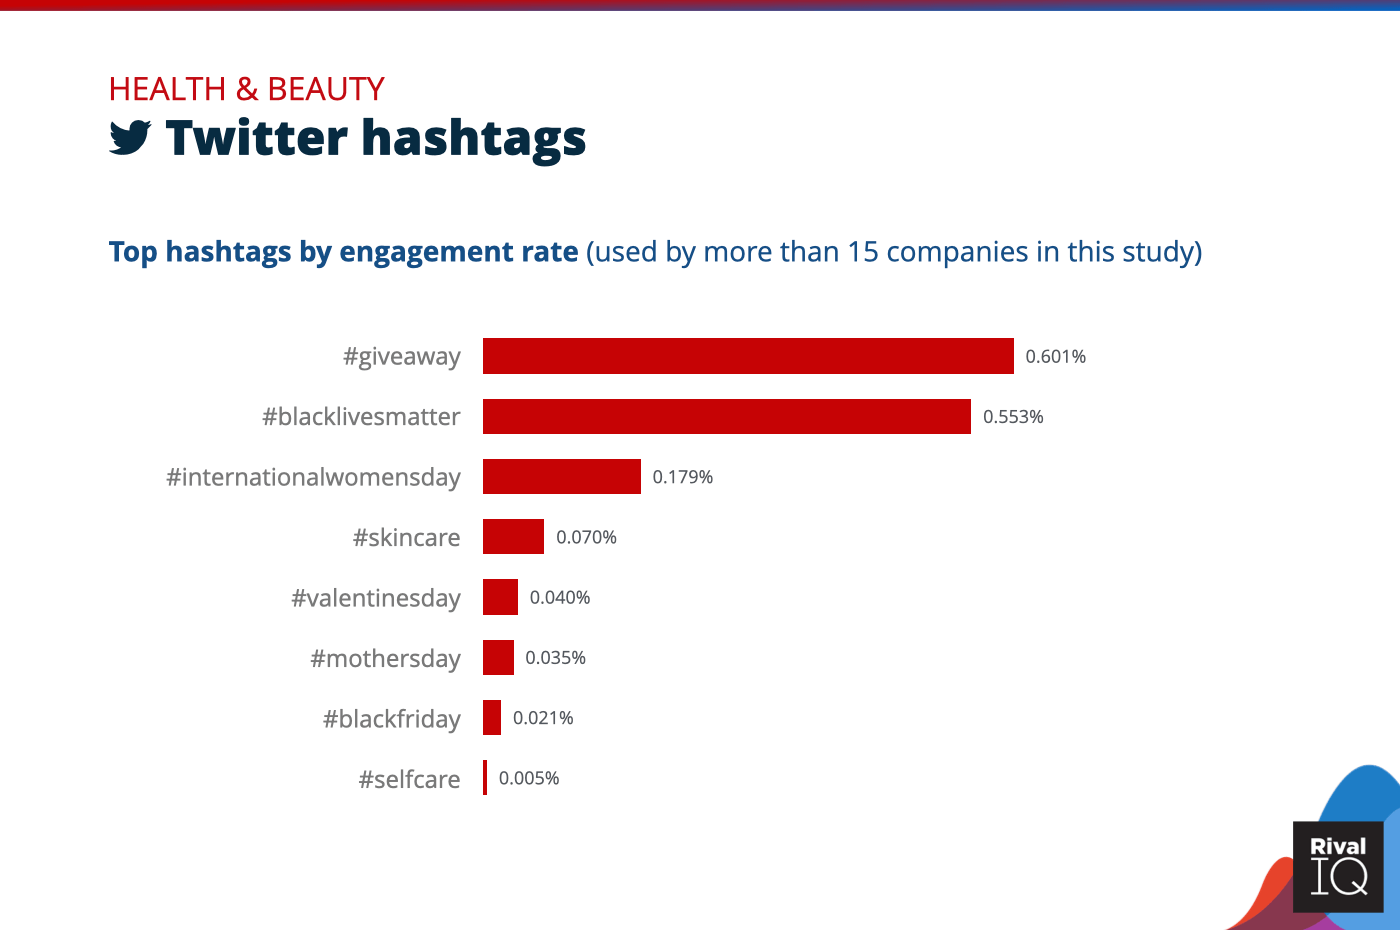
Top Twitter hashtags by engagement rate, Health & Beauty
Nice to see social justice keeping pace with contests and giveaways for Health & Beauty brands on Twitter this year.
Higher Education Social Media Benchmarks
Higher Ed rocked it with gold medals on Instagram and Twitter this year. Colleges and universities were some of the only handles we analyzed who were able to keep engagement rates steady during this year of turmoil.
For even higher Higher Ed engagement rates:
- Keep focusing on Instagram and Twitter to meet your followers where they are.
- Try to post more of what works for you: more carousels on Instagram, and more statuses and videos on Twitter.
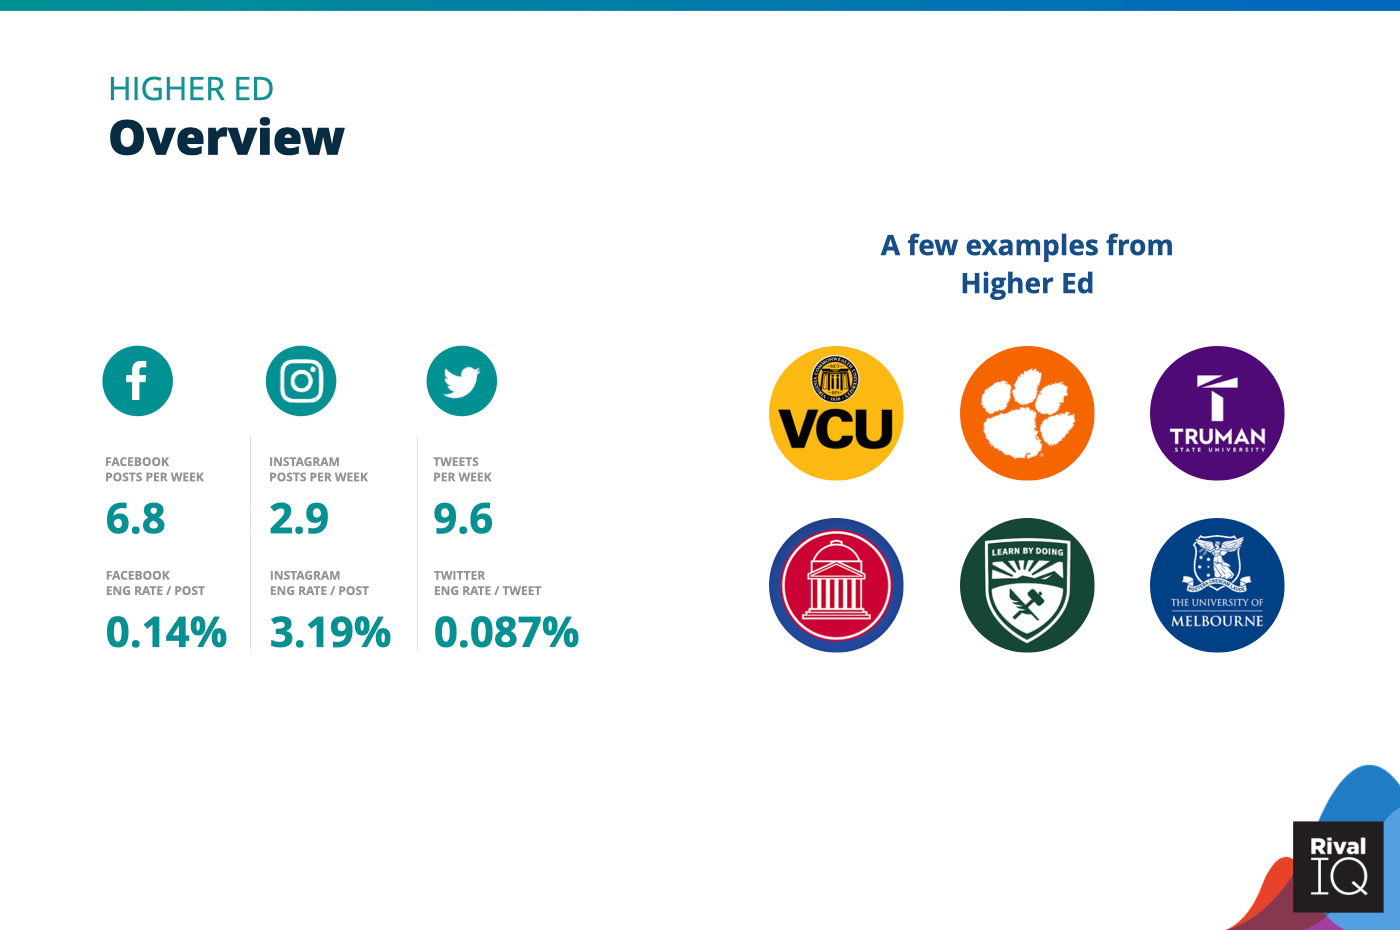
Overview of all benchmarks, Higher Ed
Notable colleges and universities include Virginia Commonwealth University, Clemson University, Truman State University, Southern Methodist University, California Polytechnic State University, and the University of Melbourne.
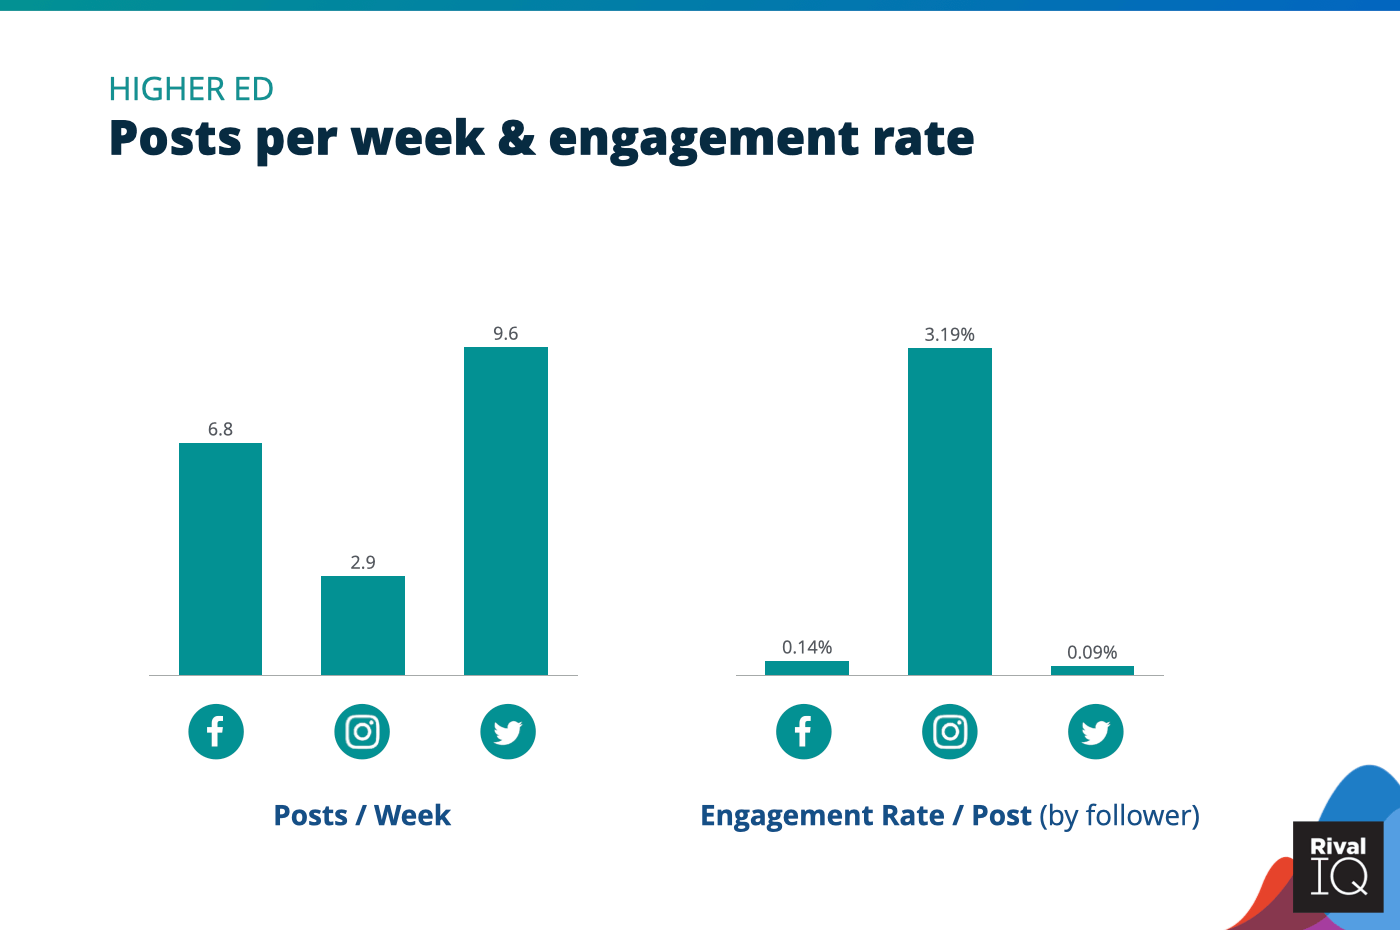
Posts per week and engagement rate across per post all channels, Higher Ed
Higher Ed dominated with top Instagram and Twitter engagement rates, seeing rates that were 3x the median on Instagram and 2x the median on Twitter. 🔥
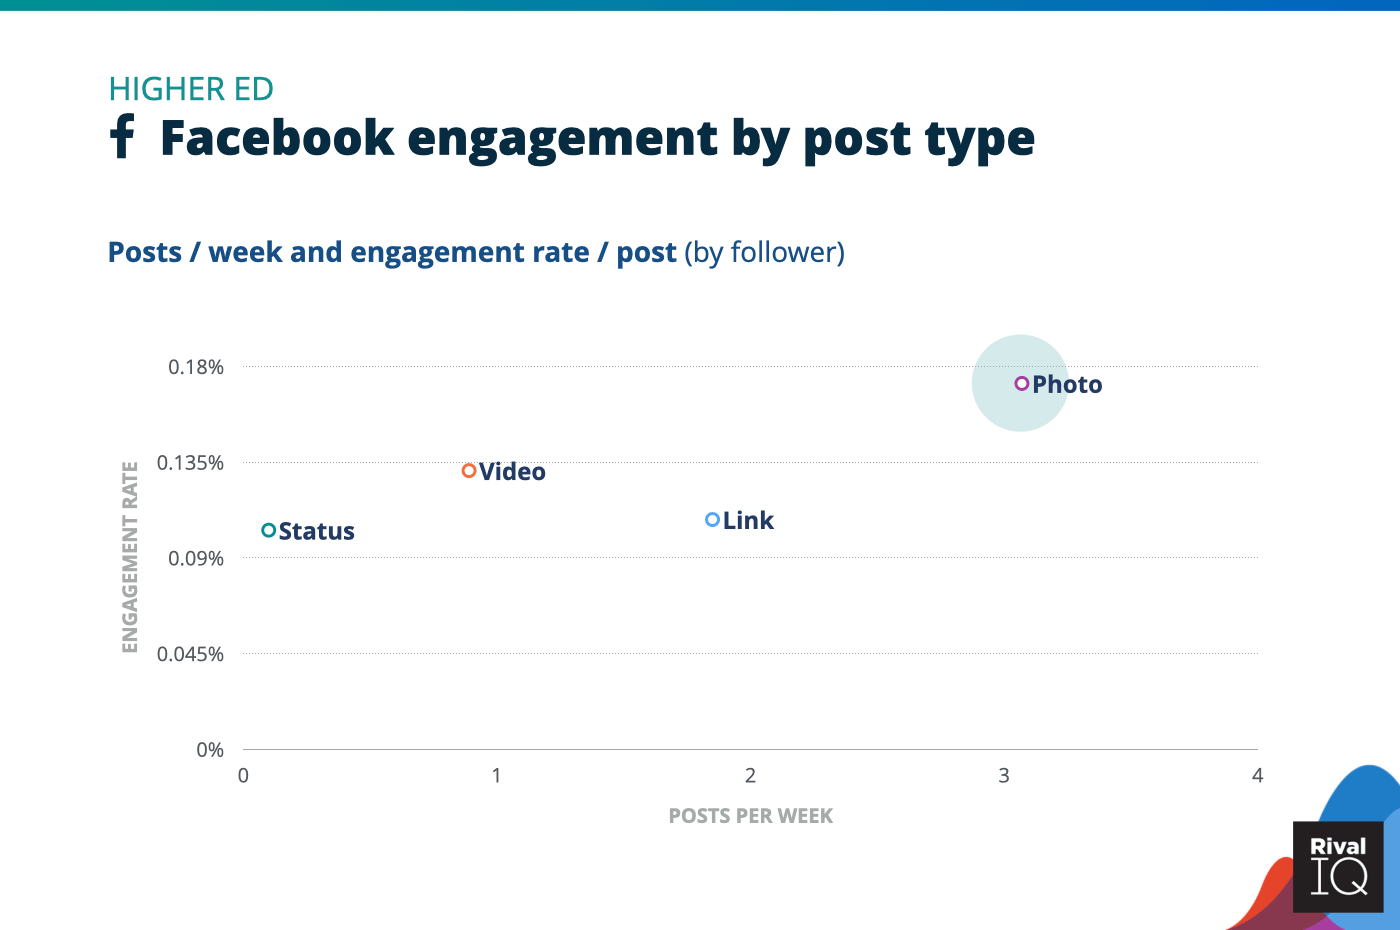
Facebook posts per week and engagement rate by post type, Higher Ed
Higher Ed performs well consistently on Facebook thanks to lots of engaging photo posts.
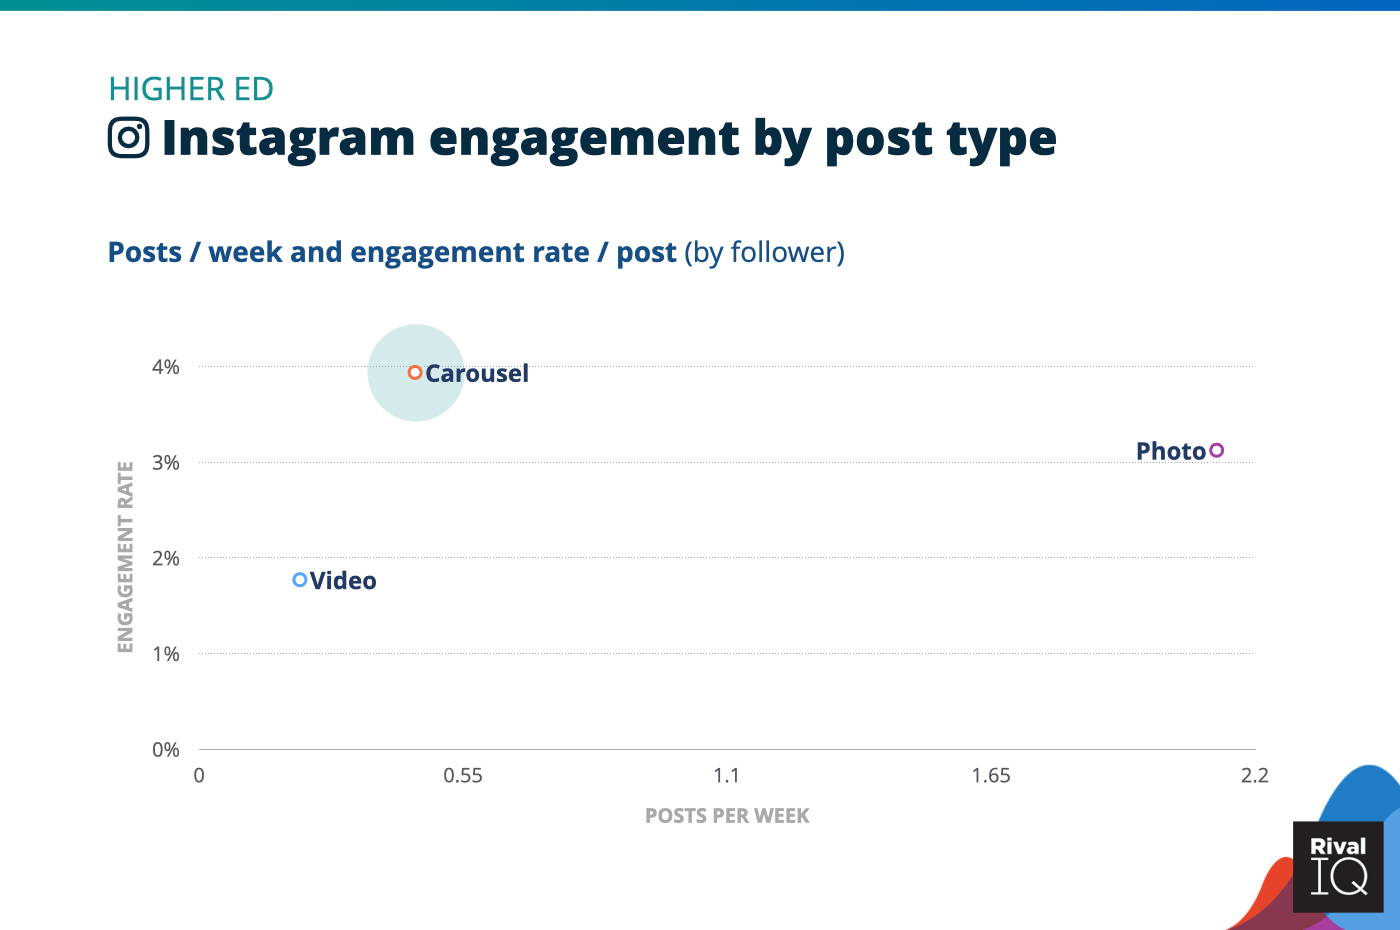
Instagram posts per week and engagement rate by post type, Higher Ed
Higher Ed blew the doors off Instagram engagement rates, especially with carousel posts.
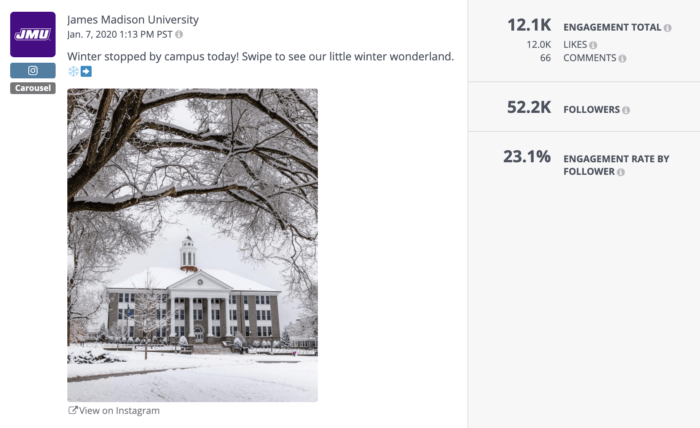
For some carousel inspo, just look at James Madison University: their most engaging post of the year was a series of snowy campus glamour shots.
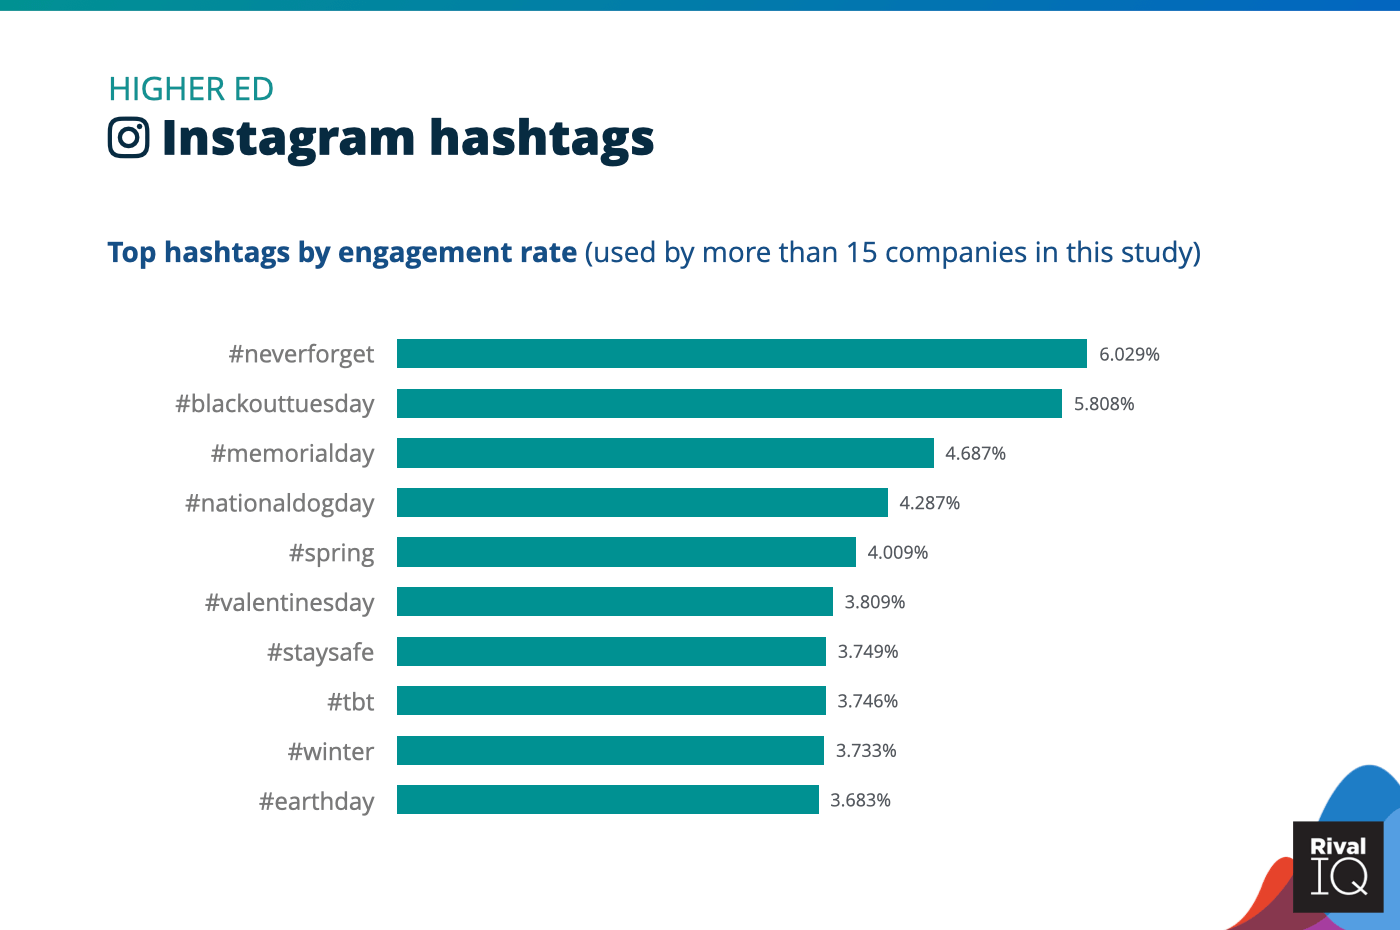
Top Instagram hashtags by engagement rate, Higher Ed
Higher Ed consistently sees the highest Instagram hashtag engagement rates of any industry we survey. These colleges and universities appealed to followers on Insta with social justice hashtags like #neverforget and #blackouttuesday.

Twitter posts per week and engagement rate by tweet type, Higher Ed
Higher Ed is a shining example of successful Twitter strategy, but these colleges and universities could succeed even more by tweeting more statuses and videos.
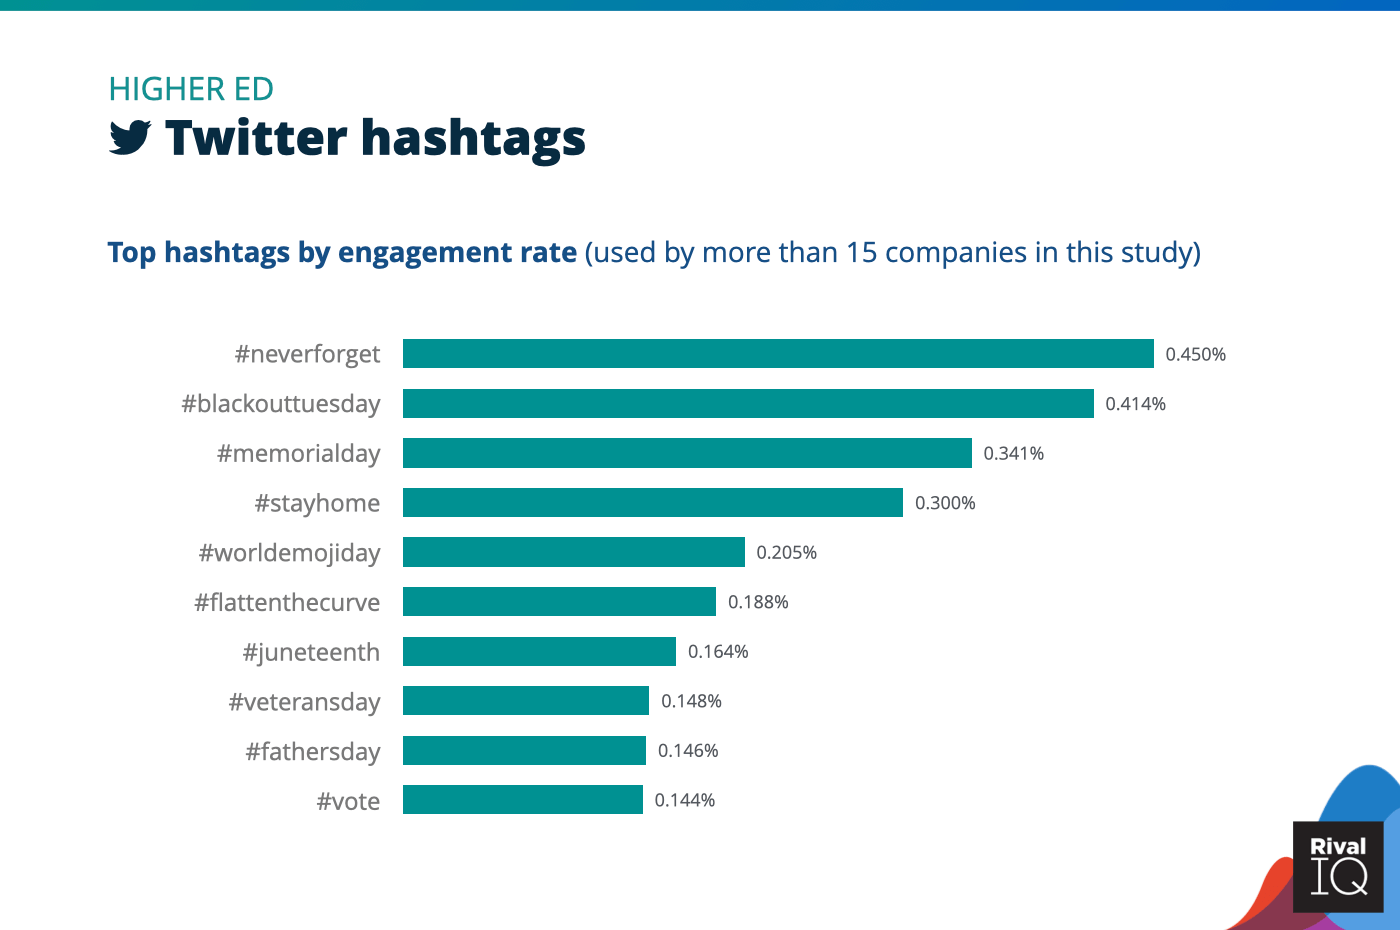
Top Twitter hashtags by engagement rate, Higher Ed
Colleges and universities inspired their followers on Twitter with hashtags like #blackouttuesday, #juneteenth, and #vote.
Home Decor Social Media Benchmarks
Home Decor brands came in below the median engagement rates on Facebook, Instagram, and Twitter. These brands weren’t frequent posters on Facebook or Twitter, but definitely put more effort into Insta this year.
Some ideas for increasing engagement:
- Combine photos on Instagram into carousels.
- Bulk up your hashtag game on Twitter, and don’t be afraid to take a page out of what’s working on Instagram with interior design hashtags.
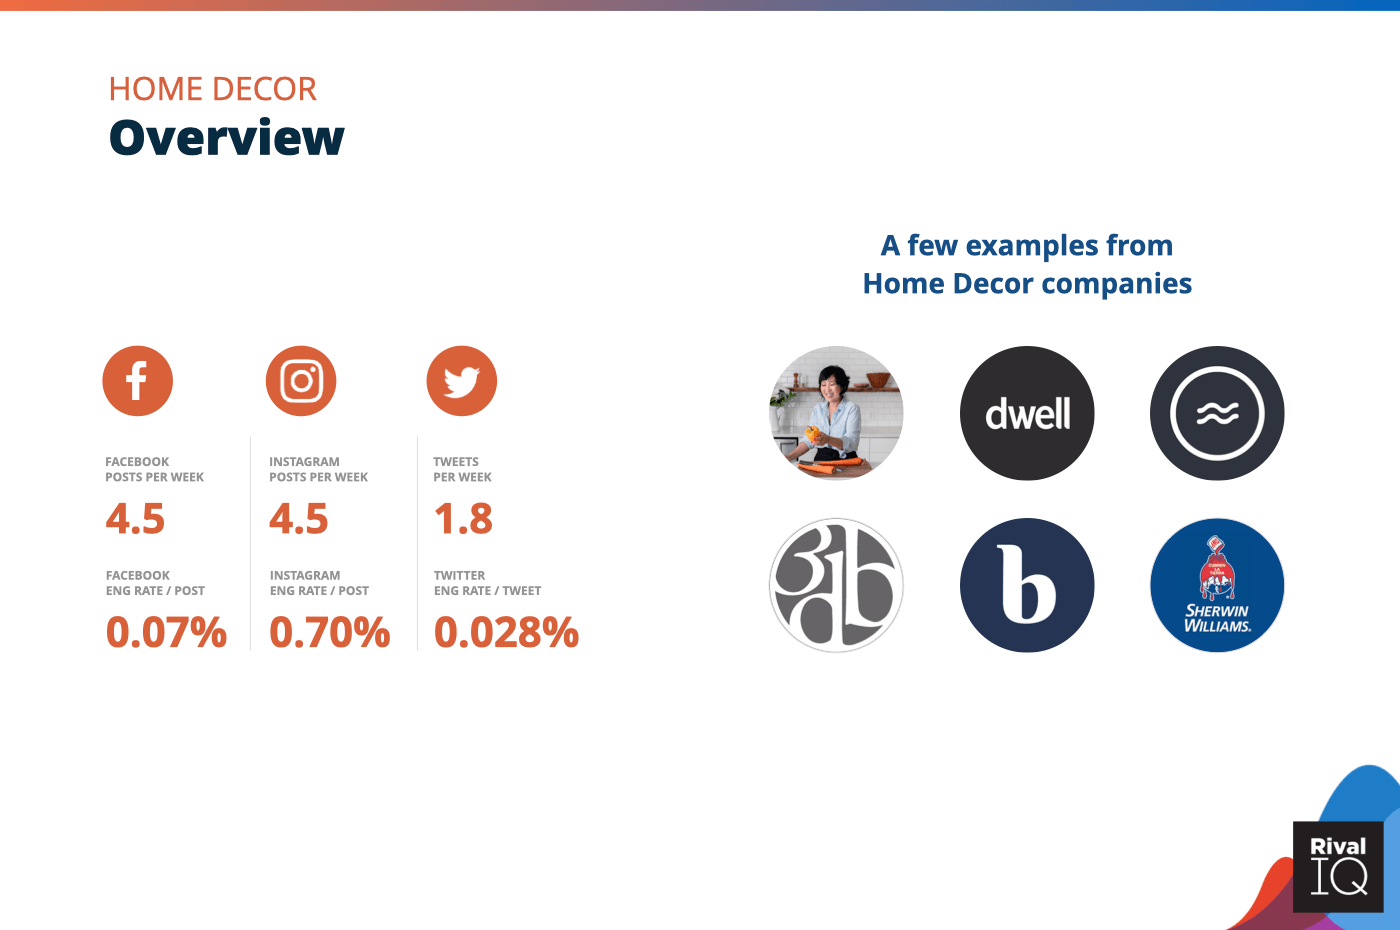
Overview of all benchmarks, Home Decor
Notable Home Decor brands include Hippie Food Mom, Dwell, Ruggable, 3 Day Blinds, Brooklinen, and Sherwin Williams.
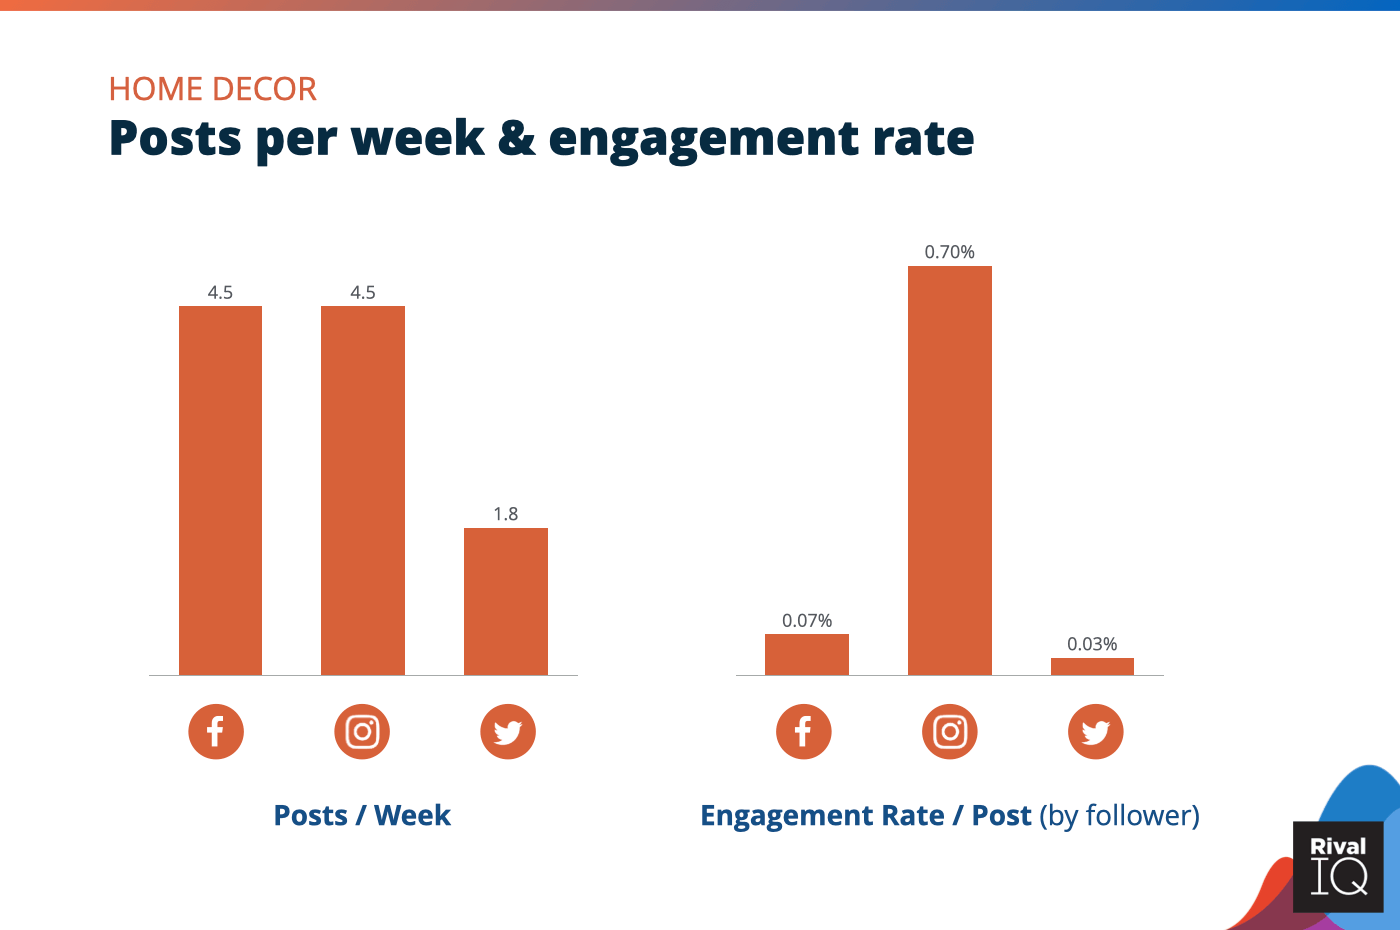
Posts per week and engagement rate per post across all channels, Home Decor
Home Decor brands stepped up their posting frequency on Instagram this year, but lagged behind the median engagement rates on all three channels.
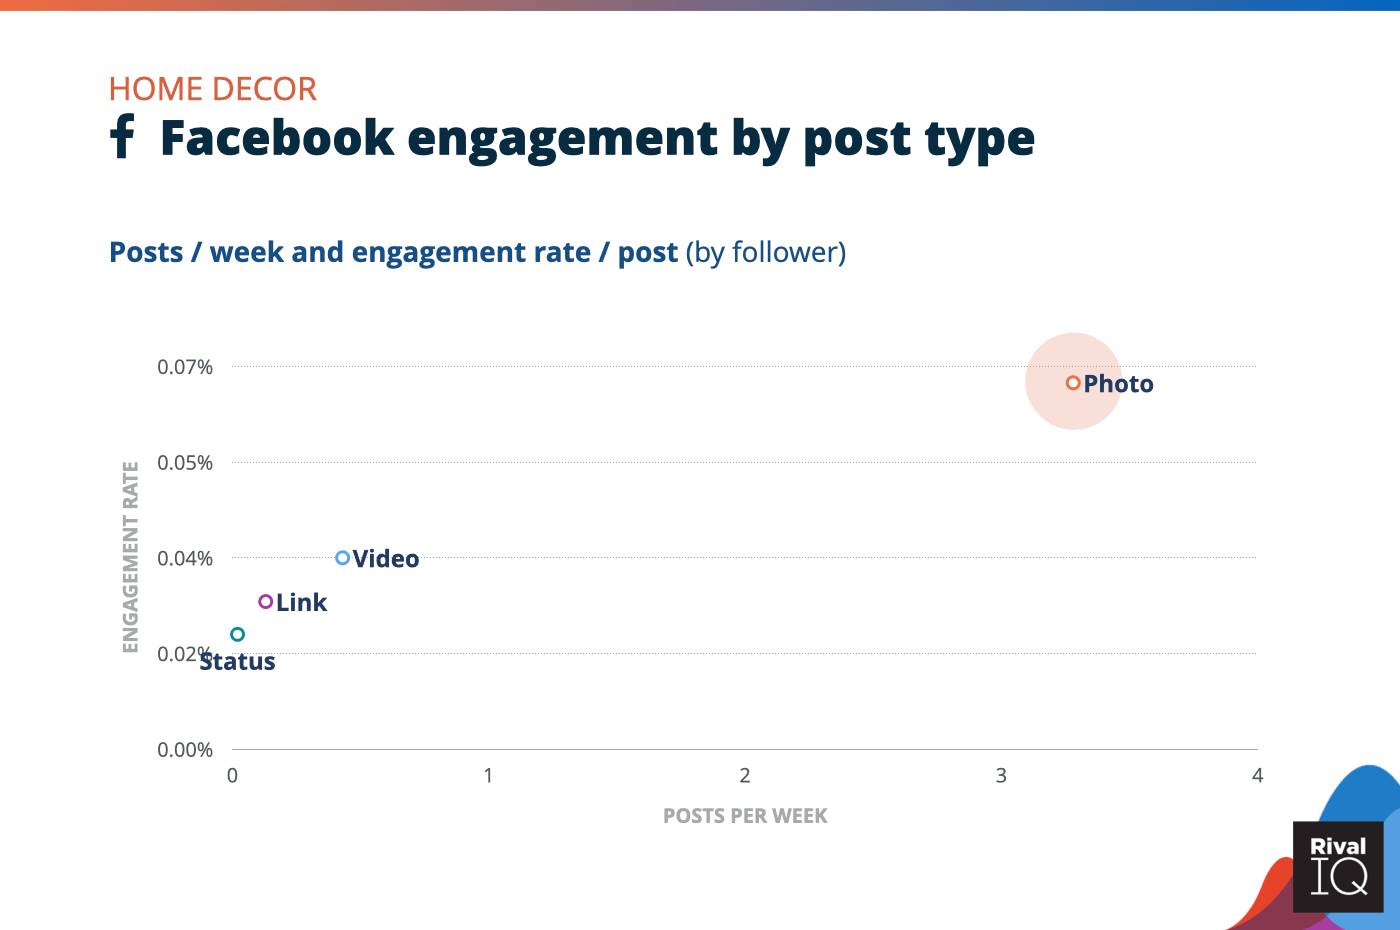
Facebook posts per week and engagement rate by post type, Home Decor
Photos won out over other post types on Facebook for Home Decor brands.
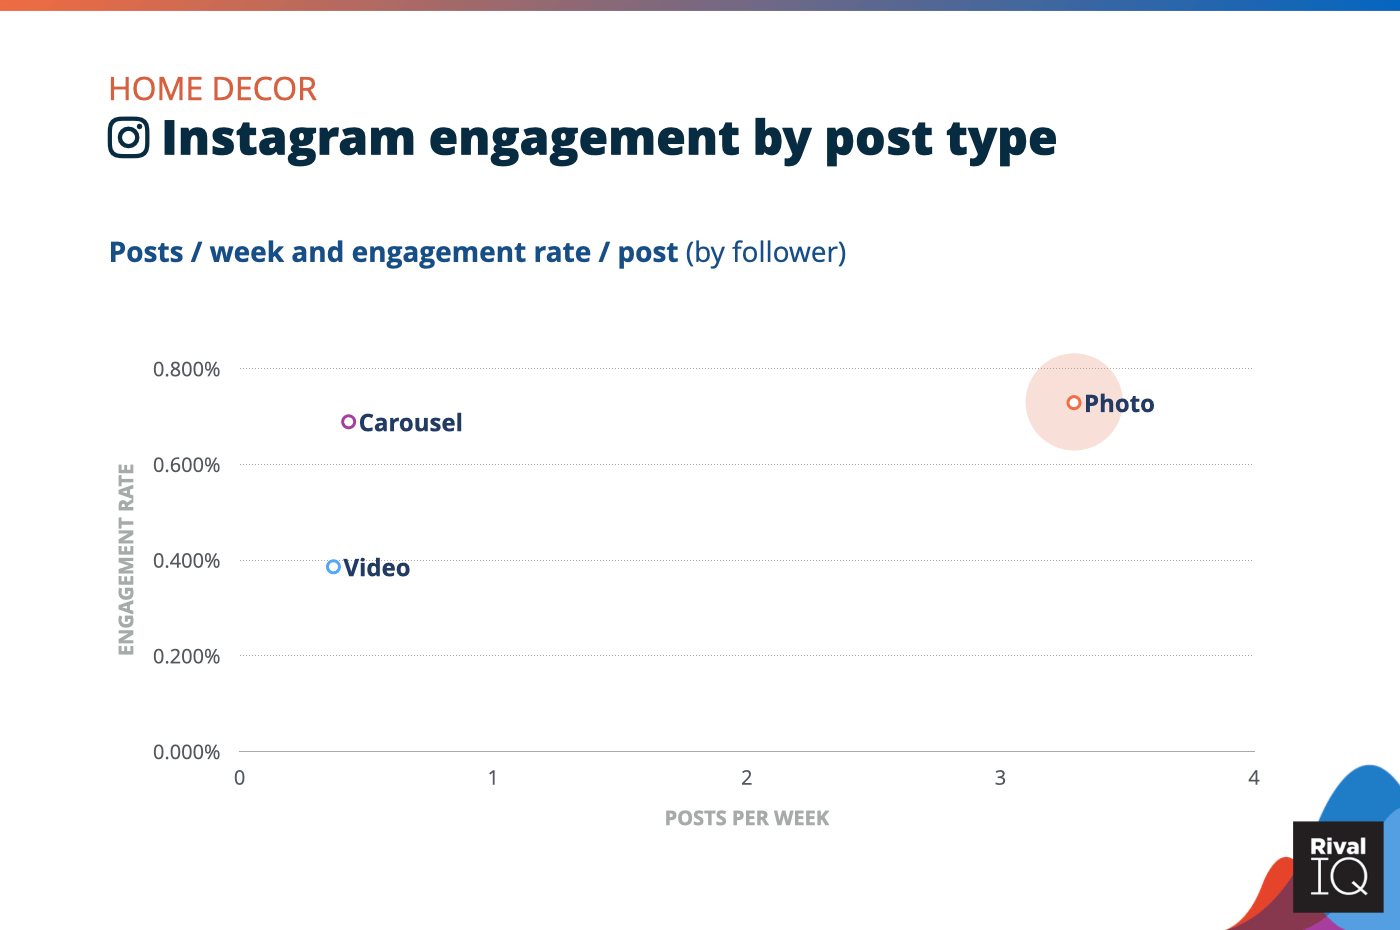
Instagram posts per week and engagement rate by post type, Home Decor
Home Decor stepped up its carousel posting frequency on Instagram this year, which is a smart move considering the consistently stellar engagement rates for that post type.
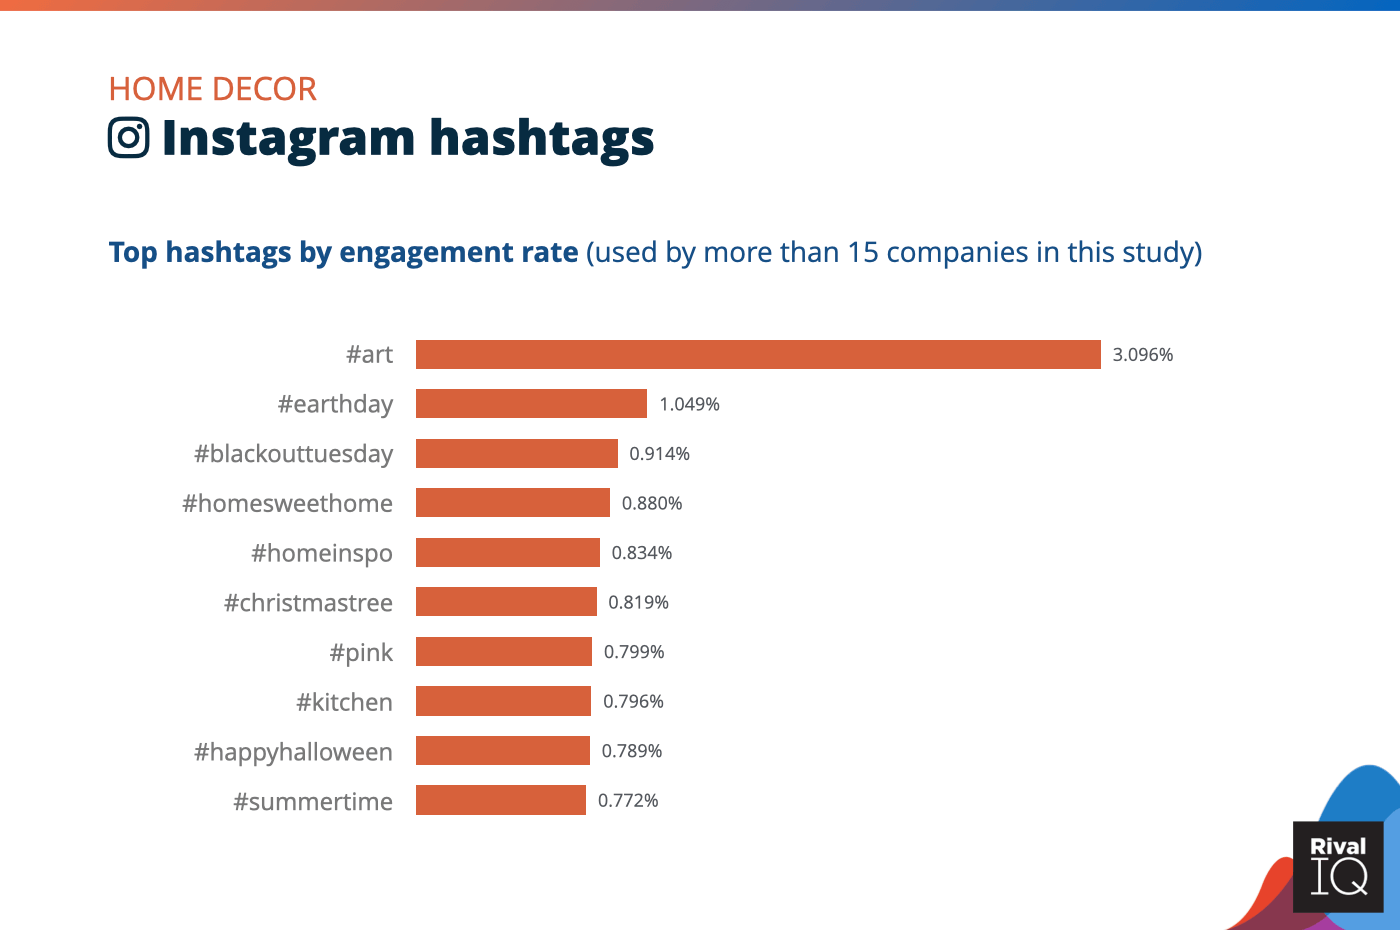
Top Instagram hashtags by engagement rate, Home Decor
Home Decor’s Insta hashtags like #homesweethome and #homeinspo were hyper-relevant to the industry.
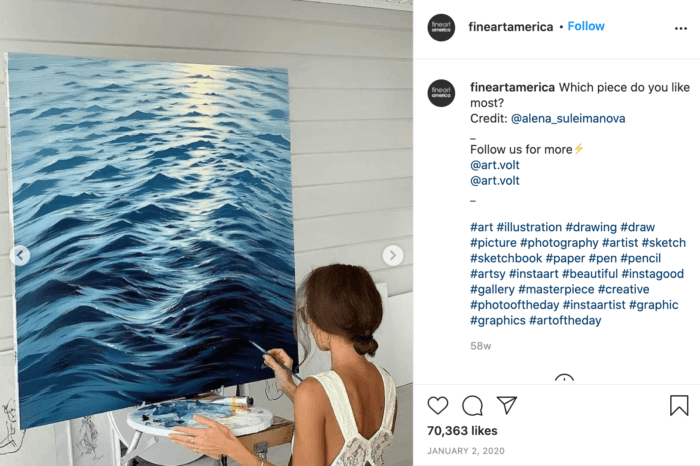
Fine Art America killed it with super-engaging posts featuring the #art hashtag.
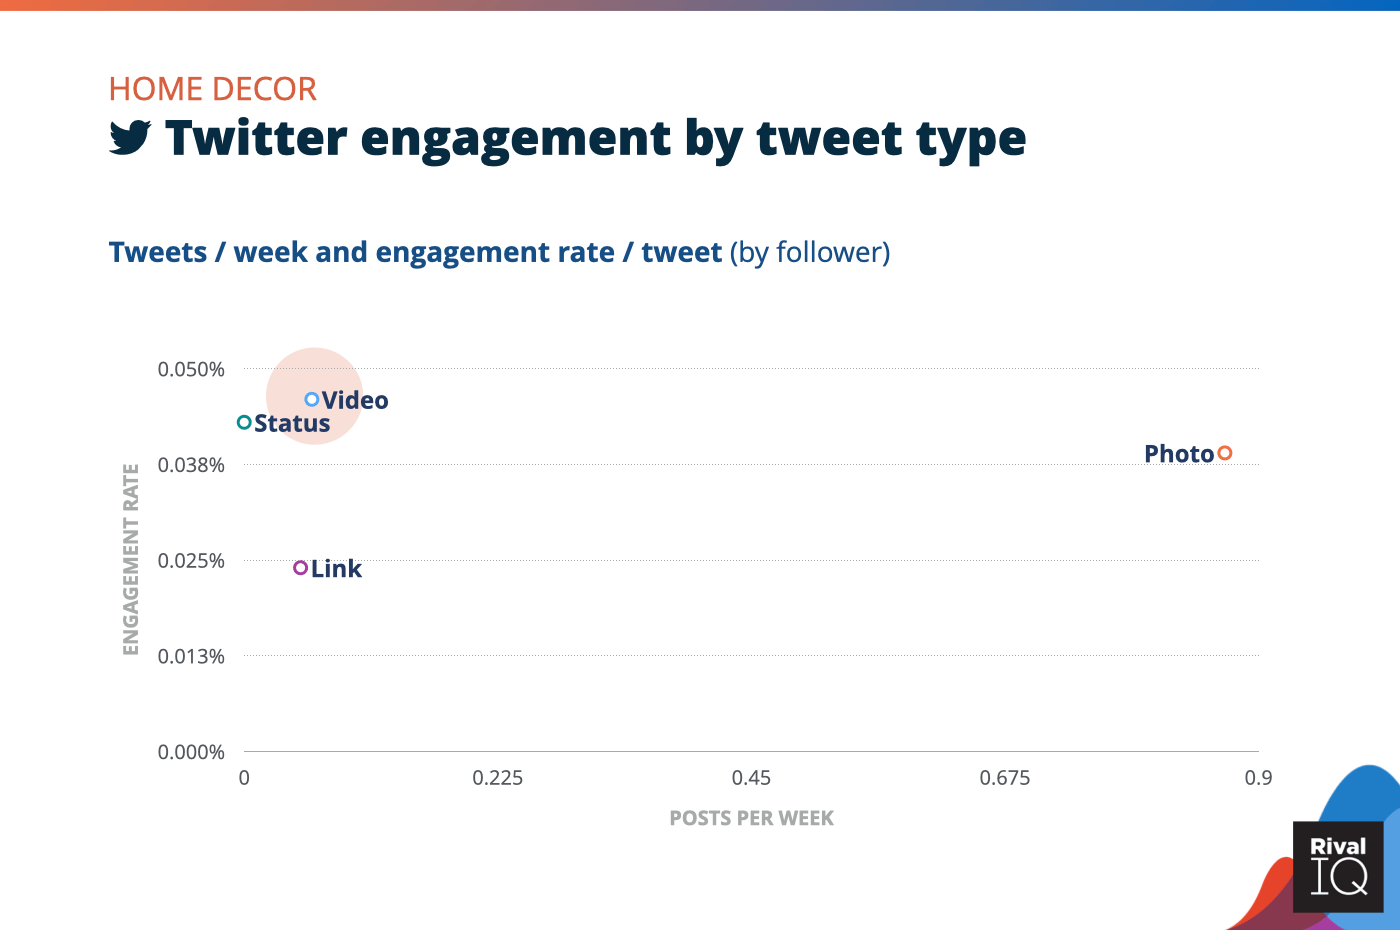
Twitter posts per week and engagement rate by tweet type, Home Decor
Home Decor brands tweeted fewer photos per week this year, and might want to look into increasing video tweets for a bigger engagement rate oomph.
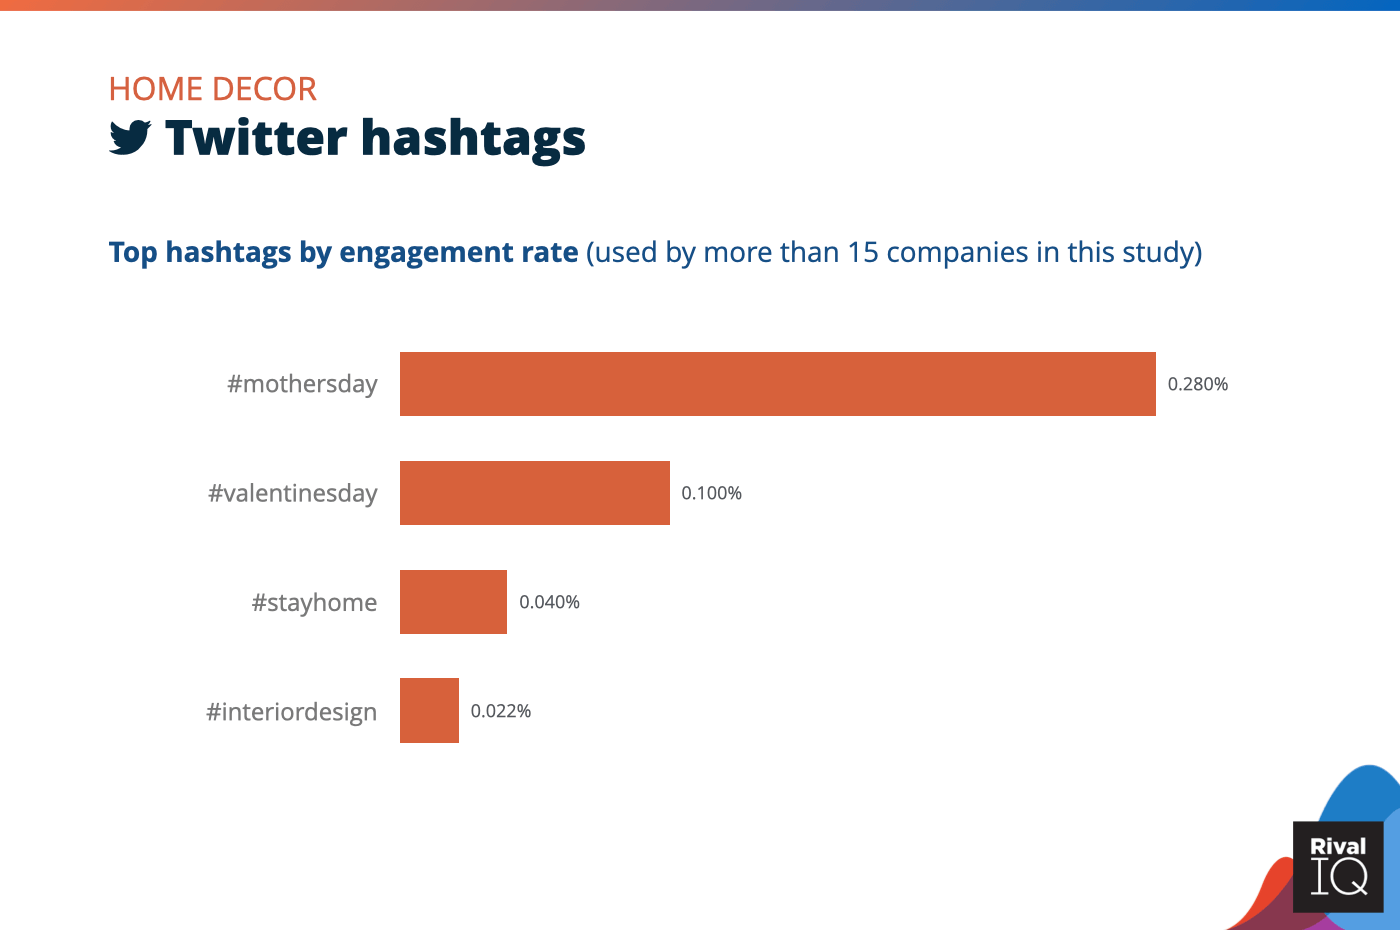
Top Twitter hashtags by engagement rate, Home Decor
Home Decor brands were all over the map with Twitter hashtags this year, which is why there are just a few on this list used by 15 or more companies in the study.
Hungry for more benchmarking? We’ve got the definitive guide to all things Instagram Stories.
Get the Instagram Stories Benchmark ReportHotels & Resort Social Media Benchmarks
Hotels & Resorts pulled off the impossible in a year of challenging times for social media (and especially travel brands): they increased engagement slightly on Facebook and Twitter while holding steady on Instagram.
A few suggestions to grow engagement:
- Visuals are key for helping followers dream about their next vacation, so focus on photos and videos.
- Posting frequency was below-median across the board, so experiment with an uptick here to see if you can increase your current engagement rates.
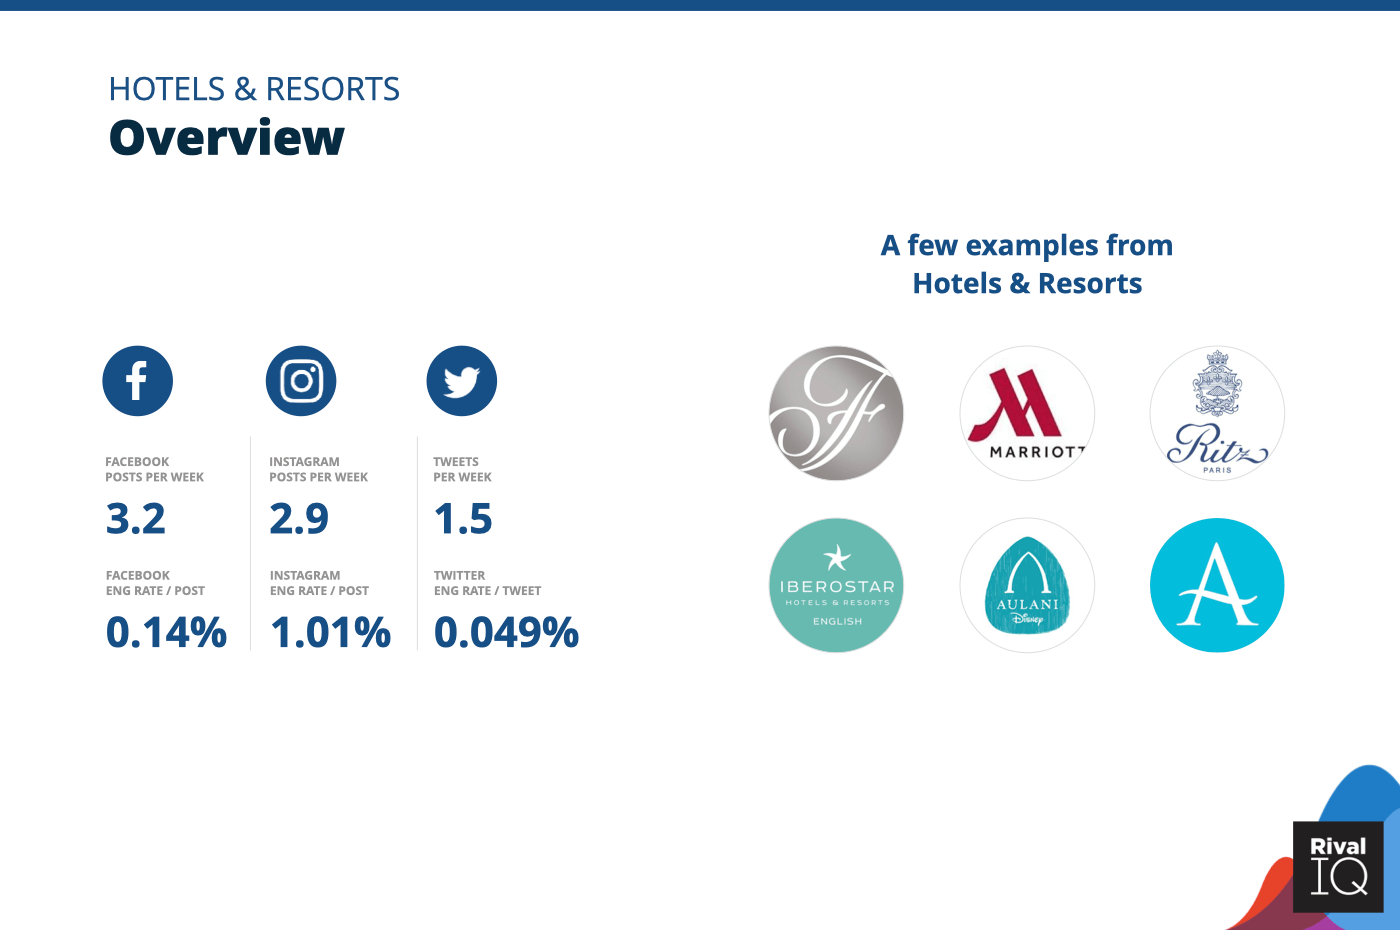
Overview of all benchmarks, Hotels & Resorts
Notable Hotels & Resorts include Fairmont, Marriott, Ritz Paris, Iberostar, Aulani, and Live Aqua.
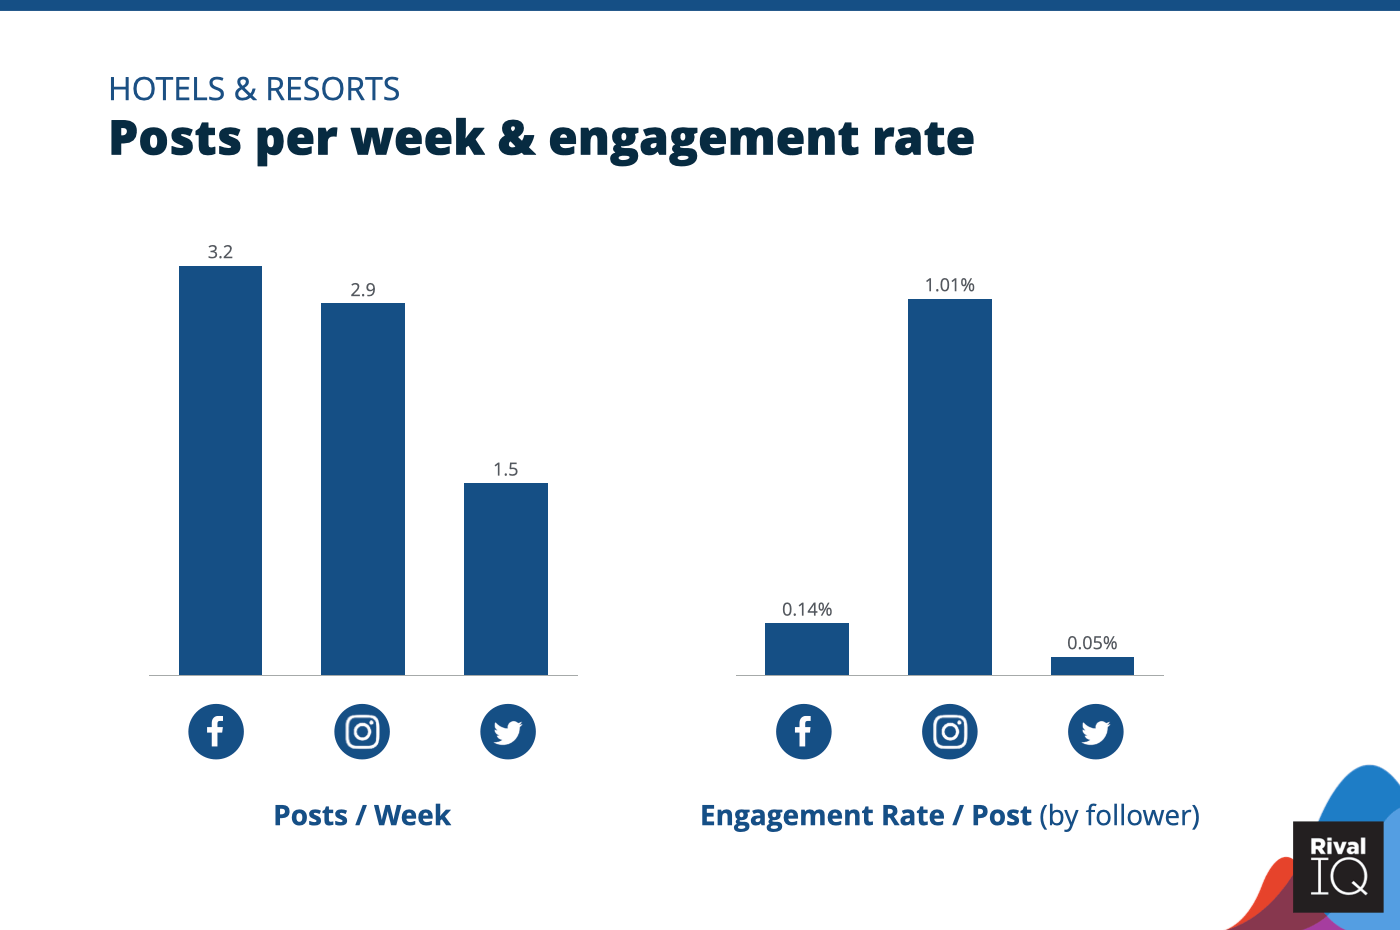
Posts per week and engagement rate per post across all channels, Hotels & Resorts
Hotels & Resorts came in at or above median for engagement rates across all three channels.
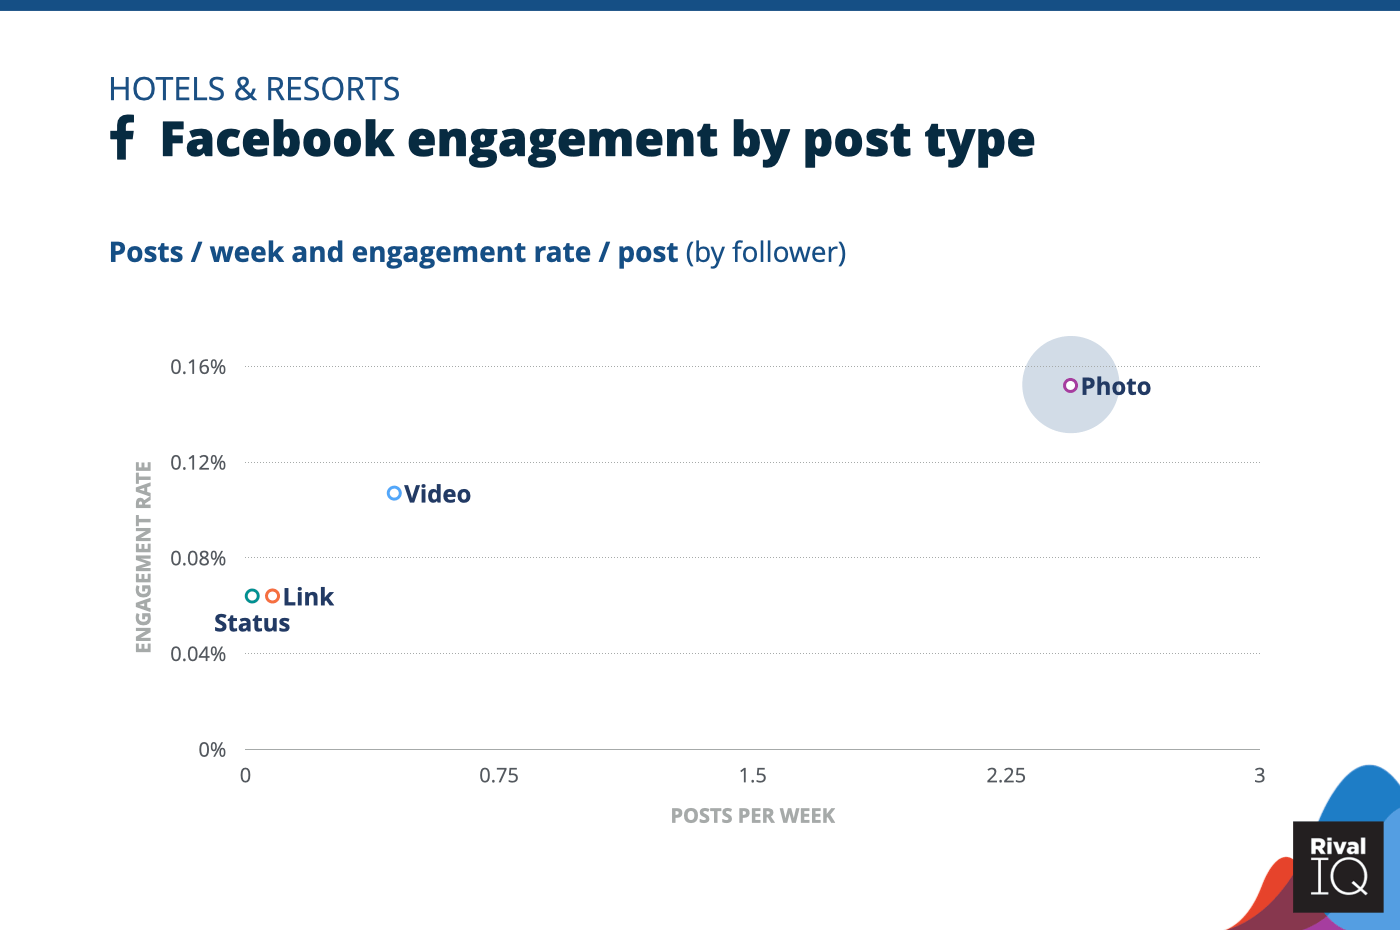
Facebook posts per week and engagement rate by post type, Hotels & Resorts
Photos inspired followers to dream about their next vacation this year on Facebook.
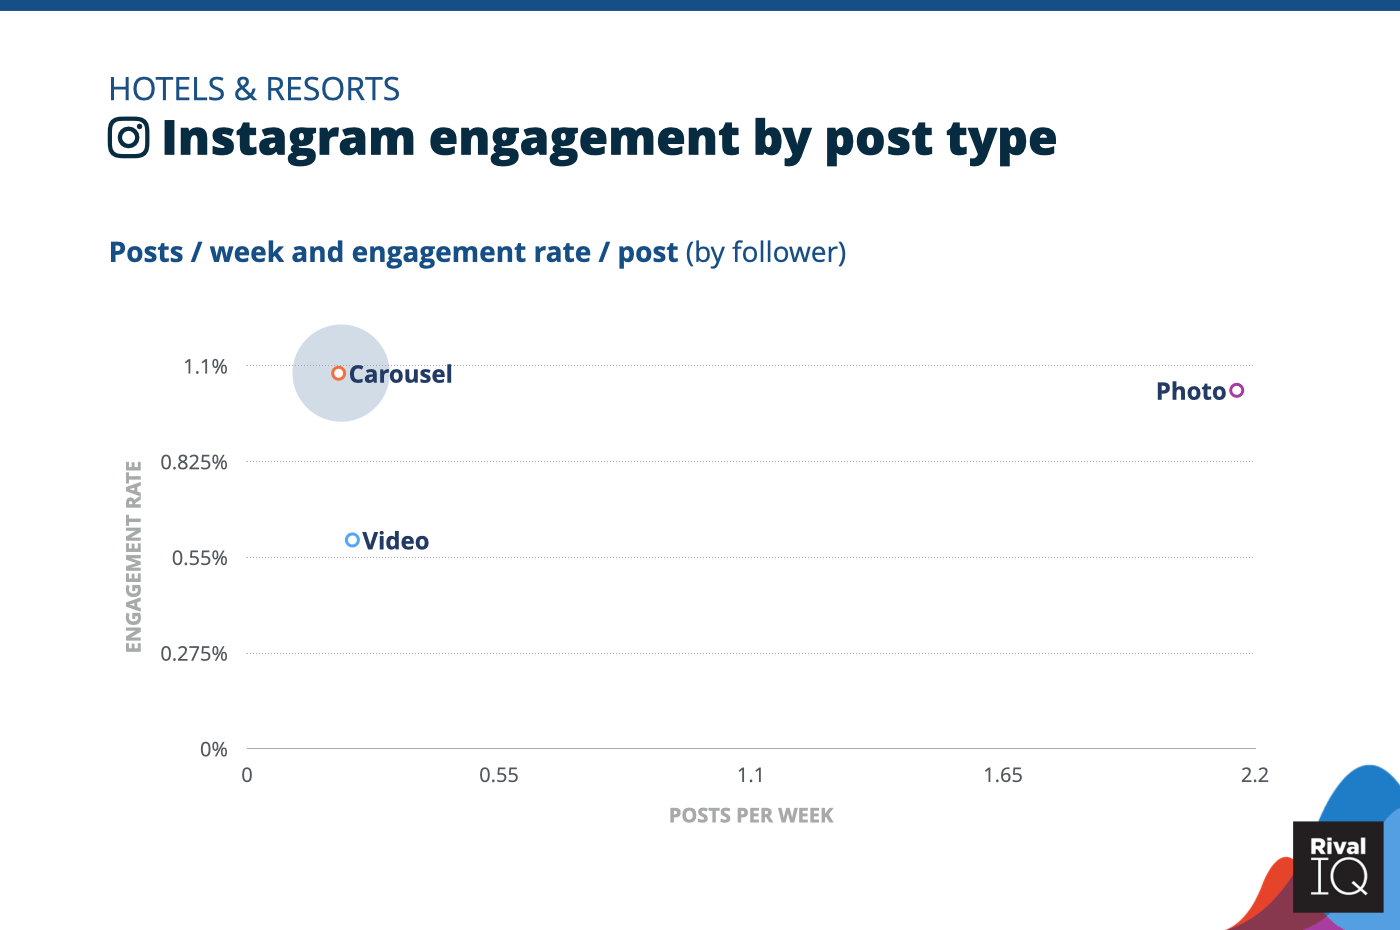
Instagram posts per week and engagement rate by post type, Hotels & Resorts
Hotels & Resorts saw an engagement rate increase for carousel posts this year, so they should consider combining more photos into carousels to boost their Insta engagement.
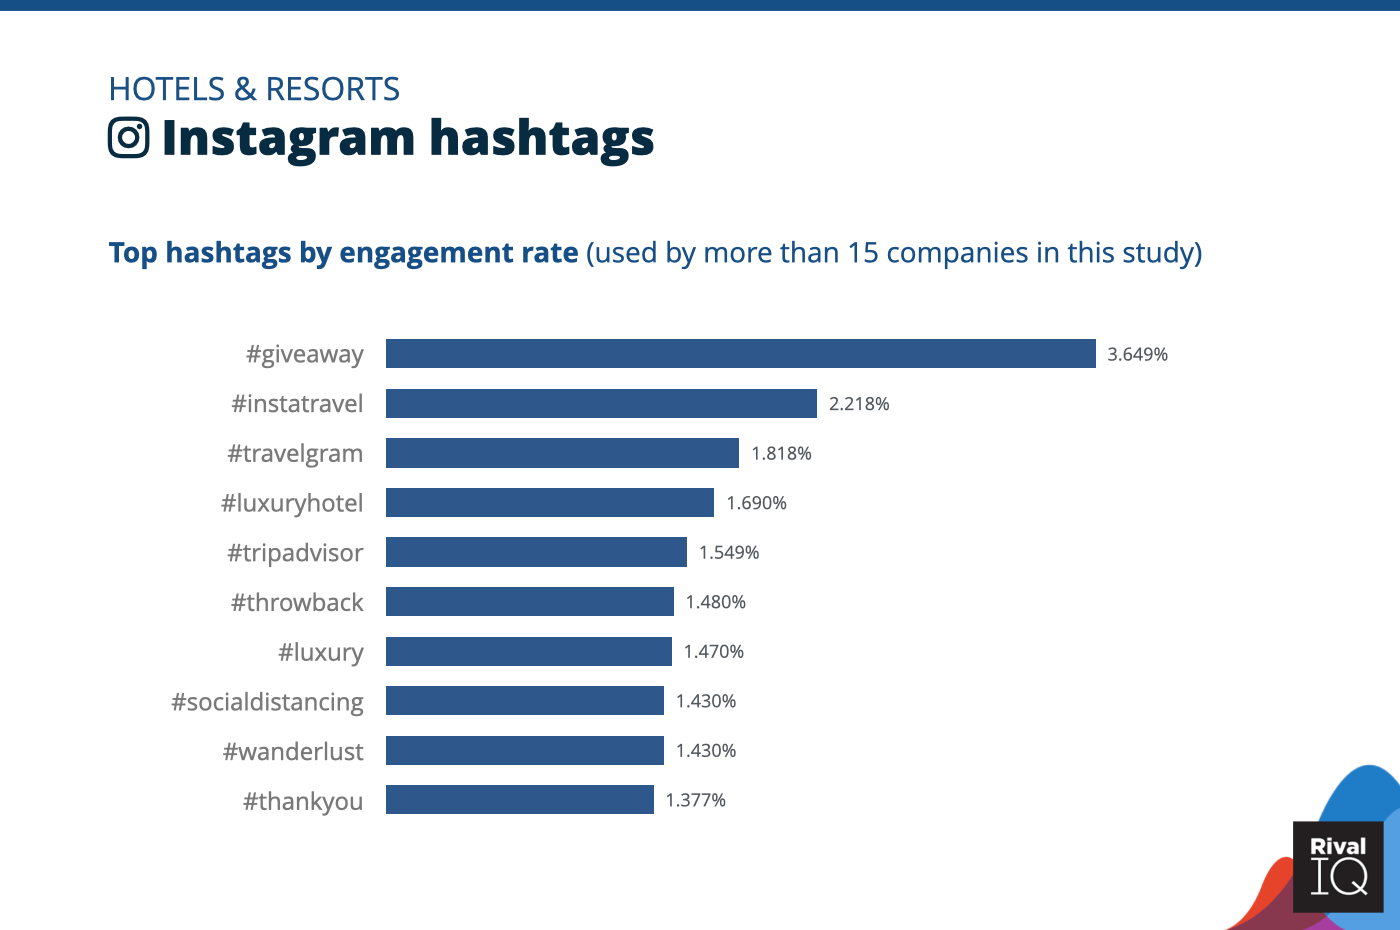
Top Instagram hashtags by engagement rate, Hotels & Resorts
Contests and giveaways captured the attention of many Hotels & Resorts followers this year on Instagram. Hashtags that helped followers imagine relaxing getaways like #throwback and #wanderlust also performed well.
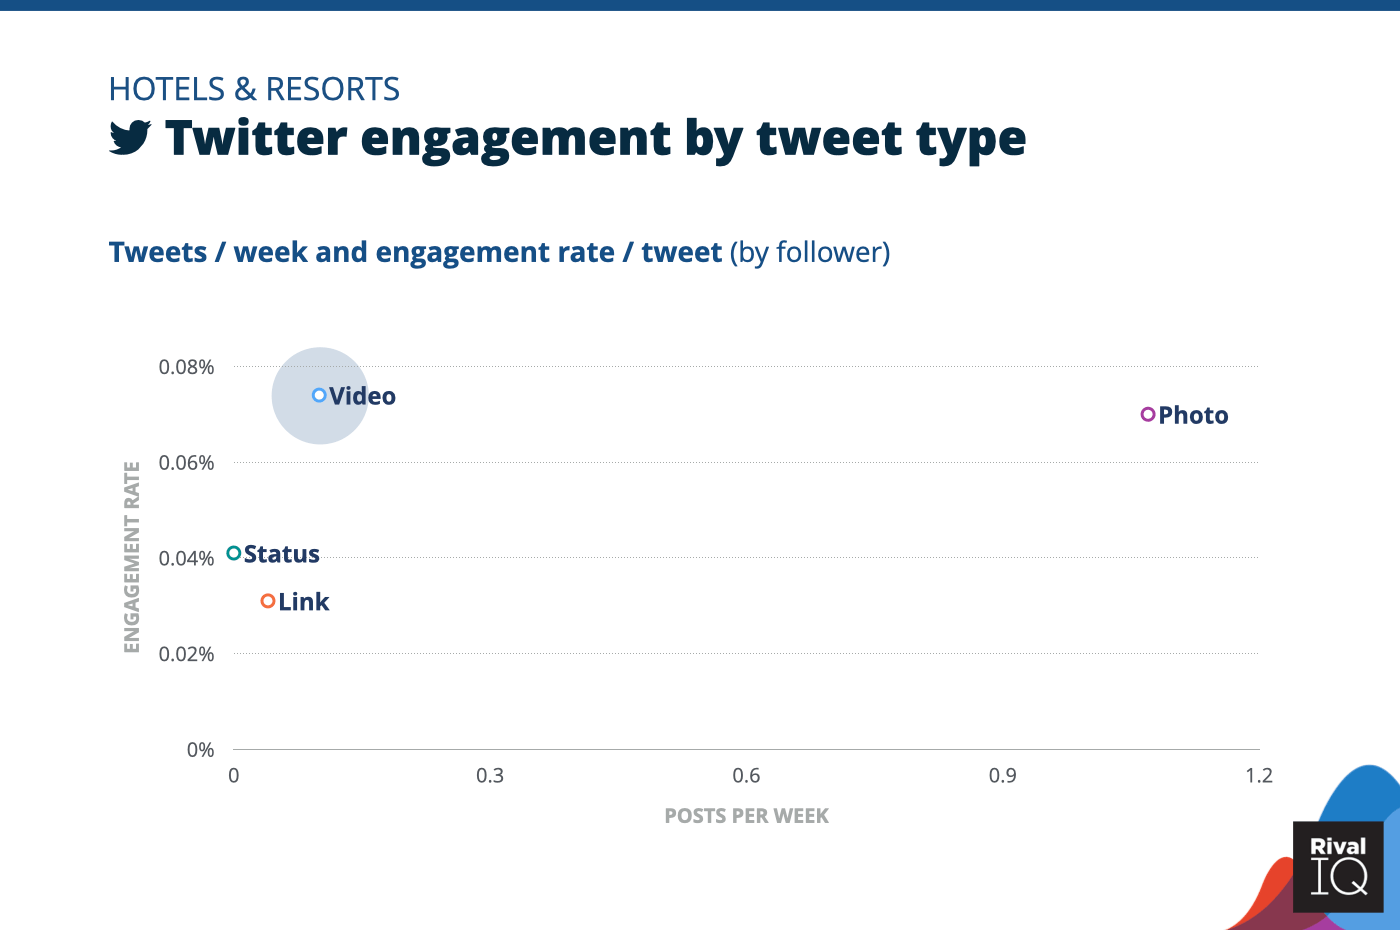
Twitter posts per week and engagement rate by tweet type, Hotels & Resorts
Hotels & Resorts saw an increase in engagement rates for both photo and video tweets this year despite a tough year for travel. These tweet types are an especially good place to put effort this year.
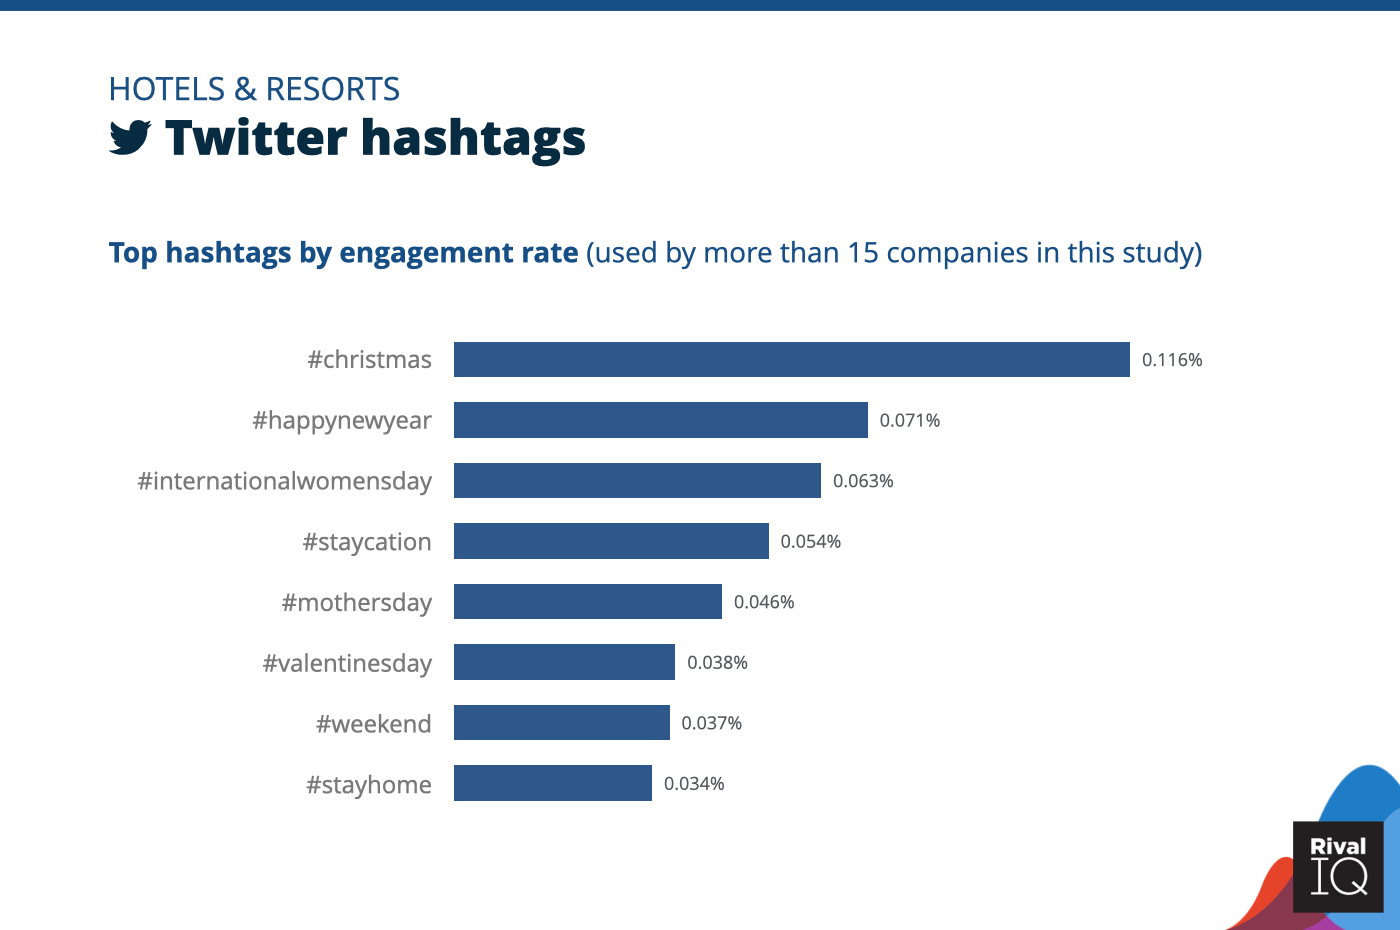
Top Twitter hashtags by engagement rate, Hotels & Resorts
Twitter hashtags for Hotels & Resorts were all about the holidays this year to help followers plan (or dream of) holiday getaways.
Influencer Social Media Benchmarks
Influencers doubled the median engagement rate on Facebook for a first-place win, and also killed it on Instagram with engagement rates 50% higher than the median. Their posting frequency trended below the median as well, suggesting they’ve dialed in how often to post on social.
Ideas to boost that engagement even more:
- Photos on Facebook are your best friend, so keep up the momentum there.
- Don’t be afraid of an Instagram #ad with great content.
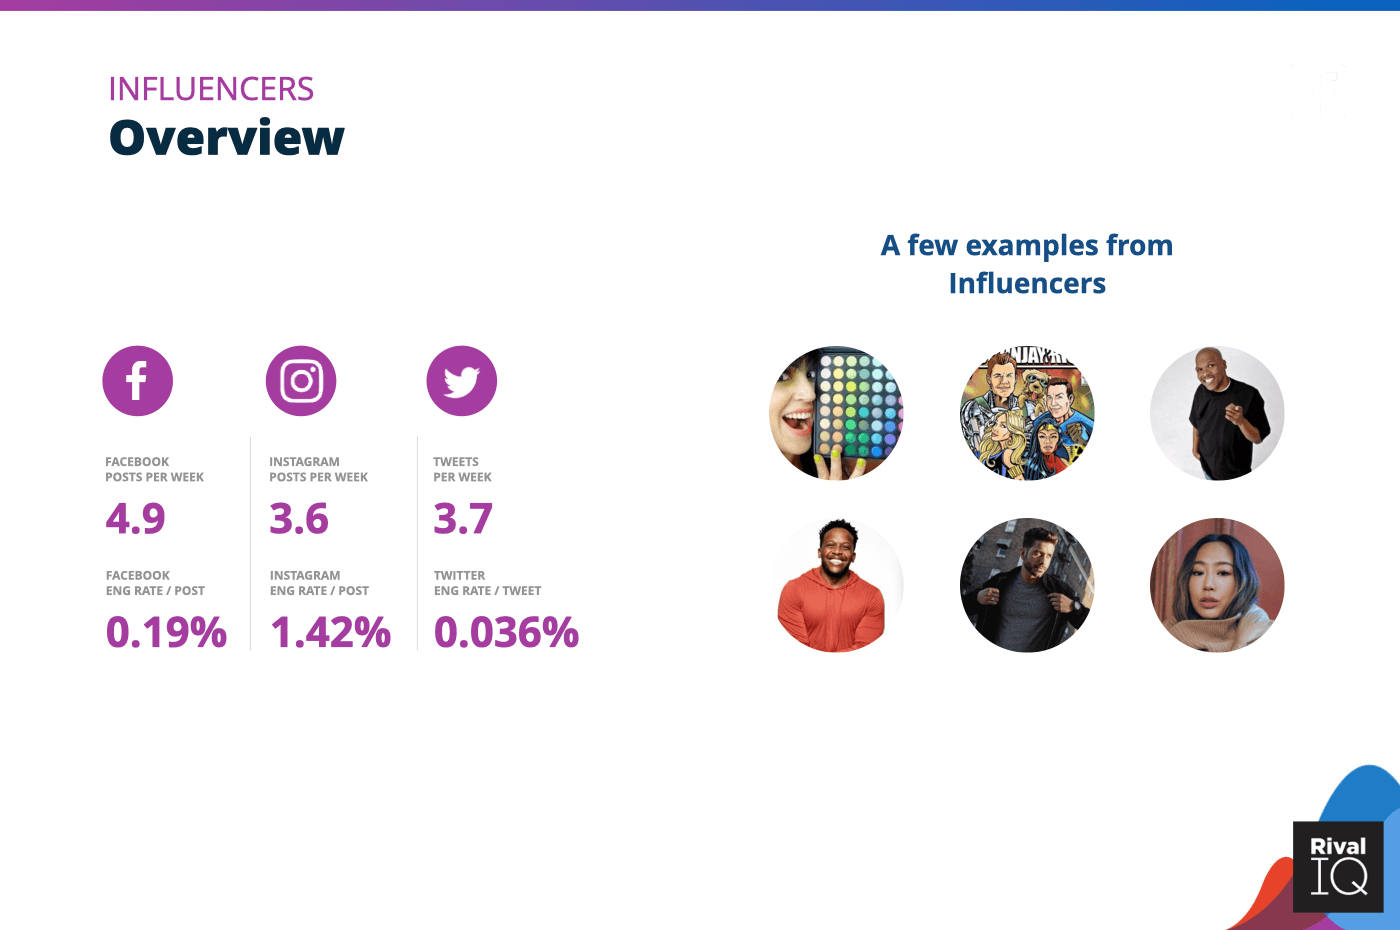
Overview of all benchmarks, Influencers
Notable Influencers include Johnjay and Rich, Big Boy, Alex Costa, and Aimee Song.
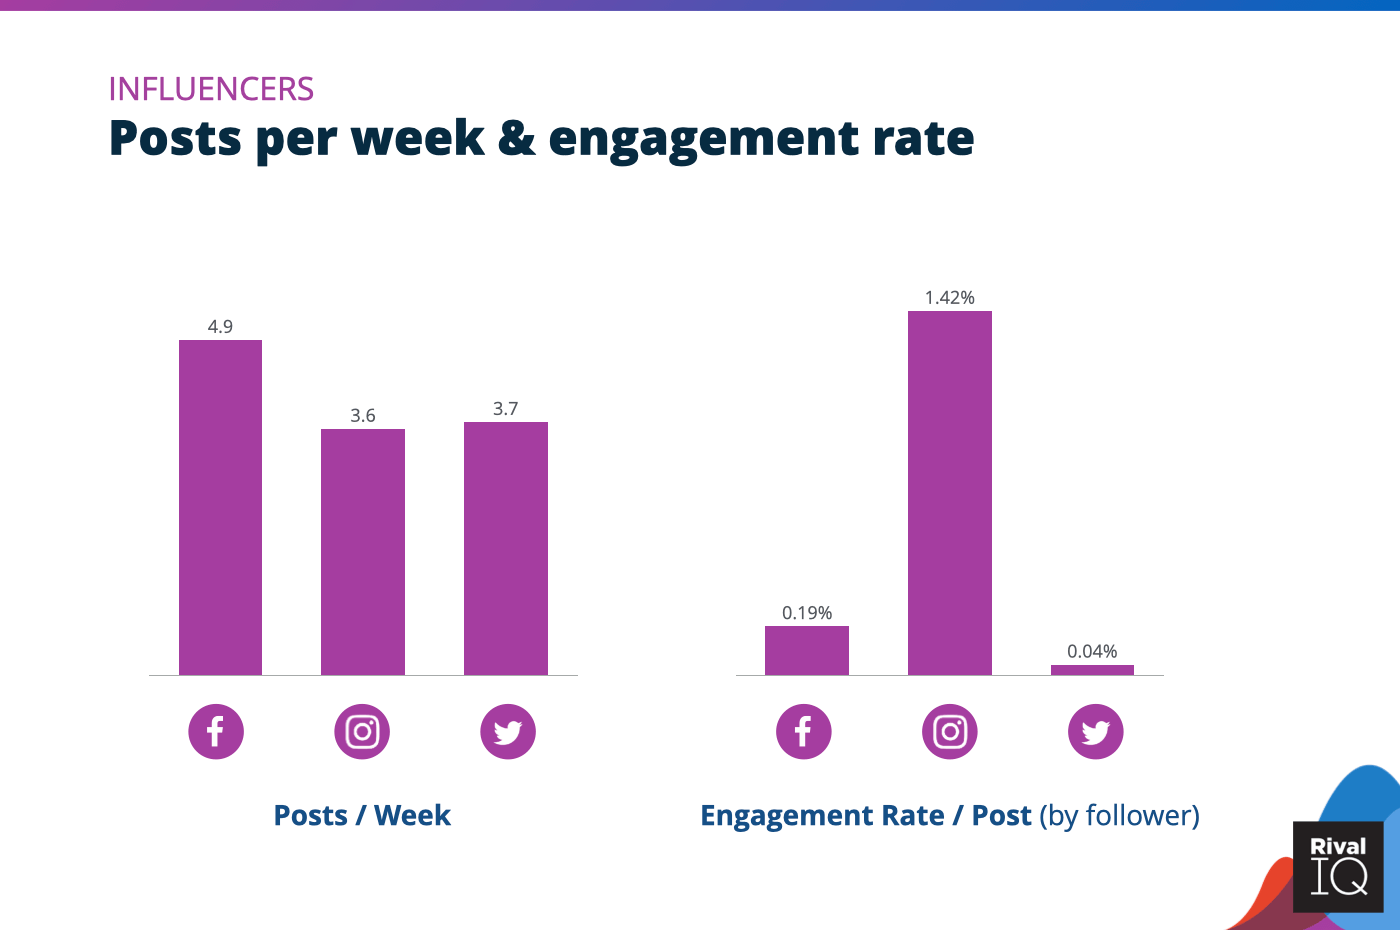
Posts per week and engagement rate per post across all channels, Influencers
Influencers won the day on Facebook once again with 2x the median engagement rate.
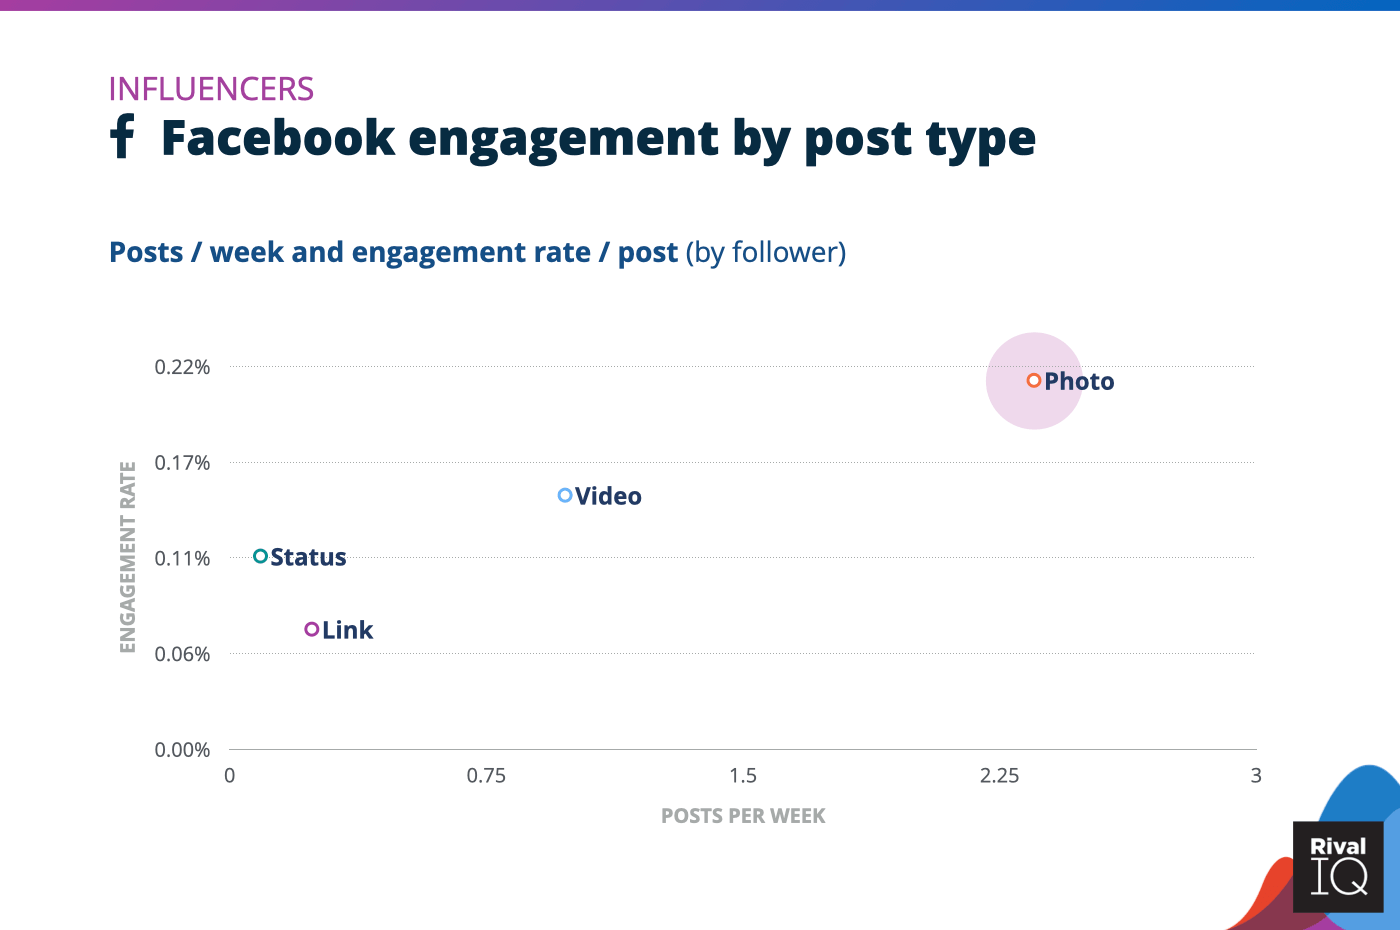
Facebook posts per week and engagement rate by post type, Influencers
A 30% increase in photo engagement helped Influencers boost Facebook engagement rates this year.
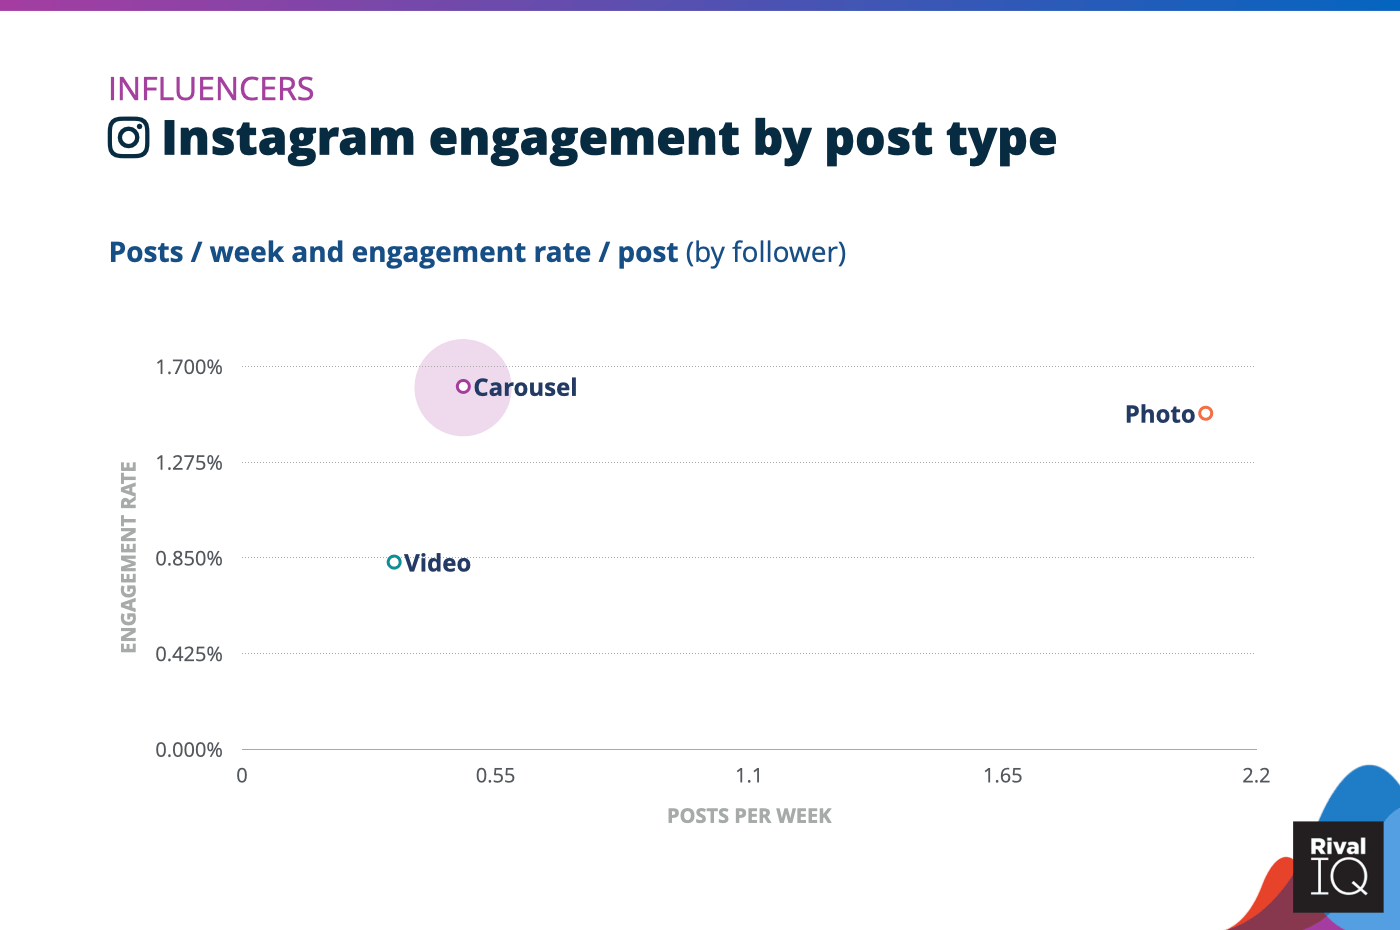
Instagram posts per week and engagement rate by post type, Influencers
Influencers saw a decrease in engagement rates for every post type on Instagram this year, and might want to put a little more energy behind high-performing carousels.
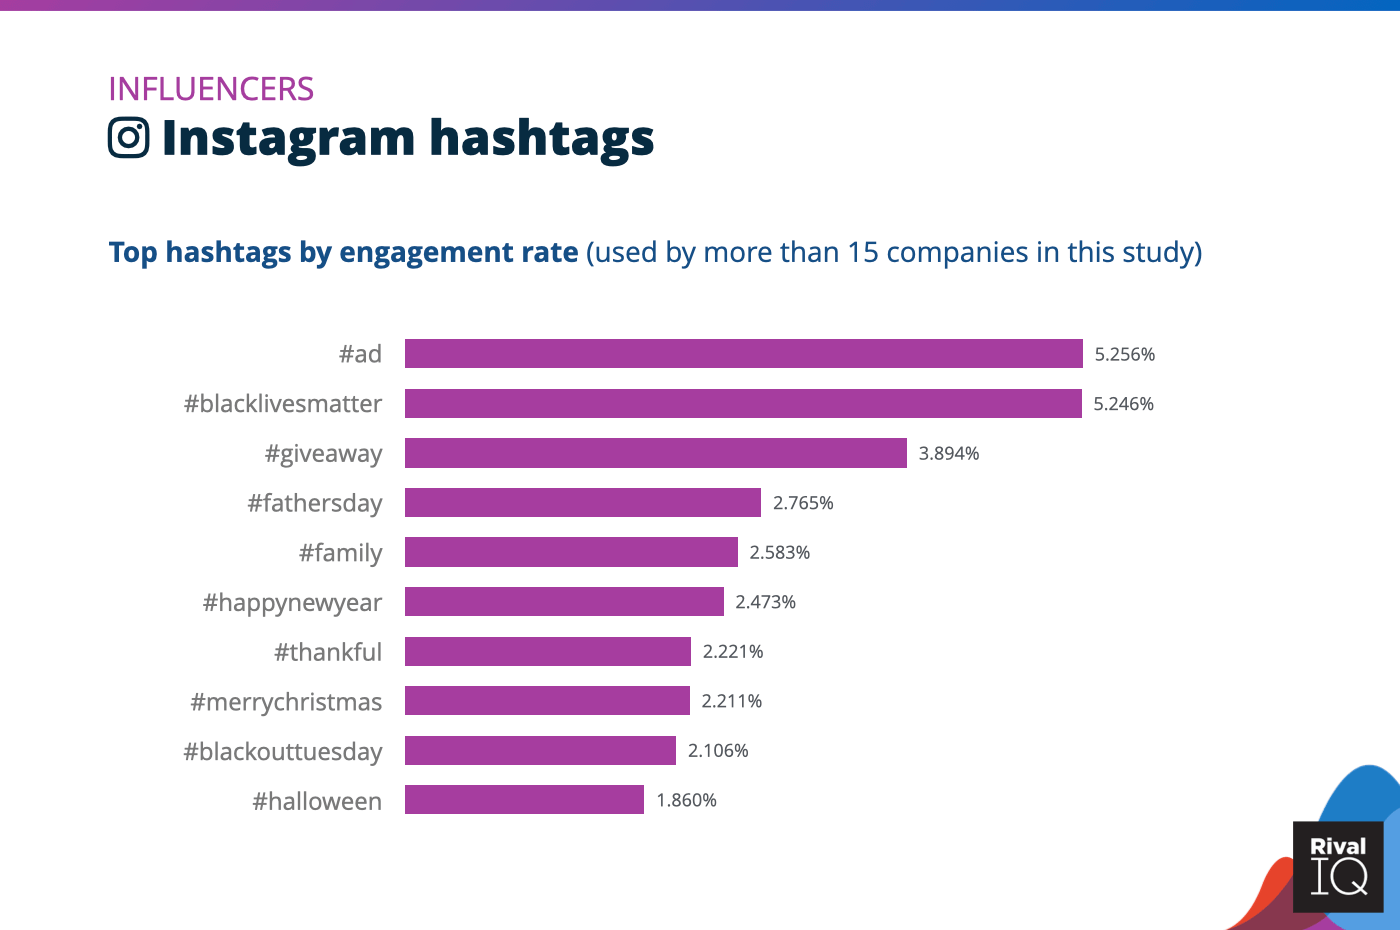
Top Instagram hashtags by engagement rate, Influencers
Influencers saw stellar engagement rates on Instagram this year with hashtags ranging from commercial (#ad) to activist (#blacklivesmatter).
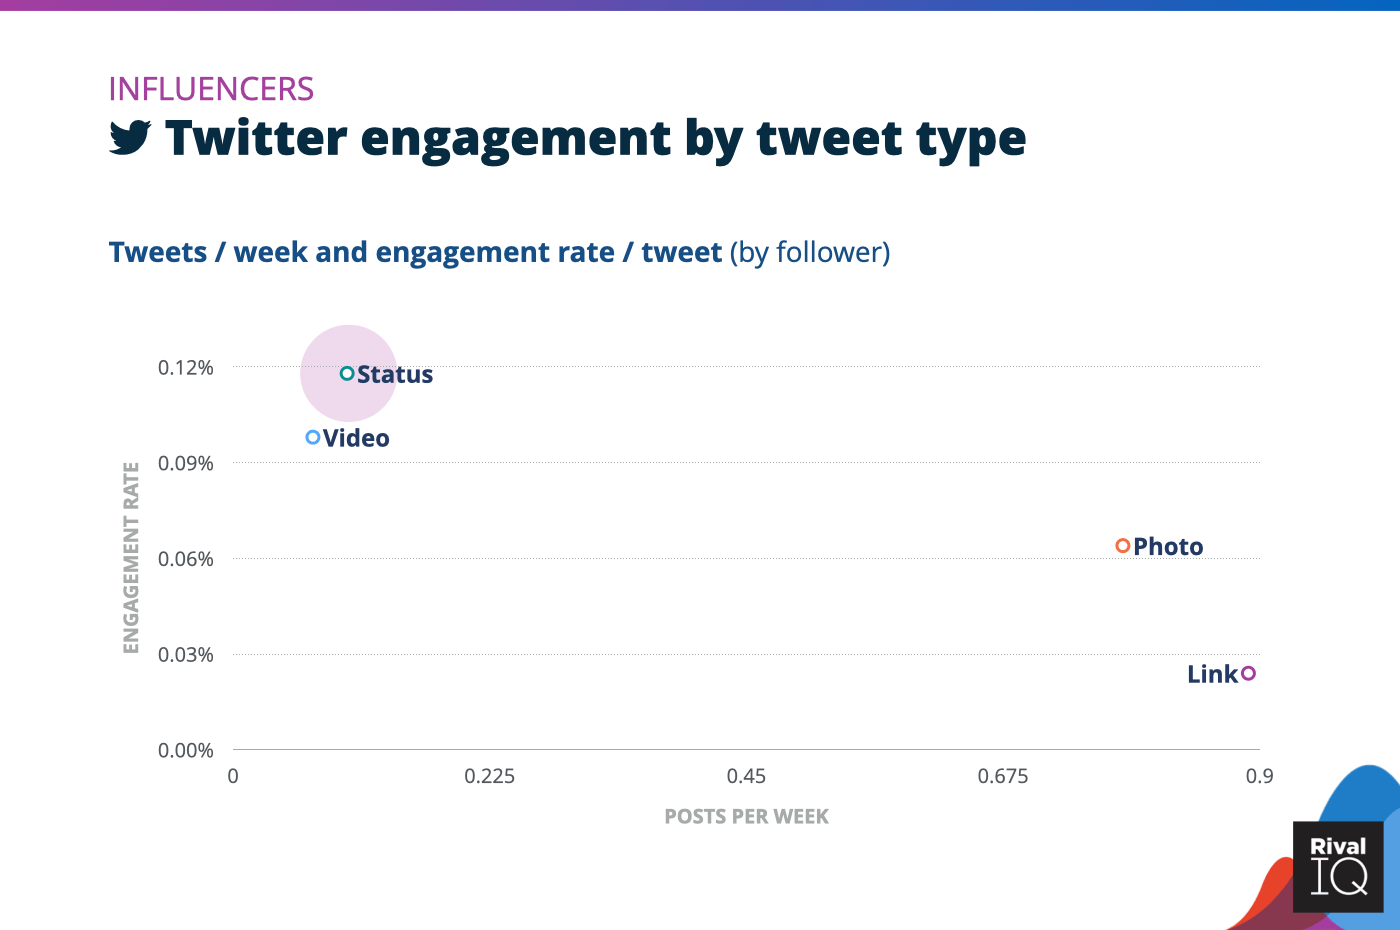
Twitter posts per week and engagement rate by tweet type, Influencers
Status updates were the most engaging tweet type for Influencers this year but were tweeted infrequently.
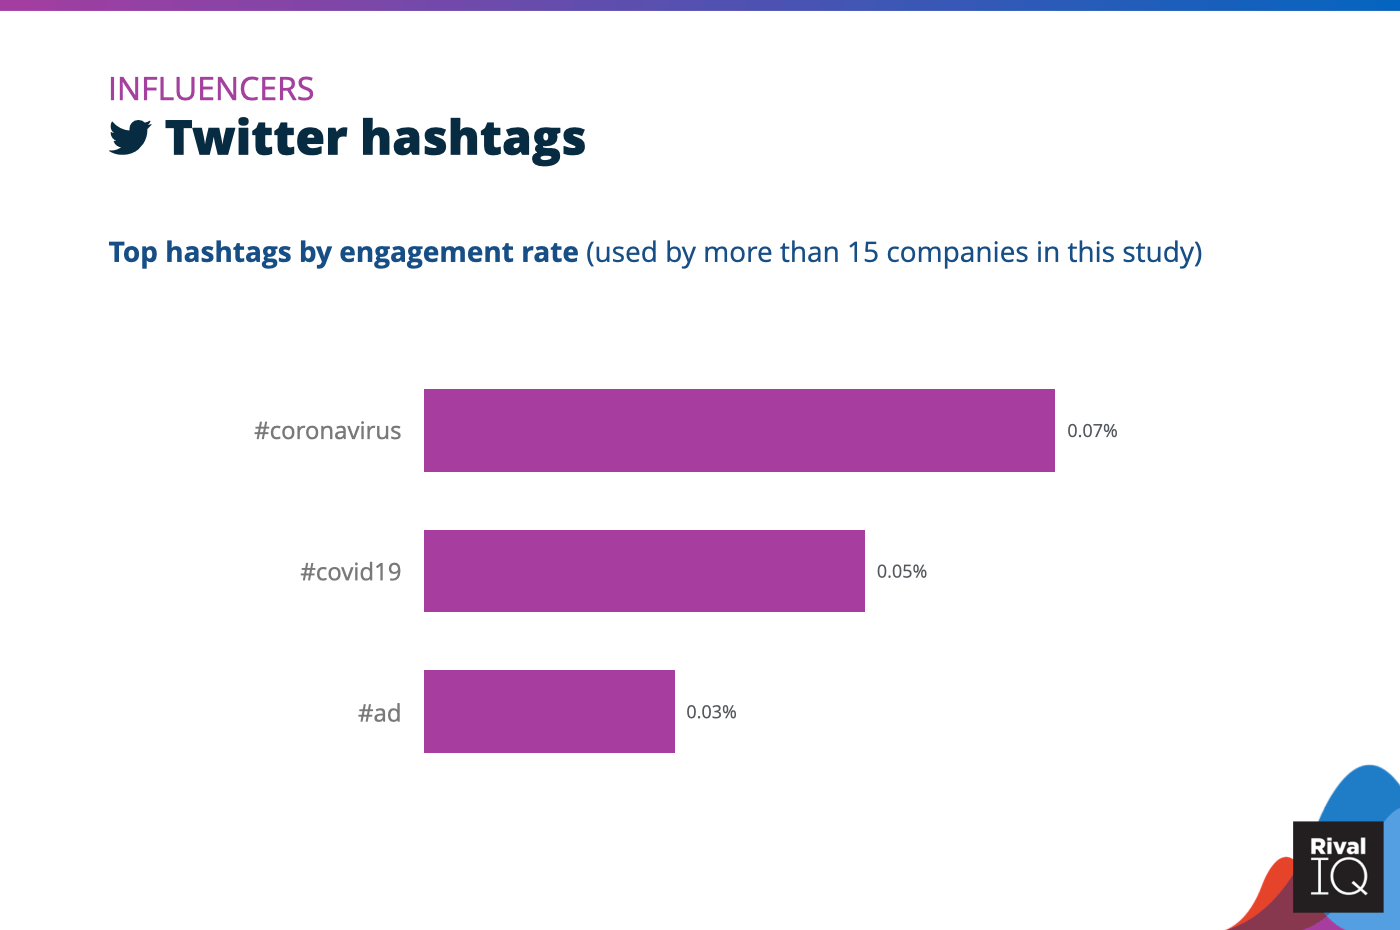
Top Twitter hashtags by engagement rate, Influencers
Influencers saw diverse hashtag success on Twitter this year with just three hashtags shared between 15 or more influencers on Twitter. Interesting to see #ad working better for Influencers on Instagram than on Twitter.
Media Social Media Benchmarks
Media saw the highest posting frequency again this year while still garnering below-median engagement rates. Posting so often drives down any industry’s engagement rates because there are only so many impressions to go around.
A few ideas to improve engagement rates:
- Followers loved the #throwback, so don’t be afraid to go beyond current events.
- Visual posts like photos and videos topped the Media charts for every social channel, so try shaking up the links and statuses.
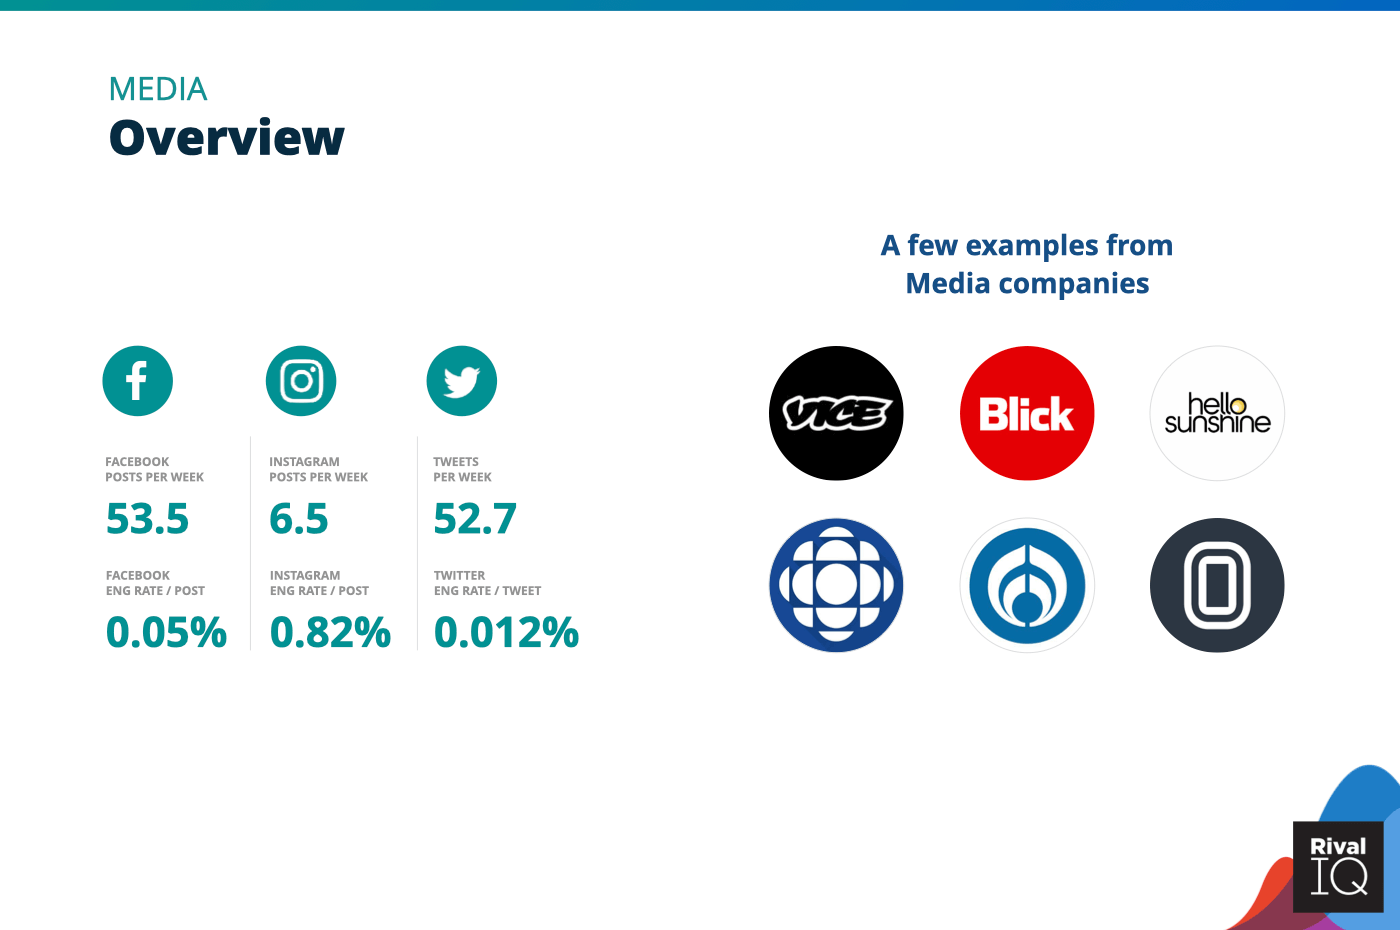
Overview of all benchmarks, Media
Notable Media brands include Vice, Blick, Hello Sunshine, CBC Radio, Radio Formula, and Overtime.
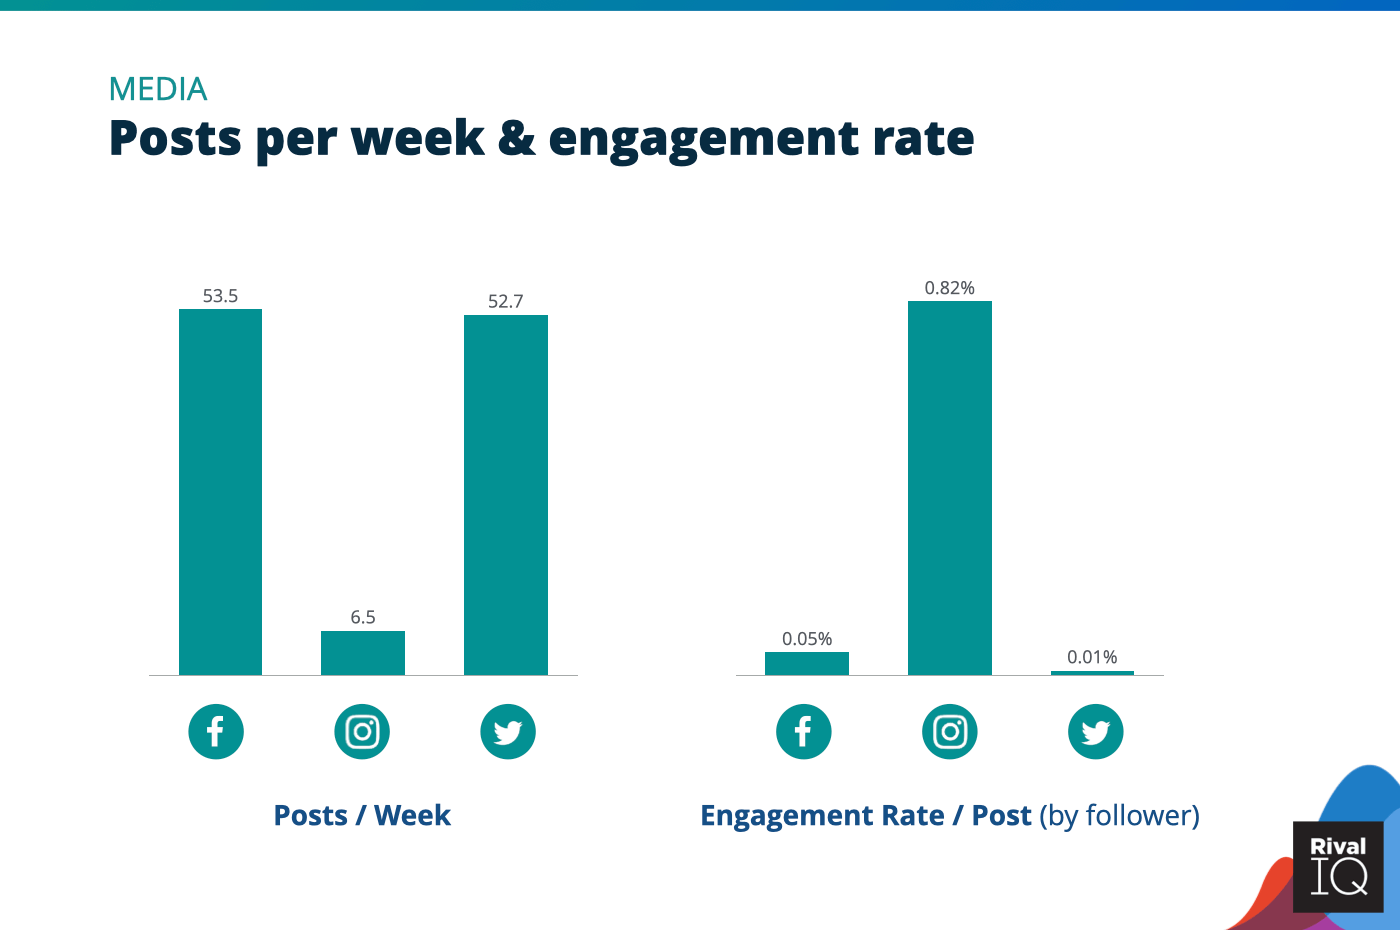
Posts per week and engagement rate per post across all channels, Media
As usual, Media brands had a lot to say on social this year, especially on Facebook and Twitter.

Facebook posts per week and engagement rate by post type, Media
Facebook engagement rates by post type stayed pretty consistent for Media brands this year with the exception of links, which dropped in engagement.
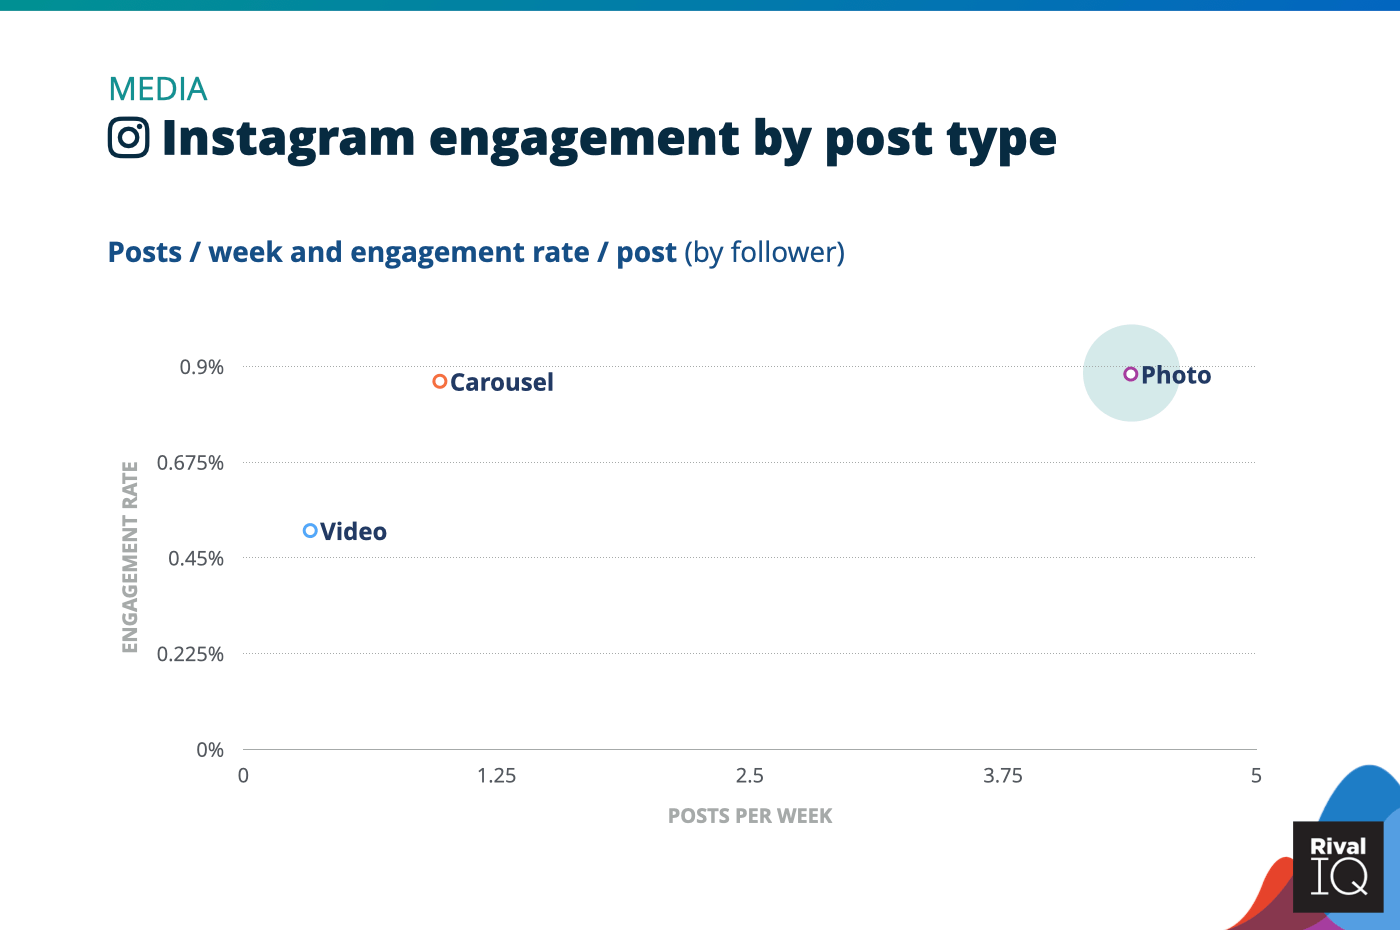
Instagram posts per week and engagement rate by post type, Media
Media ranked below the median engagement rate on Instagram this year despite posting twice as often as the median industry. Try bulking up carousel posting to get ahead on this ultra-visual channel.
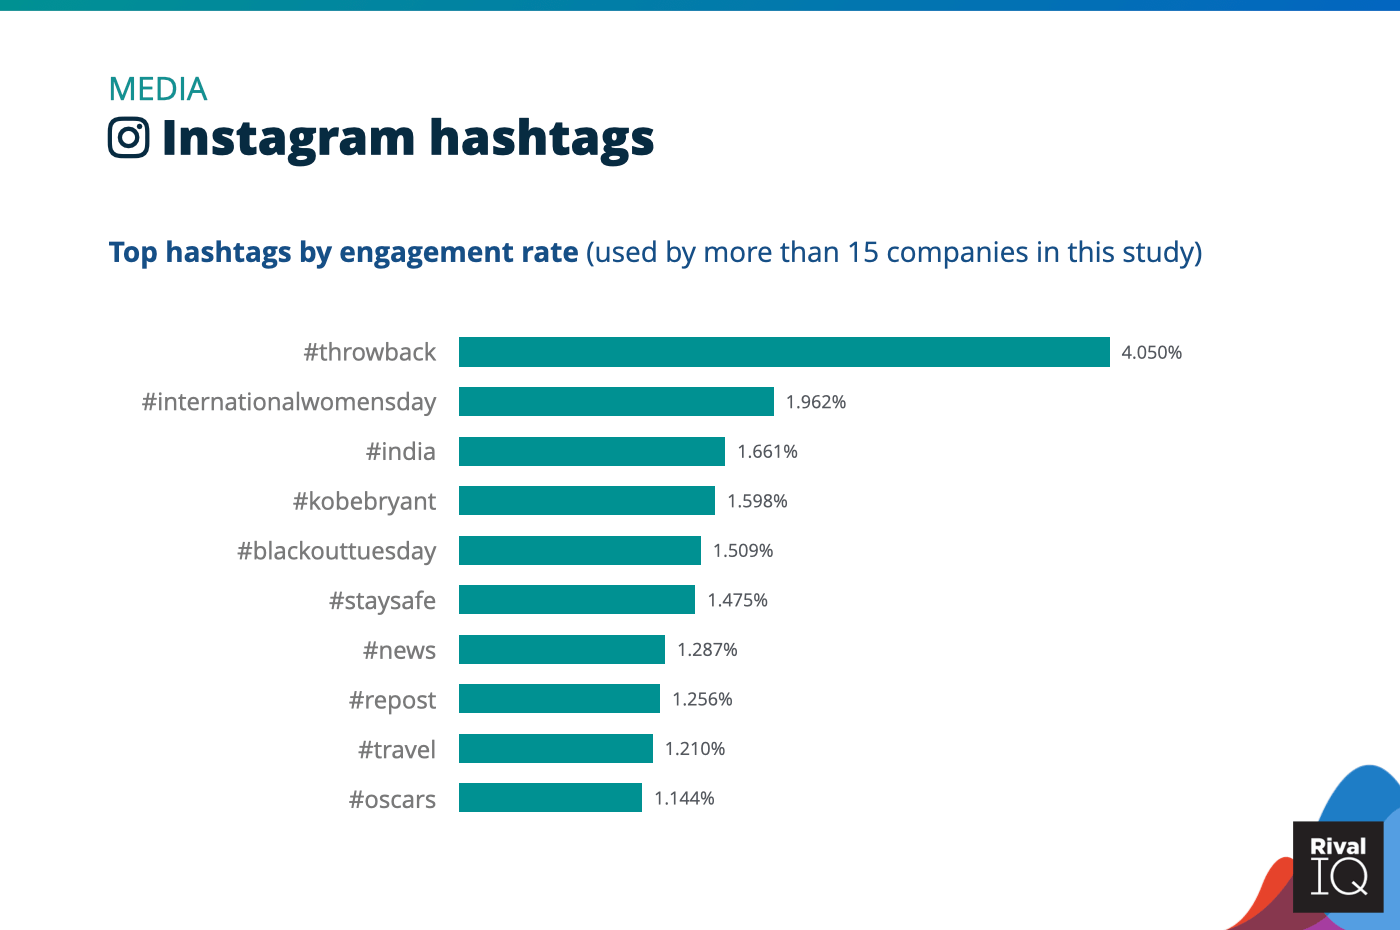
Top Instagram hashtags by engagement rate, Media
Media brands saw twice the engagement rates of the next most engaging hashtag by throwing it back on Instagram this year.
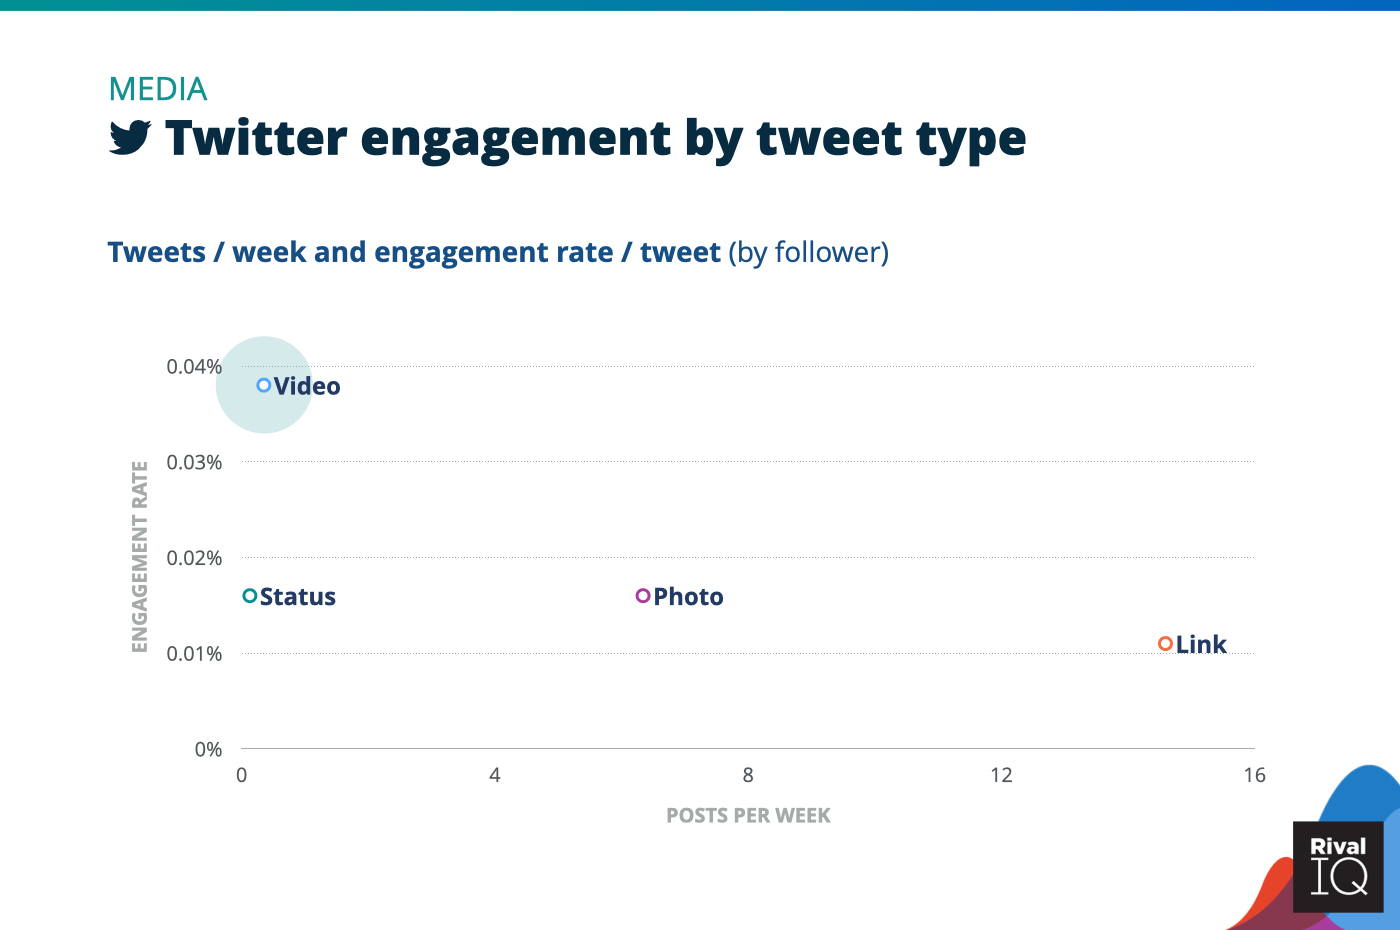
Twitter posts per week and engagement rate by tweet type, Media
Media brands dropped their photo tweet type frequency this year and put more muscle behind posting links on Twitter. Media brands shouldn’t sleep on video–they perform 3x as well as other tweet types.
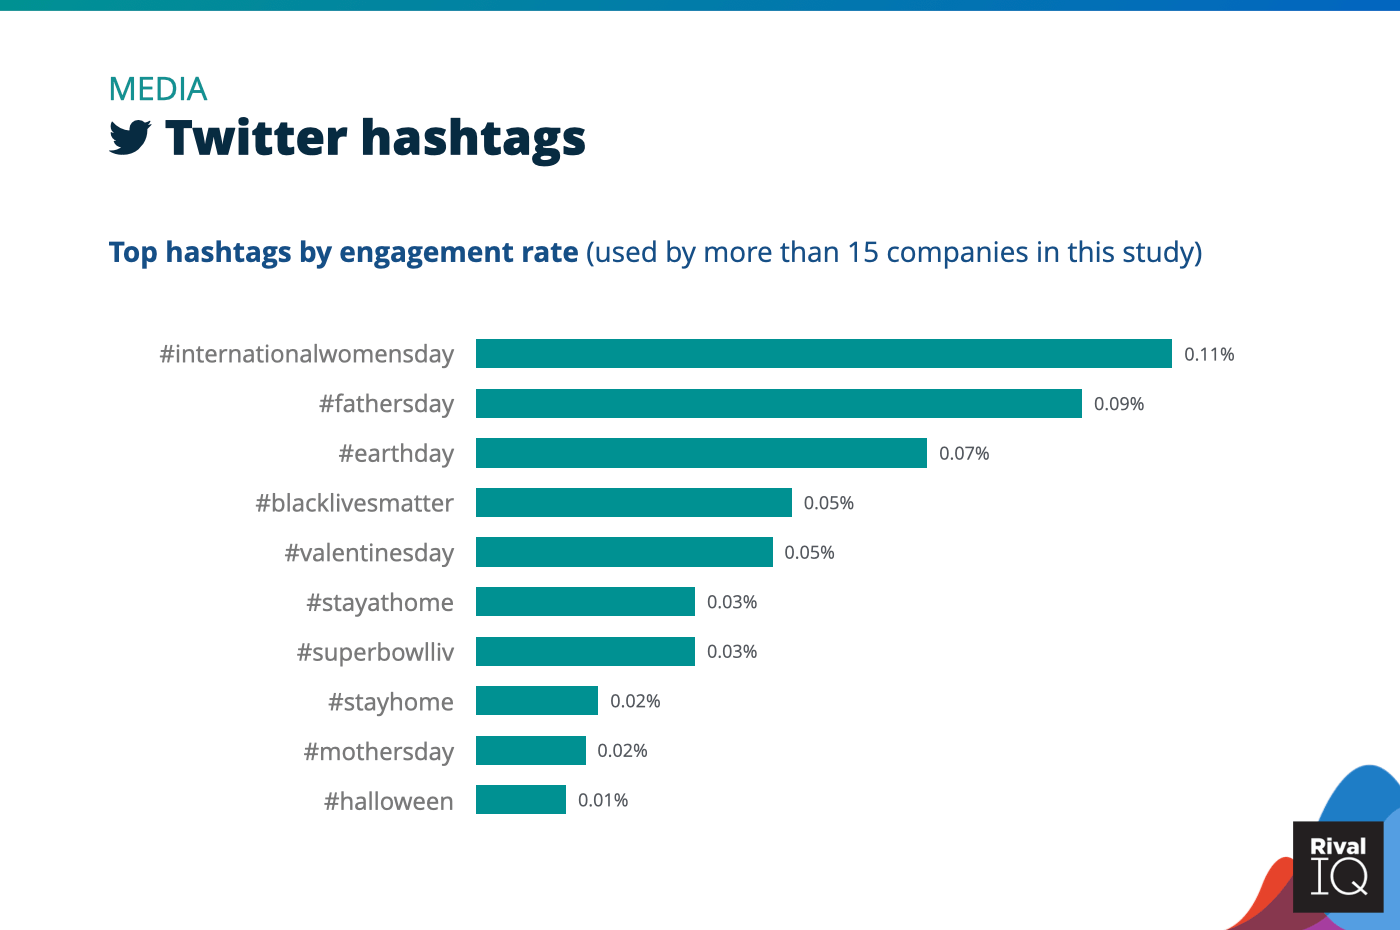
Top Twitter hashtags by engagement rate, Media
More than half of Media’s most engaging hashtags on Twitter were about holidays.
Nonprofit Social Media Benchmarks
Nonprofits saw above-median engagement rates across all social channels this year, with flat engagement on Facebook and Twitter and a slight dip on Instagram.
A few ideas for Nonprofits:
- Try experimenting with posting frequency, especially on Facebook and Twitter, where Nonprofits are well above the frequency median.
- Video is a sure bet on Facebook and Twitter, so concentrate efforts there if video is on the strategy list this year.
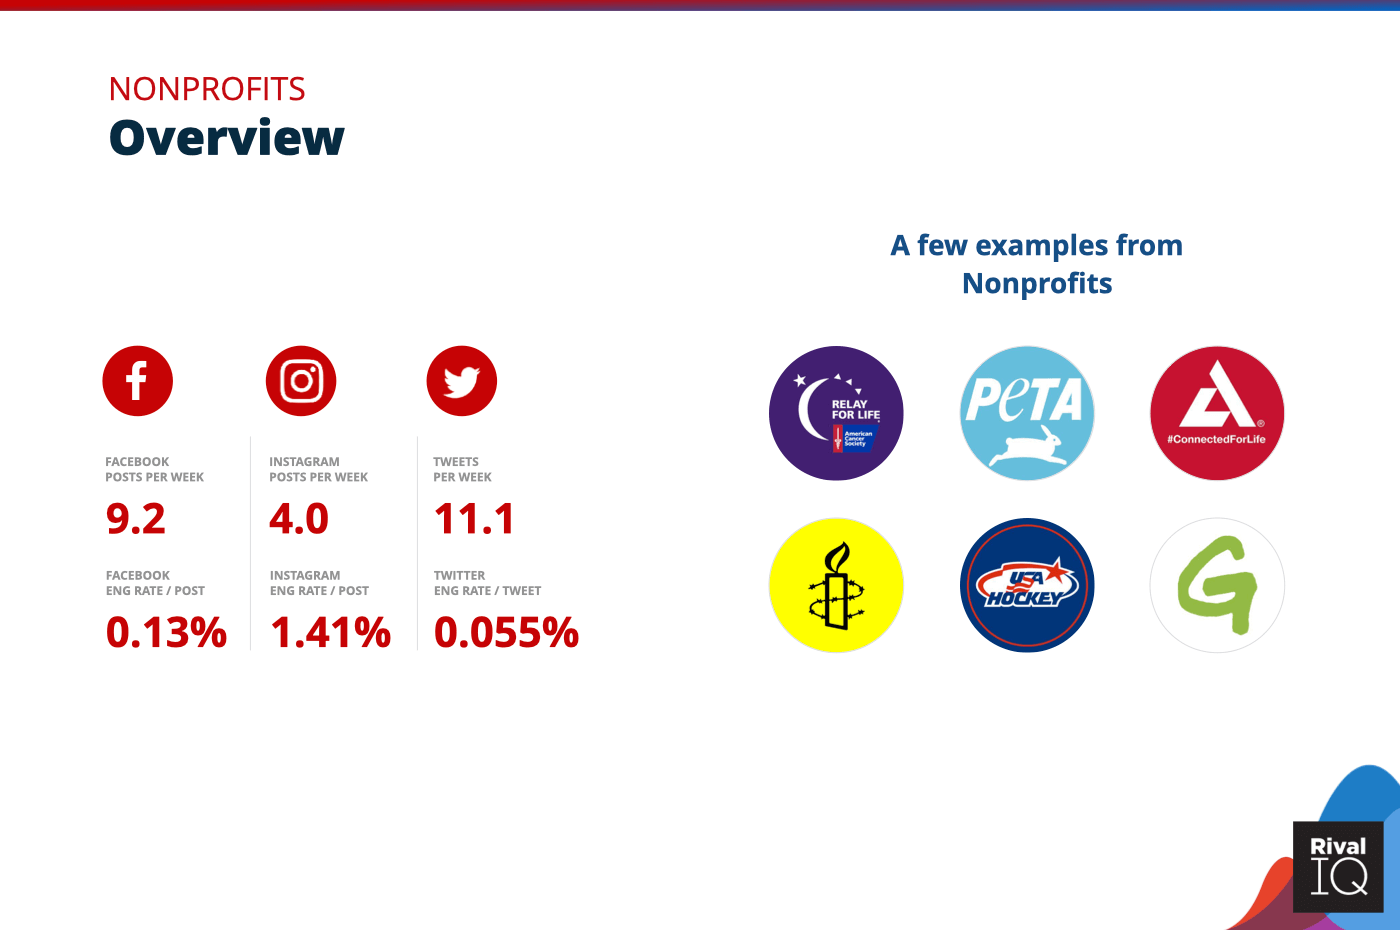
Overview of all benchmarks, Nonprofits
Notable Nonprofits include Relay for Life, PETA, American Diabetes Association, Amnesty International USA, USA Hockey, and Greenpeace.
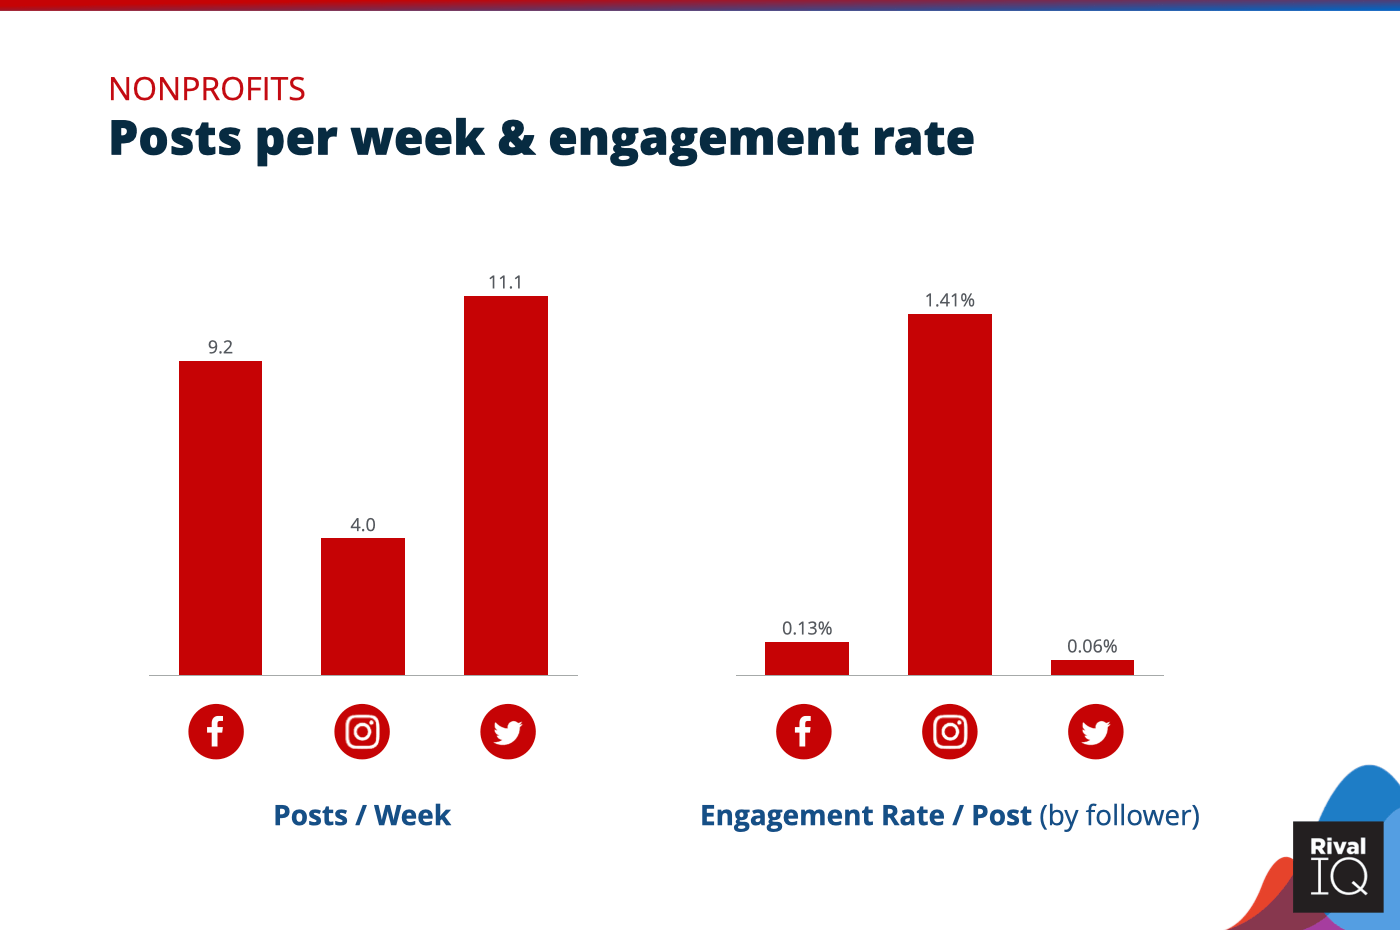
Posts per week and engagement rate per post across all channels, Nonprofits
Nonprofits came in above median engagement rates with at or above the posting frequency median on all three channels this year, suggesting their considerable efforts are being rewarded.
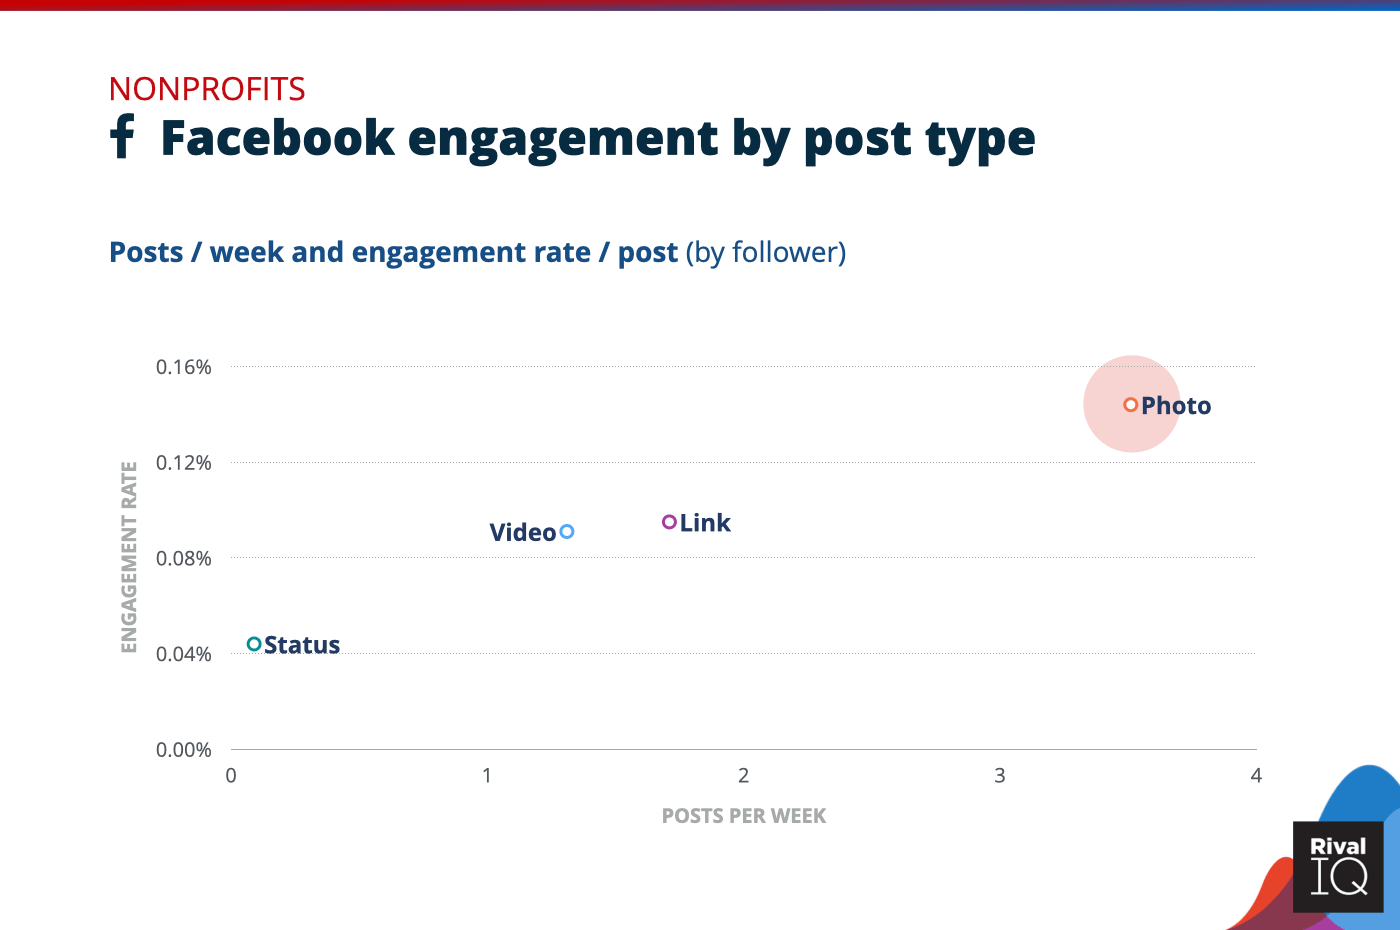
Facebook posts per week and engagement rate by post type, Nonprofit
Nonprofits increased their photo and video posts on Facebook this year and saw increased engagement rates for both.
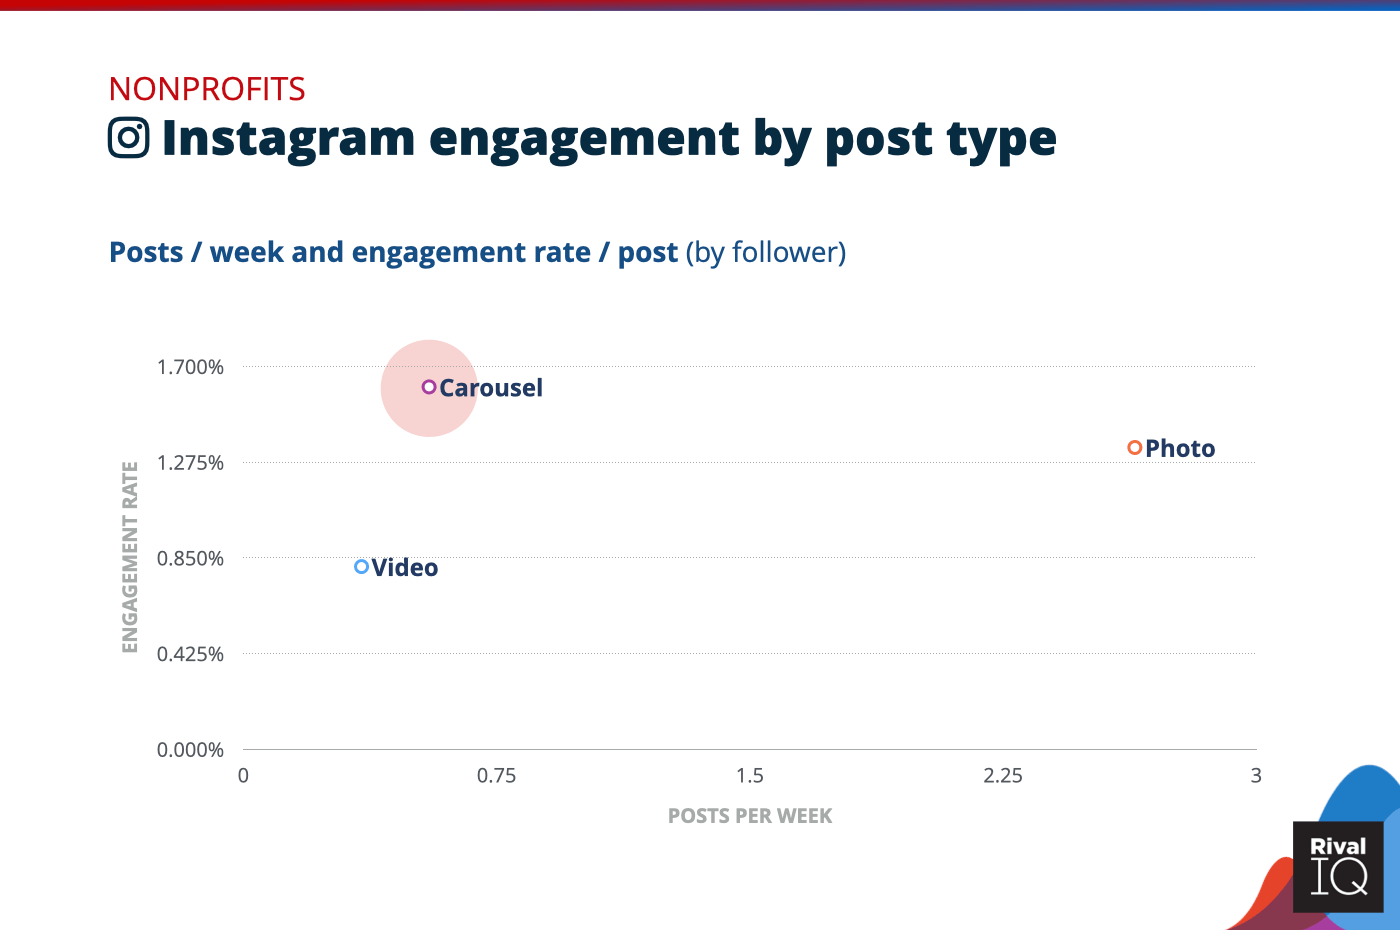
Instagram posts per week and engagement rate by post type, Nonprofits
Carousels performed twice as well as video posts for Nonprofits on Instagram this year, so that’s a great place for social media efforts.
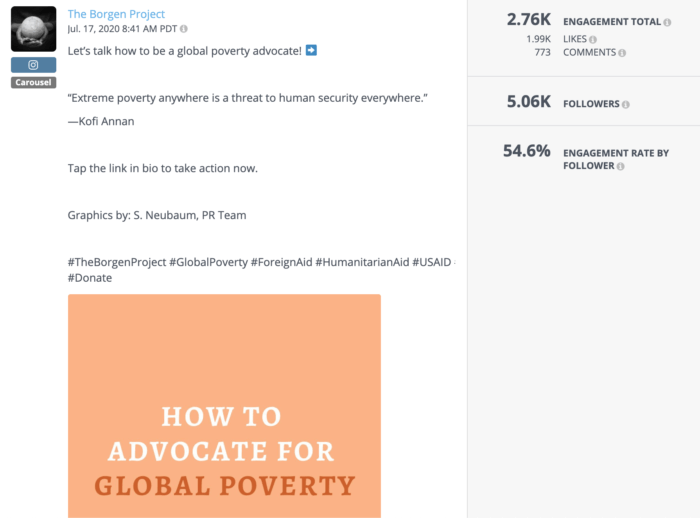
Nonprofits like The Borgen Project made great use of carousels to educate followers using the extra real estate from multiple views.
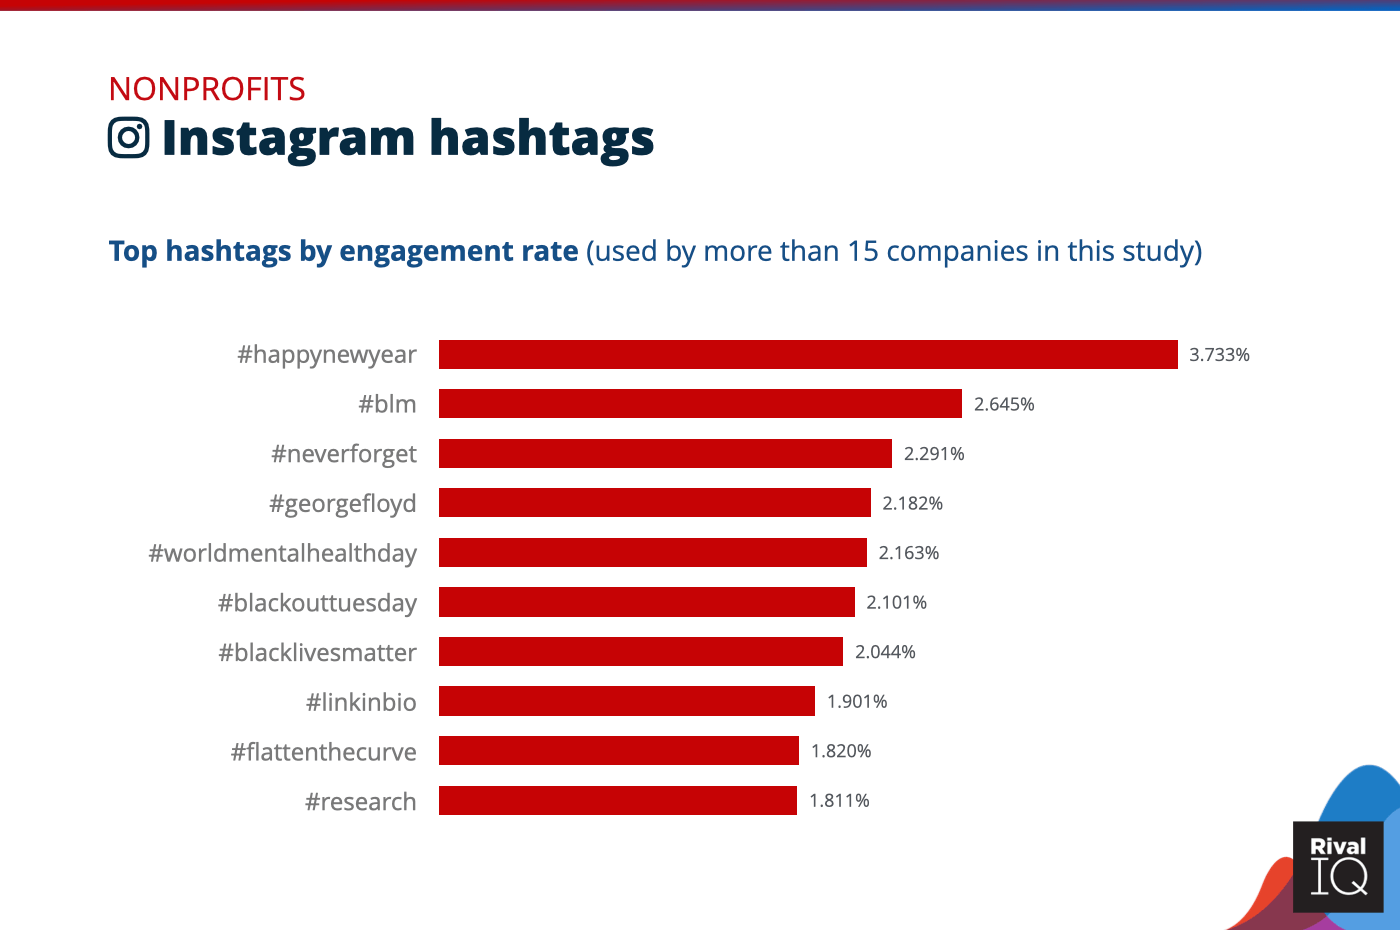
Top Instagram hashtags by engagement rate, Nonprofits
Nonprofits like American Ballet Theatre saw great success with #happynewyear thanks to fun photos and videos to help their followers celebrate.
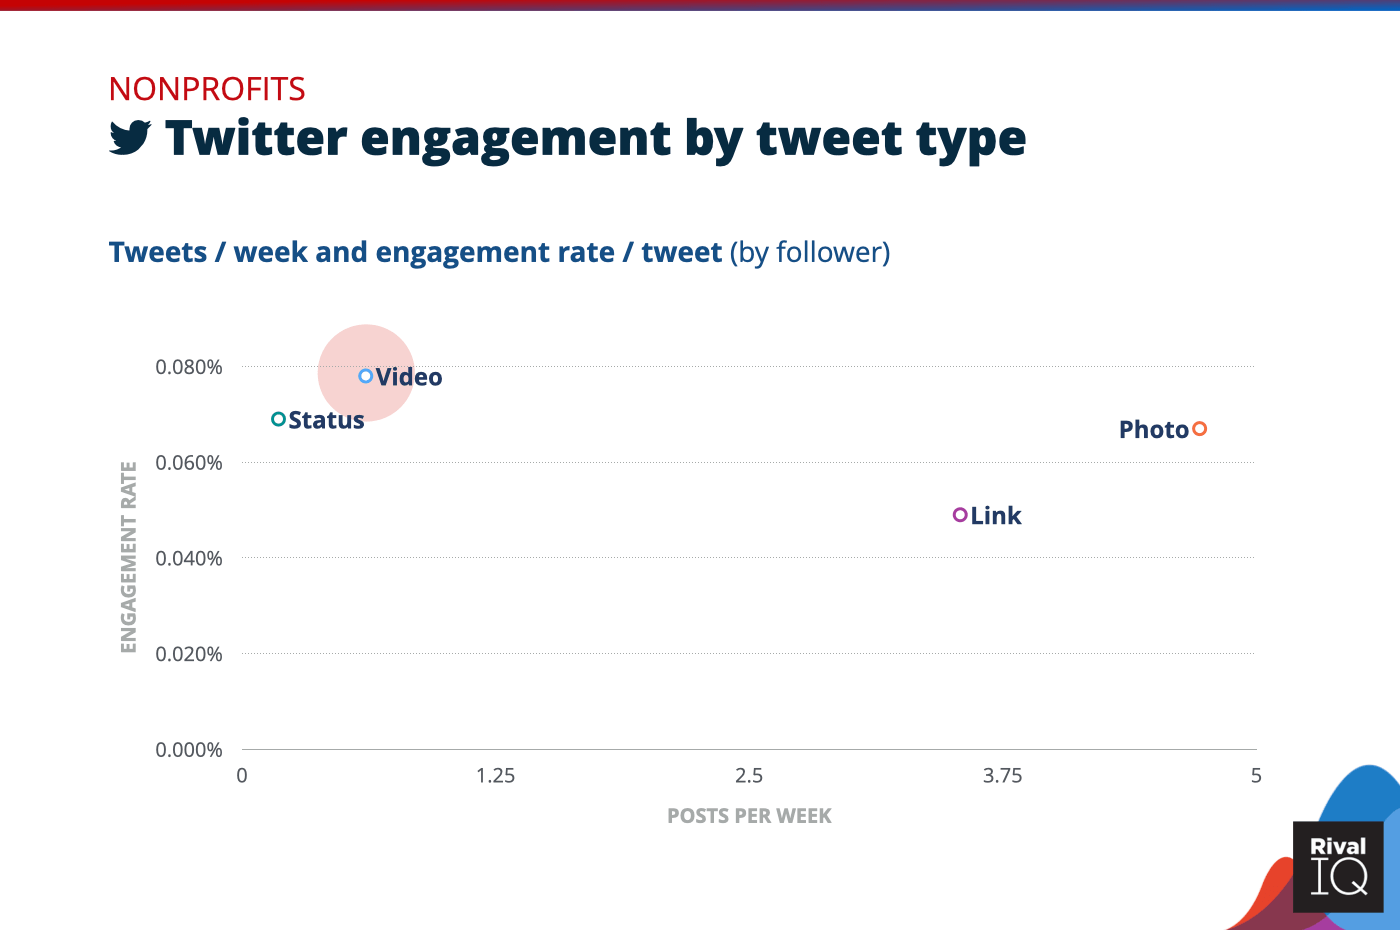
Twitter posts per week and engagement rate by tweet type, Nonprofits
Status updates and photos performed slightly better for Nonprofits on Twitter this year, but videos still came out on top for engagement rates.
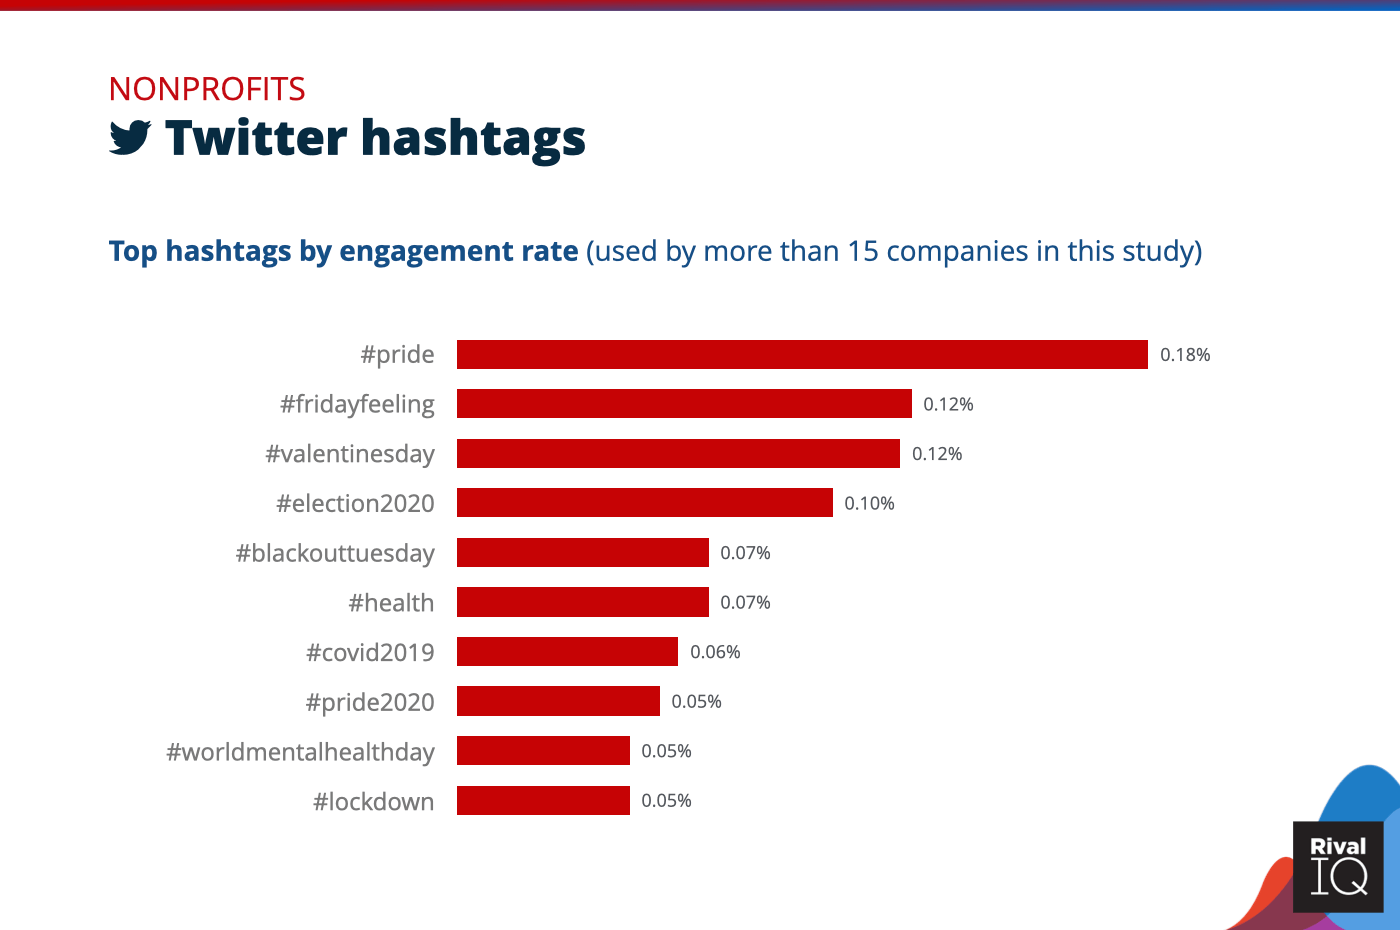
Top Twitter hashtags by engagement rate, Nonprofits
No surprise that Nonprofits saw success on Twitter keeping their followers up to date on the latest coronavirus news with hashtags like #covid2019 and #lockdown.
Retail Social Media Benchmarks
Retail saw a bump in Twitter engagement rates this year that helped these brands come in right at the median for this channel, while continuing to lag on Instagram and Facebook.
Some ideas for improving social performance this year:
- Experiment with posting frequency, and try bulking up how often you tweet.
- Stick with what works for hashtags, like shopping-themed hashtags on Insta and holidays on Twitter.
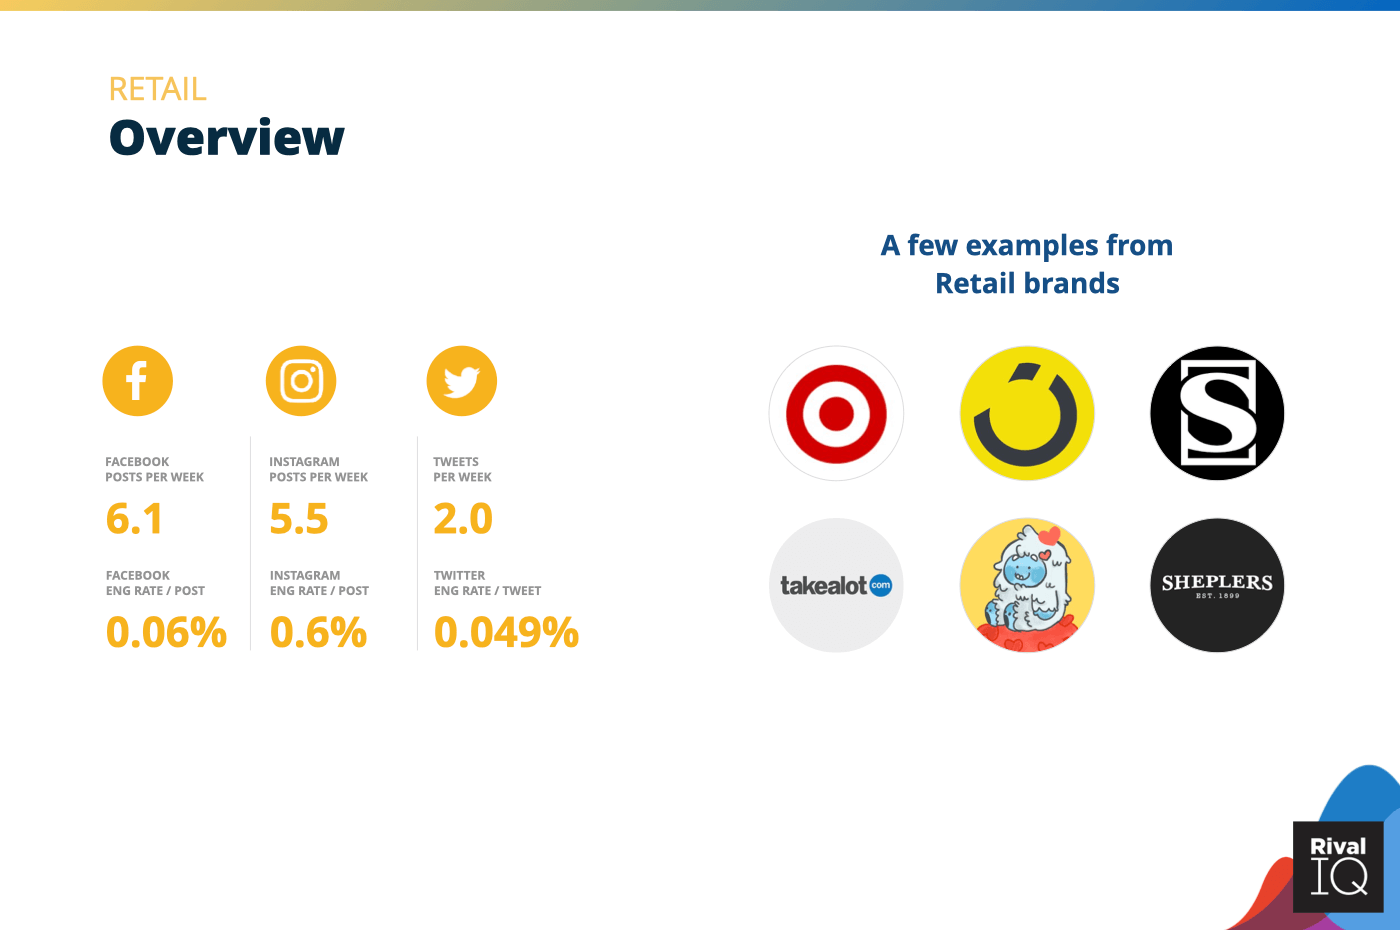
Overview of all benchmarks, Retail
Notable Retail brands include Target, noon.com, Sideshow, Takealot.com, TheYETEE, and Sheplers.
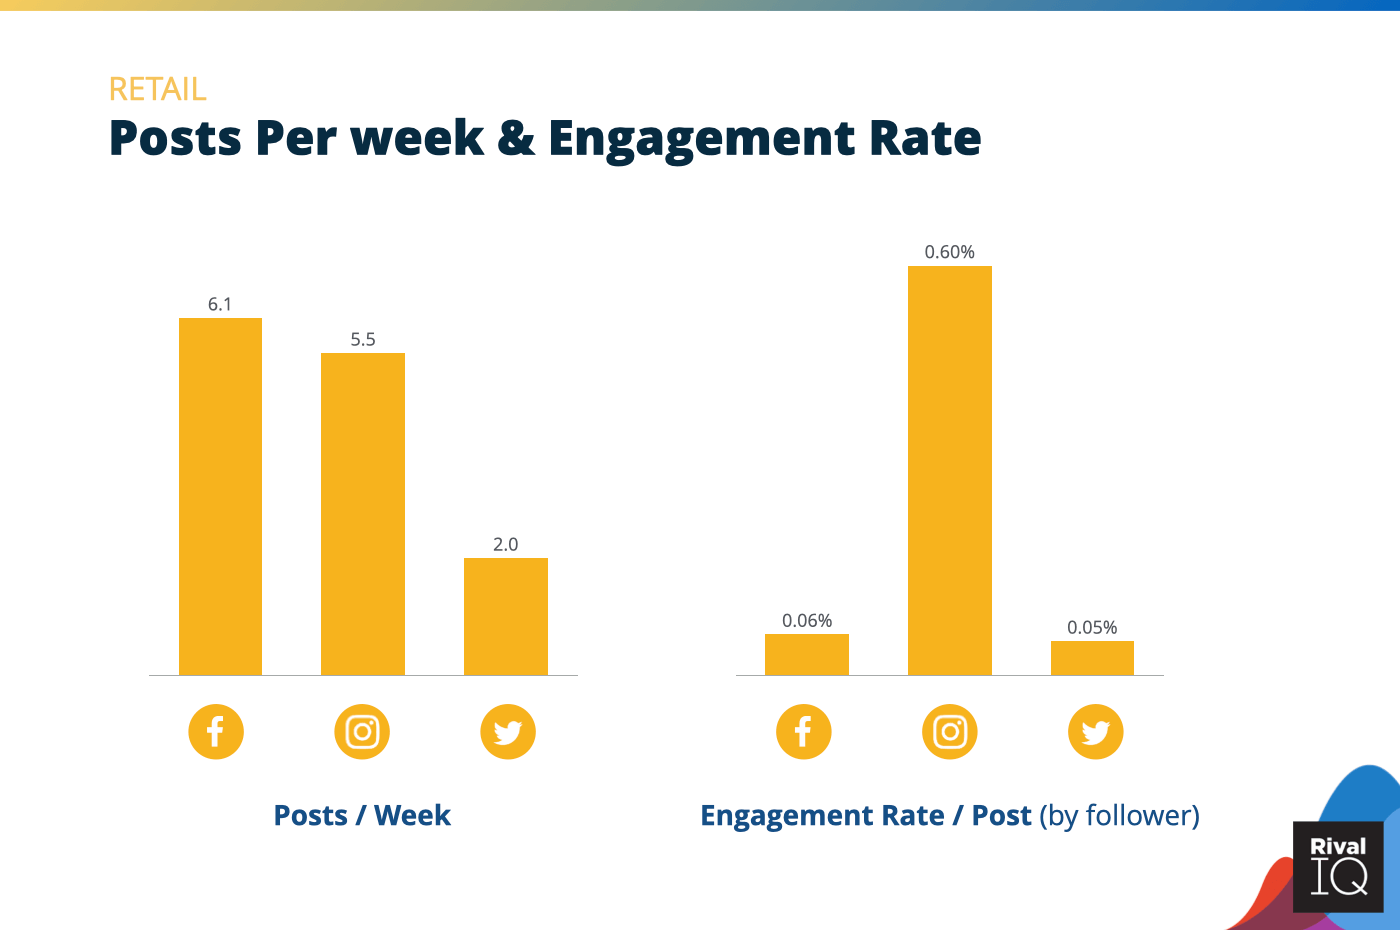
Posts per week and engagement rate per post across all channels, Retail
Thanks to a 50% increase in engagement rate on Twitter, Retail brands sat squarely in the middle of the pack on Twitter this year.
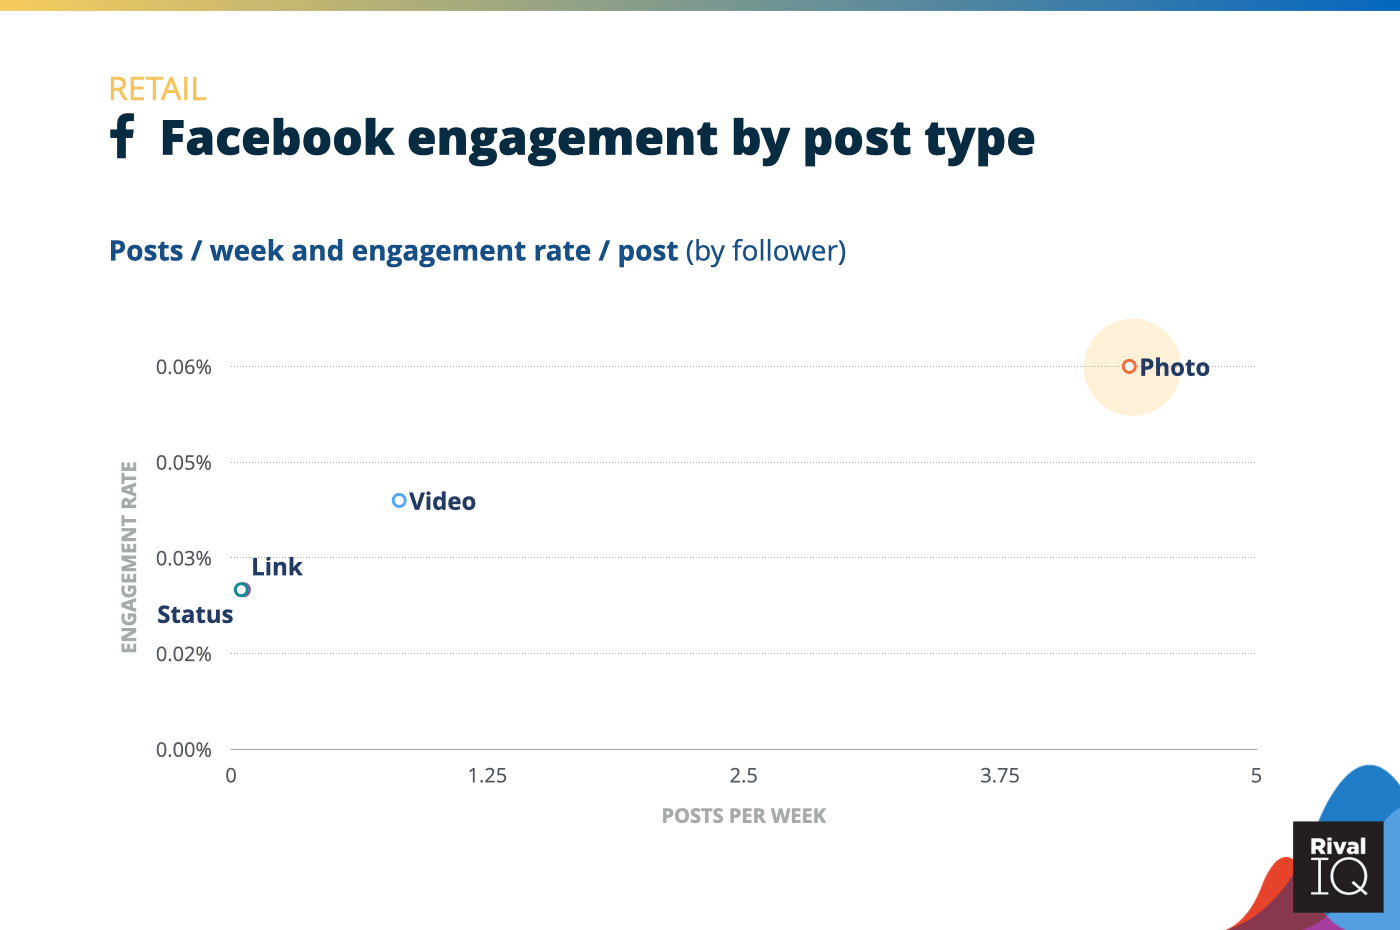
Facebook posts per week and engagement rate by post type, Retail
Retail brands saw a slight uptick in engagement rates for status updates and links on Facebook, but still put their efforts where they mattered most: photo posts.
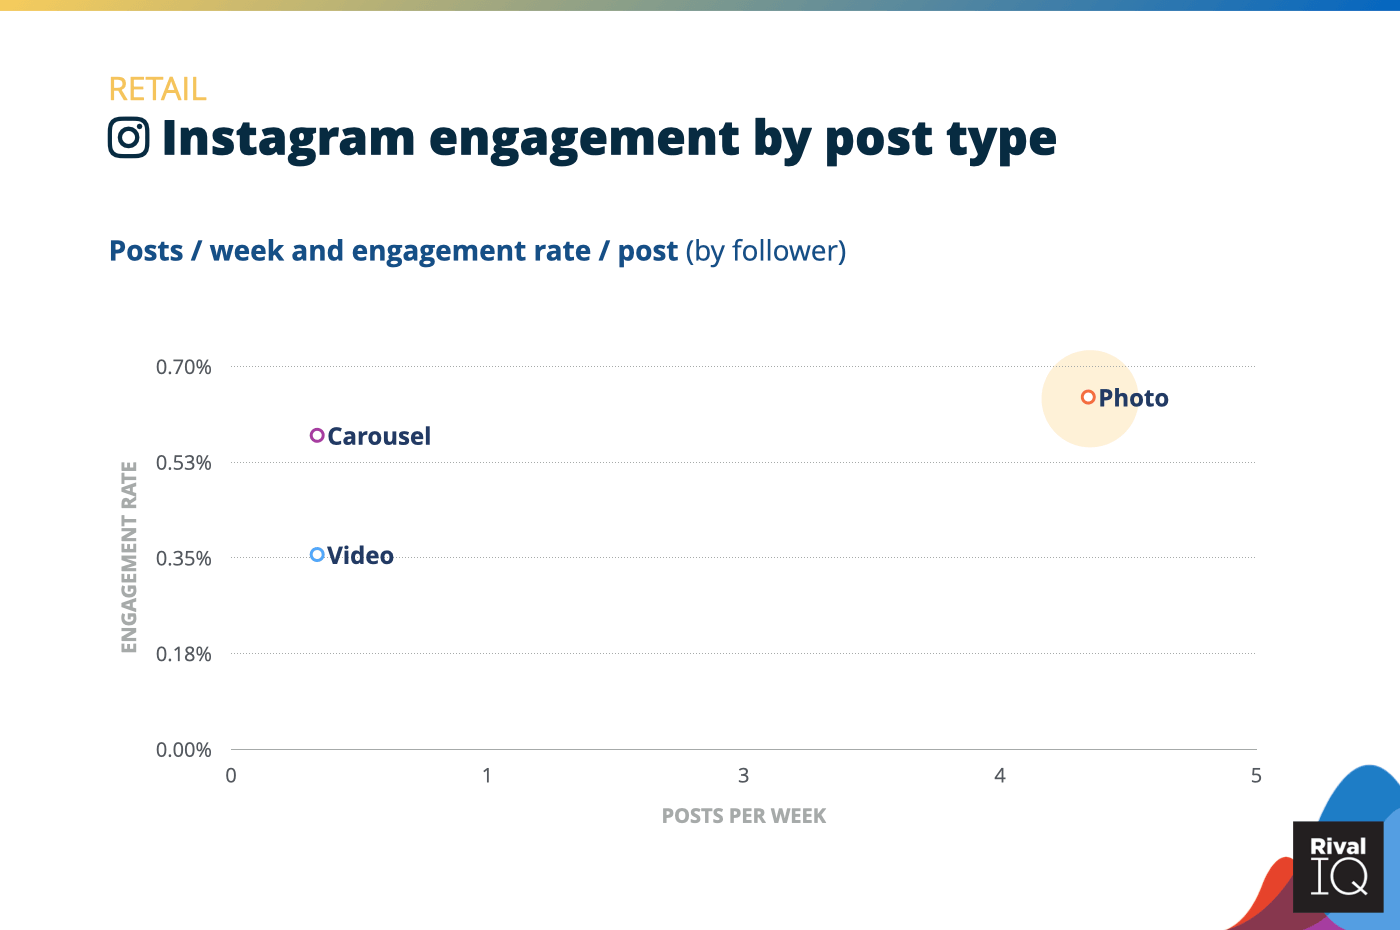
Instagram posts per week and engagement rate by post type, Retail
Retail brands saw engagement rates fall with every post type on Instagram, which helps explain their second-to-last place finish on Instagram.
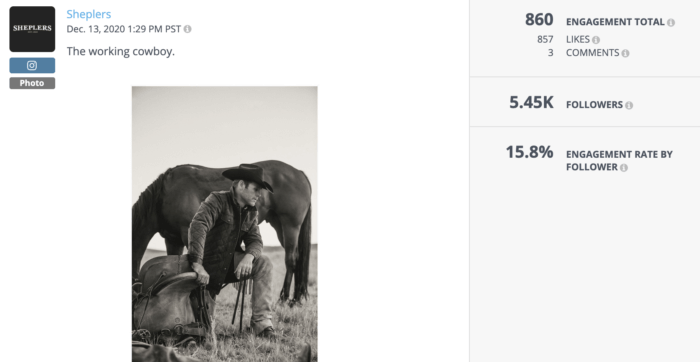
Cowboy gear brand Sheplers grabbed the retail Instagram engagement rate gold this year with timeless photo posts.
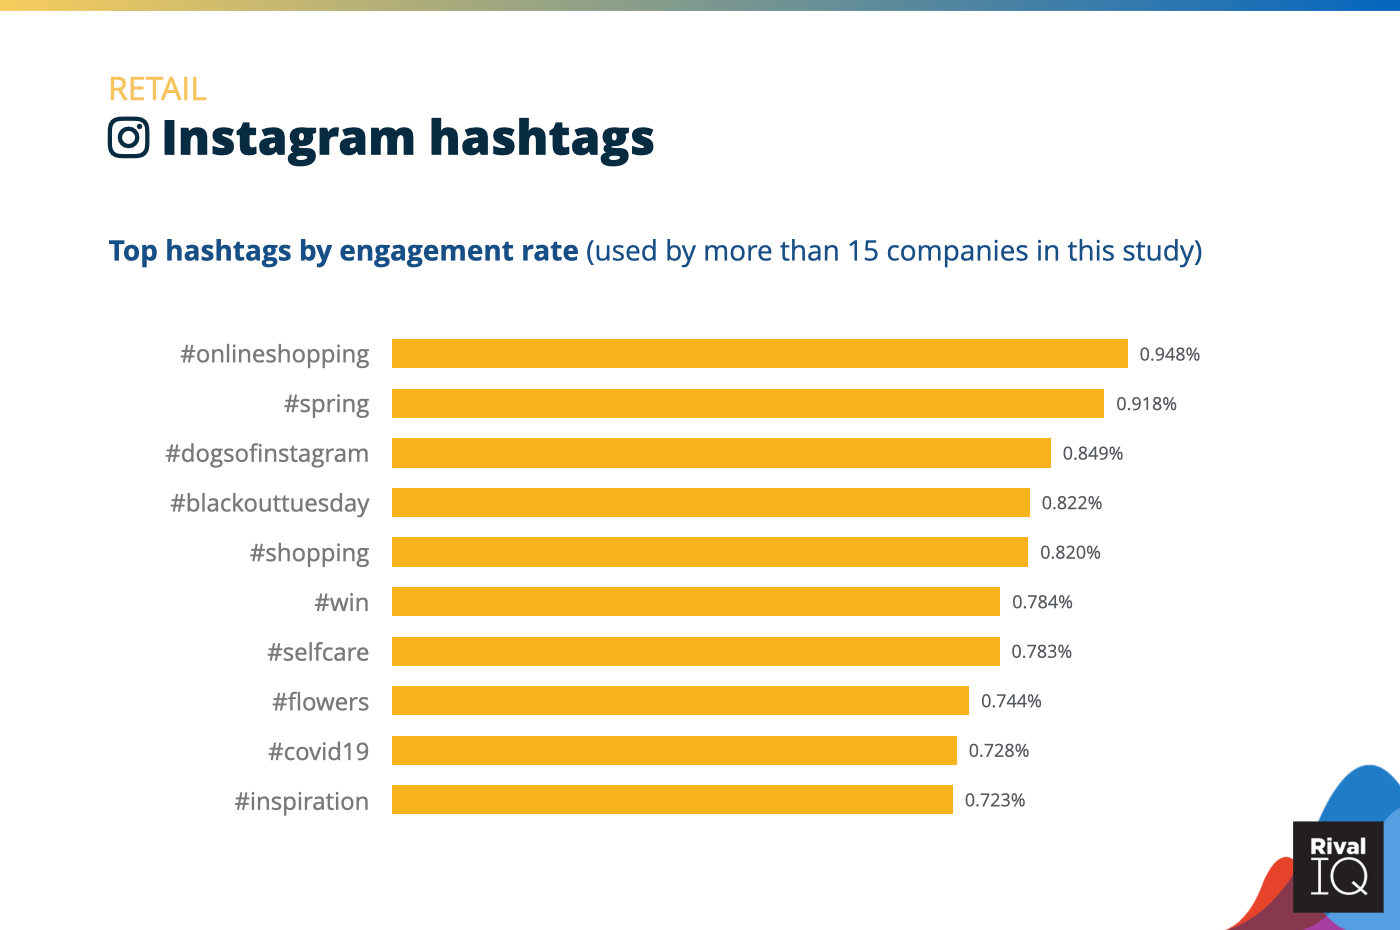
Top Instagram hashtags by engagement rate, Retail
No surprises here that consumer-focused Retail brands saw lots of Instagram success with hashtags like #onlineshopping, #win, and #shopping hashtags this year.
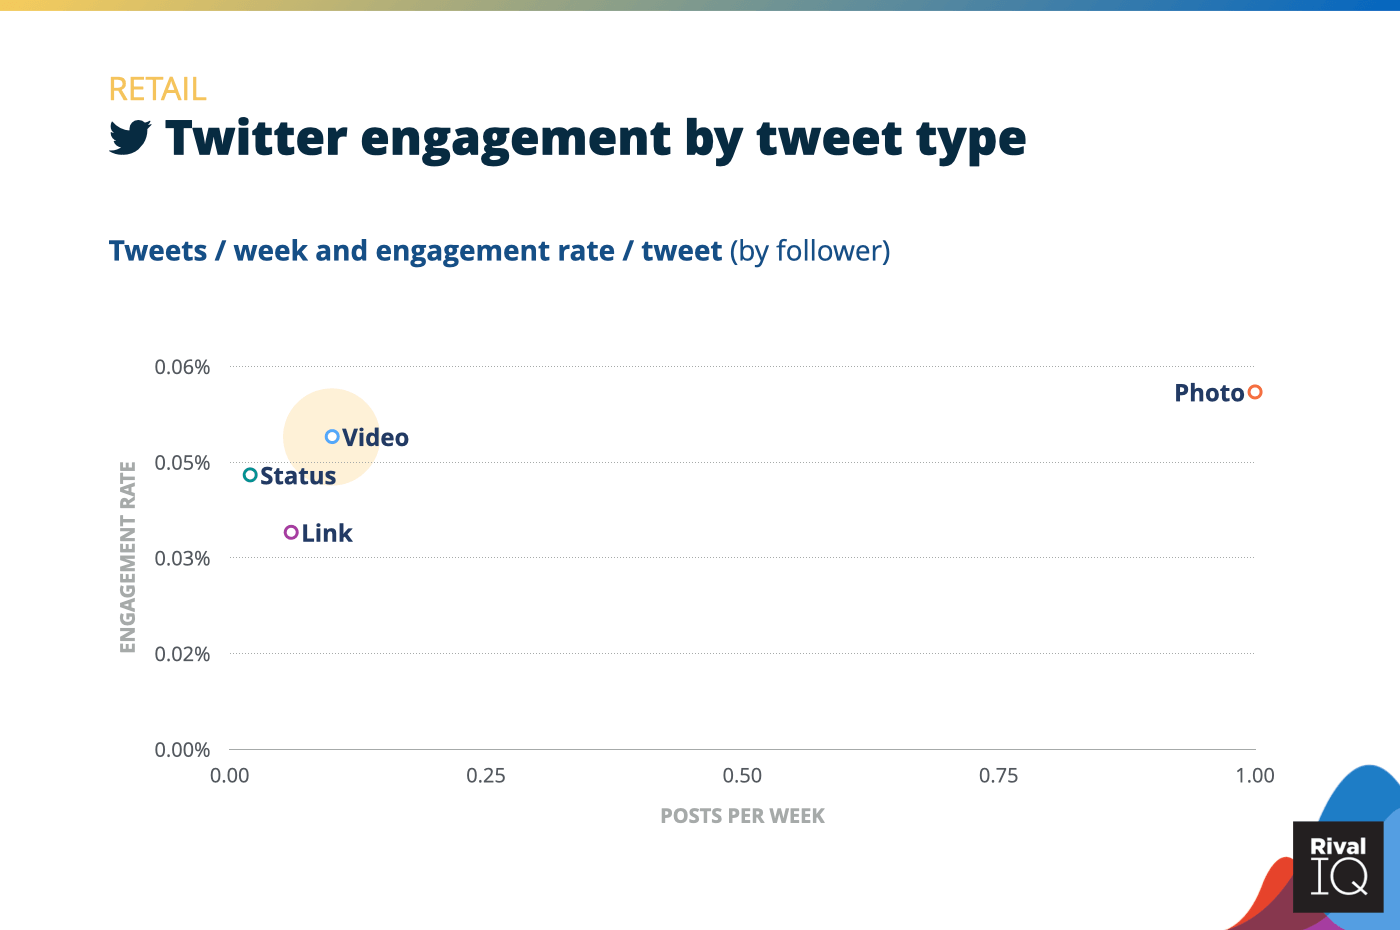
Twitter posts per week and engagement rate by tweet type, Retail
Retail brands were able to increase engagement rates on three out of four tweet types this year.
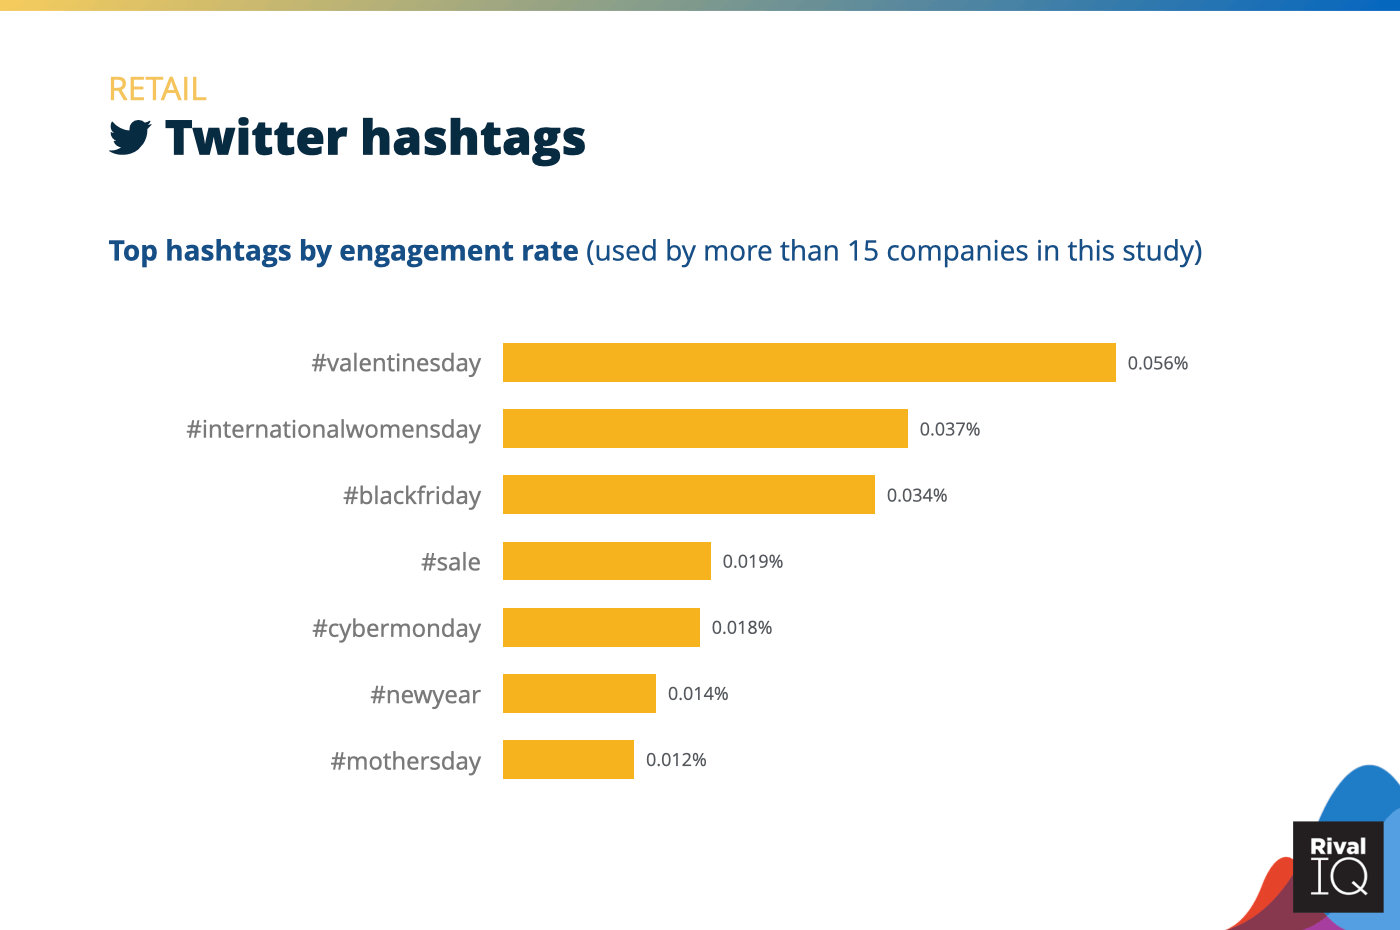
Top Twitter hashtags by engagement rate, Retail
Like so many other industries, Retail was all about the holidays on Twitter this year.
Sports Teams Social Media Benchmarks
Sports Teams saw second-place engagement rates on all three channels this year. They were also frequent posters, especially on Instagram and Twitter as compared to other industries.
Some ways to improve engagement rates even more:
- That high posting frequency is working, so keep it up.
- Keep giving fans what they want in the form of bite-sized visuals like photos and carousels.
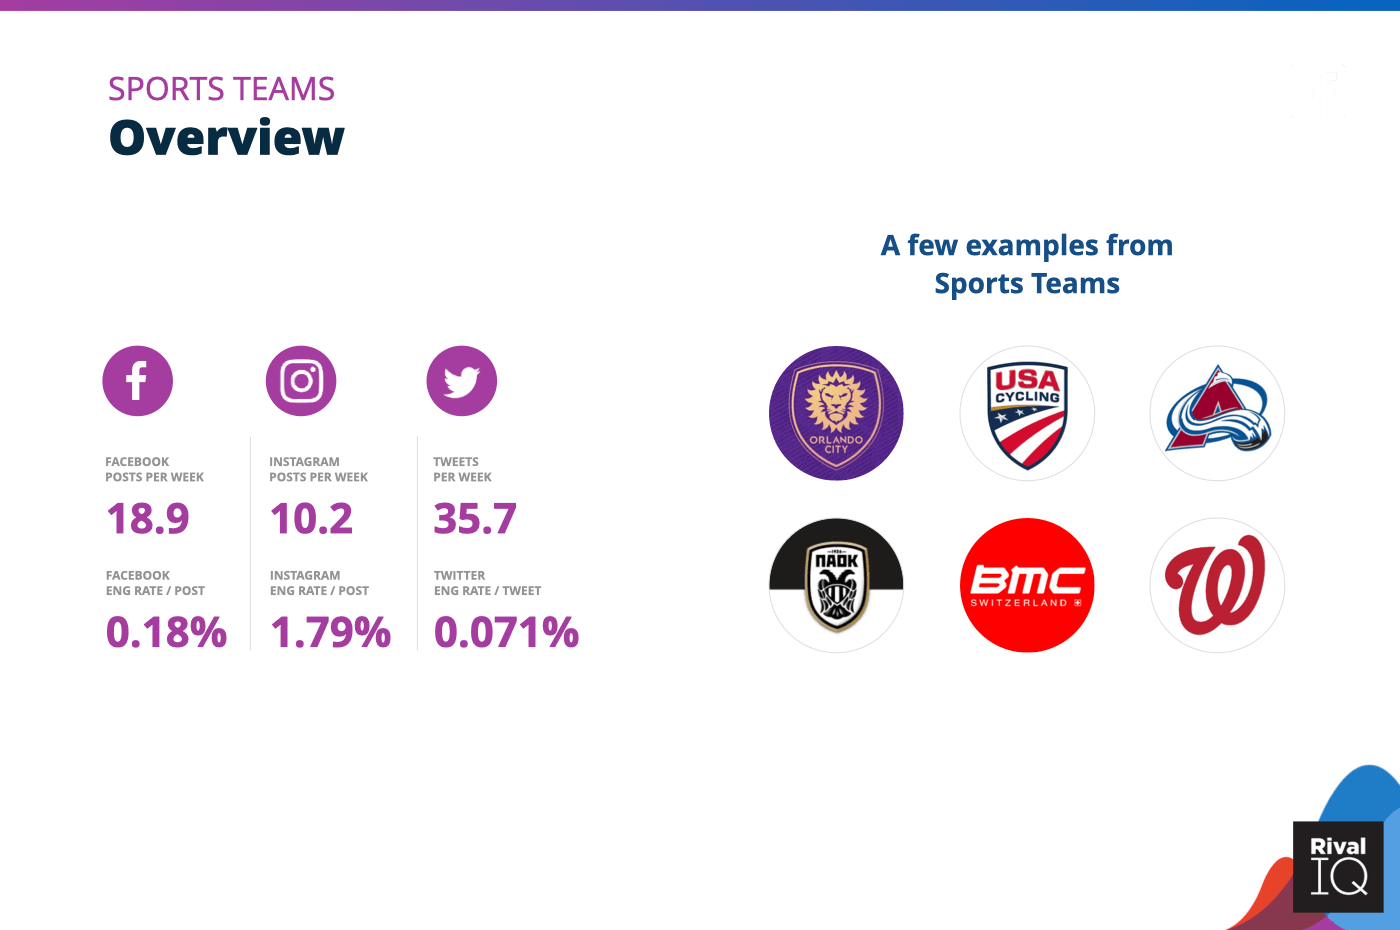
Overview of all benchmarks, Sports Teams
Notable Sports Teams include Orlando City Soccer Club, USA Cycling, Colorado Avalanche, Paok FC, BMC Switzerland, and the Washington Nationals.
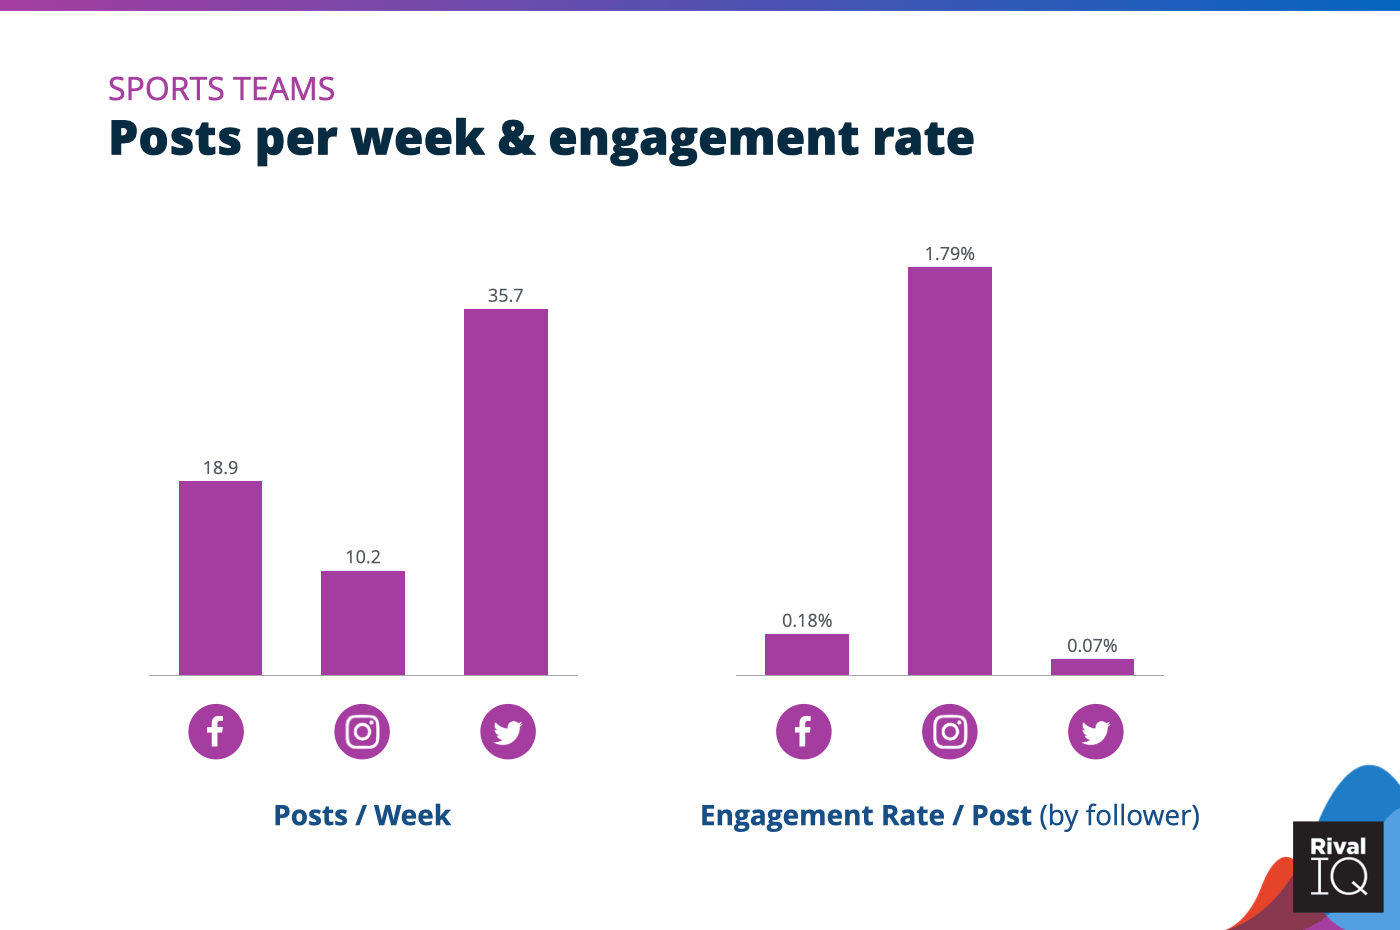
Posts per week and engagement rate per post across all channels, Sports Teams
In a year of uncertainty and way fewer sporting events, Sports Teams were able to snag the engagement rate silver on all three channels.
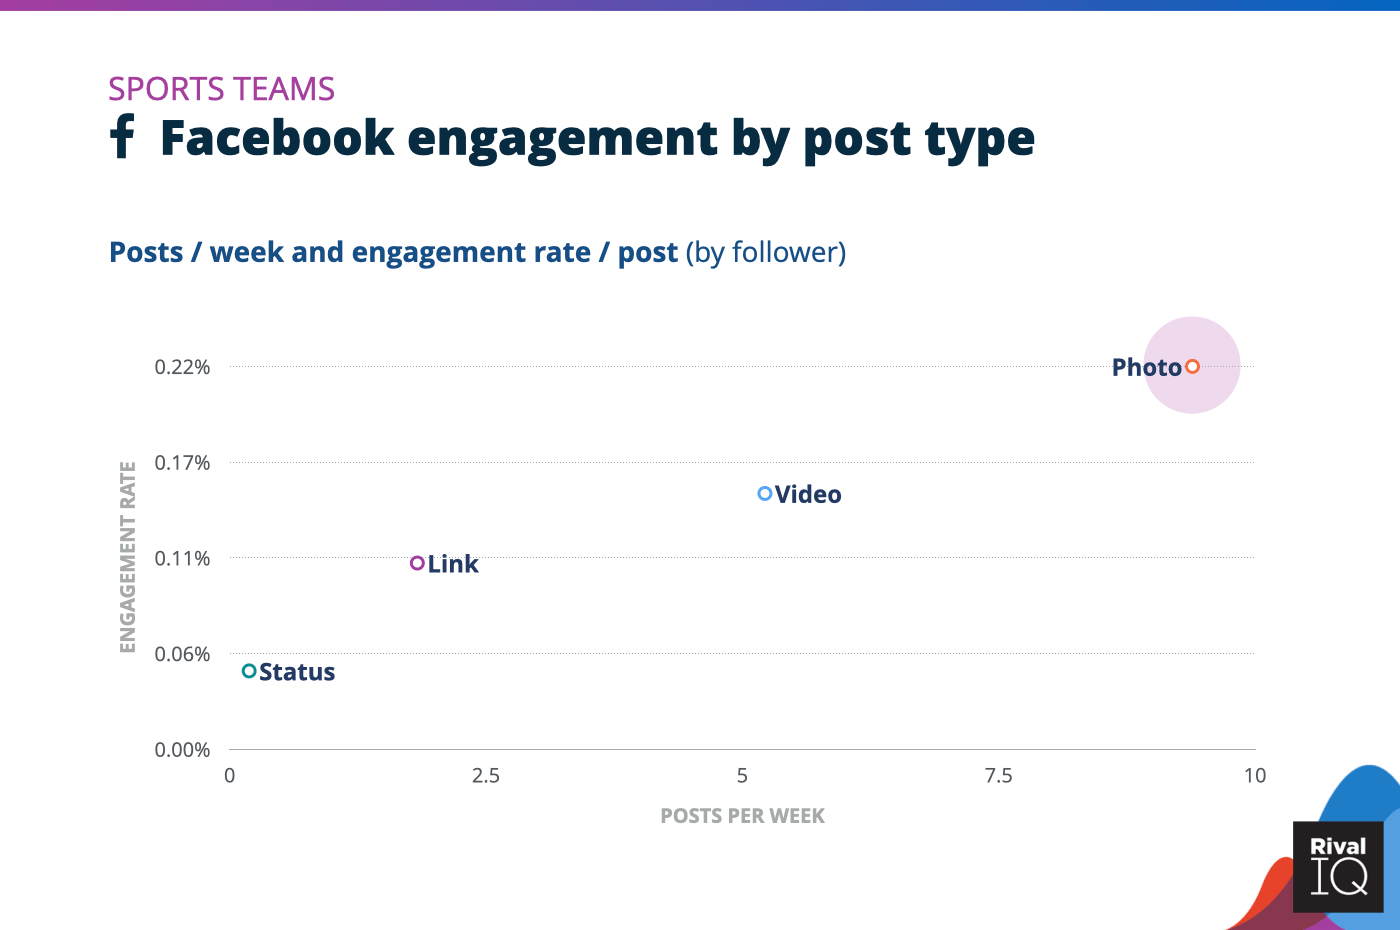
Facebook posts per week and engagement rate by post type, Sports Teams
Photo posts on Facebook helped Sports Teams earn more than 2x the median engagement rate on this channel, putting these brands comfortably in second place.
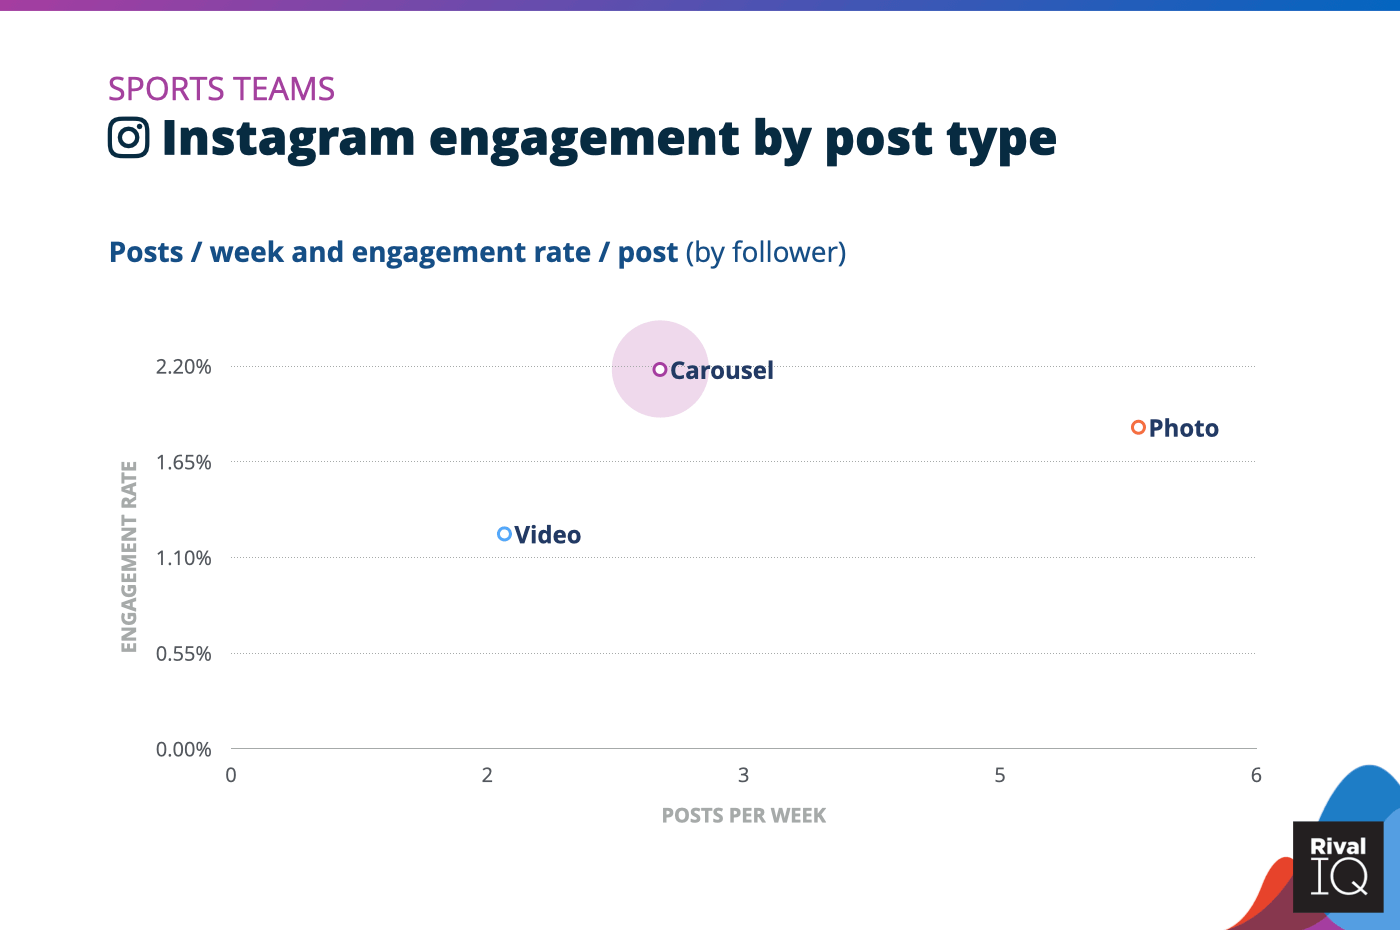
Instagram posts per week and engagement rate by post type, Sports Teams
Carousels were the clear winner for Sports Teams when looking at Instagram engagement rates.
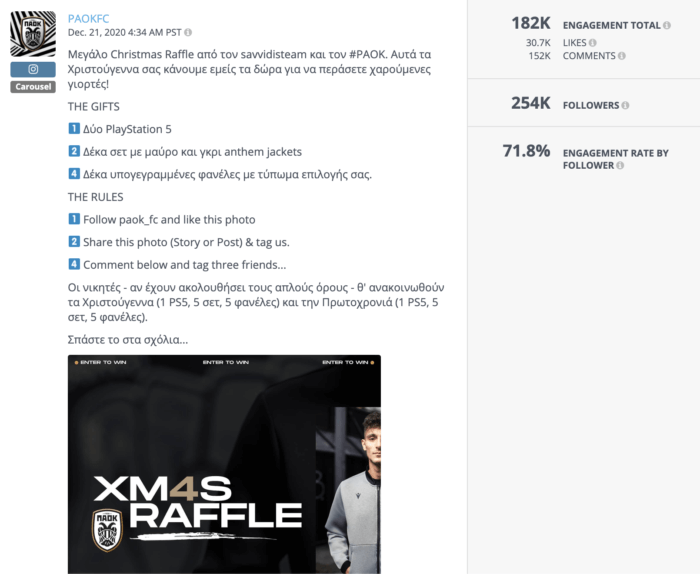
Sports Teams like overall Instagram winner and Greek soccer team Paok FC combined high-performing carousels with contest posts for the ultimate in Instagram engagement.
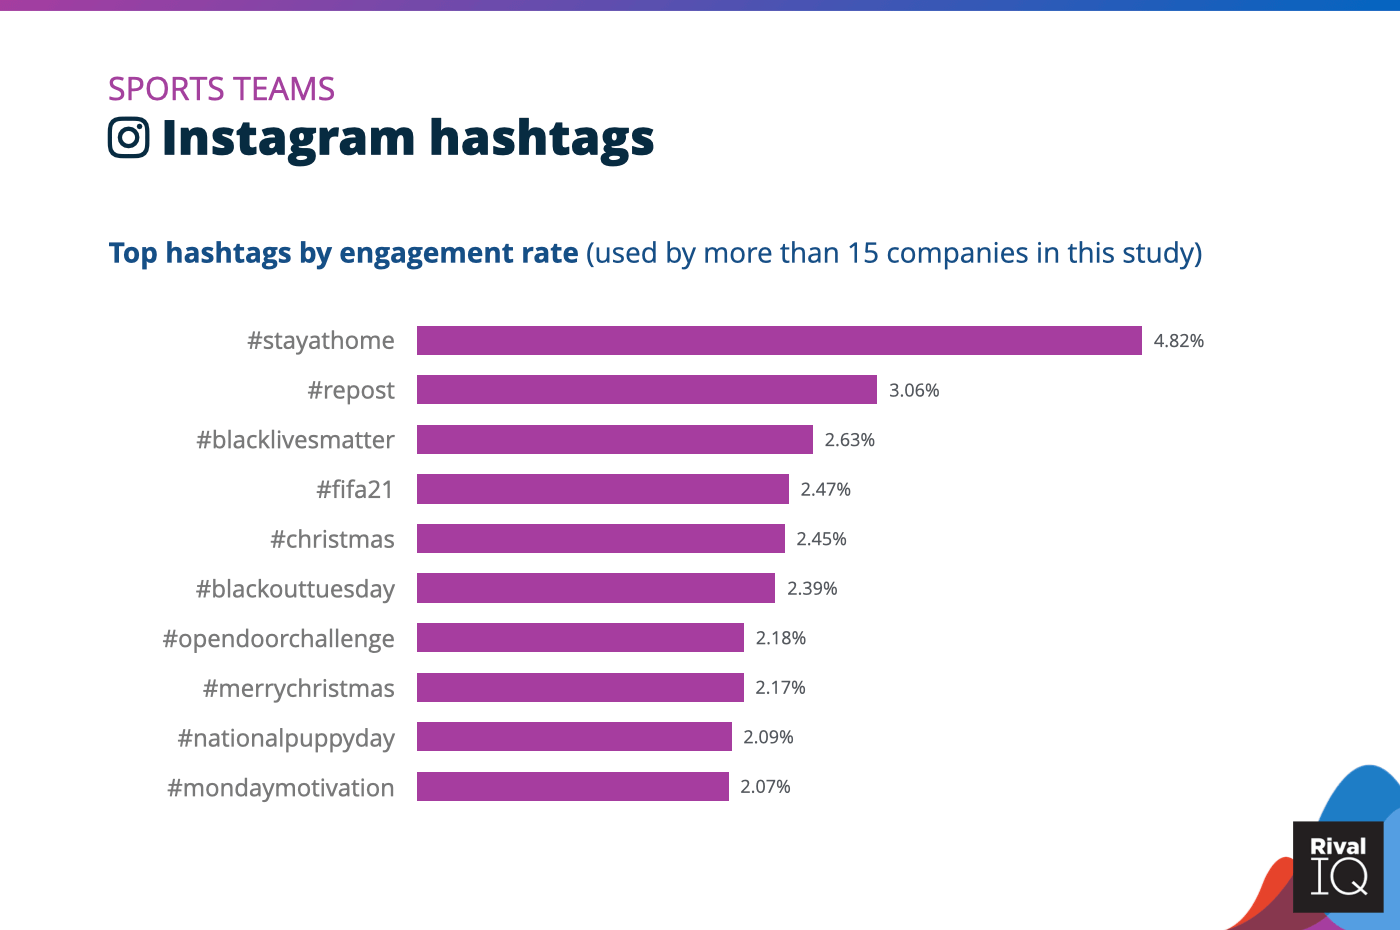
Top Instagram hashtags by engagement rate, Sports Teams
Sports Teams saw high Instagram hashtag performance with a mix of sports-themed hashtags like #FIFA21 and more social justice-themed hashtags like #blacklivesmatter and #blackouttuesday.
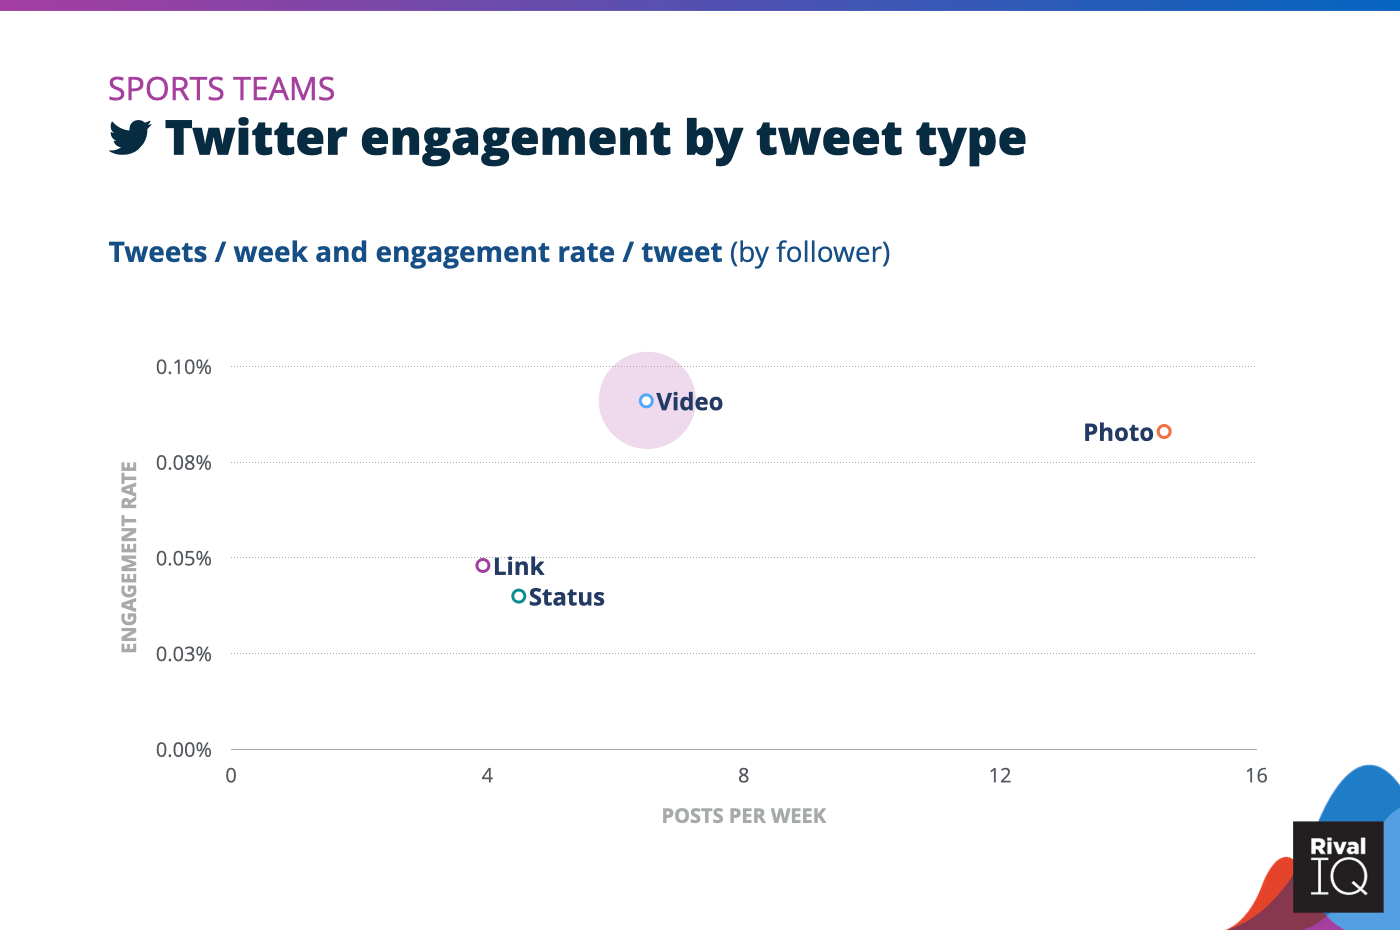
Twitter posts per week and engagement rate by tweet type, Sports Teams
Sports Teams decreased their photo tweets by 30% this year but saw a 30% increase in engagement for that tweet type, suggesting working smarter not harder is the move.
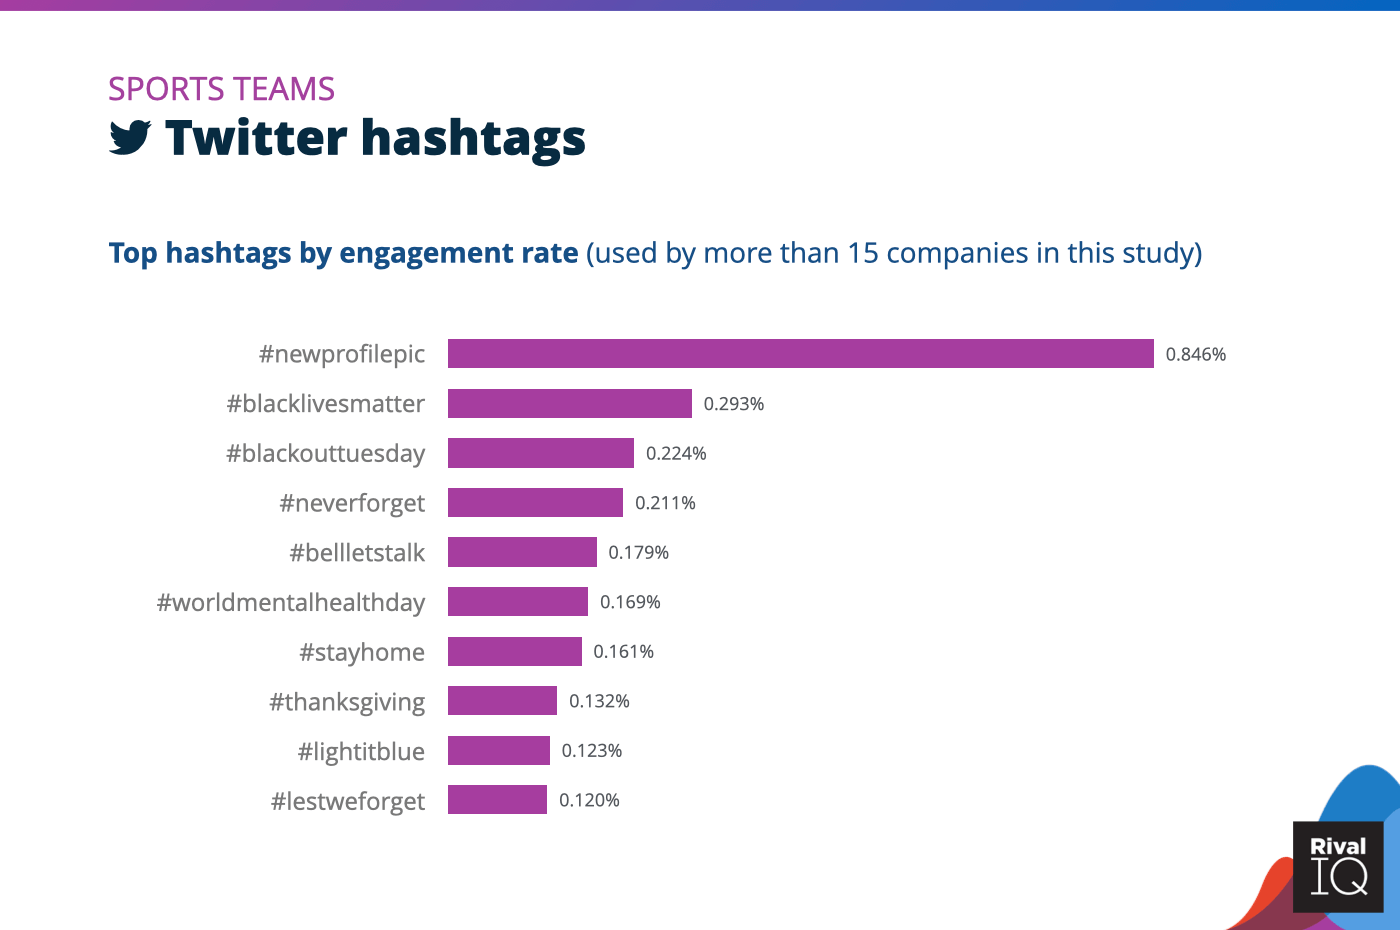
Top Twitter hashtags by engagement rate, Sports Teams
Fans loved when Sports Teams used the #newprofilepic to signal a new theme or avatar to the tune of almost 3x the next most popular Twitter hashtag.
Tech & Software Social Media Benchmarks
Despite coming in last on Facebook and second-to-last on Twitter, Tech & Software brands made some inroads this year with median performance on Instagram and slight growth on Twitter.
Here are two ideas for improving engagement rates:
- Save photos for Facebook and Instagram, where they really count.
- Followers on both Instagram and Twitter loved seeing a little #MondayMotivation from their favorite Tech & Software brands, so don’t be afraid to get inspirational.
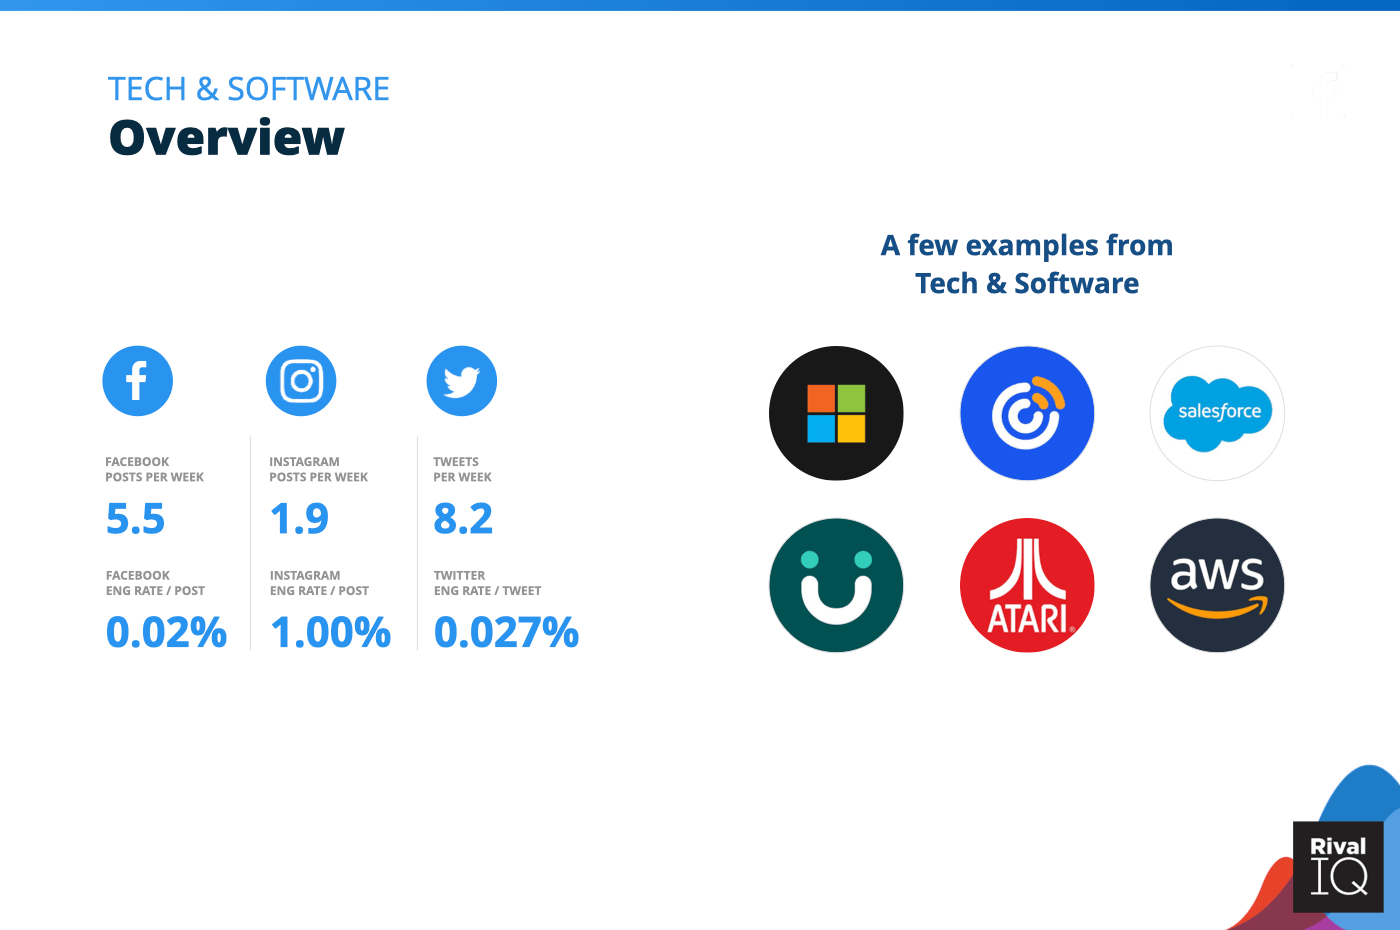
Overview of all benchmarks, Tech & Software
Notable Tech & Software brands include Microsoft, Constant Contact, Salesforce, Kronos Incorporated, Atari, and Amazon Web Services.
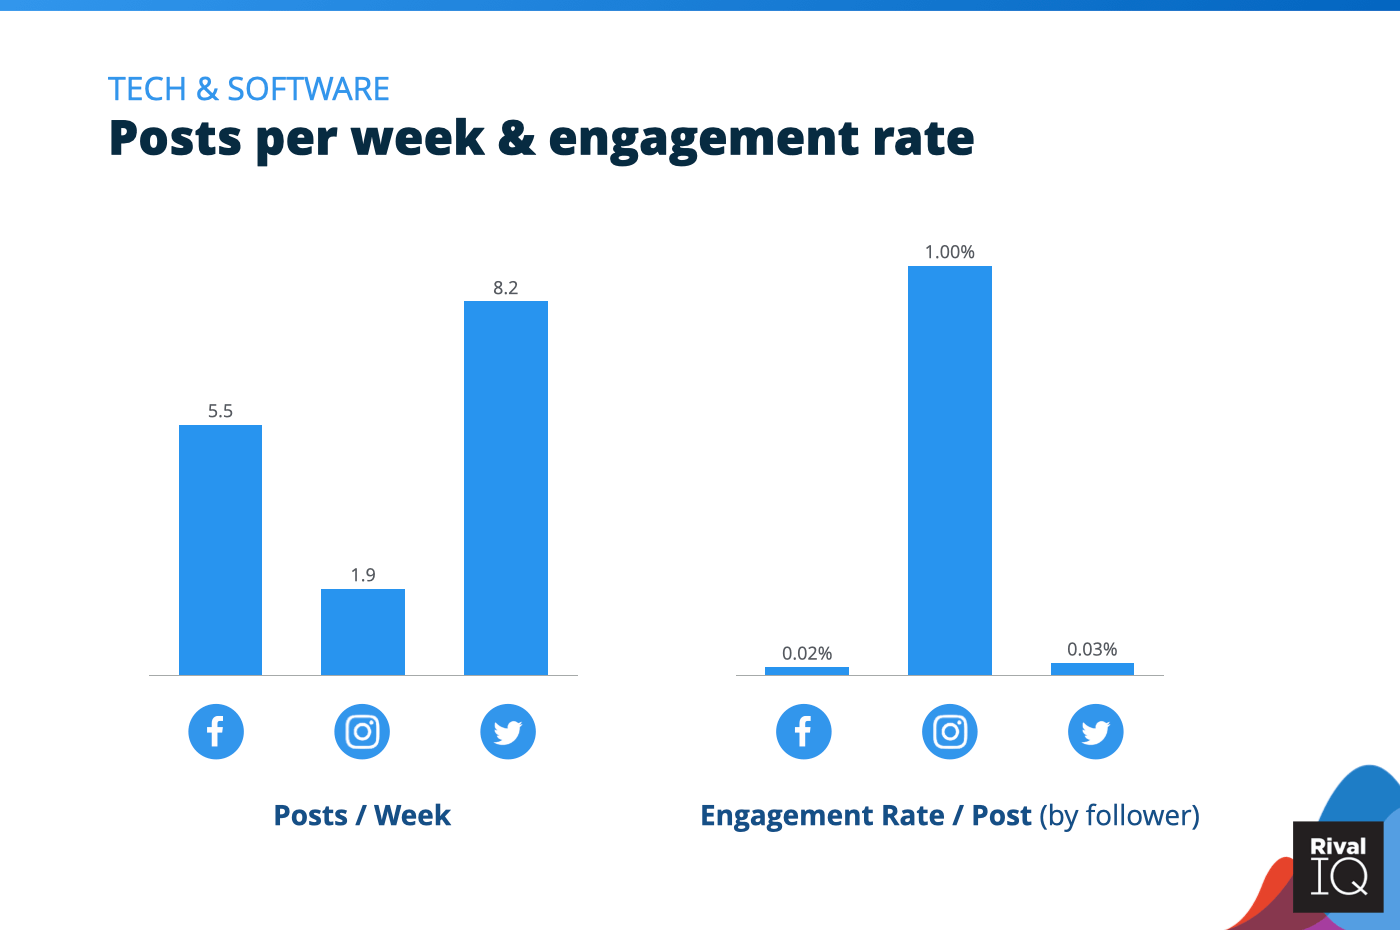
Posts per week and engagement rate per post across all channels, Tech & Software
Despite a small decrease in Instagram engagement rates this year and infrequent posting, Tech & Software saw above-median engagement rates on this channel.
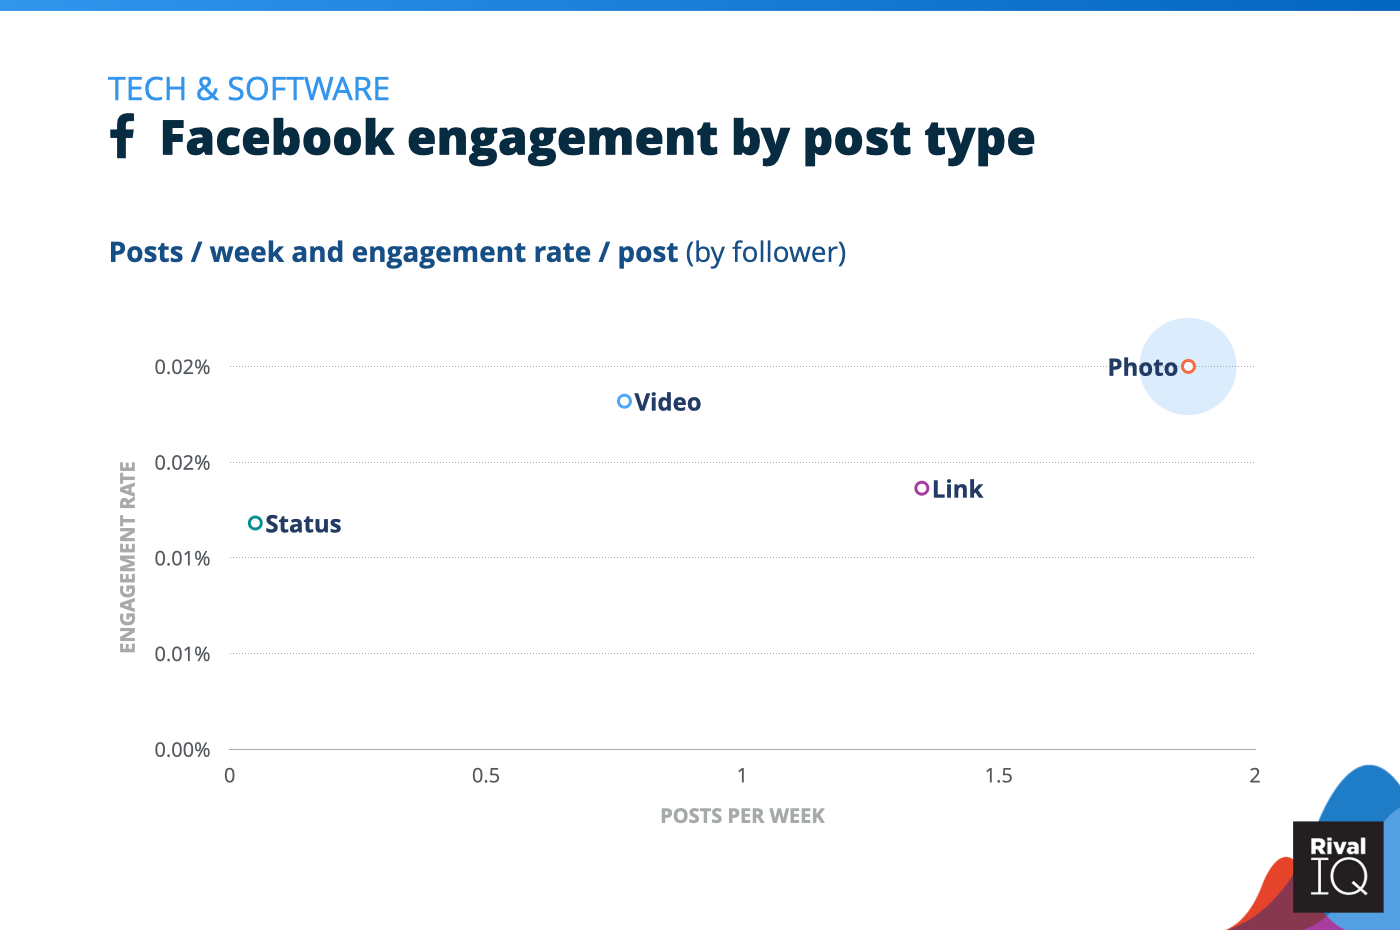
Facebook posts per week and engagement rate by post type, Tech & Software
Photos were a top performer on Facebook for Tech & Software companies, but CRM Pipedrive won top marks for Facebook engagement rates with links (thanks to healthy boosting!).
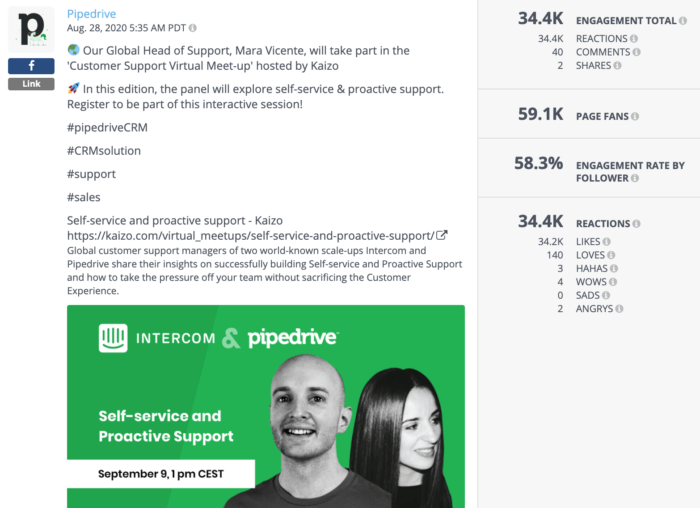
The lesson? Find what works for your brand with research and experimentation.

Instagram posts per week and engagement rate by post type, Tech & Software
For the second year in a row, photos and carousels had very similar engagement rates on Instagram, while video lagged behind.
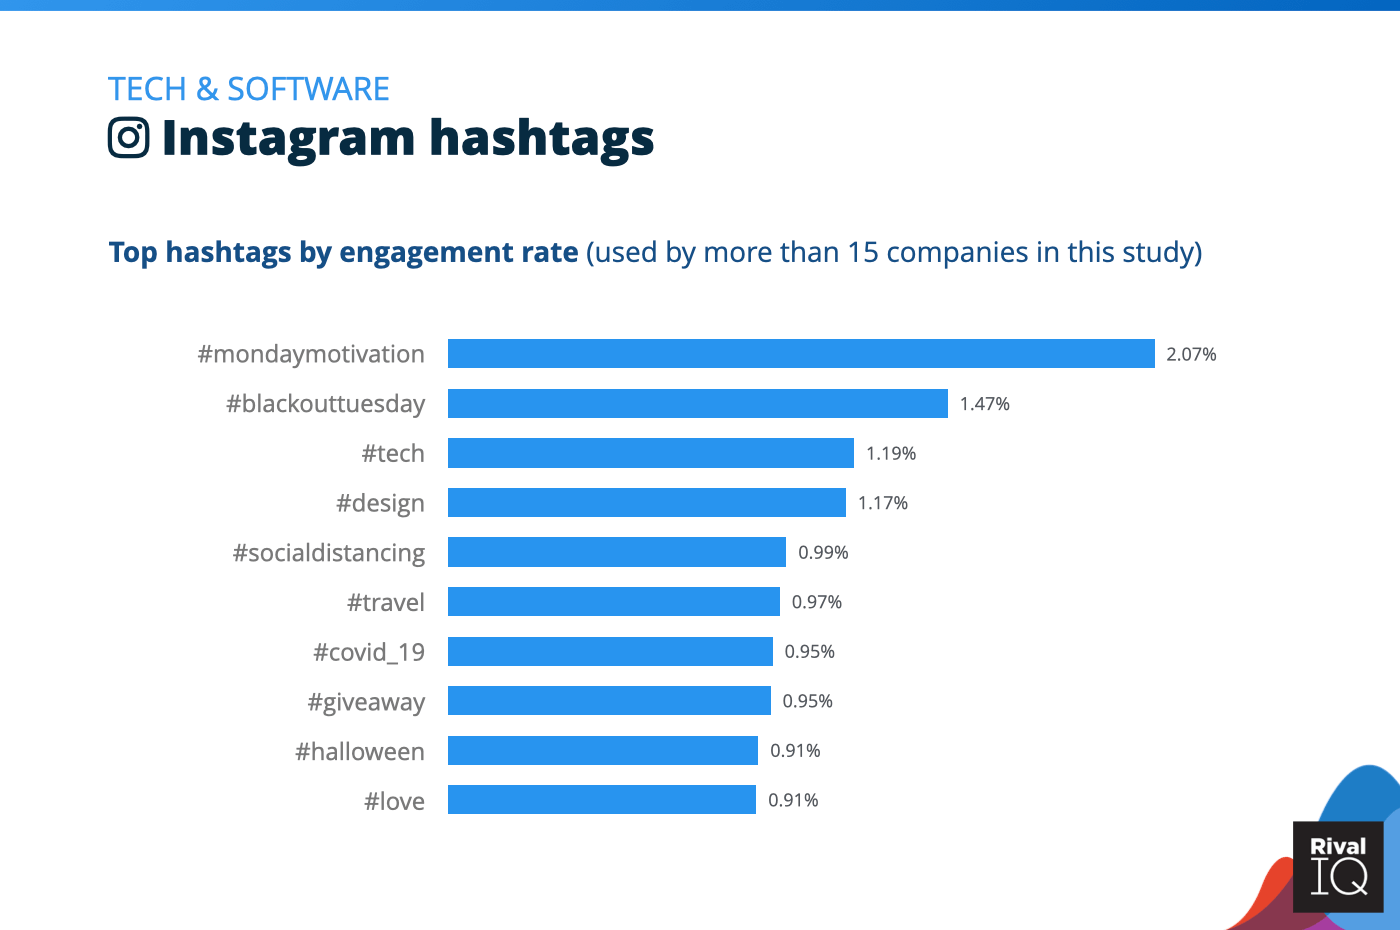
Top Instagram hashtags by engagement rate, Tech & Software
Top ‘grammers like Roblox and Acronis made the most of the #mondaymotivation hashtag to inspire followers, while other Tech & Software brands stuck with tried-and-true hashtags like holidays and giveaways.
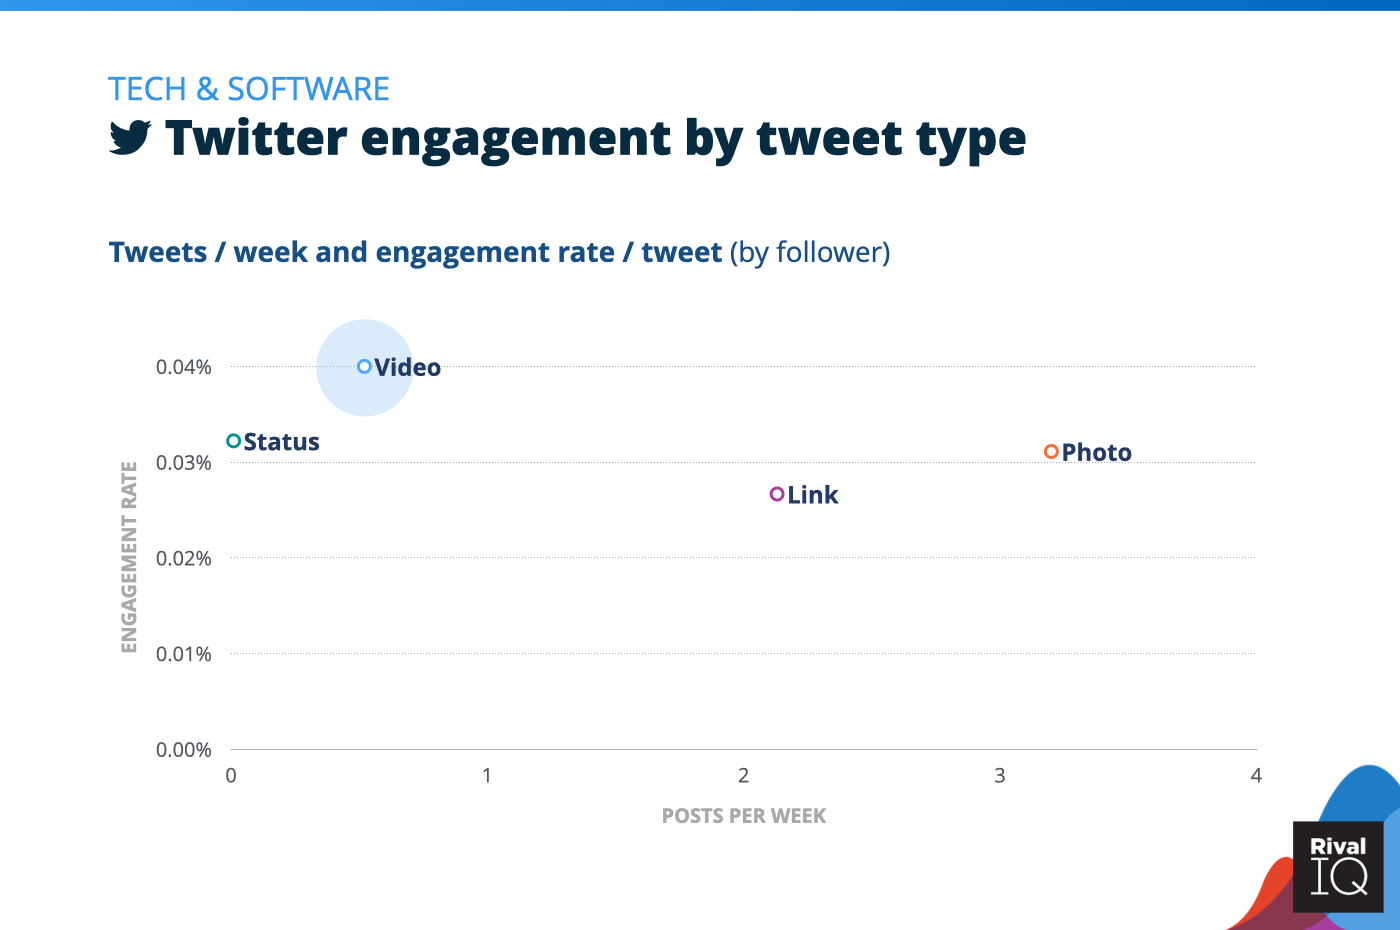
Twitter posts per week and engagement rate by tweet type, Tech & Software
Video grabbed top engagement rates for Tech & Software brands on Twitter, who were much more likely to tweet a link or a photo.
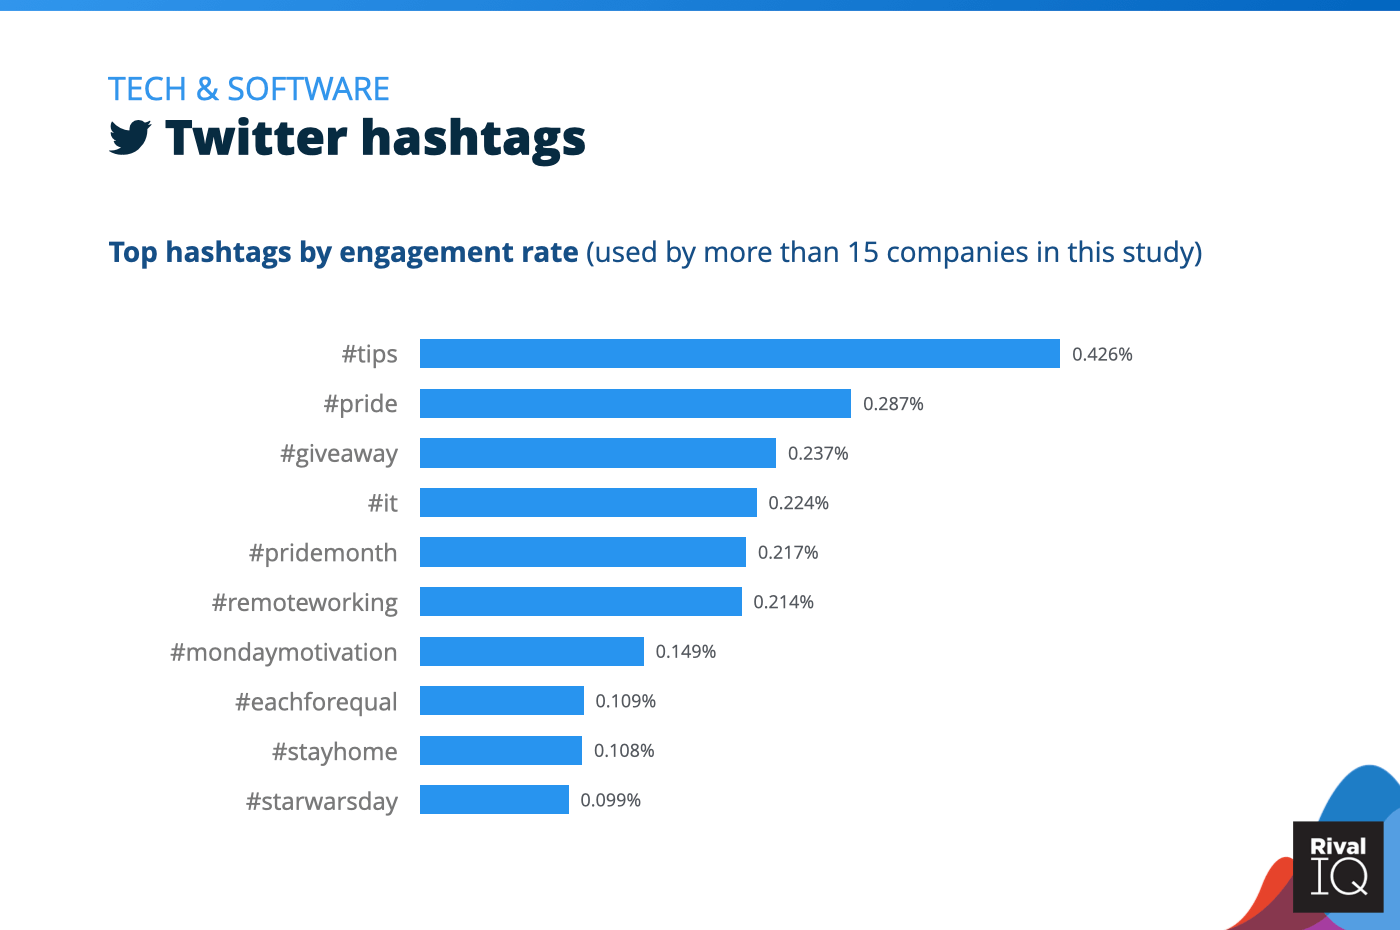
Top Twitter hashtags by engagement rate, Tech & Software
Tech & Software brands kept it topical on Twitter with trending hashtags like #IT, #remoteworking, and #stayhome.
Methodology
To spot trends and identify benchmarks, we used Rival IQ to analyze engagement rates, posting frequency, post types, and hashtags on the top three social channels for brands: Facebook, Instagram, and Twitter.
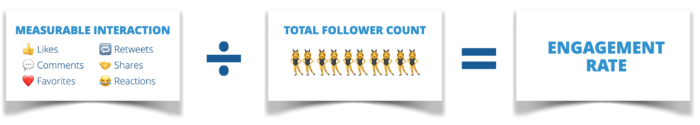
We define engagement as measurable interaction on social media posts, including likes, comments, favorites, retweets, shares, and reactions. Engagement rate is calculated based on all these interactions divided by total follower count.
Within this report, we provide a representative sample of organic and paid posts from national and international companies in each industry by selecting 150 companies at random from each industry in our database of over 200,000 companies. Companies selected had active presences on Facebook, Instagram, and Twitter as of January 2020, and had Facebook fan counts between 25,000 and 1,000,000 and minimum Instagram and Twitter followers of 1,000 as of the same date.
We used median performance from the companies selected for each industry to compile the data for this report.
Why do we benchmark?
Social media success is about so much more than getting the most comments or likes: it’s about increasing engagement while also growing or maintaining the percentage of your audience that engages as you expand your audience.
To us, engagement rate per post is the metric because it controls for post volume and audience size and helps marketers understand how they’re doing in relation to their competitors.
Why can’t you gauge success on likes alone? Because audience size is hugely important: 1,000 likes makes a huge difference to a brand with 2,000 followers, but is a drop in the bucket to a brand with 100,000 followers.
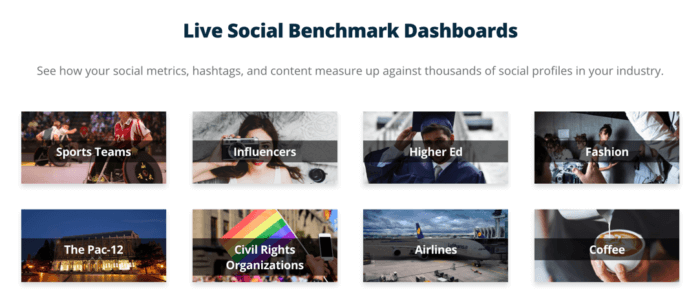
Live Social Media Benchmarks
Ready to starting benchmarking your social media performance? Check out our Live Benchmark landscapes, where we feature live social media metrics from a sample of companies from each industry represented in this study. These landscapes feature hashtag performance, top post types, and so much more on Facebook, Instagram, and Twitter.
(Oh, and if you’re a Rival IQ customer or in a trial, you can add those stats directly into your Rival IQ account for even more comparisons.)
Or, run a free Head-to-Head report against your biggest rival to see how you measure up to both your competition and against industry benchmarks represented in this study.
Wrapping It Up
2020 was a year of change and fear and elections and masks and working from home in our pajamas (if we were lucky enough to stay employed), and social media benchmarks weren’t exempt from the fluctuations we all felt. (If you’d like to see how coronavirus impacted social media engagement rates, we’ve got a post for that.)
There’s a lot of hope in how industries were able to prevail on social by connecting authentically with their customers and followers. Twitter is all about connecting 1:1 rather than broadcasting to the masses, so it makes sense that brands were able to maintain engagement rates on Twitter as people huddled at home with a hunger for connection.
Many brands used their sizable platforms to call for racial equity and justice for Black people and people of color. Success with hashtags like #BlackLivesMatter and #NeverForget trended for brands in a variety of industries, suggesting that nonprofits and social justice organizations aren’t the only organizations who can do this work and do it well.
Even the decline in median posting frequency for brands without major impact on engagement rates suggests that brands are creating thoughtful, engaging content that they’ve learned to fine-tune for followers. There’s plenty of content on the internet, and we certainly don’t need more of the 🗑.
We’d love to hear how you measure up to your industry’s benchmarks, so feel free to drop us a line on Twitter to share your success.