Curse words, a mix of bummer and exciting social media engagement news, inspiring examples of brands getting it right on social, and so much more: what else could you possibly want?
We just couldn’t get enough nerdy social media stats in our annual 2021 Social Media Industry Benchmark Report, so we rolled up our sleeves and pushed our glasses up our noses to really geek out.
What to expect
Let’s set some expectations so readers of our usual content don’t run away screaming:
- Cursing abounds: It was a f*cking weird year, and we will swear like sailors when explaining what happened because some of it is, well, f*cking weird.
- Language matters: Throughout this report, we refer to the June and July 2020 time period as the Murder of George Floyd by white police officer Derek Chauvin instead of a more mild “Black Lives Matter” or “June protests” on purpose. We believe it’s important to attribute any negative social media impact to the despicable actions of police officers working within a white supremacist system instead of to everyone, and especially Black, Indigenous, and People of Color leaders, who bravely protested these actions. We sincerely hope this language is not triggering to the BIPOC community but if we made the wrong language choice, we would be honored if you expended the emotional labor to tell us about it on Twitter.
- We’re going granular: Each year in our benchmark report, we share the median values for engagement rates and posts per week, in both cross-industry and per-industry forms. Evaluating these benchmarks across the year helps us understand how these numbers are evolving over time and illustrates the impact of national and world events on the metrics, but in this report we’re going to break things down by quarter and even major event so you can see the impacts of a tumultuous year.
Let’s take a look at these numbers channel-by-channel to gain that understanding.
Instagram engagement in 2020
It’s no secret to social media marketers that Instagram has been the reigning engagement power player for brands for years now. That means it’s more important than ever to be fully versed on how the ups and downs of a big year like 2020 can affect social media engagement.
In this section, we’ll break things down across the year, spotlight what the top brands are doing right on Instagram, and roll out brand-new IGTV benchmarks to help you compare your performance to other brands and industries.
Instagram Benchmarks Over Time
Instagram consistently has the highest engagement rates of the three we study in this report. For the calendar 2020 year, we reported that Instagram had an average engagement rate per post of 0.98%, down from the previous year’s value of 1.22%. The median brand also published slightly fewer posts, down from 4.3 posts per week in 2019 to 4.1 posts per week in 2020.
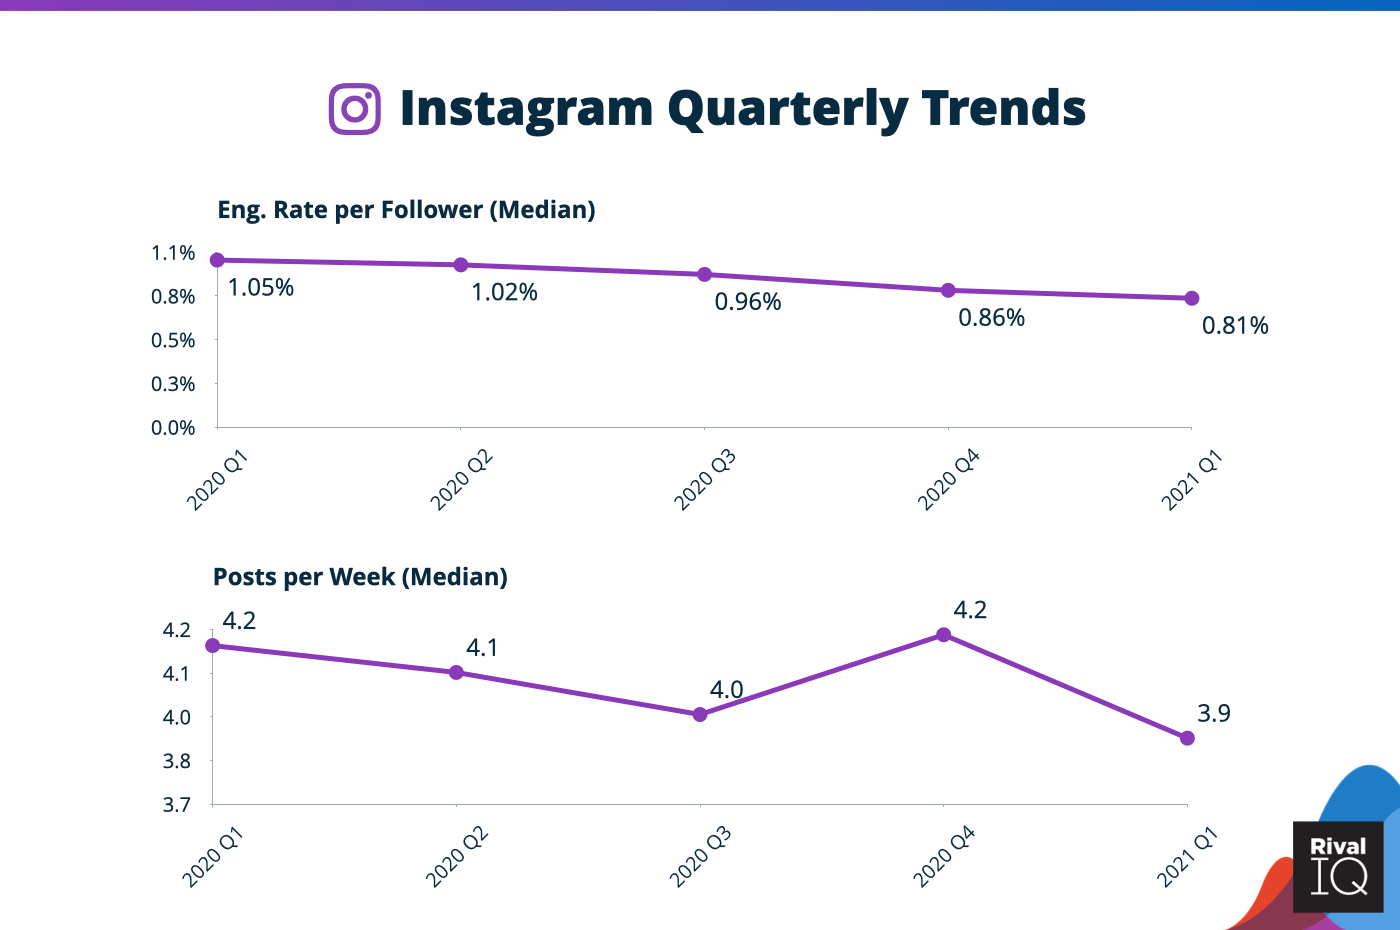
Above, we see the quarter-by-quarter time series for each of our metrics for the entirety of 2020 and Q1 2021.
Starting with the top graph, you’ll note that engagement rates started above 1% in Q1-2020 but declined consistently starting in Q2-2020. Comparing engagement rates for Q1-2020 vs Q1-2021, engagement rates are down 23%.
Instagram posting volume was more consistent: the average brand posted about 4.15 times per week during 2020, with only small deviations from quarter to quarter.
Of course, examining these numbers at a quarterly level gives us a broad perspective on the trends of these metrics. To get a better sense of how the calendar, COVID, and other key events during the year affected engagement and posting volume, let’s look at the weekly values as well.
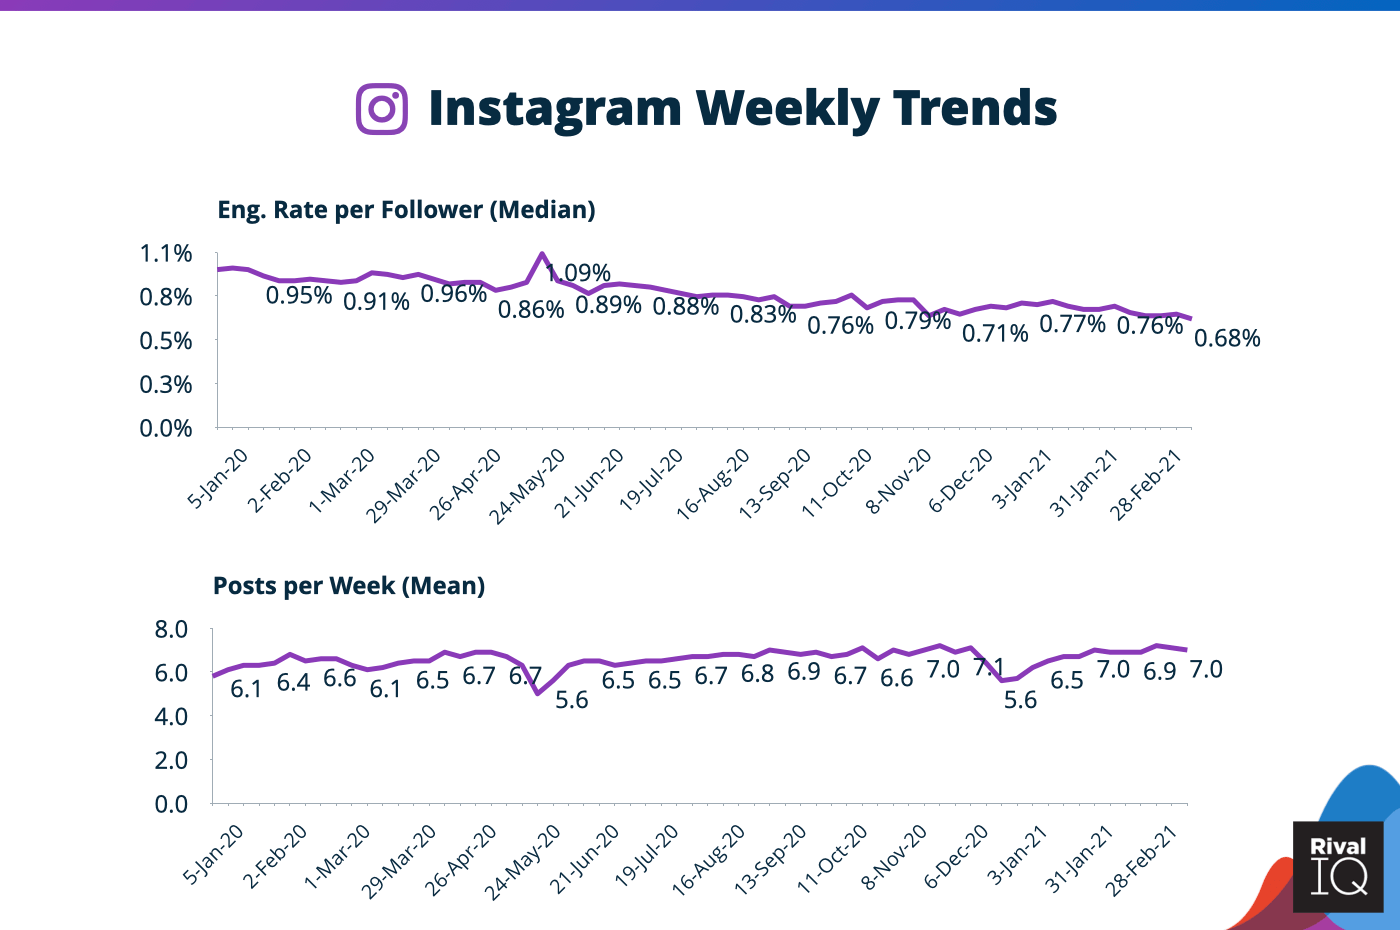
In the chart above, we examine the same metrics for each week from January 2020 through March 2021. For the posts per week, we’ve switched to showing the mean (in place of the median) to give a better sense of small shifts in the total amount of content posted during the week. As you’d expect, the general trends follow the same shape that we saw in our quarterly data. However, there are a number of notable deviations including the COVID lockdown and the murder of George Floyd.
Instagram Engagement Rate Trends by Industry
In the following two charts, we’ll examine the evolution of Instagram engagement rates and posting volumes for each industry in our benchmark report using weekly data since January 2020.
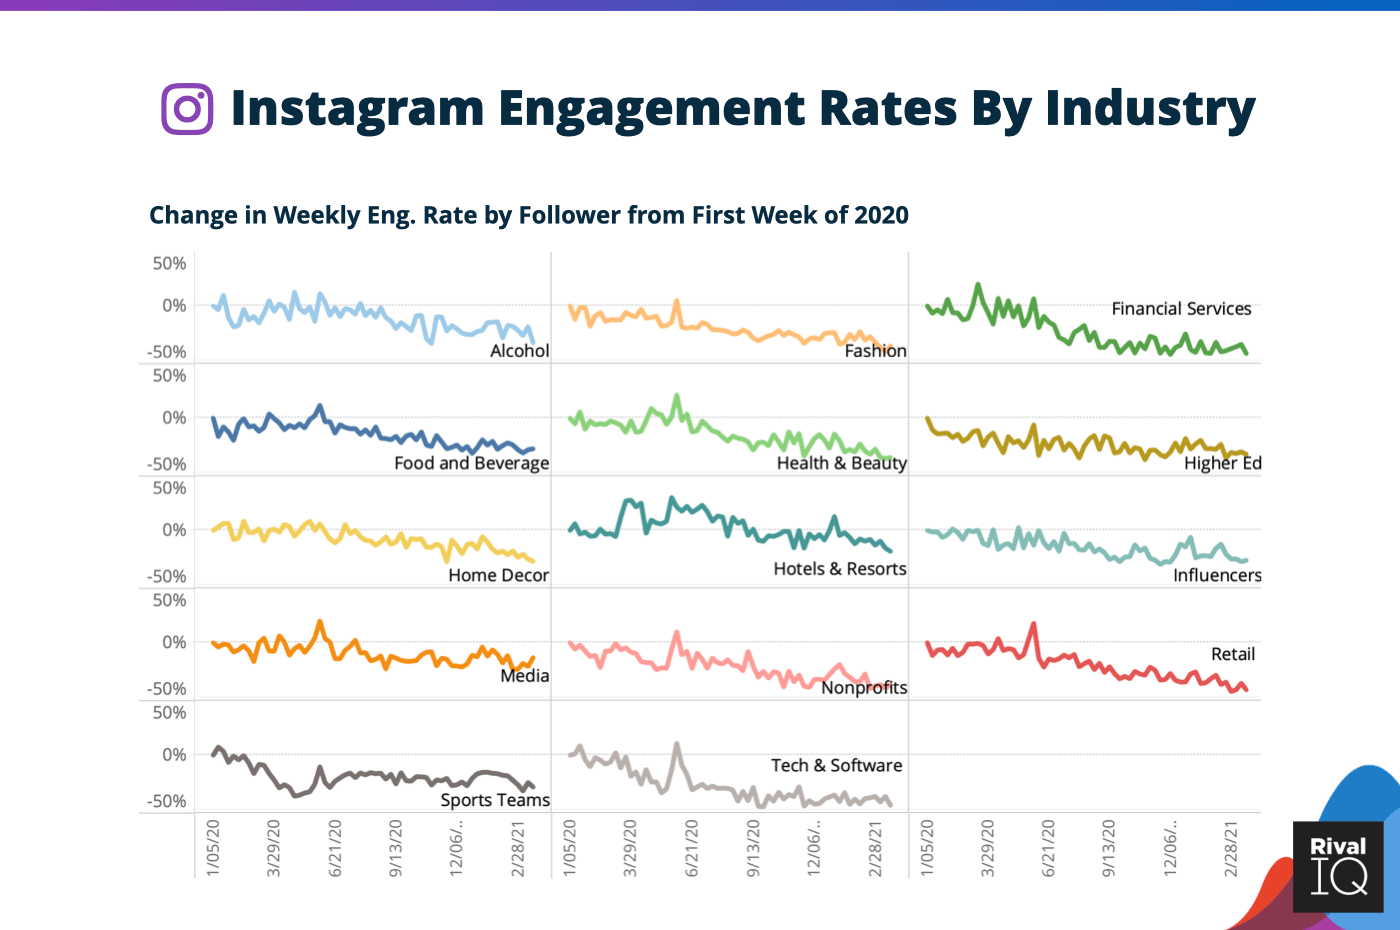
In the graph above, we’re looking at the change in median engagement rates (by follower) from the beginning of 2020 through Q1-2021 for each industry in our report. This normalized view enables us to see how various industries performed throughout the year relative to one another.
Here are some key takeaways:
- Alcohol and Home Decor brands maintained flat engagement throughout much of the early pandemic, only to start tailing off in late summer, at which point they maintained their engagement rates into 2021.
- Sports Teams saw big engagement rate dips early in the lockdown and didn’t regain ground until July 2020 as some sporting events started to return to some play.
- Hotel and Resort brands saw big jumps in engagement rates as the lockdown began and travel around the world ground to a halt. By fall, their engagement rates returned to Q1-2020 levels and remained there for most of the year.
IGTV Benchmarks
Breaking news: 2020 wasn’t a total wash thanks to Instagram finally adding IGTV analytics to its API, making it infinitely easier for brands to study their IGTV performance. We took a look at how IGTV preview posts compared to other post types on Instagram as well as IGTV performance by industry so you can benchmark your success using this elusive (for some) digital medium.
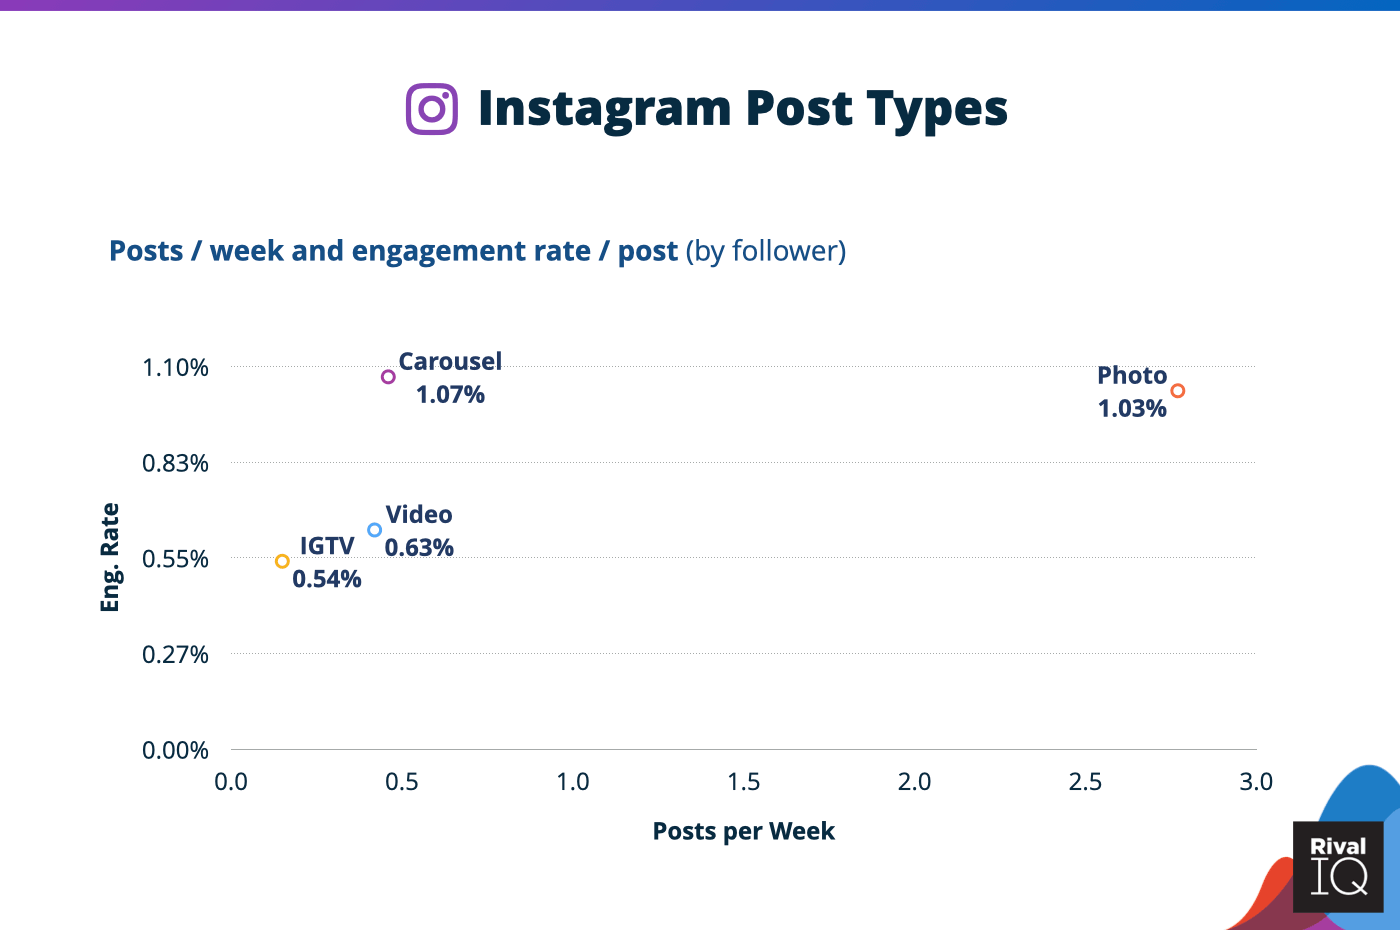
Now for some bad news: IGTV preview posts are the least used media type and they earn the lowest engagement rate of all the post types we studied for 2020. The median engagement rate was 0.54% and the median brand published just 8 (8!) IGTV preview posts all year. Photos and carousels saw about double the engagement rate of IGTV preview posts, while in-feed video posts performed about 15% better than the median IGTV preview post.
Does that mean your brand shouldn’t bother with IGTV, or should stop experimenting with it? F*ck no. With Instagram leaning into longer-form content, video posts of any kind (like IGTV, Reels, and in-feed video posts) are an important part of the Instagram story (no pun intended), and are likely to become even more important moving forward.
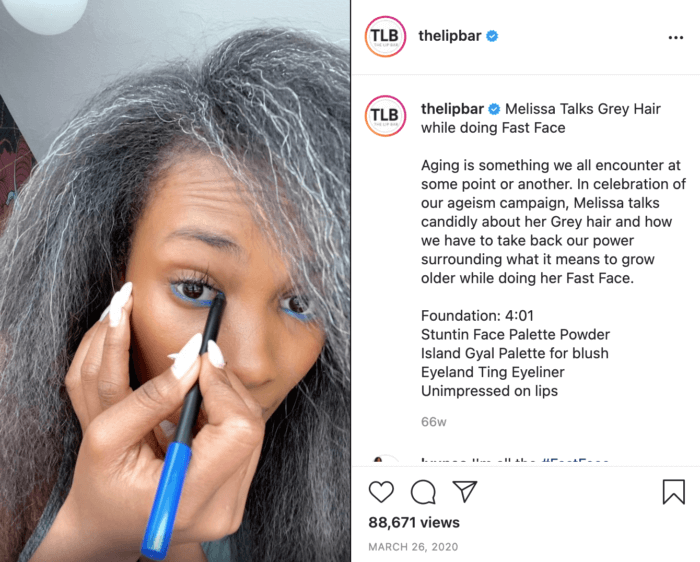
This IGTV post from beauty brand The Lip Bar is a great example of how brands can successfully dip their toes into IGTV with minimal effort and epic engagement. This Black-owned beauty brand grabbed 11th place overall in our Top 100 Beauty Brands on Social Media report in 2021. In this IGTV post, founder Melissa Butler invited followers into her home while she put on her makeup for a candid chat about aging and ageism. The post was extremely successful, pulling in more than 88,000 views and a 6.65% engagement rate, which is more than 13x the IGTV preview post median engagement rate.
The Lip Bar’s post is just six minutes long and manages to be both casual and intimate. This IGTV post serves as a good reminder that brands don’t need flashy, highly-produced videos to succeed on IGTV. Some good lighting, a simple shooting setup (like an iPhone and a place to prop it), and an interesting topic or message are all you need to get started with IGTV.
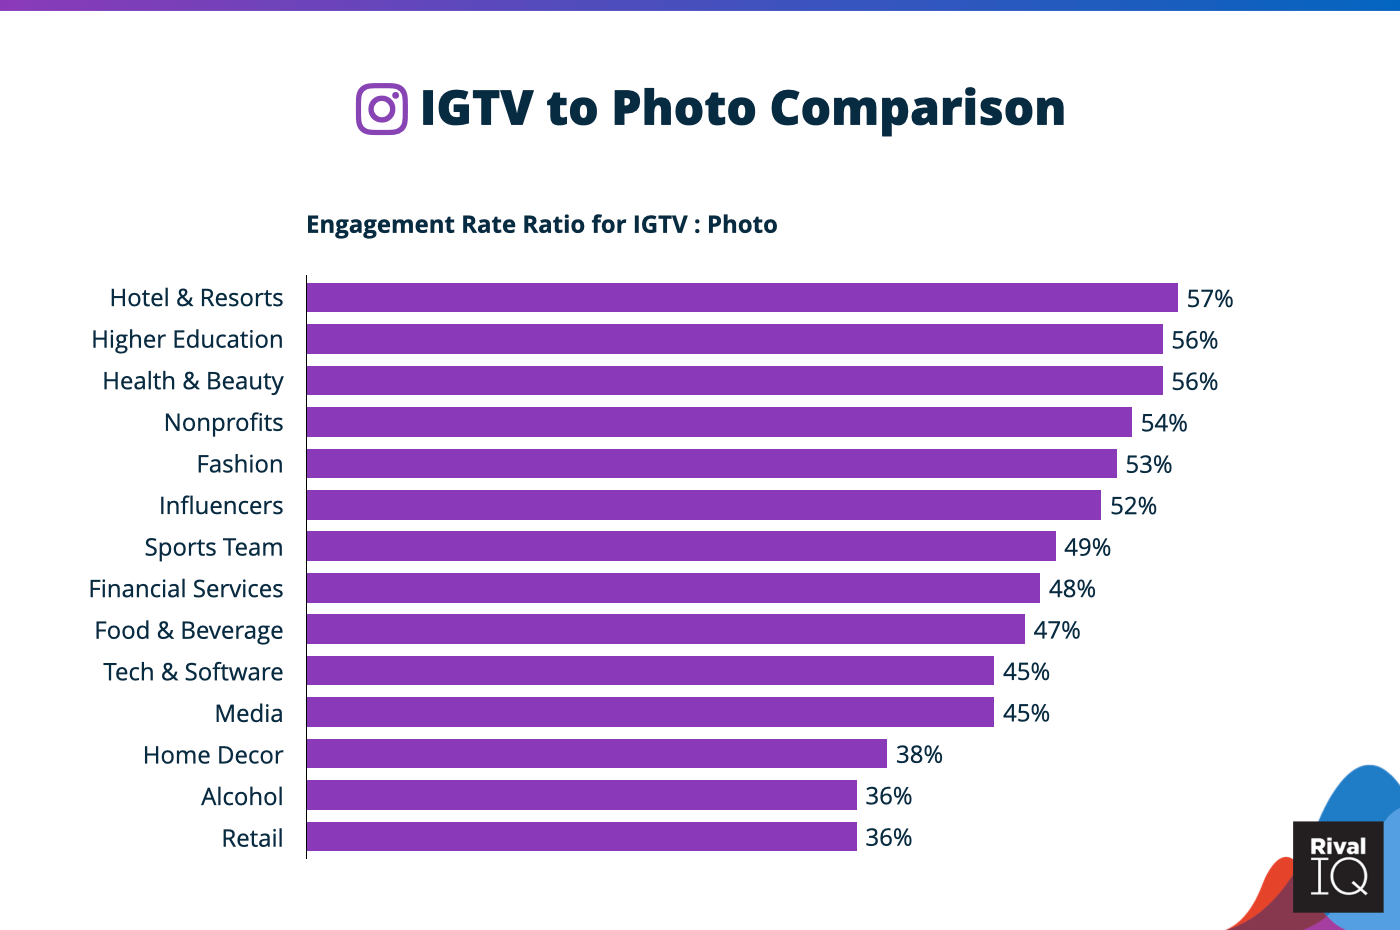
Now, let’s take a look at IGTV performance broken down by each of the 14 industries we survey every year in our Social Media Industry Benchmark Report. Since the absolute engagement rate numbers are pretty small as you saw above, we measured IGTV performance compared to photo performance for each industry and displayed that number as a ratio on the x-axis of the graph above (i.e. Tech & Software’s IGTV preview posts received 45% of the engagement rate as their photo posts).
Hotels & Resorts, Higher Ed, and Health & Beauty were the most successful industries using IGTV last year, with the average IGTV post earning about 55% of the engagement versus the average photo post. It’s easy to make a case for why these industries see the most relative success with IGTV posts: a hotel room tour or a makeup tutorial (like we saw above) are prime candidates for engaging video.
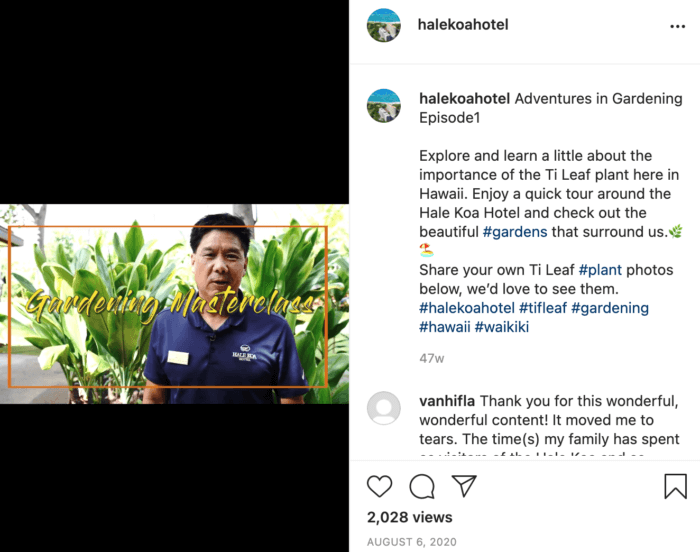
This IGTV post from the Hale Koa Hotel in Hawaii featuring a quick garden tour with a focus on the native Ti Leaf plant grabbed thousands of views and a 4.75% engagement rate with its simple mix of a beautiful backdrop, an engaging presenter, and a hint of FOMO for anyone outside of Hawaii watching who wasn’t able to take the vacation of their dreams during the pandemic.
Middle-of-the-road industries like Sports Teams and Financial Services had a little more trouble engaging viewers with the IGTV format when compared to photos, with IGTV posts seeing less than 50% the engagement oomph of a photo post. Alcohol and Retail brands struggled the most, seeing IGTV posts earn on average just 36% the engagement of a photo post.
These struggles aren’t too surprising: Alcohol fans on Instagram are likely more primed for a photo post featuring a new release or a recipe than, say, a bar tour, while Sports Team fans might be looking more for a quick score update than a full game recap on Instagram.
So many of the social media innovations we’ve seen in the last few years, from TikTok to Facebook and Instagram Stories to Reels and beyond, have signaled an investment in short-form video content from these channels. The moral of the story is that just because brands aren’t seeing epic engagement from IGTV now doesn’t mean they shouldn’t be investing in that post type, and short-form video content in general.
Bucking the Instagram Trend: Southern Methodist University
Let’s talk about a university with a f*cking amazing story of engagement and retention amidst the challenges of 2020. Southern Methodist University managed to increase its total engagement by 7x from pre-COVID levels to 2021 thanks to a strategic mix of campus glamour shots, COVID updates for parents and students, and a whole bunch of successful carousels.
The secret to this university’s Instagram success? When SMU nearly tripled posting from 1.2 to 3.3 between 2020 to 2021, the university also increased Instagram engagement totals from 9.7K in Q1-2020 to 75K in Q1-2021. This success is a big deal and something for other universities to aspire to. These results speak for themselves: SMU generated more engagement by posting more each week and posting more consistently.
Reminder: Posting at least 3-4 times per week keeps followers engaged (and more frequently is often even better). Posting consistently week-to-week will produce more consistent reach and engagement. Of course, we recommend against posting low-quality content just for the sake of posting: high-quality and resonant content should be the priority for anyone posting on social media regardless of reach or industry.
SMU is far from the only organization we studied that’s finding success with elevated posting frequency, so it’s worth getting into what worked well for the university.
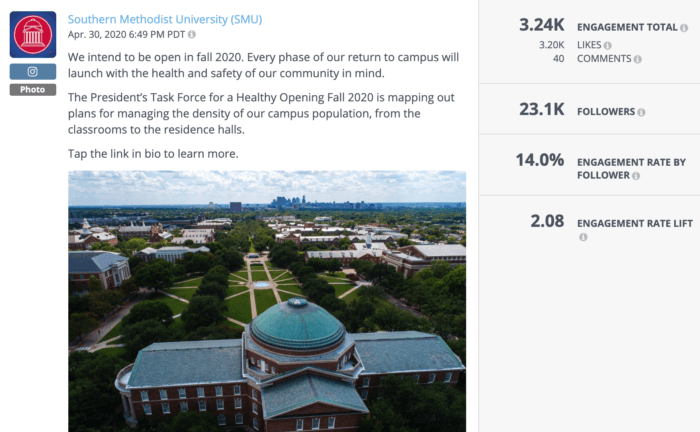
SMU’s first instance of increased posting resulting in increased engagement totals came at a really logical time in 2020: spring, when students, parents, and alumni were starved for information about what was happening on campus as a result of COVID-19. This informational Instagram post had the third-highest engagement rate and fourth-highest engagement total of 2020 for SMU thanks to nothing more than a campus glamour shot and some much-needed information for followers.
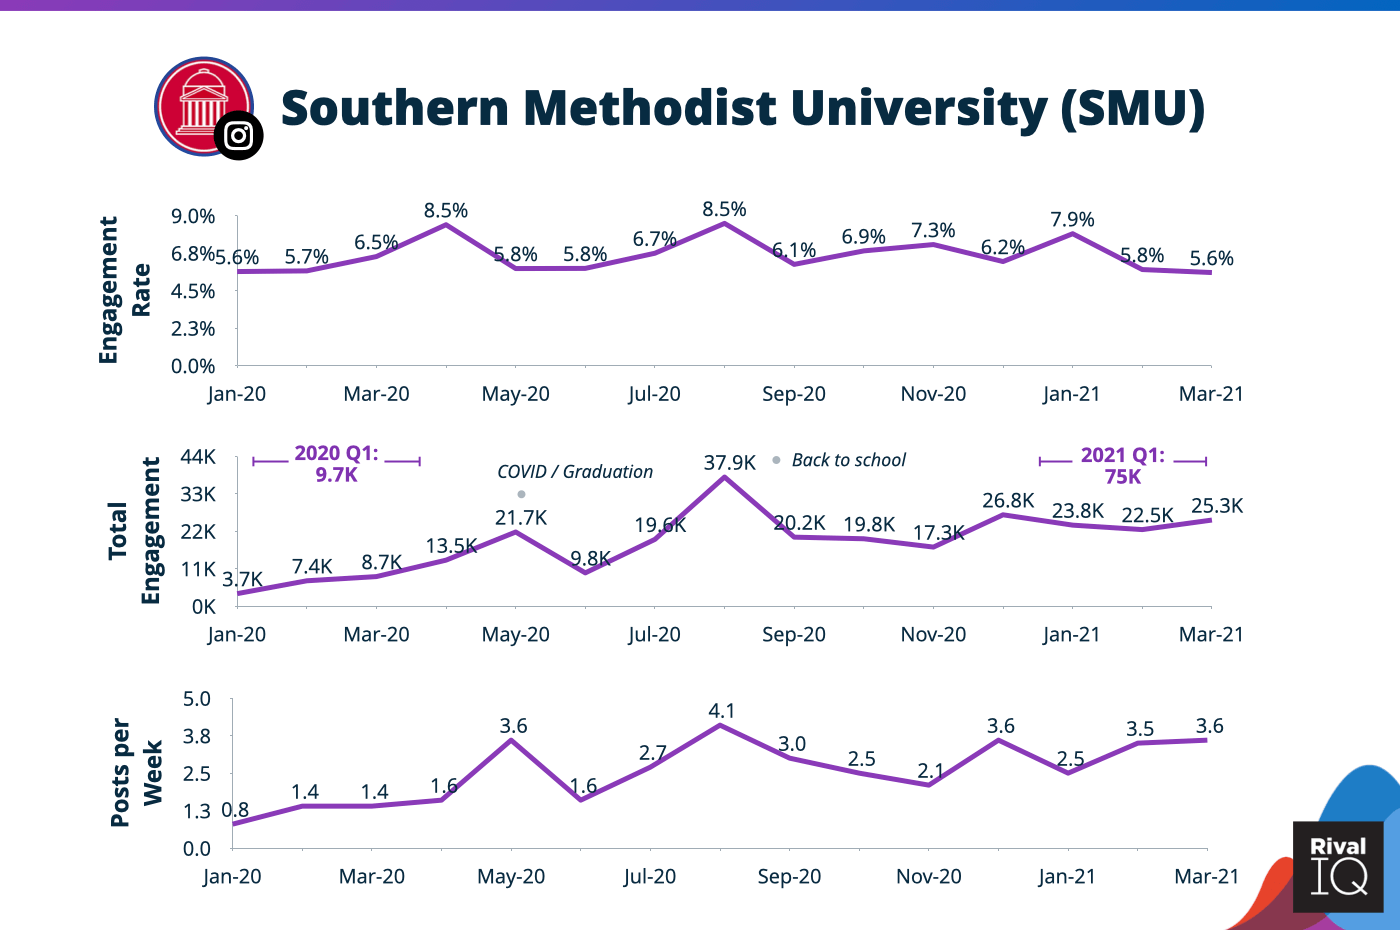
During this time, SMU increased its posts per week from 1.2 to 2.3 (and up to a whopping 9 posts per week in April/May 2020), which correlates with an increase in total engagement from 6.6K to 15K during this period. Engaging posts in this period included COVID-19 information, graduation posts, and lots and lots of reminders of the magic of the SMU Mustang lifestyle on and off campus.
This post and the rest of its cohort comprised the first indicator that SMU was making some magic by increasing its posting volume. SMU repeated these successful results with a back-to-school bump in August. (And again in mid-December, and again in early February 2021. You get the gist.)
Facebook engagement in 2020
Facebook is the channel we love to hate, but it’s still an important tool in the toolbox for the vast majority of social media marketers. Brace yourselves–the news isn’t great about what’s happening to social media engagement on this channel, but this is definitely a channel still worth paying attention to.
Facebook Benchmarks Over Time
Moving to the second channel in our analysis, we’ll examine Facebook in more detail. For the calendar 2020 year, our Industry Benchmark Report showed that brands earned an average engagement rate per post of 0.08%, slightly down from the previous year’s value of 0.09%. Like Instagram, brands also published slightly fewer Facebook posts in 2020, down from 5.8 posts per week to 5.5 in 2021.
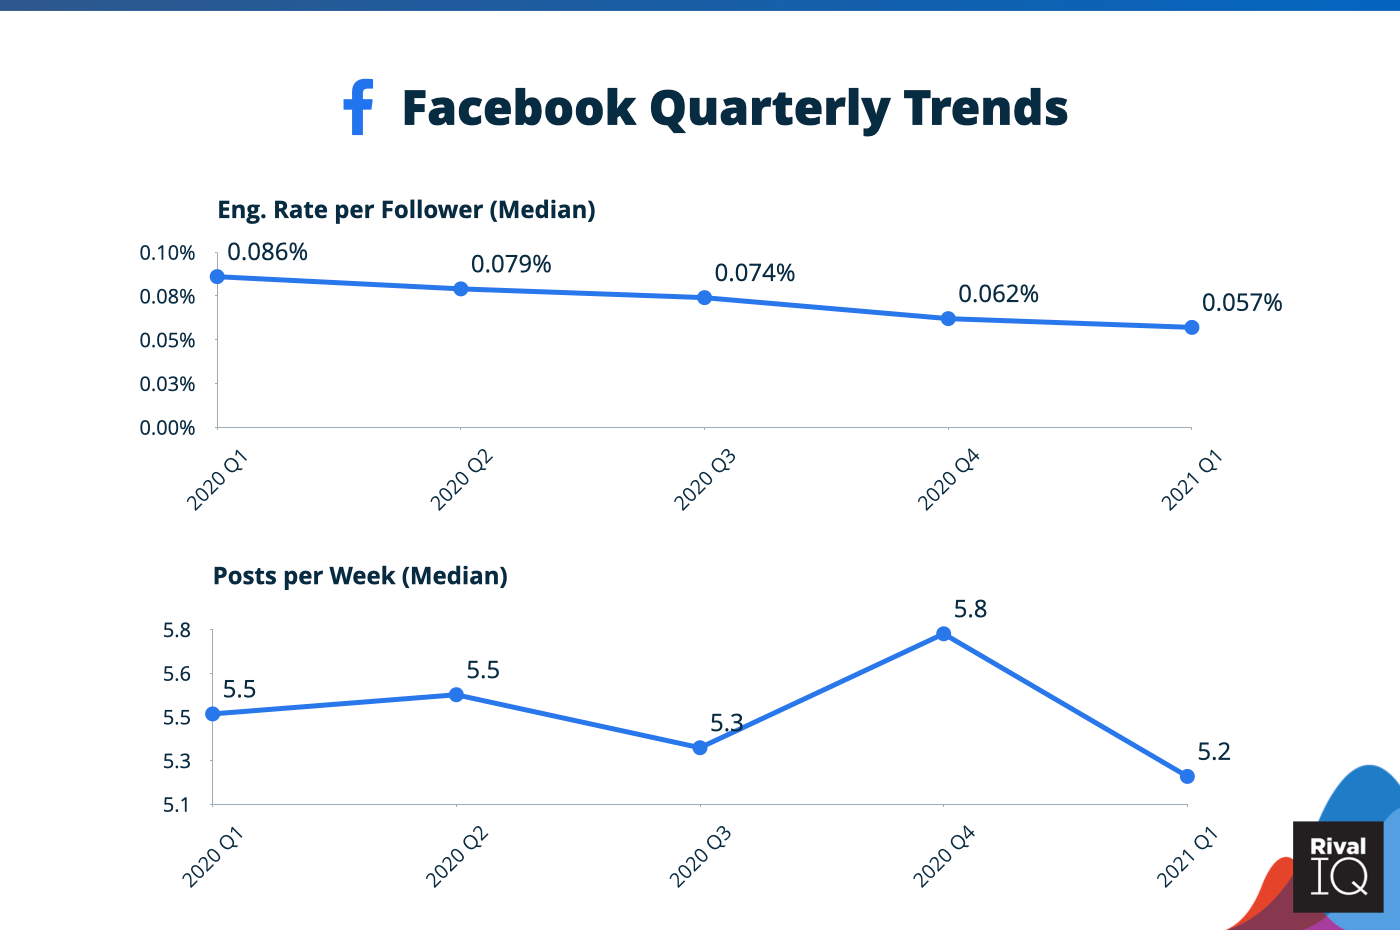
As we saw for Instagram, the median engagement rate per post dropped each quarter of 2020, starting at 0.086% for Q1 and ending the year with 0.062% for Q4. That downward trend has continued into Q1-2021, with the median engagement rate hitting 0.057%. Comparing Q1-2021 vs Q1-2020, we see a 34% drop in the median engagement rate.
The average posting volume for the year was about 5.5 posts per week, and as you can see in the second graph above, that value was mostly in line with quarterly values. In Q3-2020, we did see a decline in posting volume to 5.3 posts per week, though that number rebounded to 5.8 posts per week in Q4. We saw this same posting volume pattern for Instagram, too, with a Q3 decline follower by a Q4 increase.
Before we continue, let’s address a note about our analysis for the curious reader. You may be looking at the graph above and wondering why most of the quarters have a median engagement rate that is below the full-year median of 0.08%. Don’t be alarmed, it’s not a mistake! Rather, it’s a result of using a smaller time period (a quarter instead of a year) to compute the average engagement rate for each brand.
Let’s take a look at how that works.
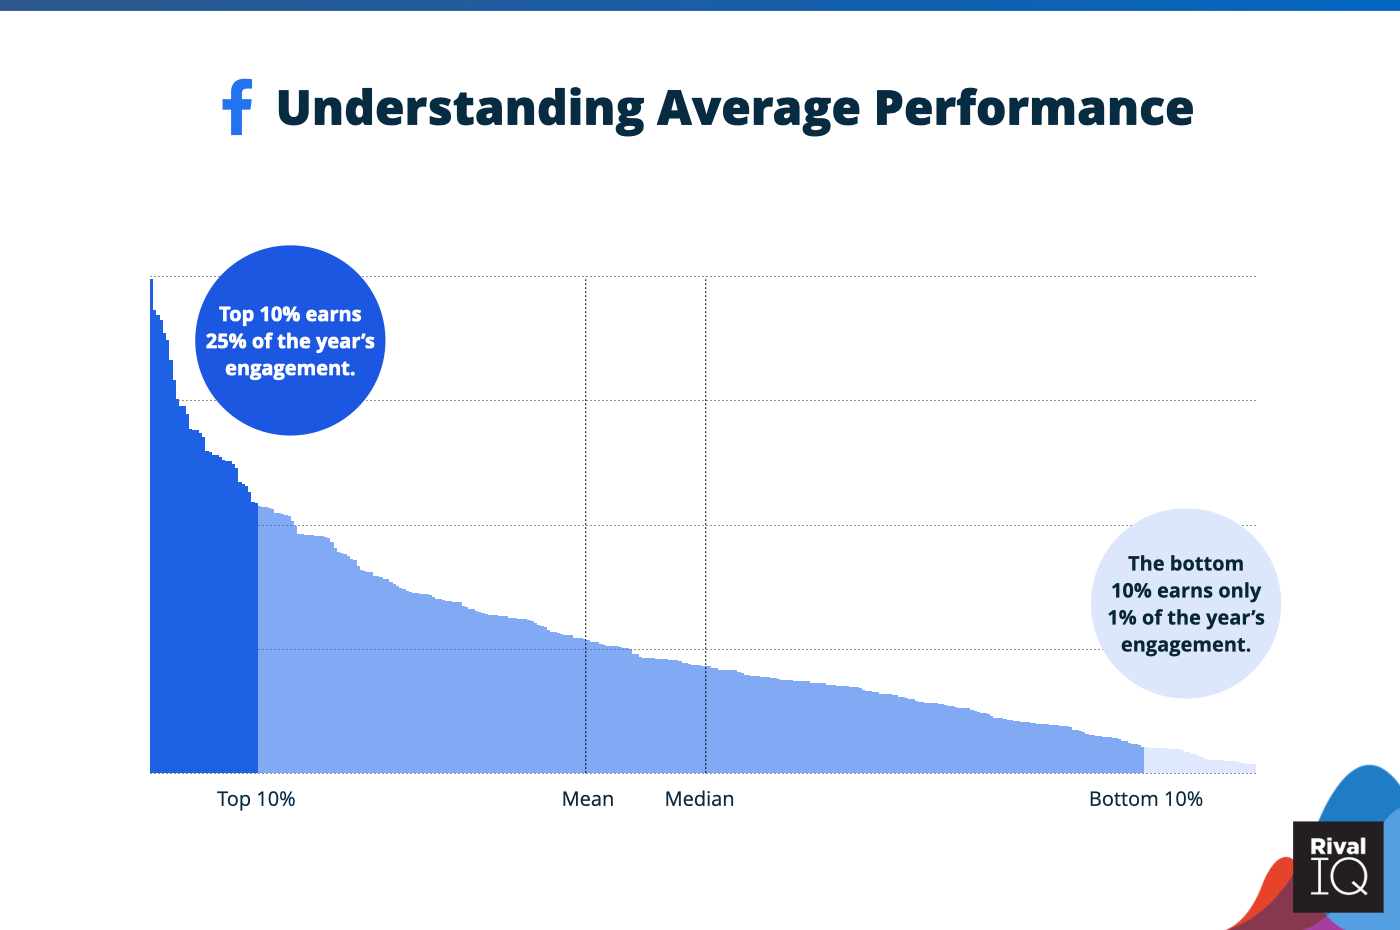
Examining the graph above, we’ve shown all the posts for 2020 from an example brand in the study, and you’ll see they earn 25% of their entire year’s engagement from just 10% of their posts. Meanwhile, they earn just 1% of their overall engagement from the bottom 10% of their posts. This skew in the data tends to produce a typical week (or month) whose average engagement rate is less than the average for the year. Said more simply, having a handful of really successful posts each year won’t change your engagement rates for an average week, but that set of killer posts will absolutely raise your total engagement (and therefore your average engagement rate) for the year.
As a result, when you compute the median engagement rate across brands, you’ll see lower values when grouping by time periods that are shorter than the full year—since they’re shorter, they’re less likely to have the high-valued outliers that drive the yearlong average upward.
Moving back to our Facebook trend data, let’s look at the weekly trends.
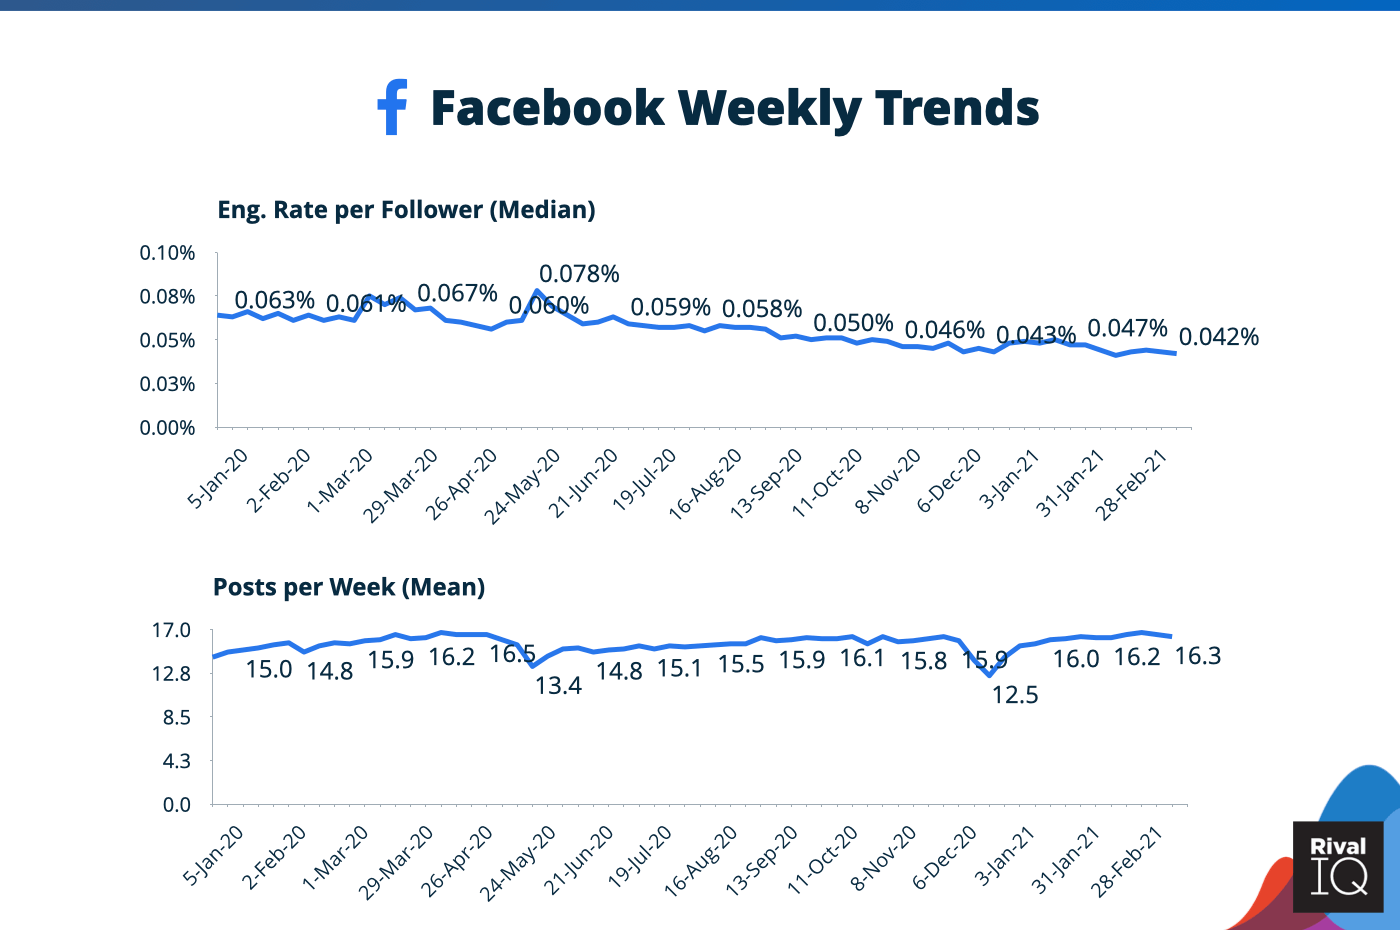
In the graphs above, we expand our view into the Facebook trends by looking at our engagement rate and posts per week data week-by-week. Please note, we’ve switched the posts-per-week metric to use the mean to give you a better sense of the subtle shifts in the total amount of content brands were producing. Like with our Instagram weekly data, you’ll note deviations around lockdown, the murder of George Floyd, and the 2020 holiday season.
Facebook Engagement Rate Trends by Industry
In the following two charts, we’ll examine the evolution of Facebook engagement rates and posting volumes for each industry in our benchmark report using weekly data since January 2020.
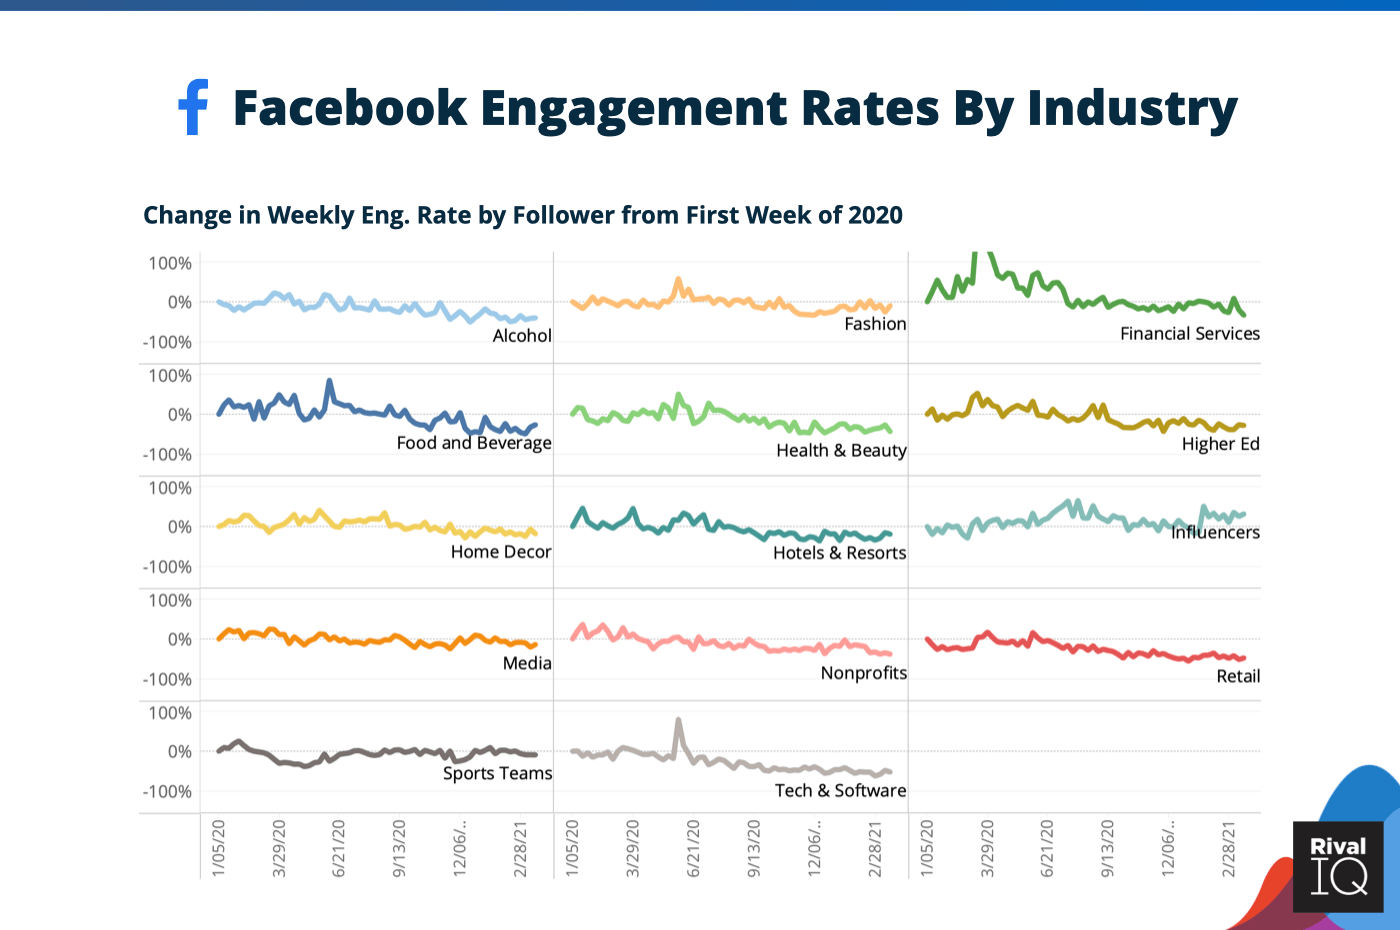
In the graph above, we’re looking at the change in median Facebook engagement rates (by follower) from the beginning of 2020 through Q1-2021 for each industry in our report. Like with the Instagram version, this normalized view enables us to see how various industries performed throughout the year relative to one another.
Here are some key takeaways:
- Sports Teams, while taking a big dip early during the pandemic, returned to pre-pandemic engagement rates by fall 2020.
- Influencers actually grew their engagement rates during the year, only to return to their beginning of the year numbers by fall. They’ve started 20201 strong with engagement rates well above their Q1-2020 levels.
- As we saw with Instagram, Alcohol and Home Decor brands stayed relatively constant through the early lockdown and only started to see engagement rate declines in fall 2020.
- Tech and Software brands declined steadily throughout the year and continued that decline into 2021.
Bucking the Facebook Trend: Seattle Storm
Of all the things the Seattle Storm (our hometown women’s basketball heroes) should be proud of in 2020, more than doubling their total engagement from 2020 and 2021 should be at the top of the list. (Never mind that WNBA championship win.) It would be easy to attribute all of the team’s success on social to playing well on the court, but there’s more to it than that. Let’s get into it.
First off, here’s a quick competitive context rundown so you’re aware of why this team in particular is worth paying attention to. The Seattle Storm was the 14th most engaging sports team of 2020 on Facebook in our Social Media Industry Benchmark report. The team averaged about 2x the sports teams engagement rate median last year and posted about 1.5x as frequently as the average sports team, suggesting that the Storm consistently has their social dialed in.
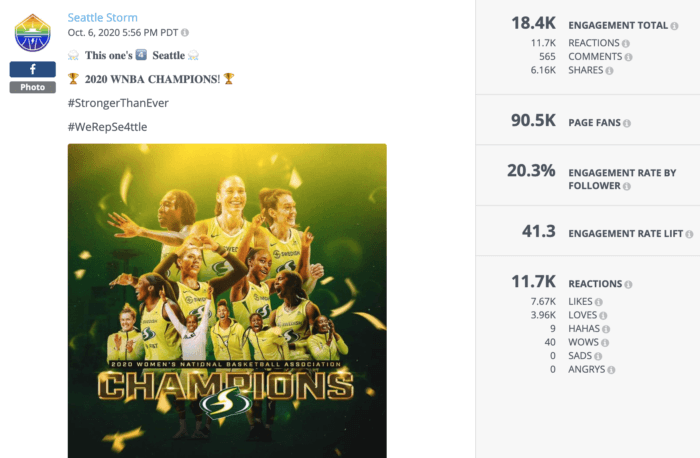
Okay, let’s get the elephant-sized trophy out of the way first: the Storm’s most engaging Facebook post of the year about being the 2020 WNBA champions rocked a whopping 20.3% engagement rate. Do all sports teams need to be the best g*ddamned team in the league to succeed on social? No. Does it help? Sure.
Many of the team’s most engaging posts of the year were from fall 2020 when they were scorching all the other teams in the WNBA, so it would be easy to correlate their success on social exclusively to their success on the court. As you can see in the graph below, the Storm steadily increased their Facebook posting at the start of the WNBA season starting around mid-July, and really ramped things up during the lead-up to the finals in October.
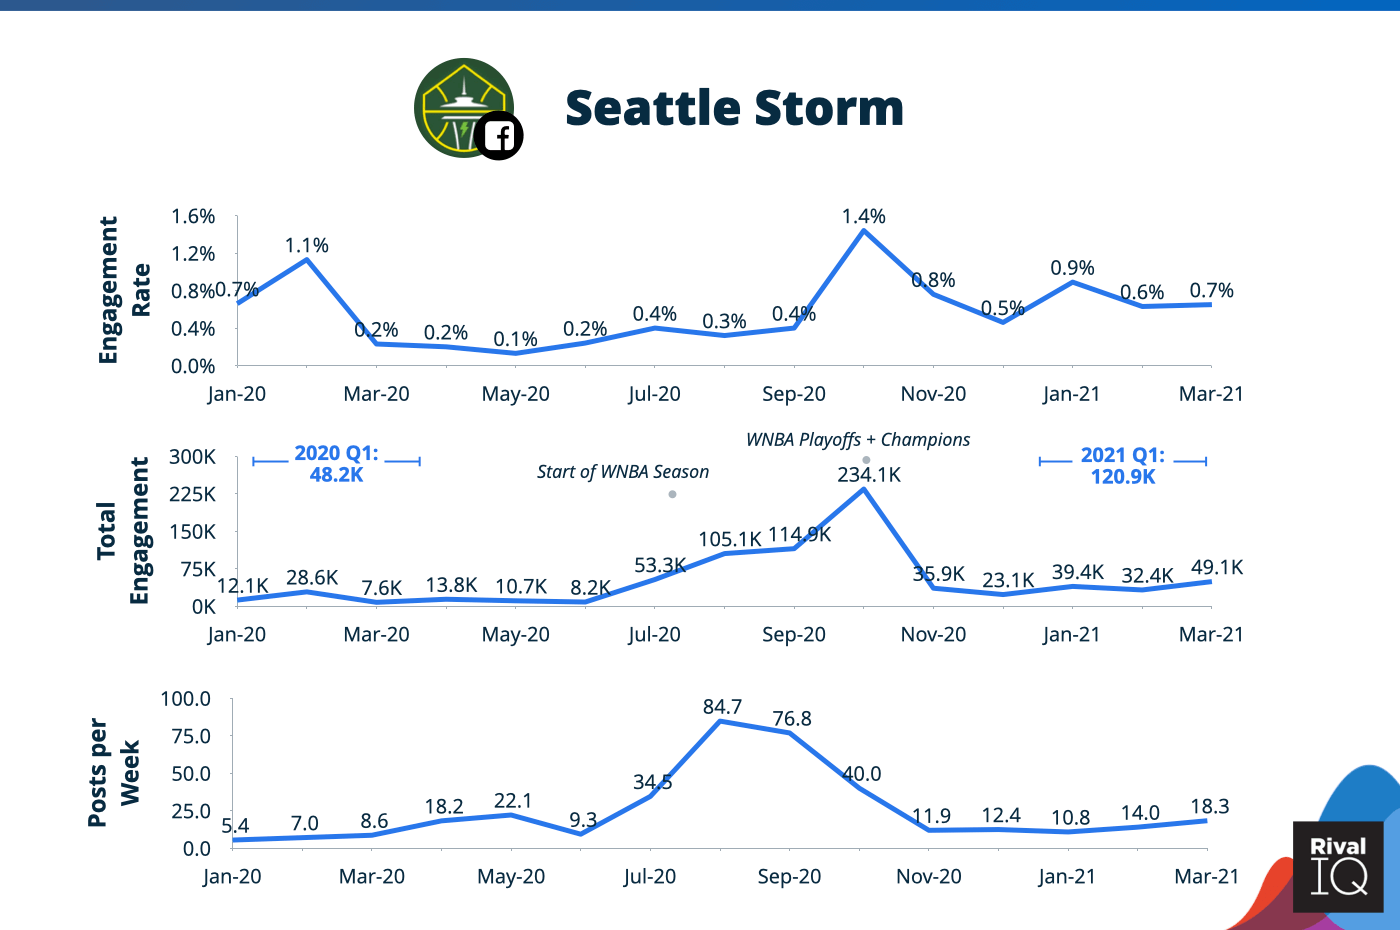
The mid-August posting volume increase kept the engagement rate pretty flat but started to ramp up the team’s total engagement, which served to prime followers for an increase in content and engagement later in the season.
The giant increases in posting volume, total engagement, and engagement rate were definitely the Storm’s bread and butter on social last year. As we’ve pointed out, it’s logical that a championship-winning team would a) post more frequently and b) receive more engagement on social when sharing their success with followers. But what’s truly interesting about the Storm is that they were using this time of increased attention to share non-basketball posts on Facebook as well, from Seattle Storm starter Sue Bird’s engagement to Seattle soccer legend Megan Rapinoe and even a congratulatory post to President Biden and Vice-President Harris after the 2020 election.
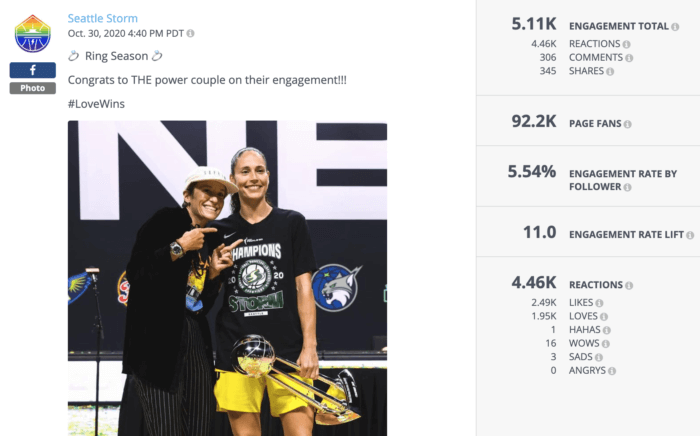
These posts could be viewed as risky for some teams by featuring LGBTQIA+ and political themes, but at this point in the season, the Storm knew their social was untouchable. This post about the Bird/Rapinoe engagement rocked a 5.54% engagement rate and was the team’s fifth-most engaging post of 2020.
These non-championship posts during the Storm’s victory lap also help tell the story that increasing your posting at a time when your followers are paying attention contributes to increased engagement, even if you’re not posting directly about whatever it is your followers came to your Facebook Page for.
The team’s steady increase in posting and engagement during the season was a big contributor to the Storm’s more than doubling their total engagement between Q1-2020 and Q1-2021.
Twitter engagement in 2020
Twitter has its benefits (the chance for brands to connect 1:1 with followers) and drawbacks (trolls), but hey, at least the character count limit prevents you from writing 5,000-word opuses like this one. But any marketer should be paying attention to the declines in both engagement rate and tweet frequency over time on this channel.
Benchmarks Over Time
For the calendar year 2020, our Industry Benchmark Report showed that brands earned an average engagement rate per tweet of 0.045%, in line with the previous year. The median brand published about 4.4 posts per week, down from 5.4 in 2019.
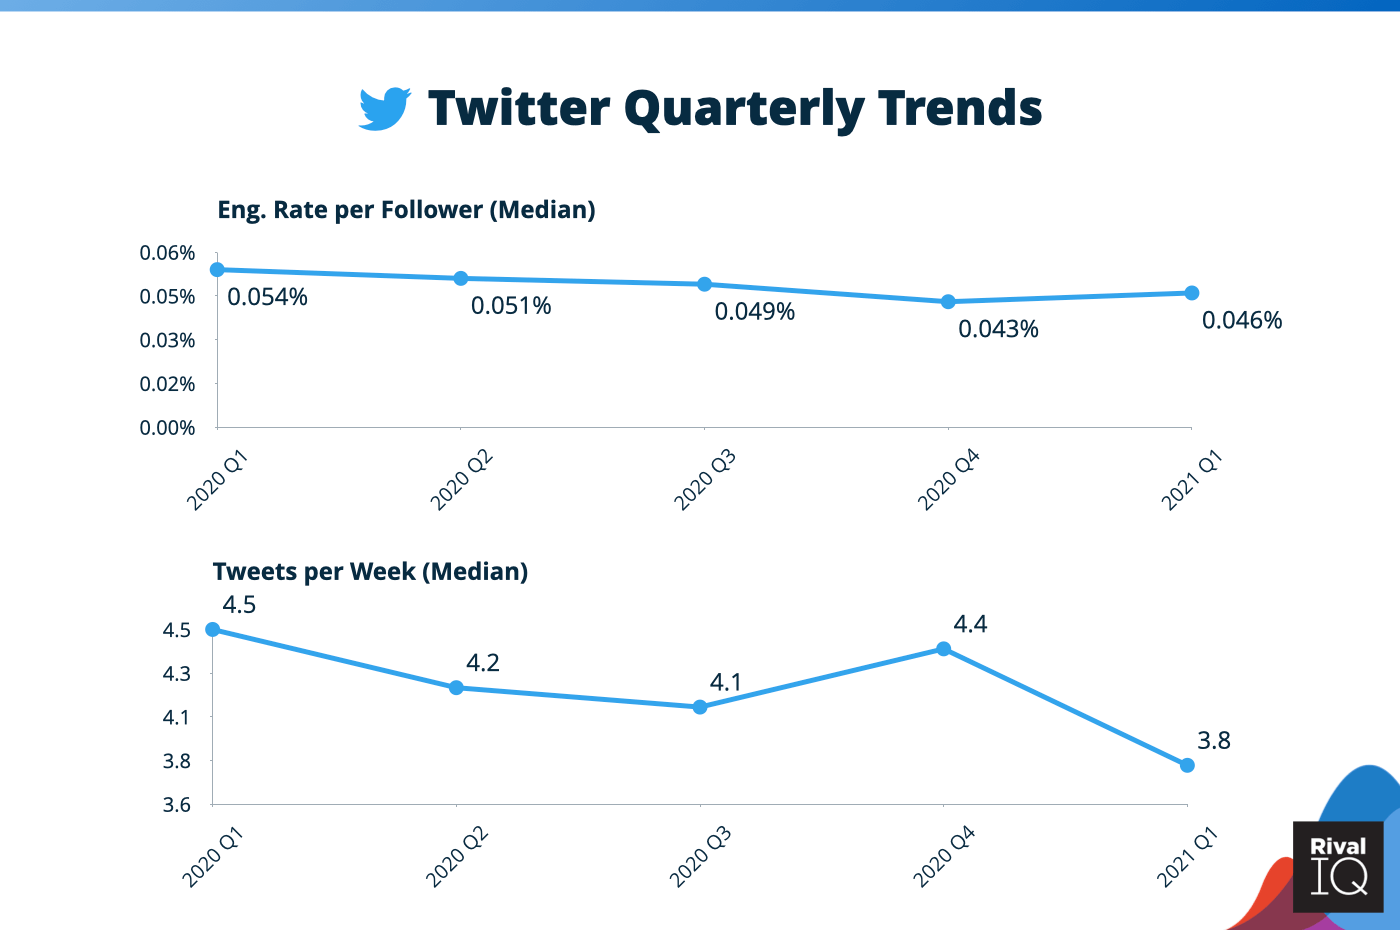 Looking at the top graph above, we see that the median engagement rate per follower started off the year at 0.054% for Q1 and trended down slightly through 2020, ending with Q4 at 0.043%. Despite a slight decline through 2020, the median Twitter engagement rate increased slightly in Q1-2021 to 0.046%. That value, though higher than Q4, is still down 15% when compared to Q1-2020.
In the second graph, we see that although tweet volumes were relatively flat throughout the year, the same pattern of a Q3 decline followed by a Q4 increase occurred on Twitter just as on Facebook and Instagram.
Moving on, let’s have a look at the weekly trend data for Twitter.
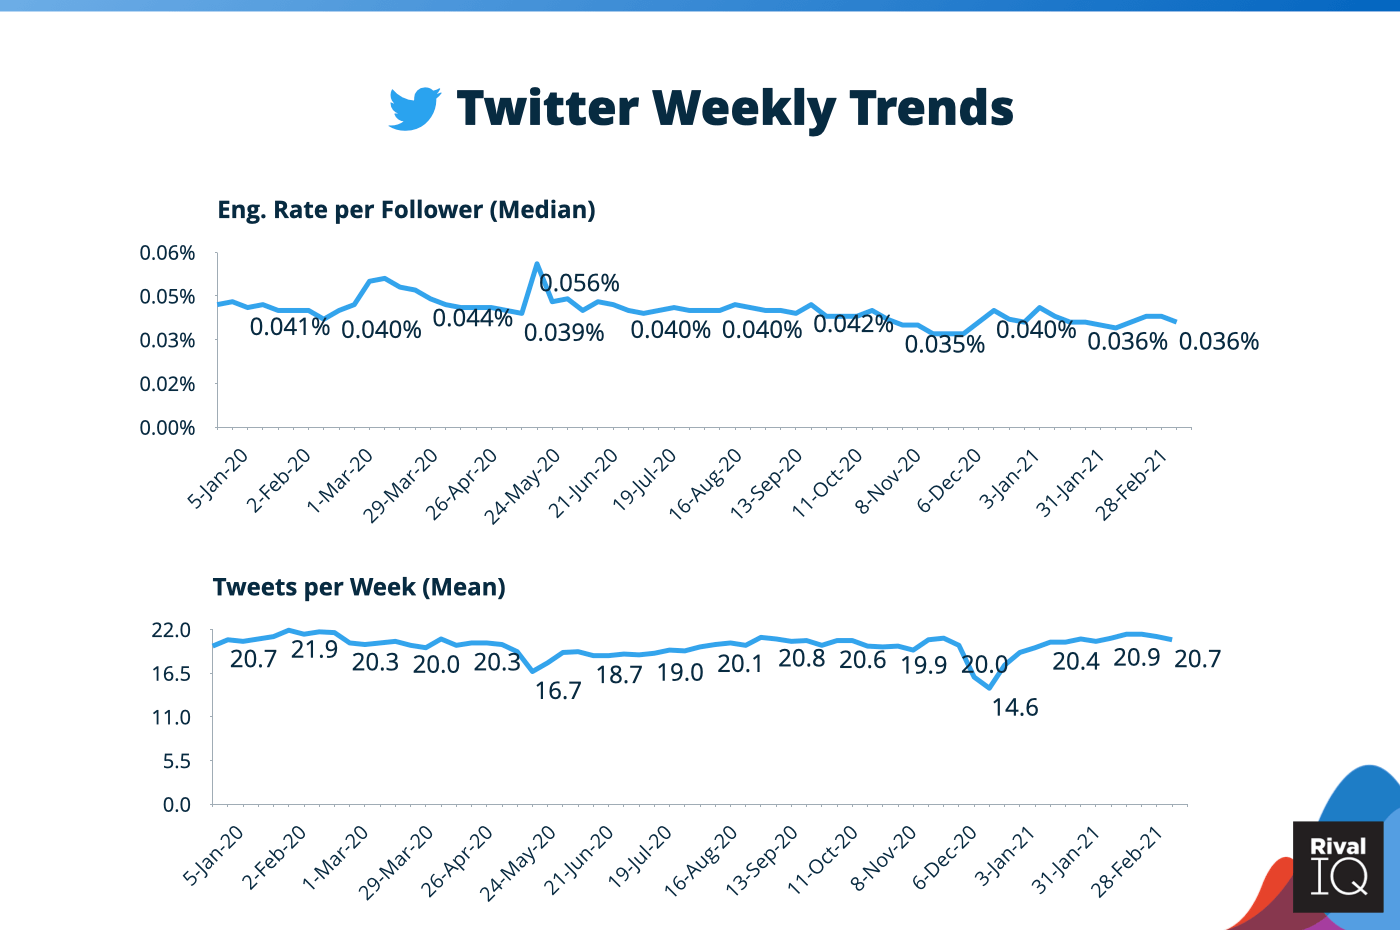
Here we’ve switched the posts-per-week metric to use the mean to give you a better sense of the subtle shifts in the total amount of content brands were producing. Like with our weekly data from Instagram and Facebook, you’ll note the same deviations around the COVID lockdown, the murder of George Floyd, and the 2020 holiday season.
Twitter Engagement Rate Trends by Industry
In the following two charts, we’ll examine the evolution of Twitter engagement rates and posting volumes for each industry in our benchmark report using weekly data since January 2020.
Please note that these charts represent the percent change in each week from the first week of 2020. This enables us to compare the relative changes across industries regardless of their overall performance.
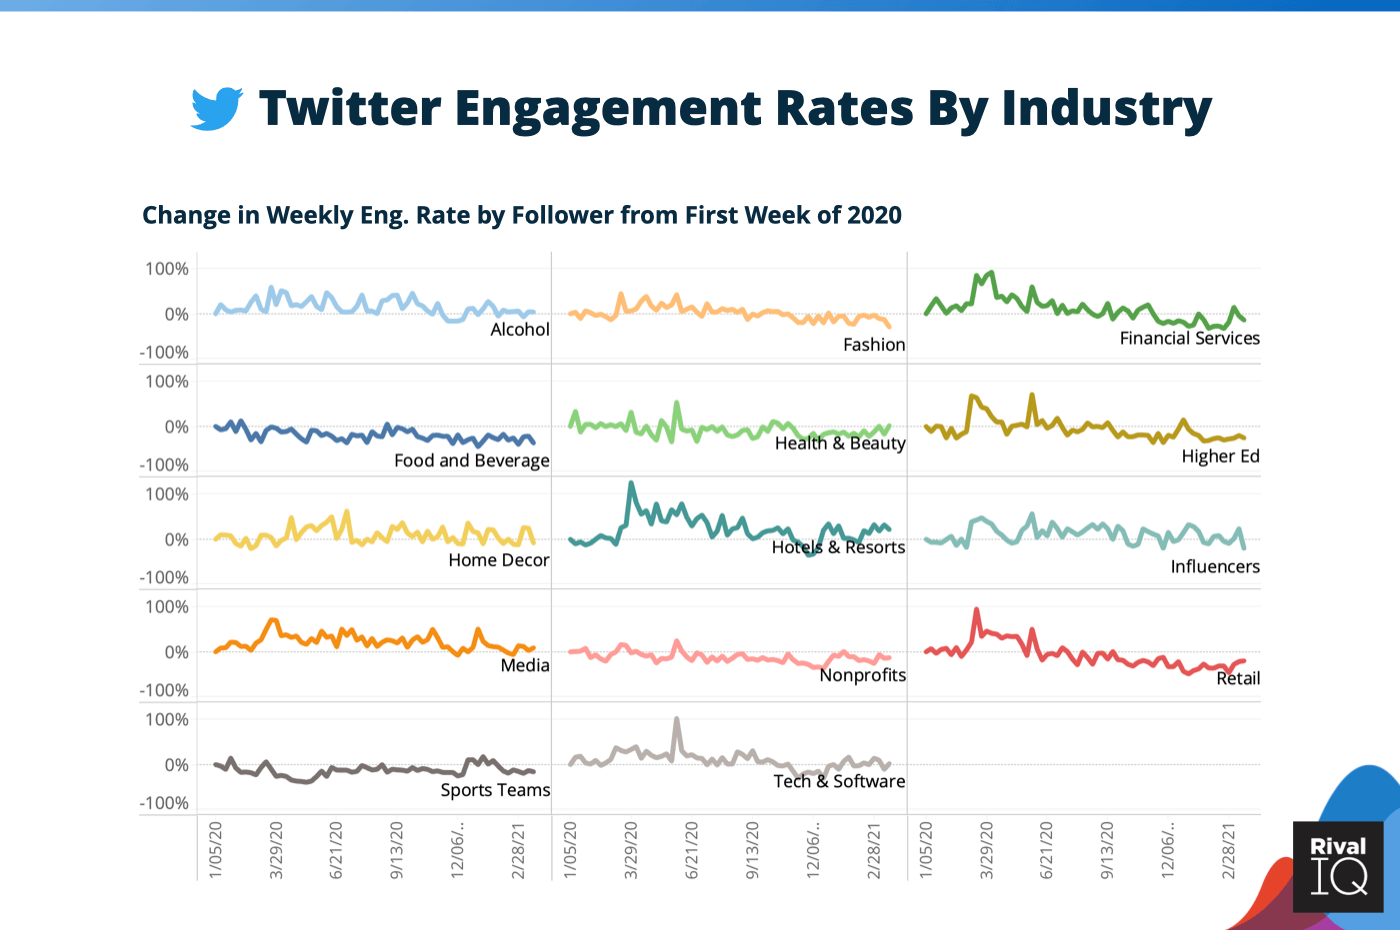
In the graph above, we’re looking at the change in median Twitter engagement rates (by follower) from the beginning of 2020 through Q1-2021 for each industry in our report. This normalized view enables us to compare how various industries performed throughout the year.
Here are some key takeaways:
- Unlike on Facebook and Instagram, we see that a number of industries saw elevated engagement rates for several weeks at the beginning of lockdown including Alcohol, Home Decor, Media, Hotels, Higher Ed, Retail, Financial Services, and even Tech & Software.
- Engagement rates for Media brands stayed elevated for almost the entirety of 2020, only returning to early 2020 levels in Q1-2021.
- Most industries are seeing Q1-2021 engagement rates in line with those from Q1-2020 except for Retail, Higher Ed, Financial Services, and Food & Beverage.
Bucking the Twitter Trend: United State of Women
The nonprofit organization The United State of Women (USOW) has worked tirelessly since its genesis during the Obama administration to advance its goal of gender equality for all via workshops, conferences, policy changes, and more. This dynamic organization is extremely active and engaging on Twitter, and has only grown more successful on this channel over the last 12 months, with a 76% increase in engagement total between Q1-2020 and Q1-2021.
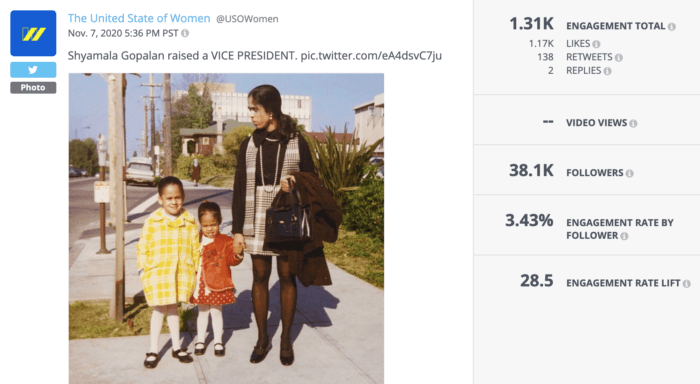
USOW often uses Twitter to connect with followers about current events that are likely to affect women and gender equality: the Roe vs. Wade anniversary, the death of Ruth Bader Ginsberg, and of course the 2020 election. Simple tweets like this one about Kamala Harris’ mother on the day of her VP win garnered a lot of engagement for the organization by making it easy for followers to celebrate the outcome of the election via a women-focused lens. This tweet rocked a 3.43% engagement rate, which was the second-highest engagement rate USOW saw all year.
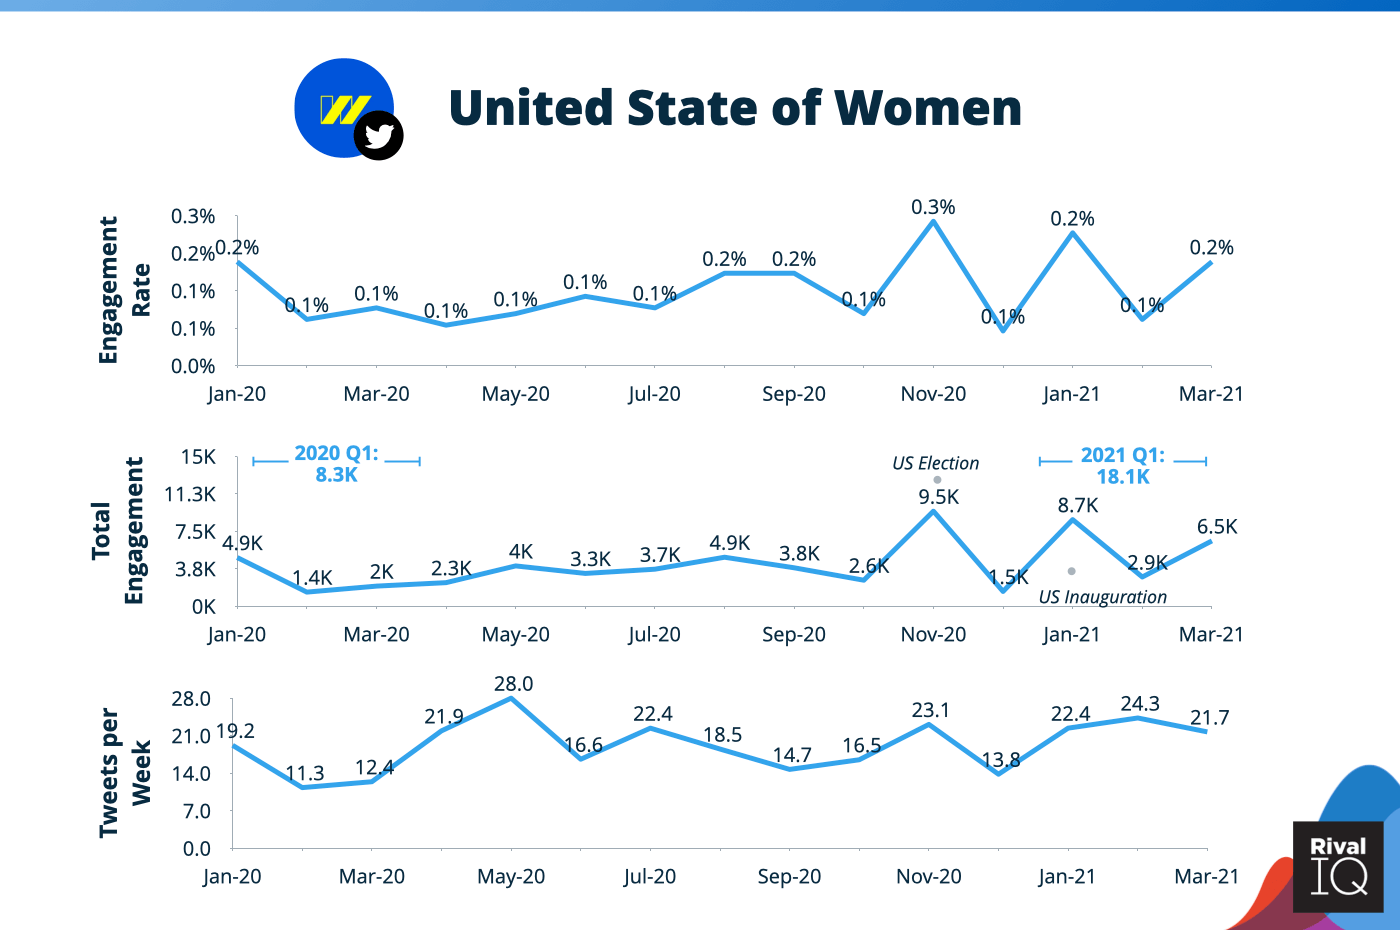
Election-focused tweets were clearly a big engagement driver in Q4-2020 as shown on this graph, but tweets during this time period are far from the only explanation for USOW’s consistent growth between 2020 and 2021. USOW stepped up for its followers by increasing its tweeting during Q2-2020 and just kept on climbing after that.
The organization increased its tweeting volume by 50% from Q1-2020 to Q1-2021 and saw a big increase in total engagement of 75%, suggesting that once again, more is more. USOW worked hard in an election year to keep women front and center in the nation’s Twitter feeds, and found a lot of success with those efforts with increased engagement.
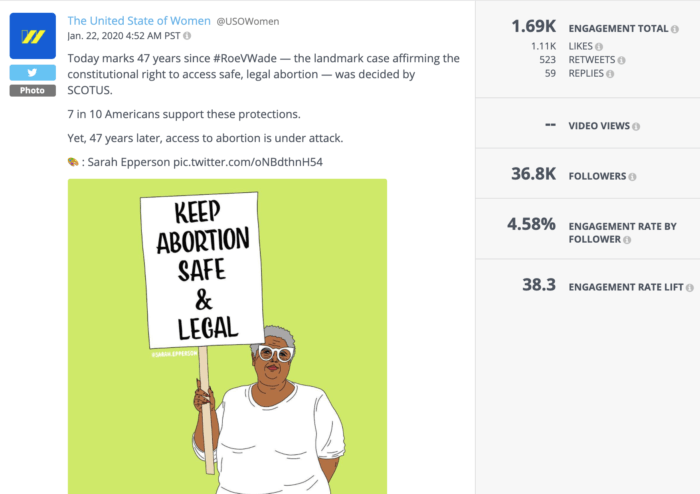
Speaking of increased engagement, is all engagement good? This tweet about the 47th anniversary of abortion ruling Roe vs. Wade was USOW’s tweet with the highest engagement rate of 2020 thanks in large part to pro-life dissenters and trolls.
Should USOW stop posting about controversial topics like abortion to try to decrease negative sentiment on the organization’s Twitter profile? No. (Editor’s note: f*ck no.) An organization formed to amplify the voices of women and gender nonconforming people is clearly prepared to break a few eggs to whip up the gender equality omelette, and that preparation pays off in tweets like these. Swift community moderation by USOW removed the worst of the replies, which helps mitigate the negative effects of taking on a topic that invites divisive opinions.
The nonprofit industry was able to maintain its social media engagement rates during tumultuous 2020 by serving as community gathering points and sources of knowledge about what was going on in the very uncertain world, while many other industries like Food & Beverage and Retail just weren’t able to meaningfully connect with followers in the same way. USOW shined on Twitter by keeping their tweet content timely and mission-focused and by increasing tweet volume in a sort of snowball success effect.
Key Events
We can’t say it enough: 2020 was a f*cking weird year. Let’s break down the impacts of key events like the US COVID lockdown, the murder of George Floyd, and a few other notable events.
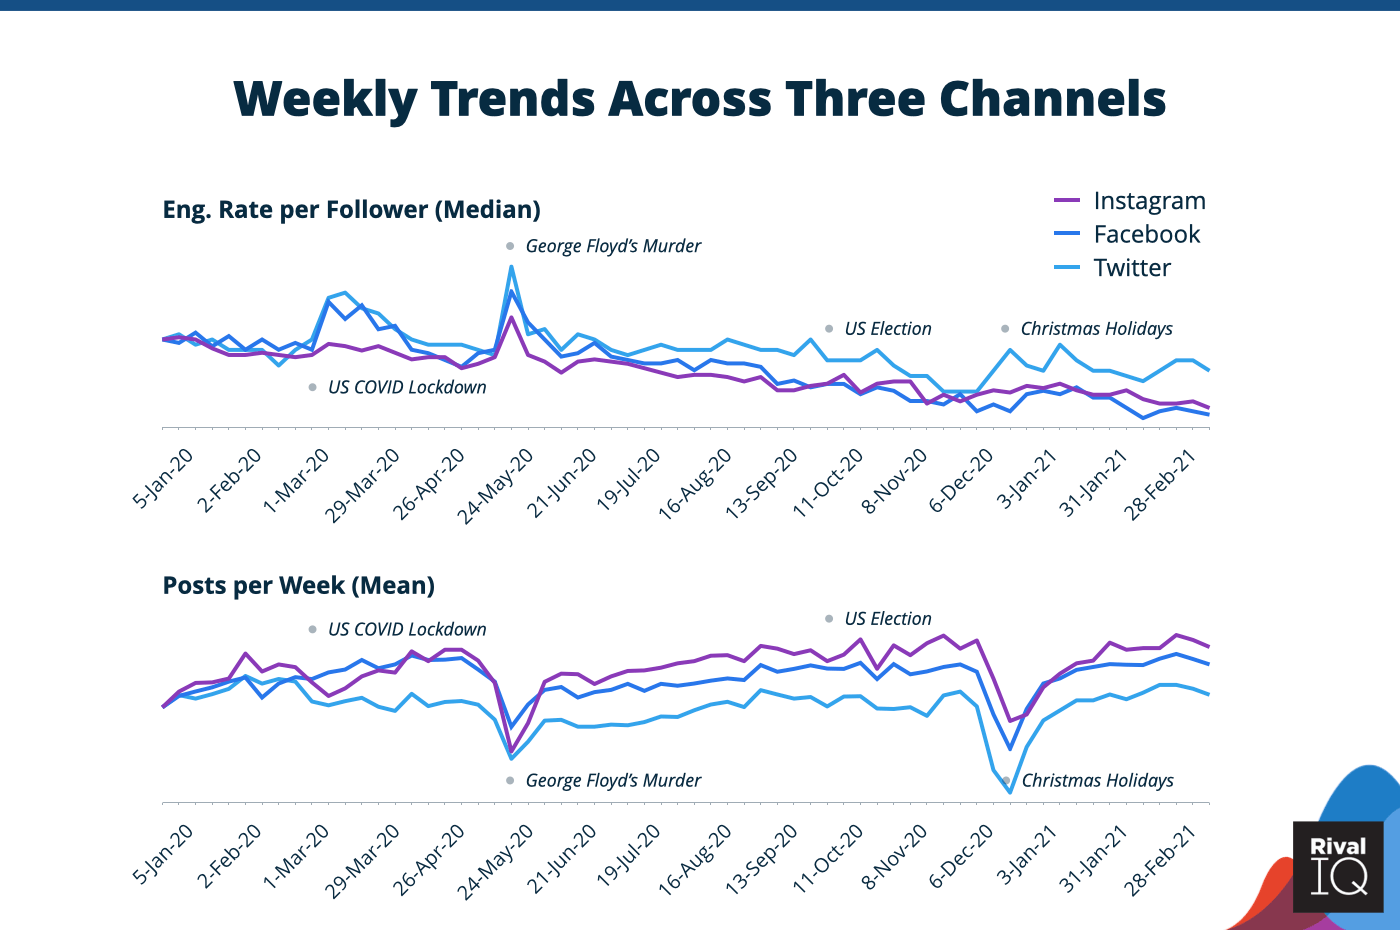
In the graph above, we’ve combined all three channels of our weekly trend data for engagement rates and posts per week to give a more complete picture of behavior-driven trends occurring for brands’ social media during 2020. We’ve normalized each graph to demonstrate the relative changes between the channels during the year.
In the following sections, we’ll zoom into two major world events in 2020.
Early COVID Lockdown
By early March, many cities around the United States were entering lockdown, and by mid-March, the lockdown was in full effect (note: we wrote about this period extensively last year if you want to see even more).
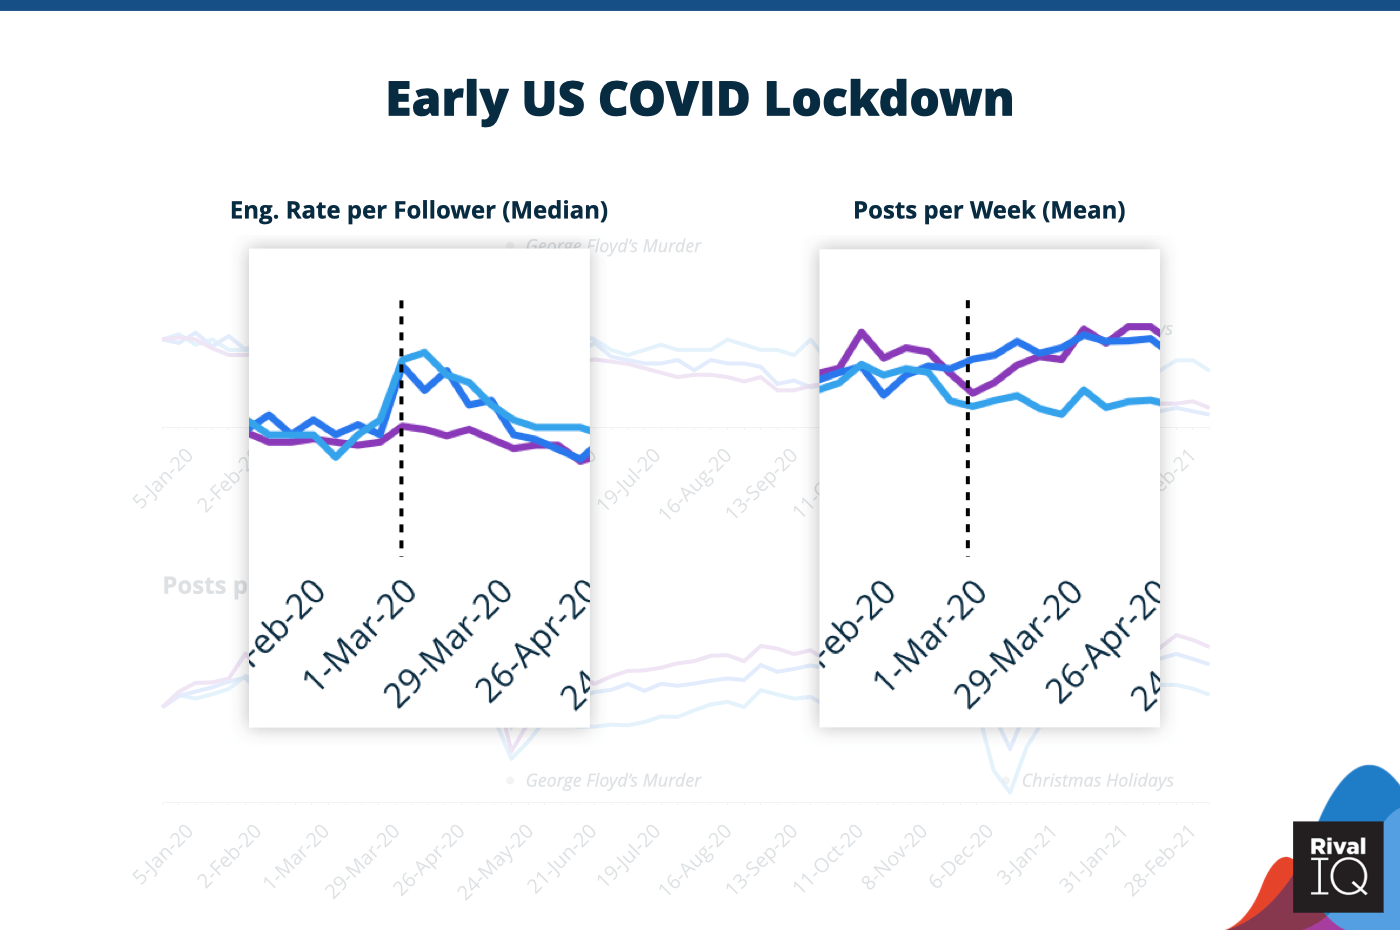
On all three social channels, we saw elevated engagement rates on all three channels starting the week of March 15th. Facebook and Twitter both jumped about 20% from the prior week, while Instagram moved only about 5%. These elevated engagement rates persisted for several weeks before starting their return to pre-lockdown levels by the week of April 19th.
On Twitter and Instagram, we saw decreases in the average number of posts published in the week of March 15th when compared to the previous weeks, with Twitter down 7% and Instagram down 8.5% from March 1st. The average number of Facebook posts from brands actually increased slightly during this period, with post volumes up 1.5% in the week of March 15th.
Engagement rates often increase when posting decreases, because there are fewer posts to interact with but roughly the same number of followers, which means it’s more likely for a follower to interact with one of your brand’s posts in their feed. (If you aren’t tired of hearing it by now, decreasing your posting frequency to inflate your engagement rate isn’t exactly a recommended practice. Better than you should increase the quality and frequency of your posts to give your followers more of what they’ve already indicated they want.
Another explanation for the increased engagement rate is that people were feeling uncertain and downright starved for information about what to expect from their schools, employers, and community organizations. This hunger for info (and a captive audience glued to their phones) led to big engagement hikes for industries like Higher Ed, Nonprofits, and Media because they could provide such valuable information during the early weeks of the US COVID lockdown, while COVID-susceptible industries like Food & Beverage and Hotels & Resorts took a nosedive.
The Murder of George Floyd
The second notable 2020 event in this piece that led to deviations in both posting and engagement is the murder of George Floyd in Minneapolis on May 25th, 2020. We condemn the actions of white police officer Derek Chauvin and the other white police officers involved.
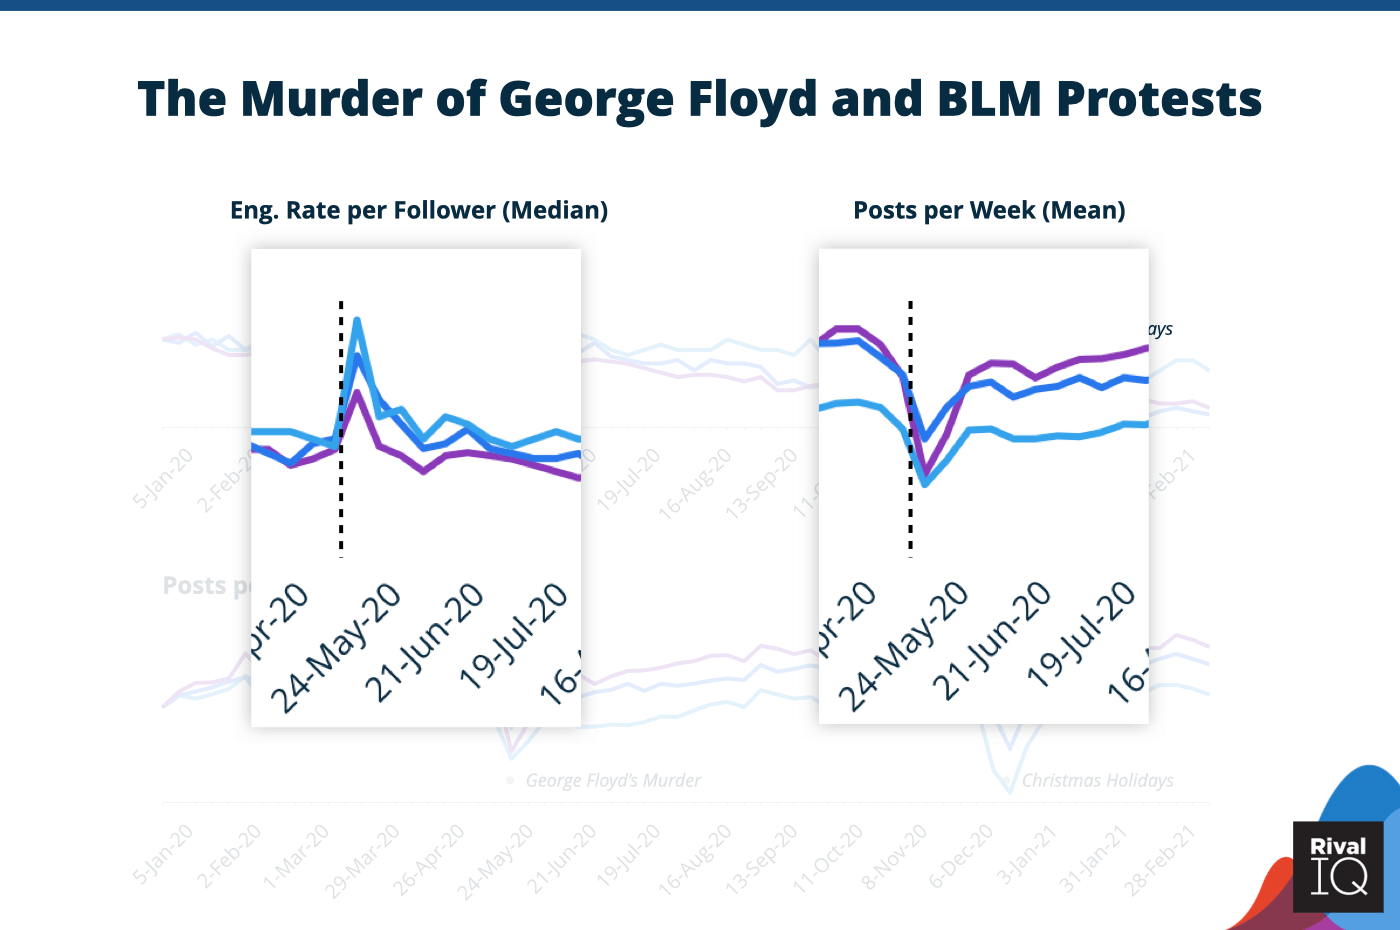
In the graphs above, we examine the change in engagement rates and posting volumes during the weeks that followed the murder of George Floyd in Minneapolis. In the week following the death of George Floyd, brands and organizations backed off posting on social media across all channels, with average post volumes down 15% to 20%. Engagement rates spiked during the week of May 31st, with brands shifting messaging to focus on messages of solidarity with BLM protests, racial equity, and general support for Black Americans.
Brands slowly returned to posting starting during the week of June 7th but didn’t return in earnest until the week of June 14th. Across all three channels, posting volumes on social media were lower for the remainder of the summer when compared with May.
At this time of uncertainty and outrage, nonprofits and other organizations working towards justice and equality were in a unique position to deliver updates while convening communities locally and around the country. Organizations like the NAACP remained at the top of minds and social media feeds by providing valuable and timely information for those paying attention to such a pivotal moment in the quest for equal rights.
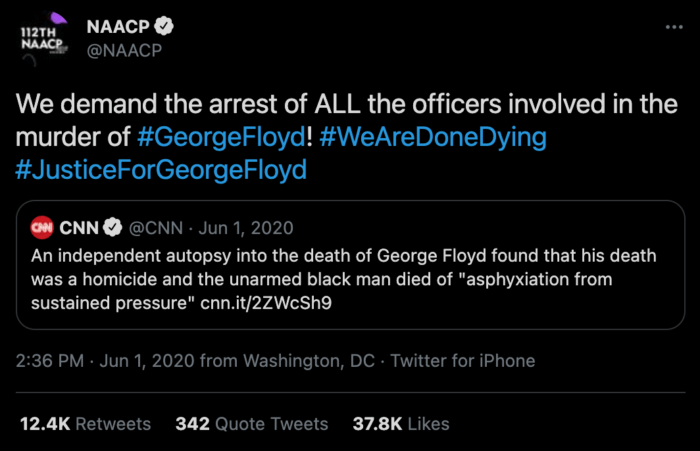
This tweet from the NAACP demanding justice for George Floyd just days after his death earned a 12% engagement rate on Twitter and more than 12,000 retweets. This tweet exploded with more than 2x the engagement total and rate as the NAACP’s next most engaging tweet of 2020, suggesting that followers were more than ready to engage with the content and were hungry for more information.
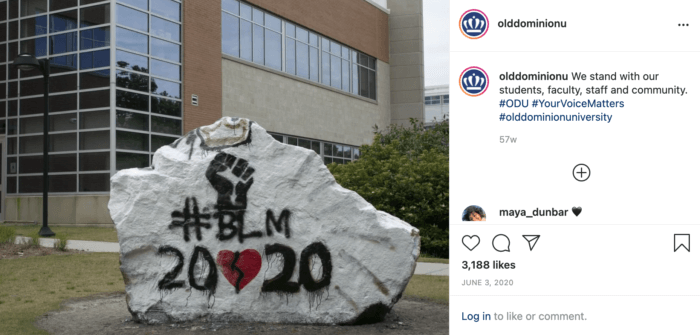
Civil rights organizations were far from the only ones posting on social media during this tumultuous time. Brands and organizations in every industry we study took to social to express support for their communities, like this simple Instagram post from Old Dominion University. This post grabbed attention for the university, to the tune of a 21.3% engagement rate. While nonprofits and community organizations were focused on disseminating information and, in many cases, convening their communities, posts like these were much more about acknowledgment and solidarity.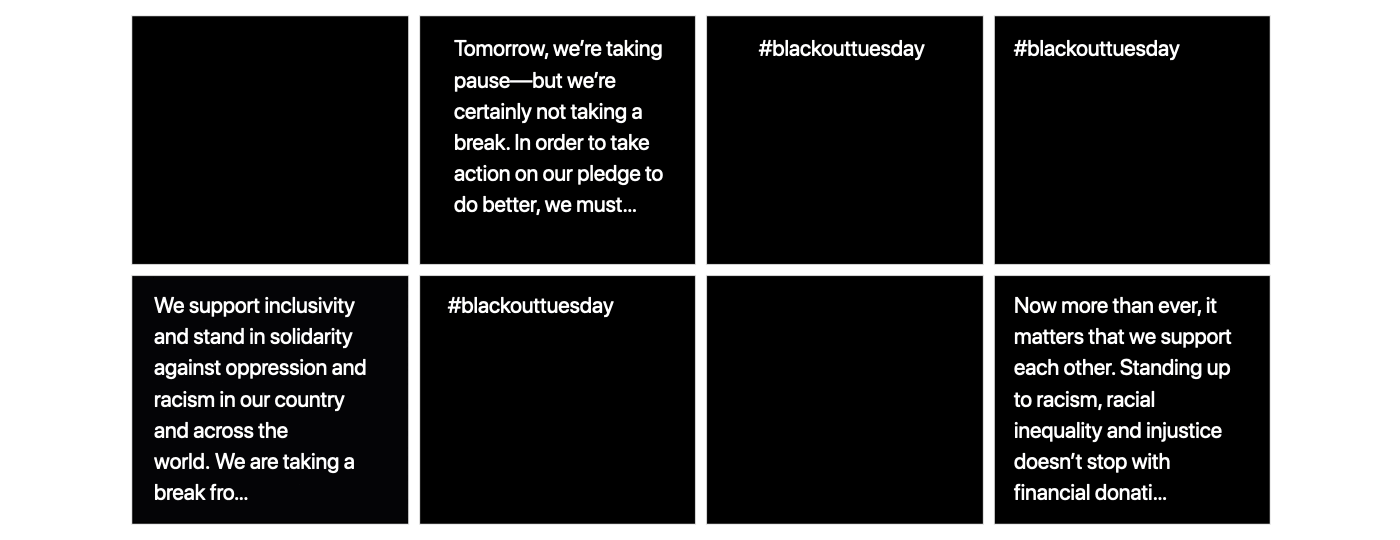
Anyone doing meaningful work to fight racism knows that intention is worthless without action, which is why #BlackOutTuesday was a flop for so many brands. After two Black women in the music industry called for a day of disruption and protest using the #BlackOutTuesday hashtag, brands and individuals flocked to Instagram to post black boxes and the #BlackOutTuesday and #BlackLivesMatter hashtags. The problem? These posts quickly began to drown out the real community organizing that the #BlackLivesMatter hashtag was being used for in favor of performative and ultimately pointless action by a white majority. While many brands saw engagement spikes from users who perceived that this was the “right” thing to do, the tables turned when followers called for more authentic and relevant action beyond a quick social media post. #BlackOutTuesday served up an important lesson for many brands, companies, and marketing departments about how to (and how not to) engage in anti-racism work.
Wrapping it up
F*cking 2020. We hope this blog post helps explain some of the success stories (and dive bombs) from this tough year, and gives you some hope and inspo for the latter half of 2021. It was a tough, weird year, and only time will tell if some of the engagement declines we noted are related to the f*ckload of drama 2020 contained, or if they point to a larger shift in social media engagement.
Did we miss an industry, or not dive into a question you’re dying to learn more about? Drop us a line on Twitter.