Grab your highlighters and fire up the charts: it’s time for the 2025 Social Media Industry Benchmark Report!
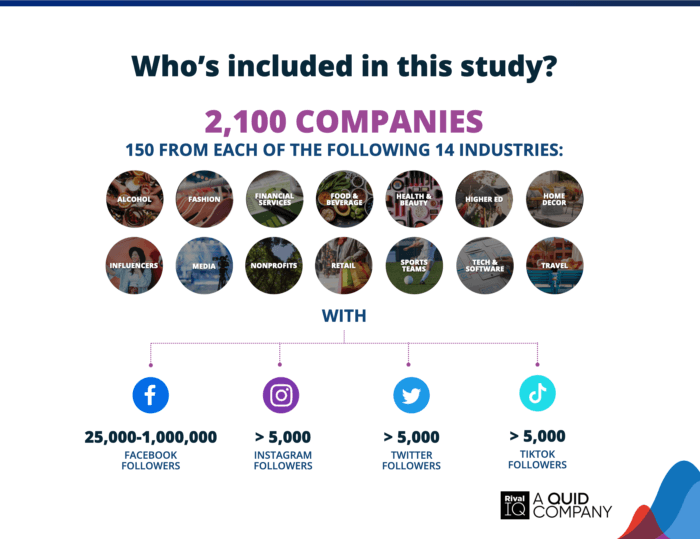
Once again, we’re delivering the key social media benchmarks and insights for 14 top industries: Alcohol, Fashion, Financial Services, Food & Beverage, Health & Beauty, Higher Education, Home Decor, Influencers, Media, Nonprofits, Retail, Sports Teams, Tech & Software, and Travel.
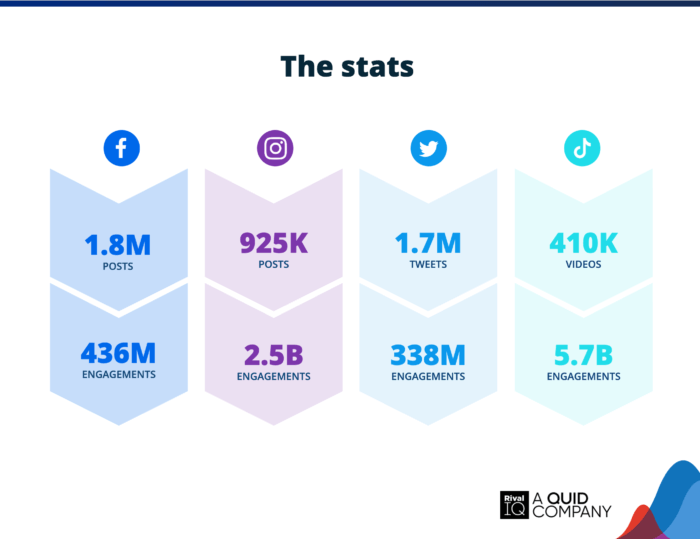
Wondering if you’re posting enough? Posting too much? Or if your content is truly resonating? You’re not alone. That’s why we analyzed more than 4 million posts and 9 billion (!) likes, comments, and shares across Facebook, Instagram, TikTok, and Twitter to bring you the freshest social media benchmark data.
Let’s dive in and start benchmarking!
Social Media Benchmark Key Takeaways
| Engagement took a tumble, especially on Twitter (X) Every platform saw engagement rates fall—Facebook dropped 36%, Instagram 16%, TikTok 34%, but X took the biggest hit at 48%. |
|
| Carousels took the lead on Instagram Carousels outperformed Reels in engagement this year, proving that multi-image posts still resonate with audiences. |
|
| TikTok is king, but its crown is slipping TikTok still leads in engagement but saw declines overall. Higher Ed and Nonprofits bucked the trend, showing that campus and cause-driven content continues to connect. |
|
| Posting frequency shifted TikTok posting ticked up, while Instagram, Facebook, and Twitter saw declines. Media and Sports Teams led the charge, posting more than any other industry. |
|
| Holiday hashtags delivered again Once, again, almost every industry earned top engagement rates from holiday-hashtagged posts. |
|
 |
Health & Beauty struggled to stand out A saturated market hurt Health & Beauty, which had the lowest engagement across platforms. |
All-Industry Social Media Benchmarks
All-Industry: Facebook
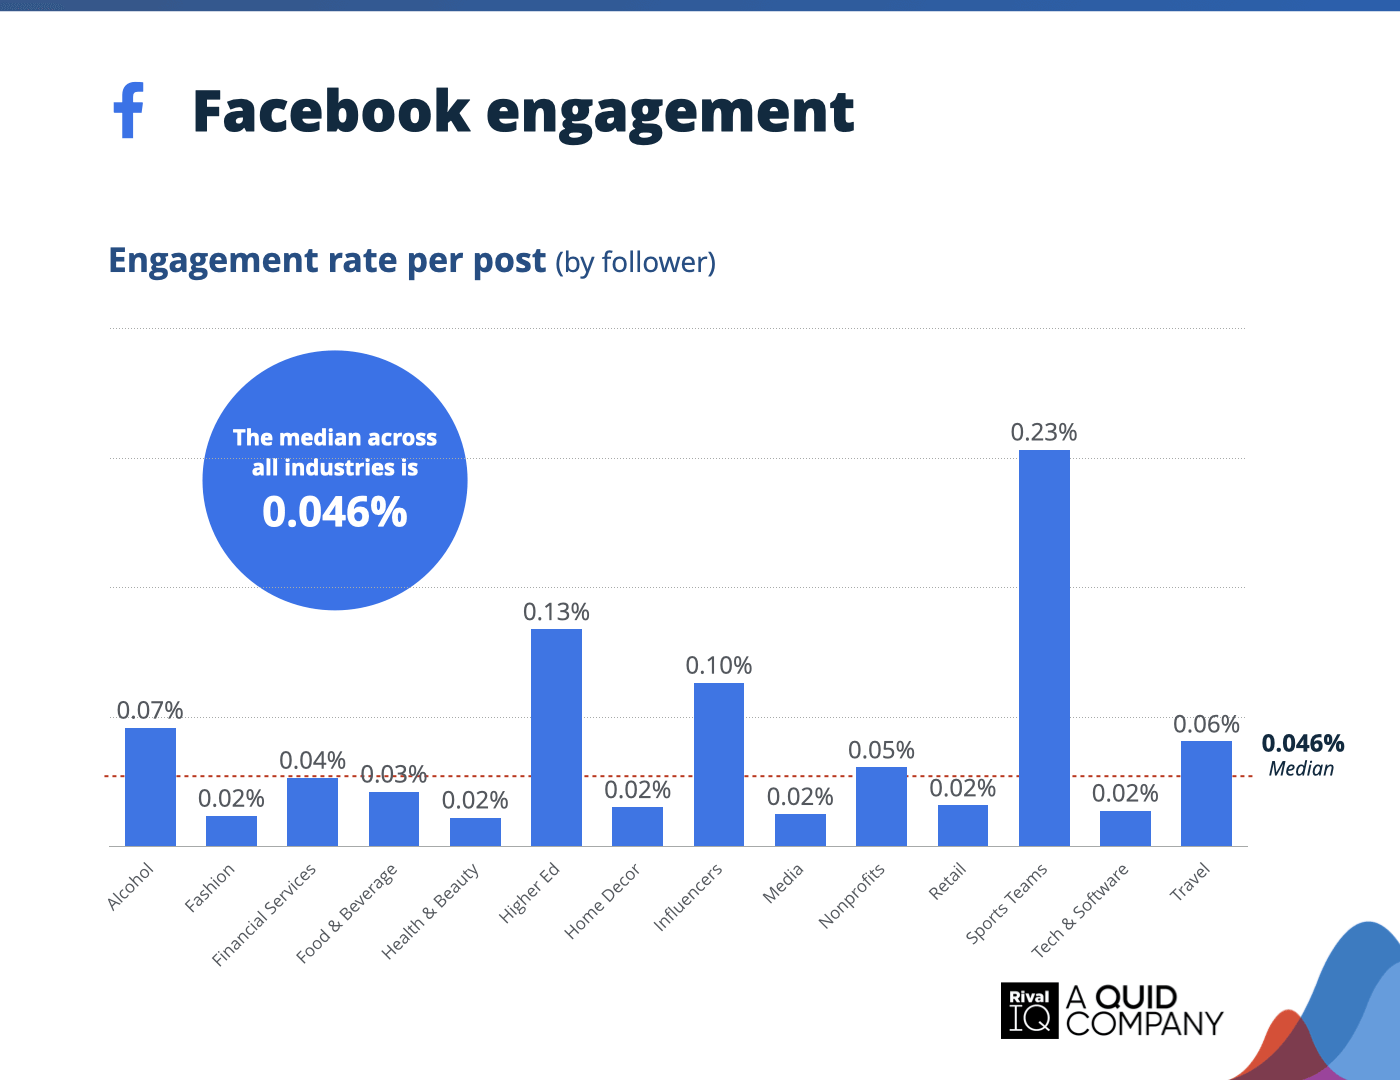
Average Facebook engagement rate per post, all industries
Engagement took a dip this year: the all-industry median fell, along with declines in Sports Teams, Higher Ed, and Influencers. But there were some bright spots—Food & Beverage saw a small gain, while Financial Services held steady.
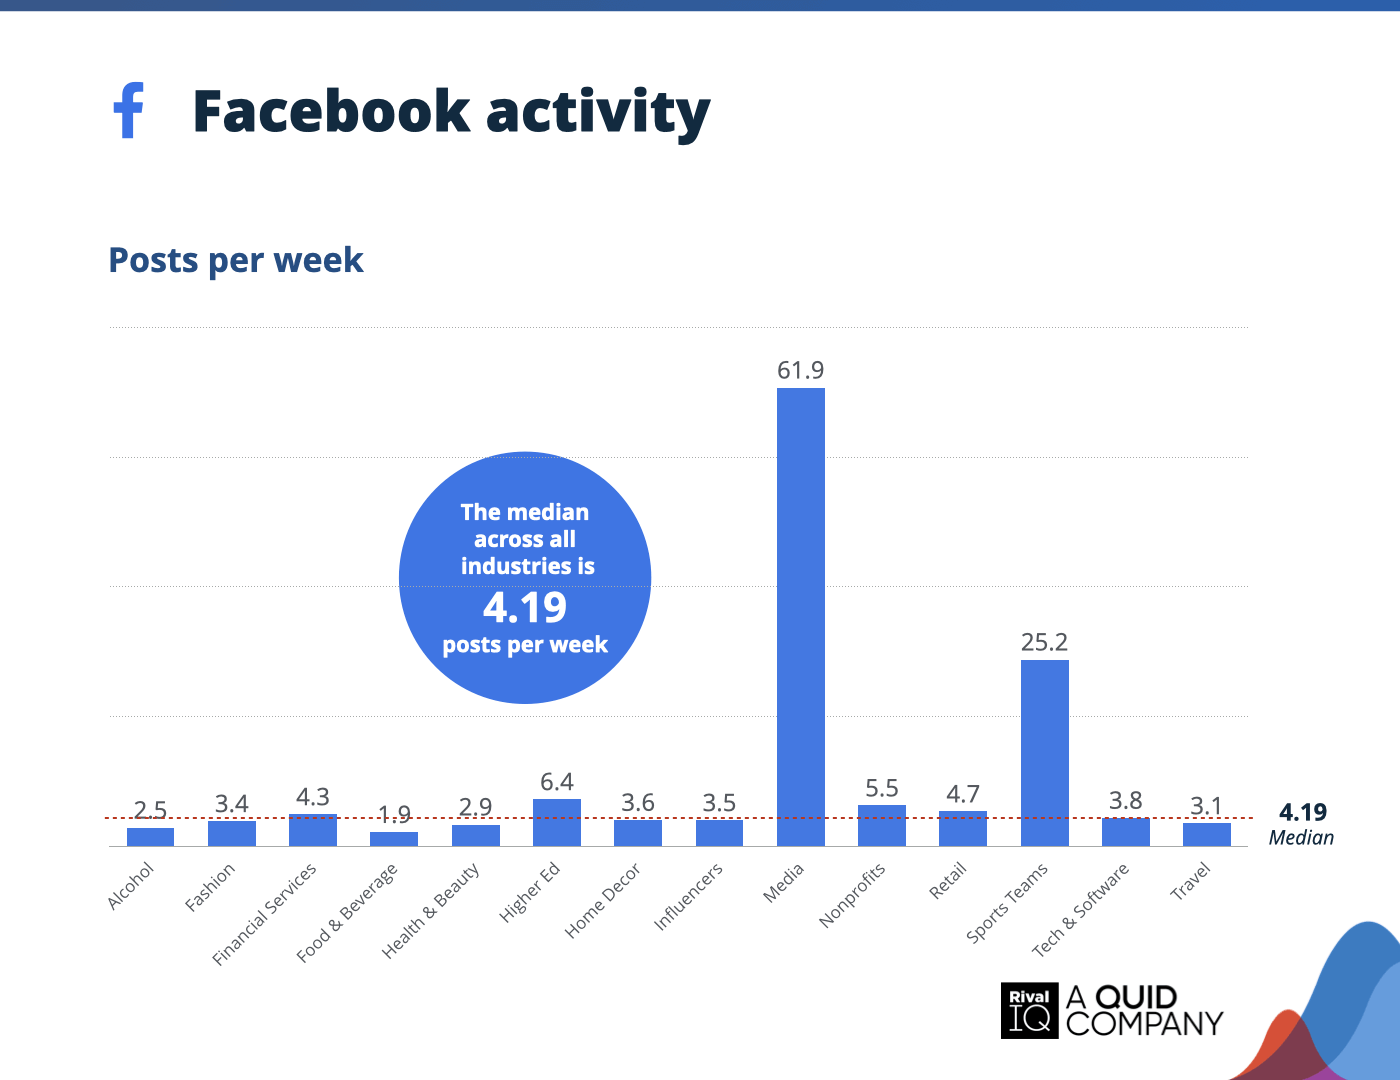
Average Facebook posts per week, all industries
Brands hit the brakes on Facebook posting this year, with Fashion, Health & Beauty, and Food & Beverage seeing the biggest slowdowns. Media stayed the most active despite a slight dip, while Sports Teams picked up the pace.
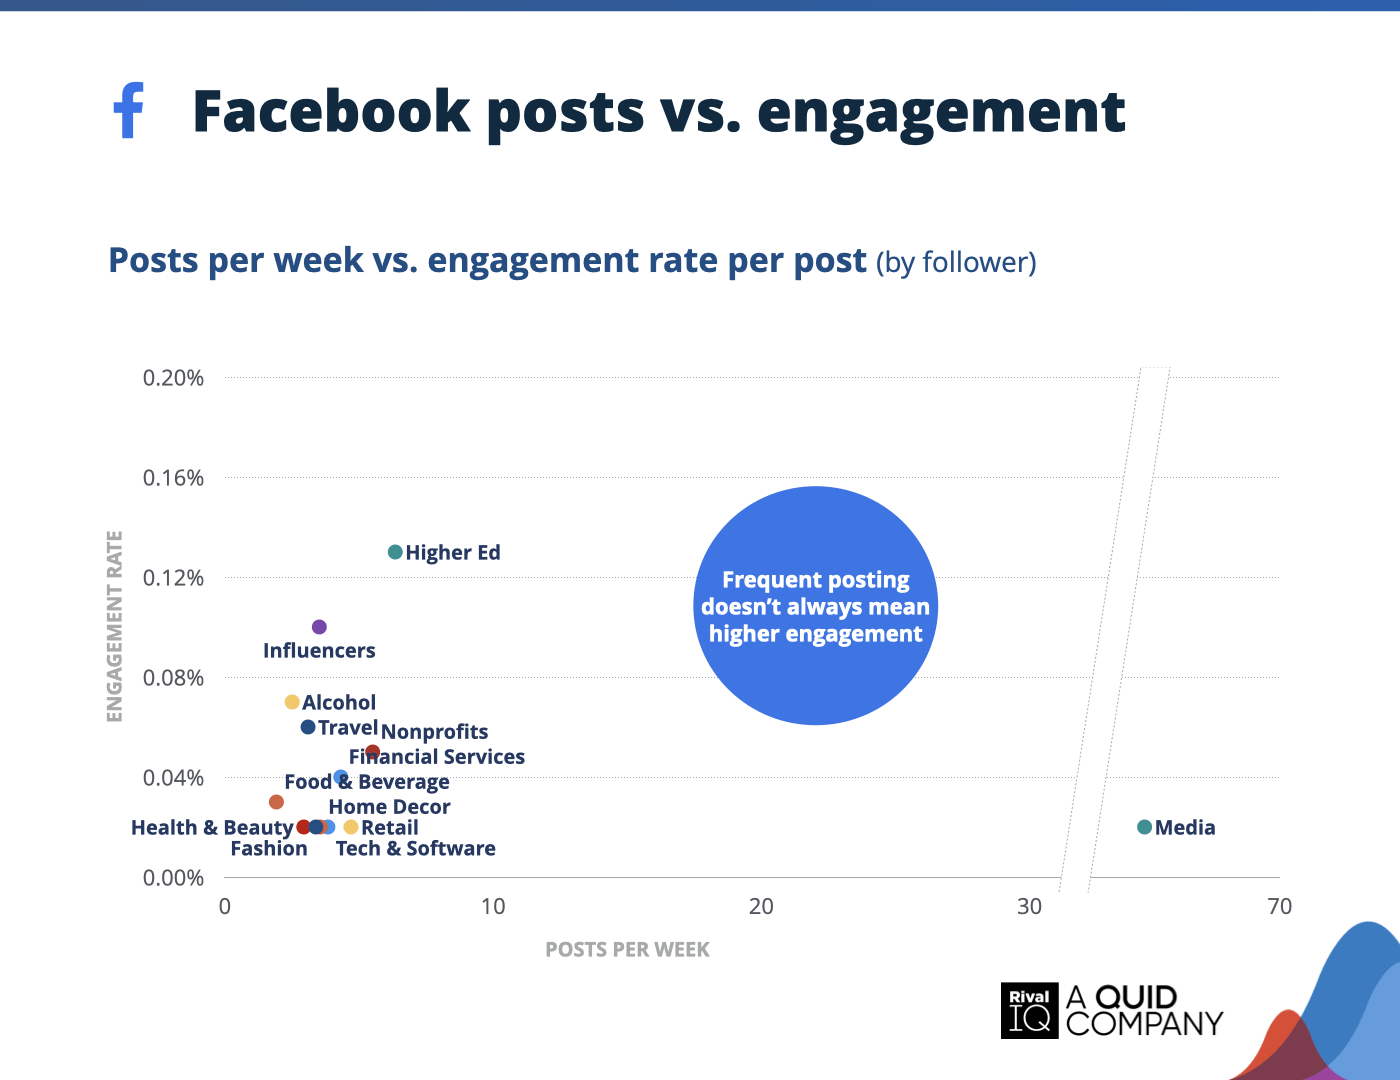
Facebook posts per week vs. engagement rate per posts, all industries
Higher Ed and Influencers continue to hit the sweet spot, pairing moderate posting frequency with strong engagement.
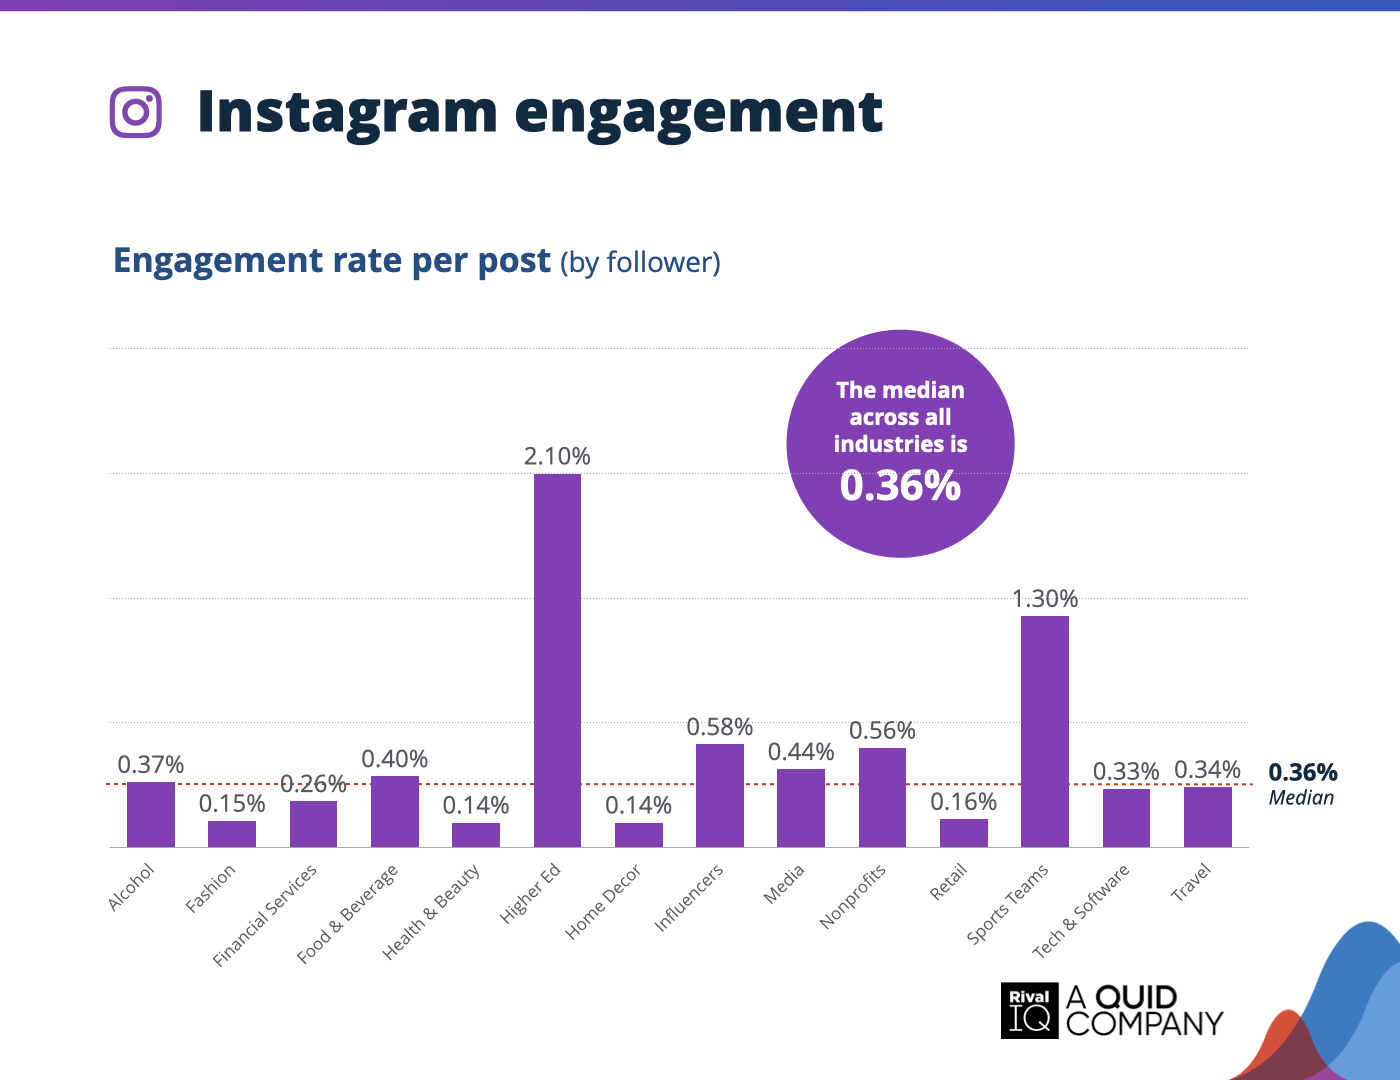
Average Instagram engagement rate per post, all industries
Instagram engagement dipped across the board. Retail and Home Decor brands saw sharp declines of nearly 30%.
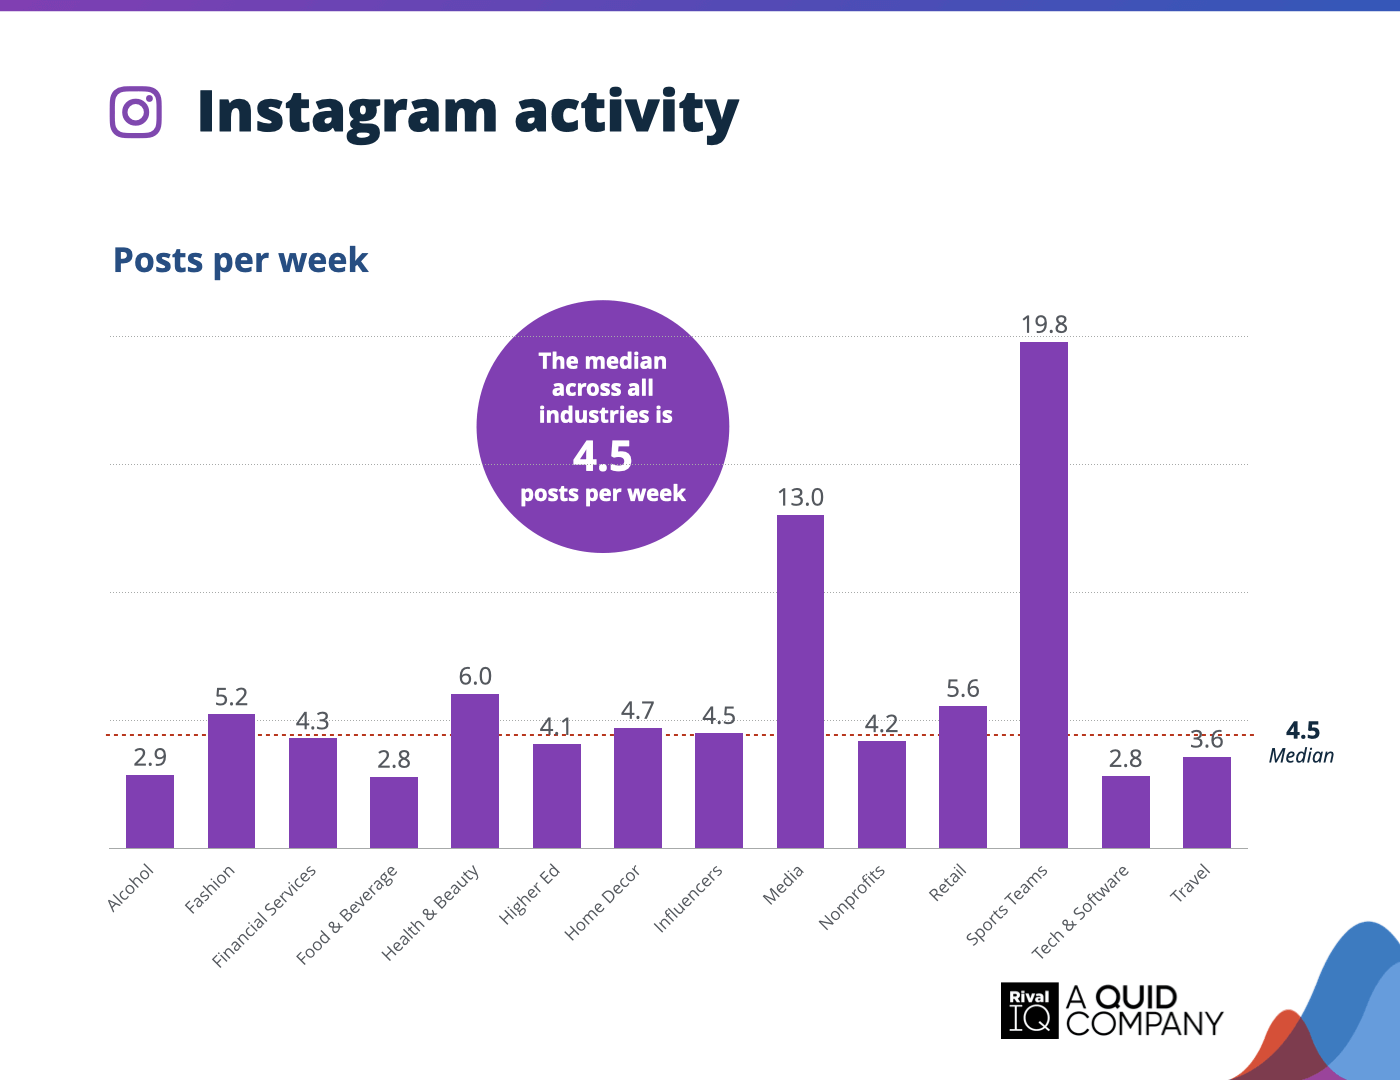
Average Instagram posts per week, all industries
For the first time in three years, median posting frequency on Instagram decreased slightly. While most industries held steady or scaled back, Influencers bucked the trend, increasing their posting frequency the most by nearly 20%.
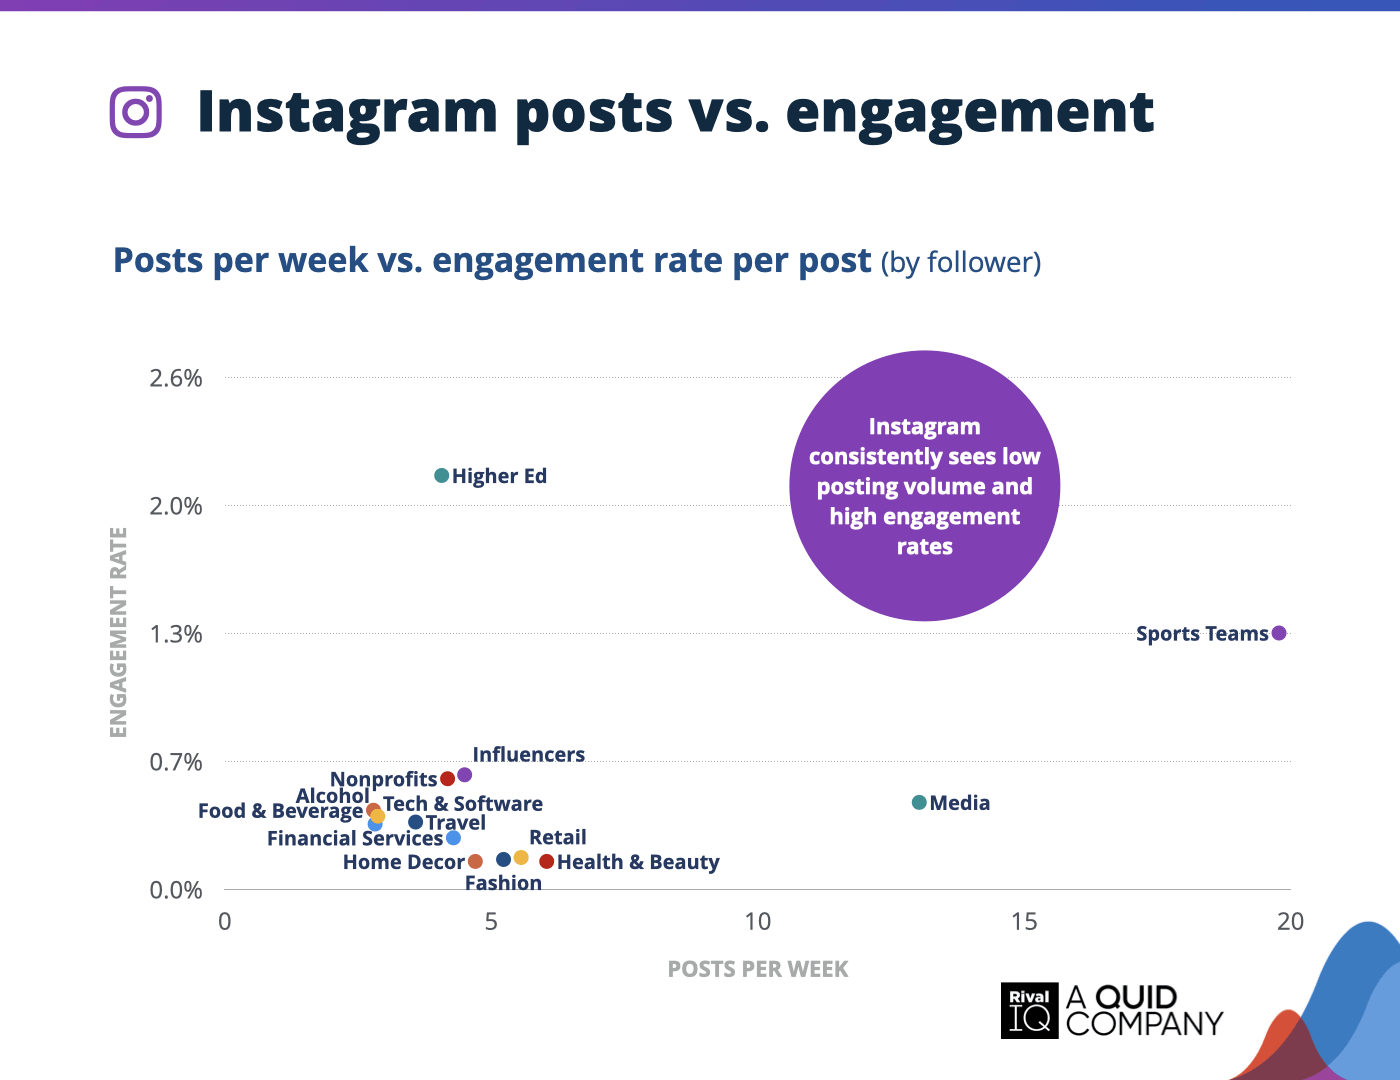
Instagram posts per week vs. engagement rate per posts, all industries
Higher Ed was the clear engagement winner on Instagram despite below-median posting frequency, suggesting more isn’t always better on Instagram (though second-place Sports Teams might beg to differ).

Average Twitter engagement rate per tweet, all industries
Twitter engagement continues to slide, with multiple industries—including Fashion, Food & Beverage, and Health & Beauty—dropping to nearly zero. Financial Services and Media held steady, but overall, brands saw a notable decline.
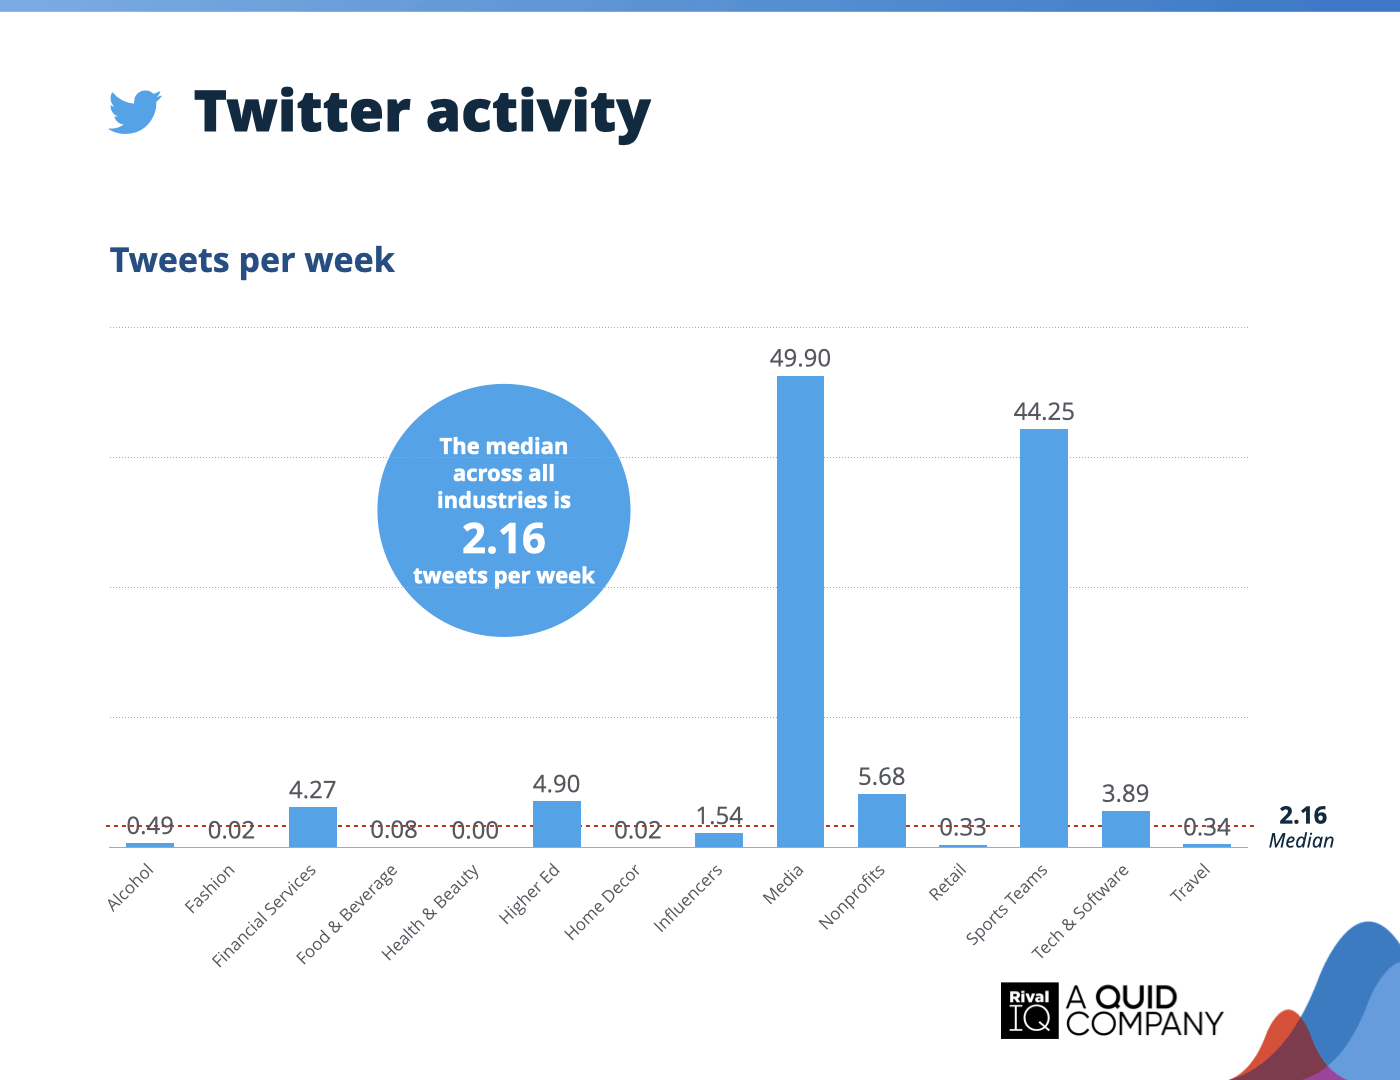
Average Twitter tweets per week, all industries
Tweeting slowed down even more this year, with most industries cutting their posting in half—or stopping altogether. Sports Teams were the rare exception, ramping up their activity.
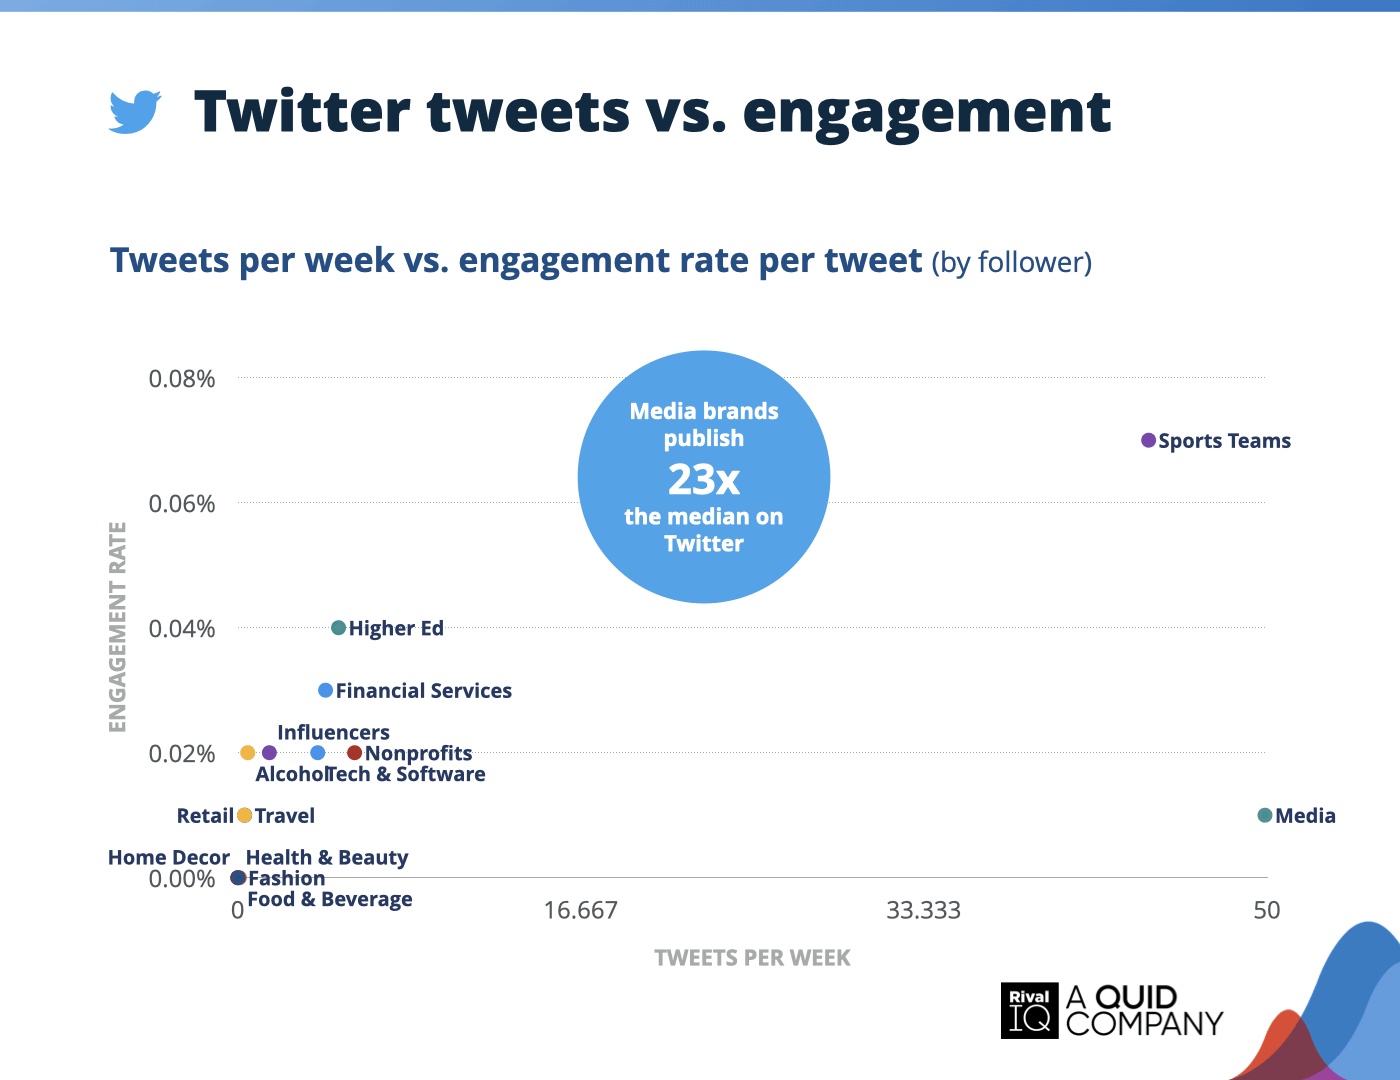
Twitter tweets per week vs. engagement rate per posts, all industries
Higher Ed and Sports Teams still lead on Twitter, but Media proves once again that more tweets don’t mean more engagement.
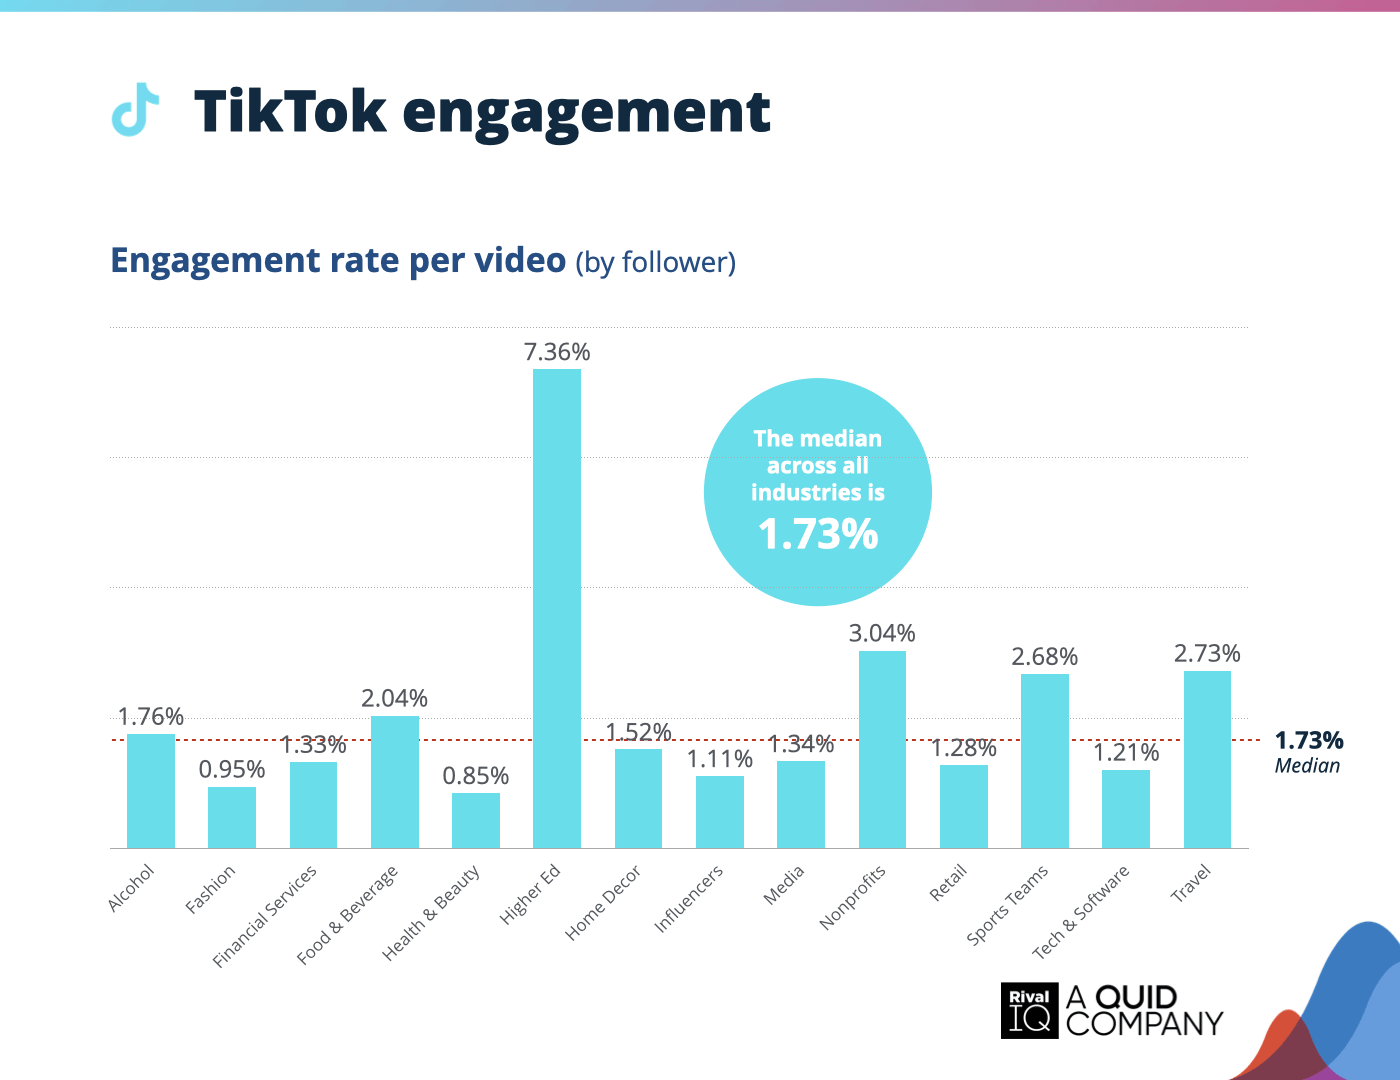
Average TikTok engagement rate per video, all industries
TikTok engagement rates continued to fall this year, with industries like Fashion, Food & Beverage, and Sports Teams seeing some of the biggest drops. The silver lining? TikTok still outperforms every other social platform for engagement.
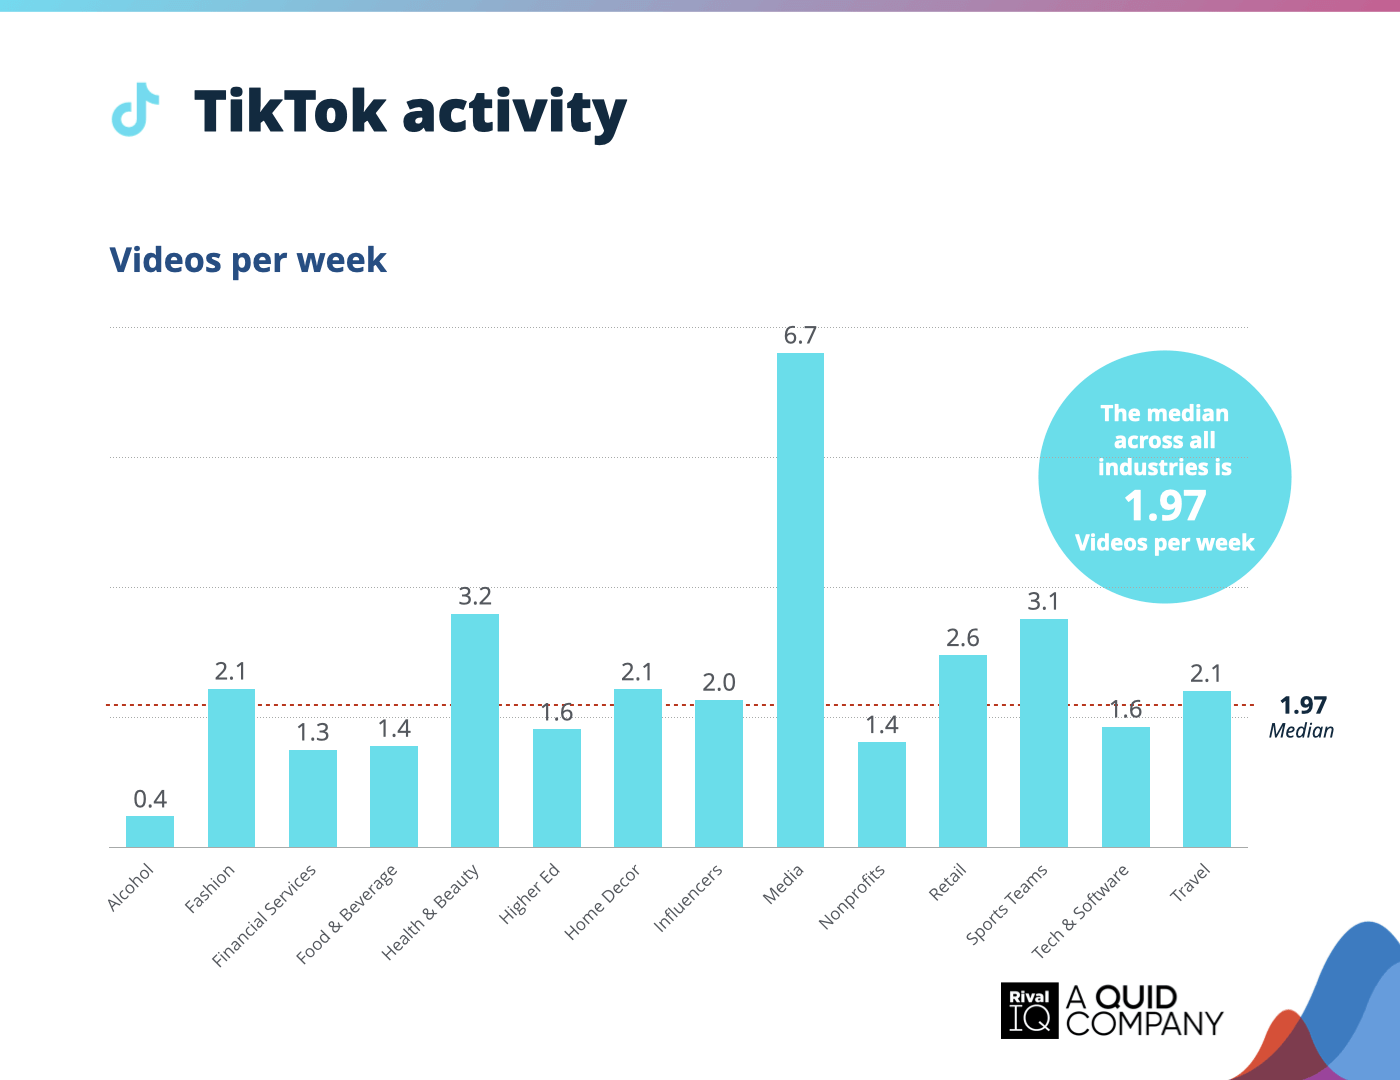
Average TikTok videos per week, all industries
TikTok posting ticked up overall, with Sports Teams, Higher Ed, and Home Decor leading the charge. Media scaled back slightly but stayed the most active.
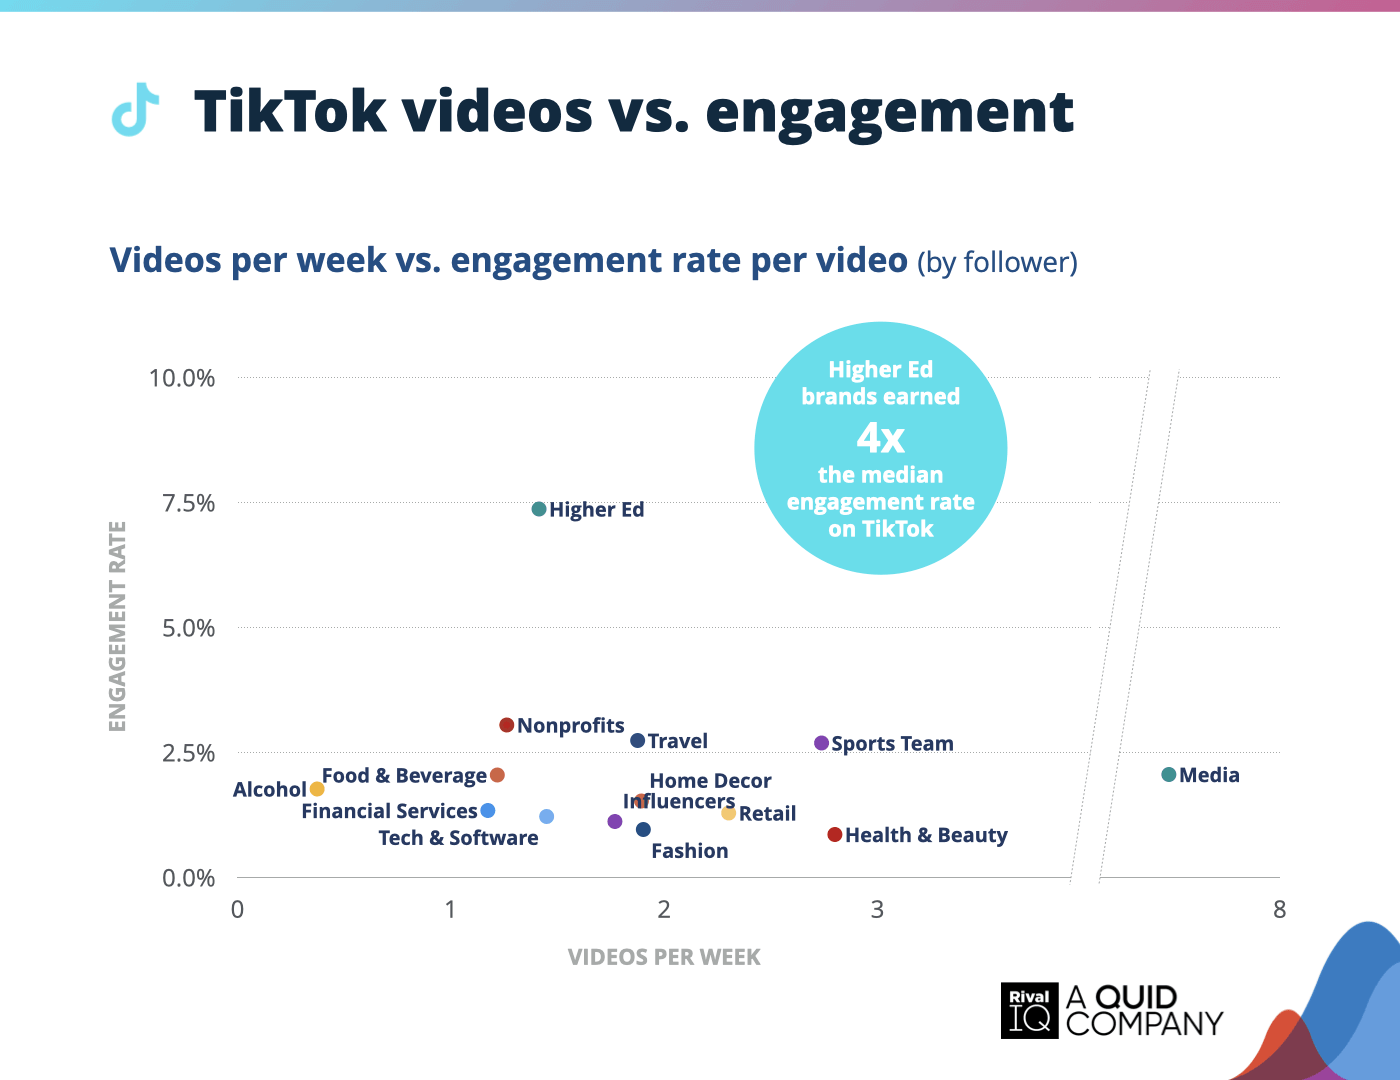
TikTok posts per week vs. engagement rate per posts, all industries
Higher Ed once again outpaced the competition on TikTok, boasting the highest engagement rates with modest posting activity. This year, Nonprofits claimed second place, edging out Sports Teams.
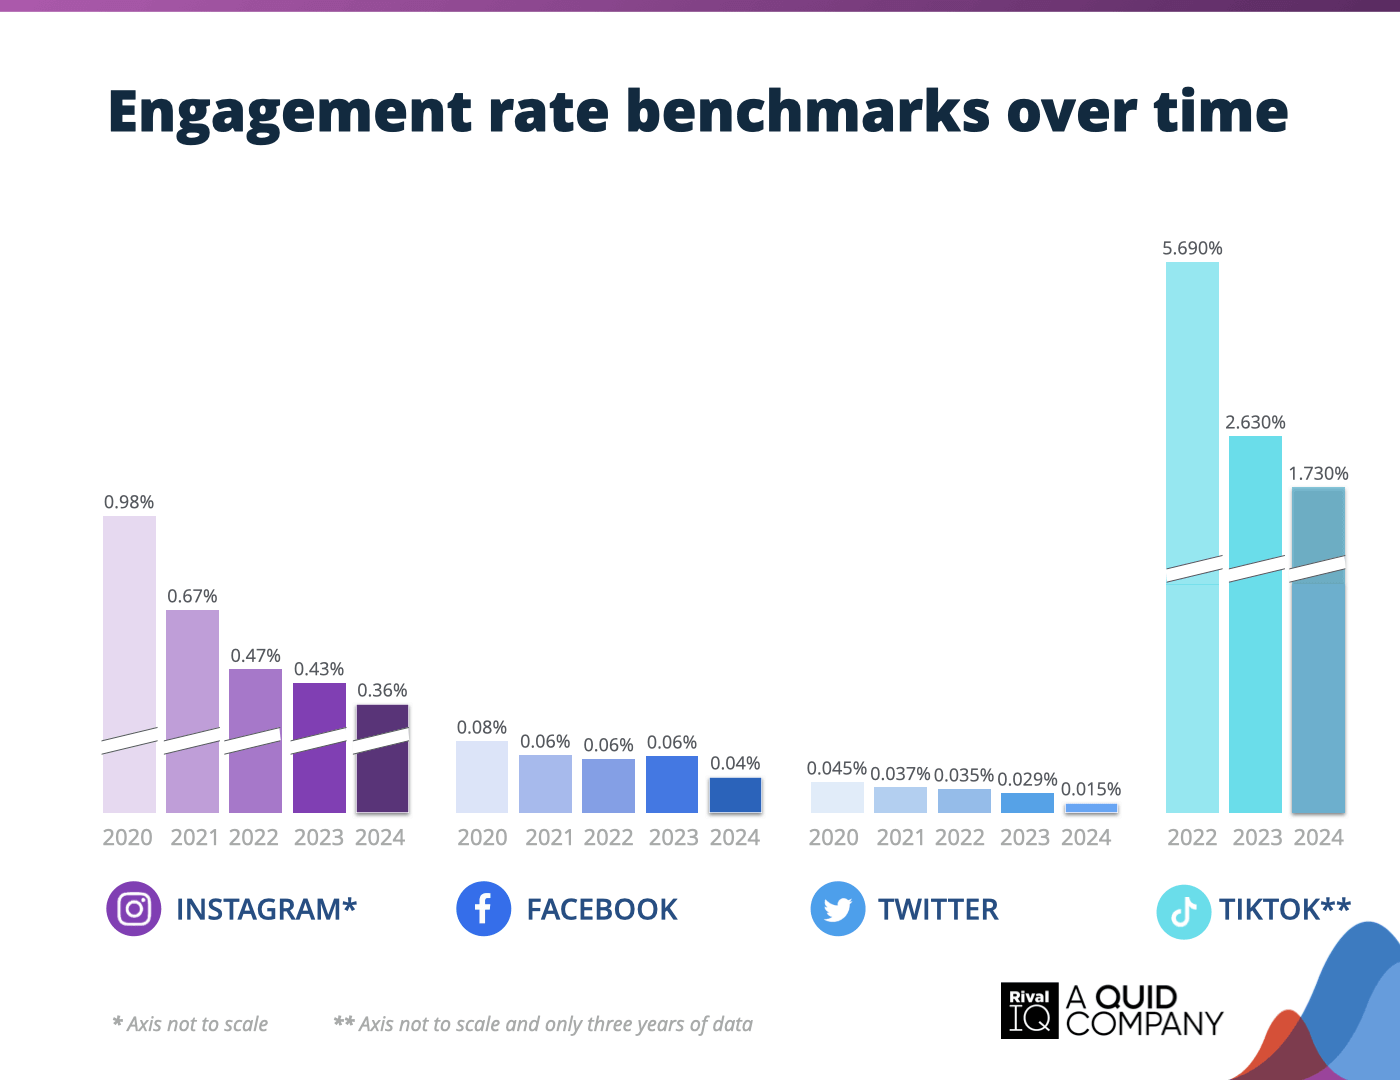
Engagement rate benchmarks vs time, all industries
TikTok engagement rates dipped again this year but still far surpass Instagram, Facebook, and Twitter. While the gap has narrowed slightly, TikTok remains the dominant platform for audience interaction.
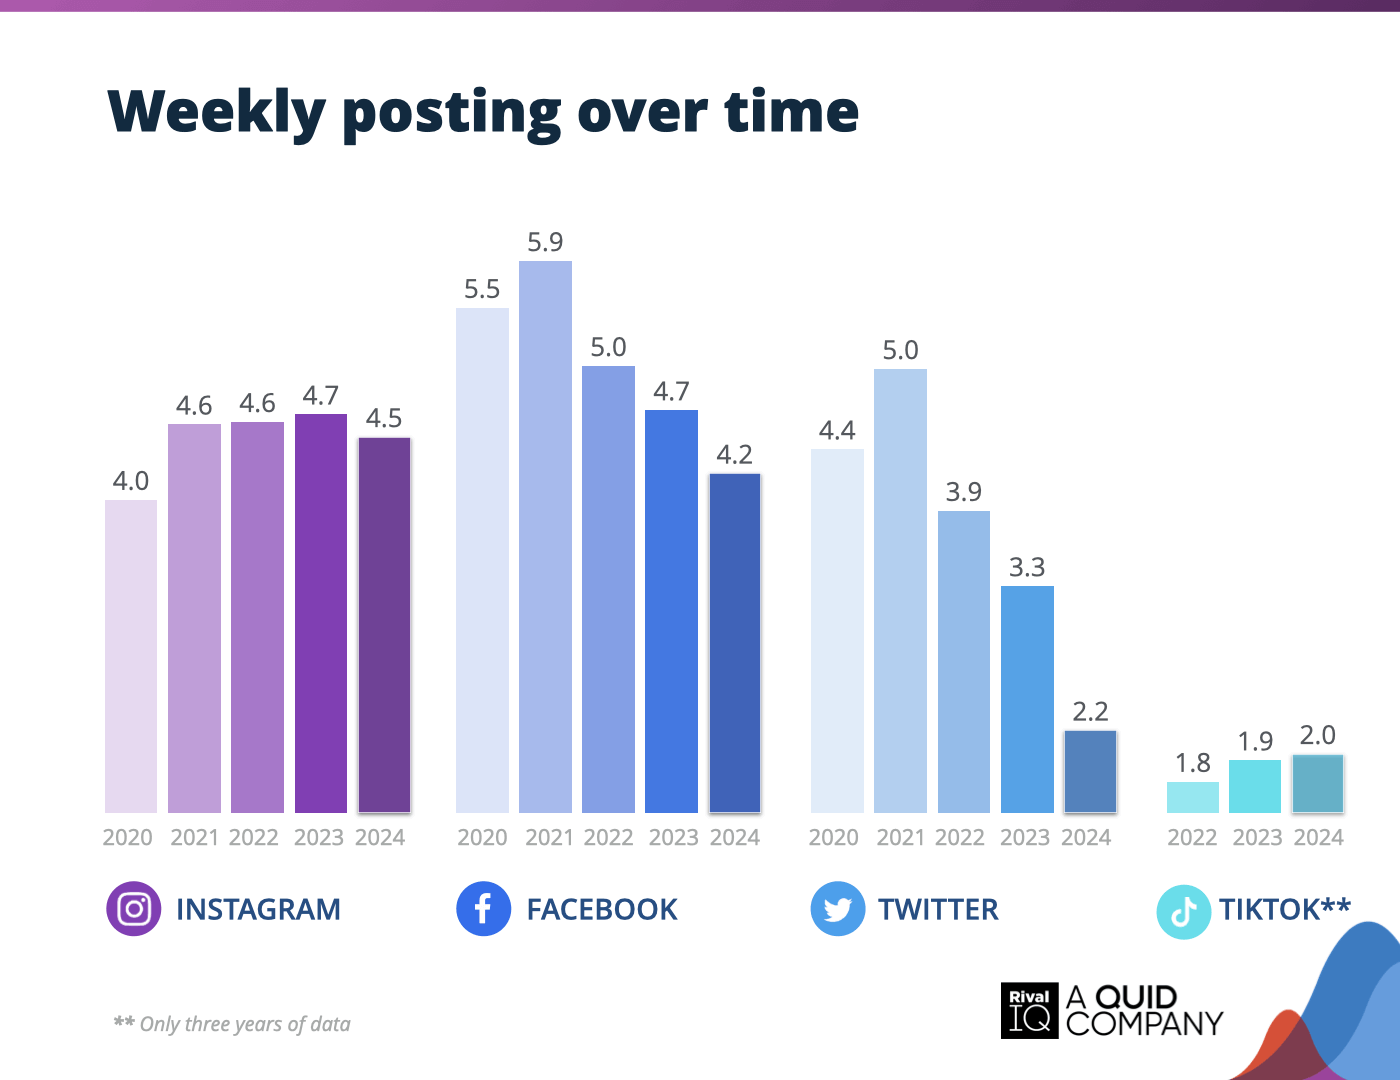
Posting frequency benchmarks vs time, all industries
Post frequency increased just a bit on TikTok this year while slowing down on Instagram, Facebook and Twitter. Twitter posting took the sharpest dive at 33%, suggesting people aren’t as invested in X as they once were.
Alcohol Social Media Benchmarks
Alcohol brands matched or beat median engagement rates across the board this year. Facebook saw the biggest win with a 72.5% engagement boost, even as brands posted 40% less often.
A few ways Alcohol brands can keep up the pace:
- Prioritize high-performing content types—videos on Twitter and carousels on Instagram drove the best engagement this year.
- Lean into hashtags tied to beer and seasonal events. Giveaways on Instagram and beer-themed tags on TikTok were big crowd-pleasers.
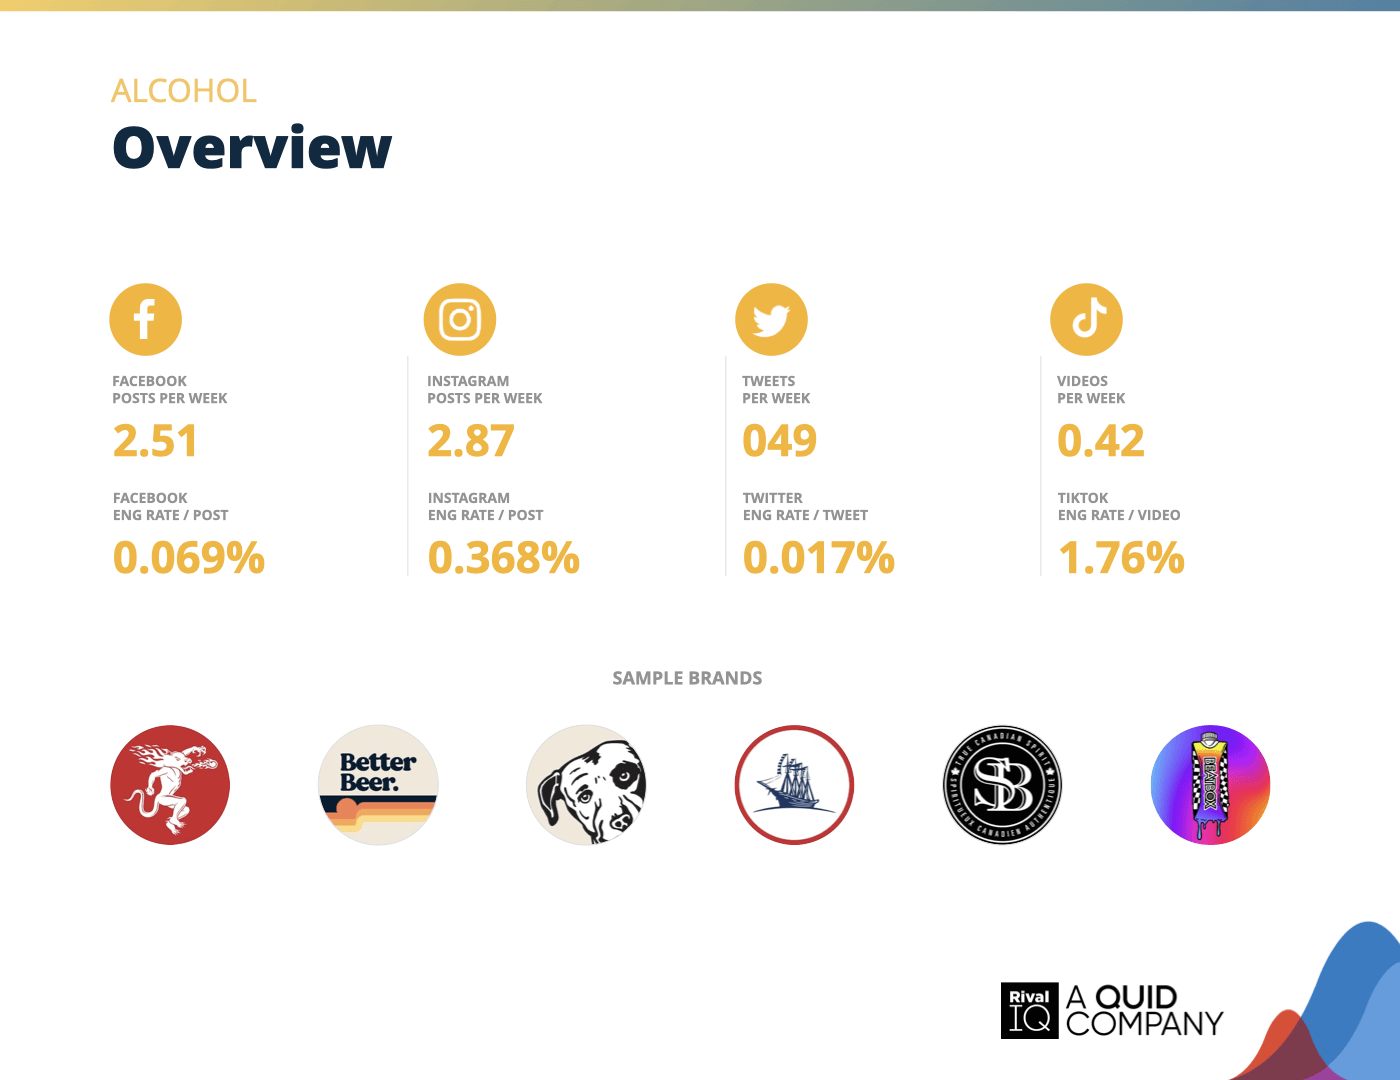
Overview of all benchmarks, Alcohol
Notable brands in this year’s report include Better Beer, BrewDog, Fireball, Lagunitas, Shipyard, and STALK&BARREL.
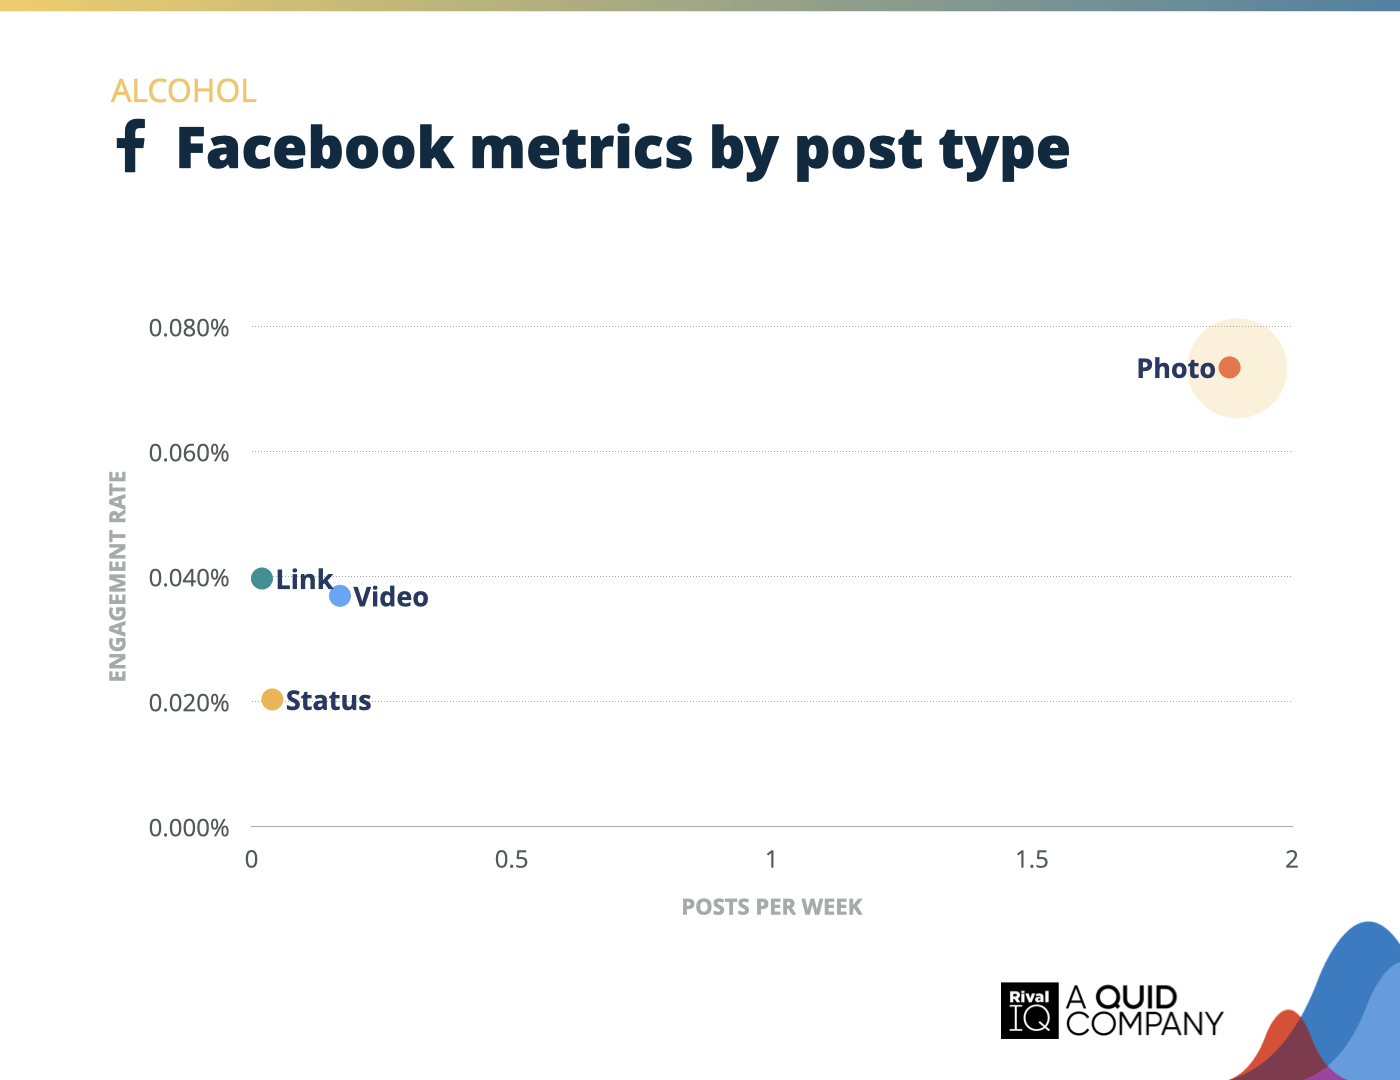
Facebook posts per week and engagement rate by post type, Alcohol
Photo posts still lead the way for Alcohol brands on Facebook. Once again, they deliver the highest engagement rates, outperforming links, videos, and status updates by a wide margin.
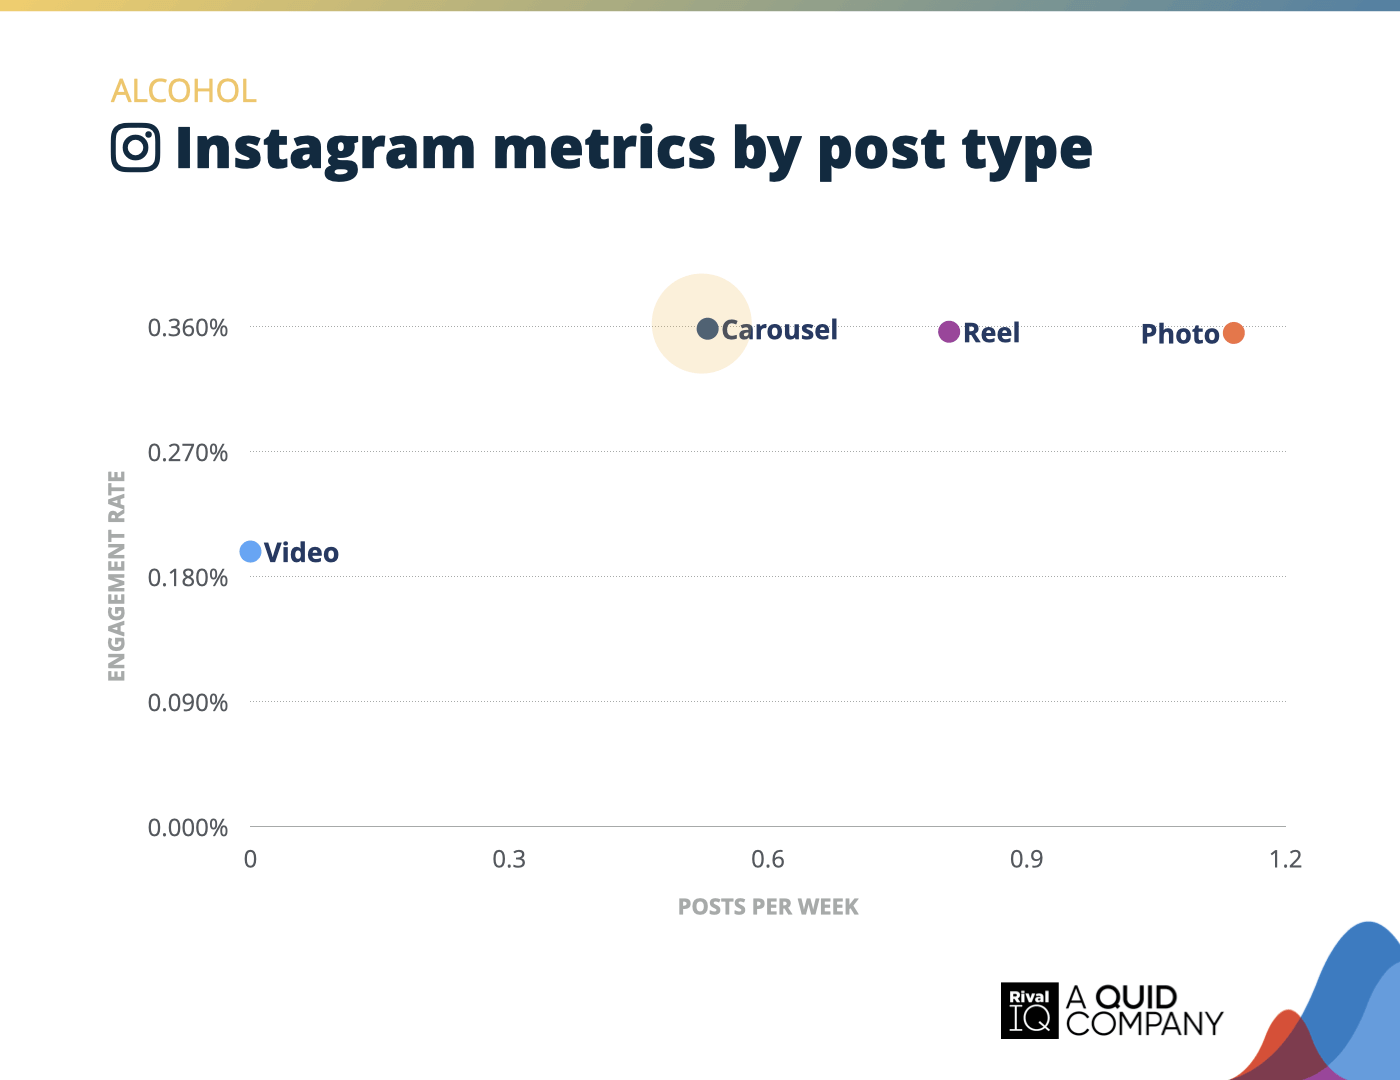
Instagram posts per week and engagement rate by post type, Alcohol
Carousels topped engagement for Alcohol brands on Instagram, with Reels and Photos close behind. Turning single-photo posts into carousels could offer an easy win.
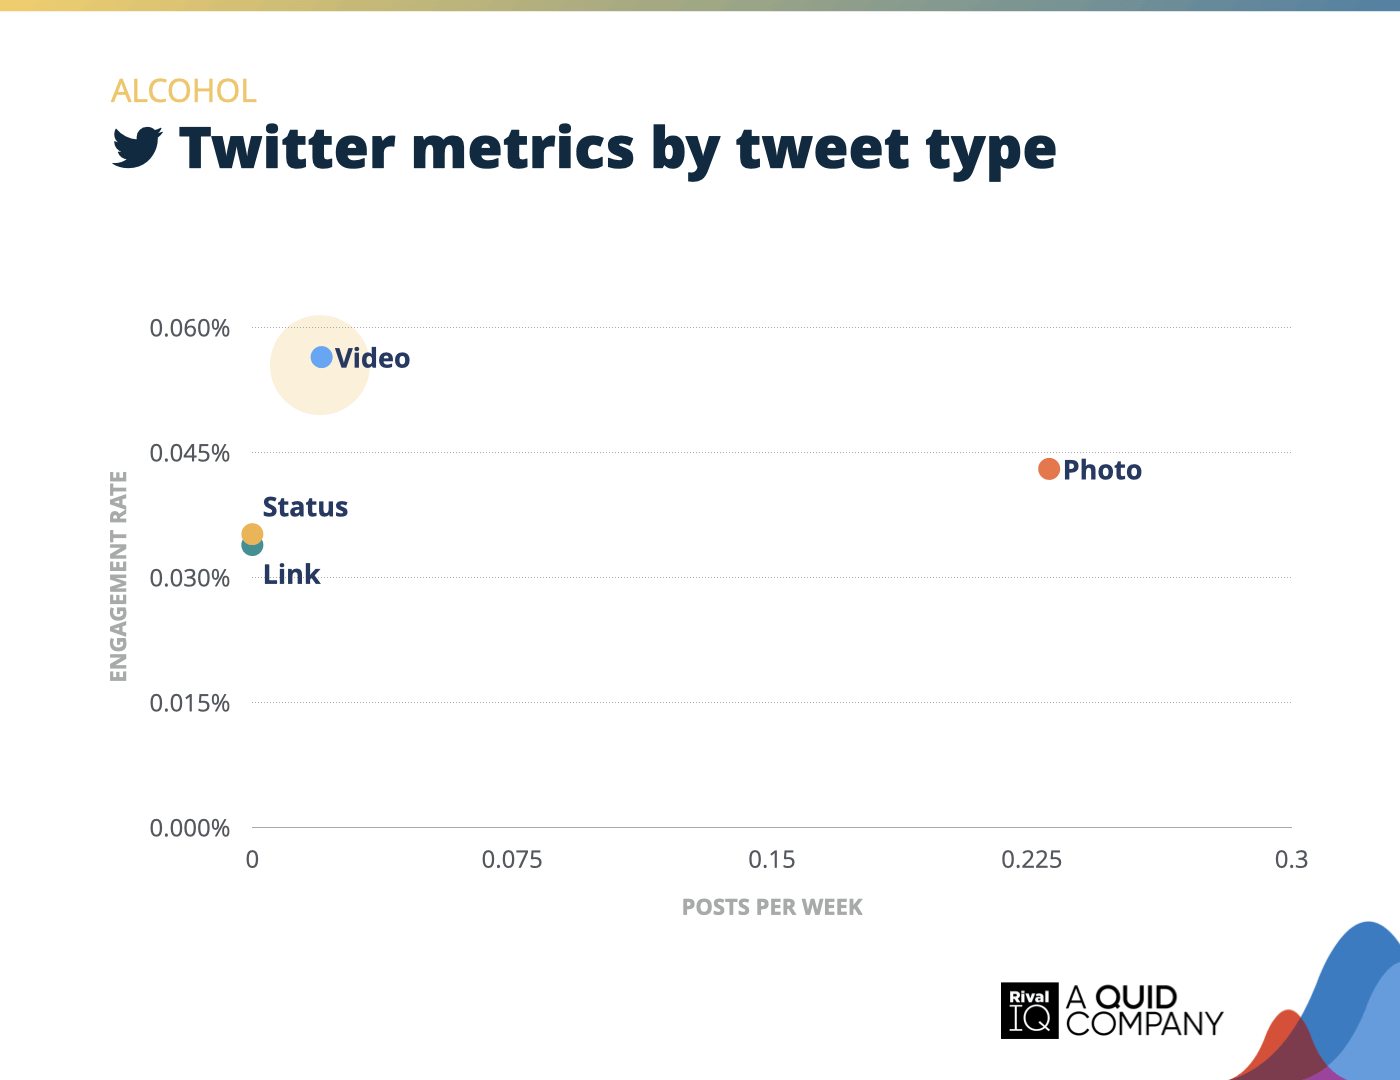
Twitter posts per week and engagement rate by tweet type, Alcohol
Photo tweets were the most frequent for Alcohol brands on Twitter, but videos drove the highest engagement. Status and Link tweets were posted so infrequently they round down to zero posts per week, yet still showed measurable engagement—suggesting occasional use can be effective.
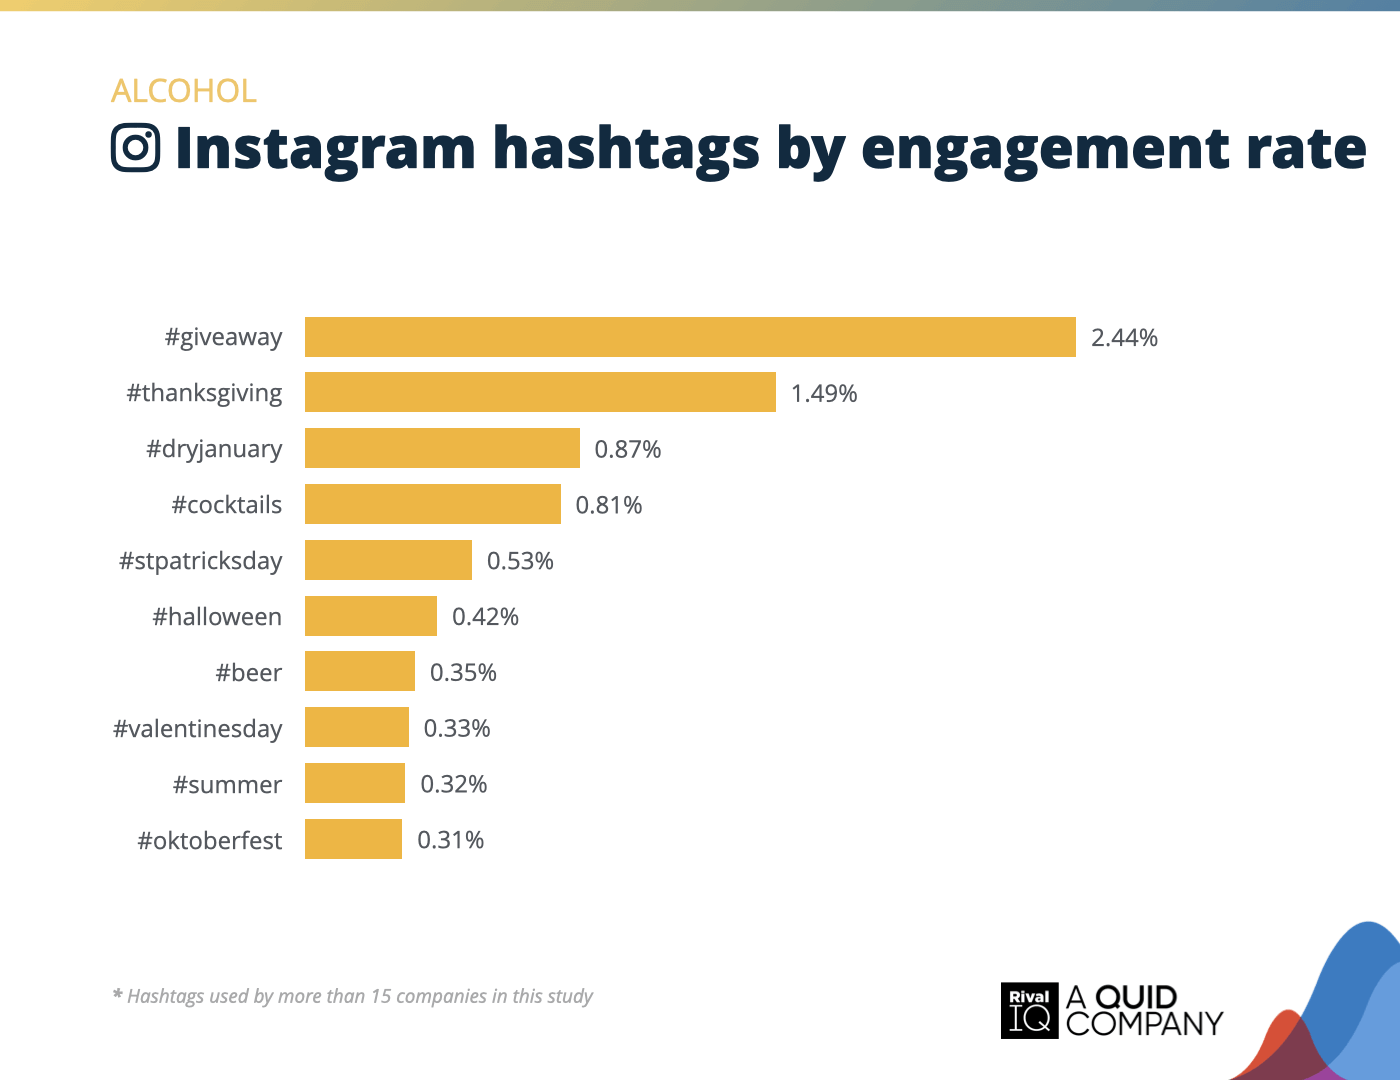
Top Instagram hashtags by engagement rate, Alcohol
Alcohol brands leaned into giveaways on Instagram, with #giveaway earning over 1.5x the engagement of the next best performer. Seasonal hits like #thanksgiving and #dryjanuary followed closely, while #cocktails stayed a fan favorite.
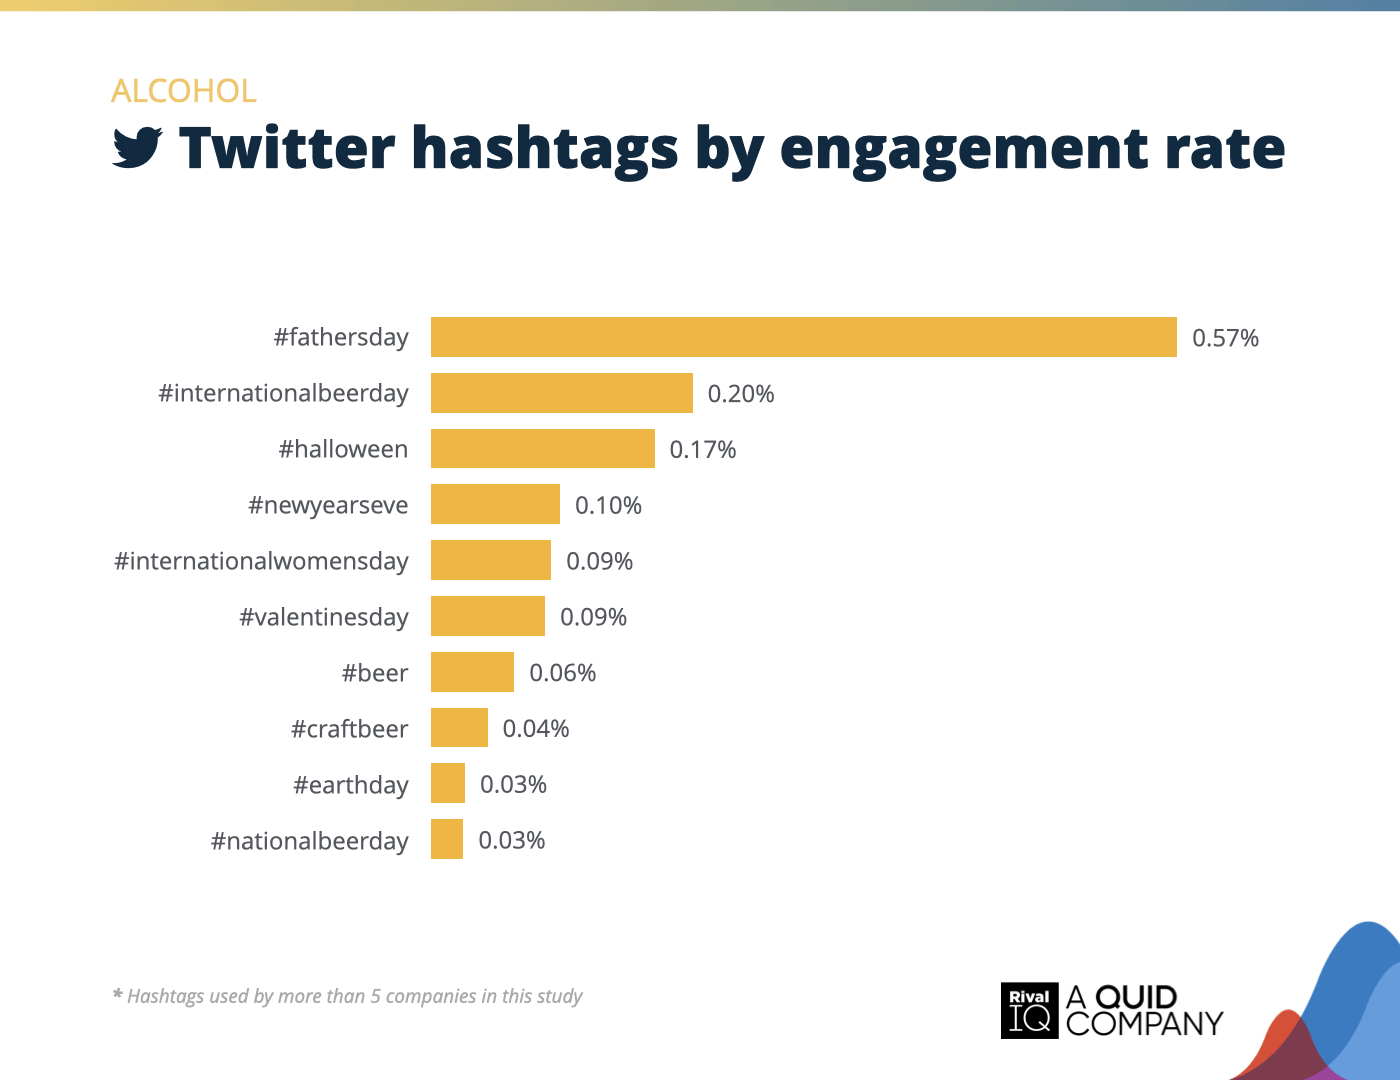
Top Twitter hashtags by engagement rate, Alcohol
Alcohol followers ate up holiday-themed hashtags on Instagram, with #fathersday leading the charge. Other favorites like #halloween, and #valentinesday also kept audiences engaged, proving that seasonal content continues to resonate year-round.
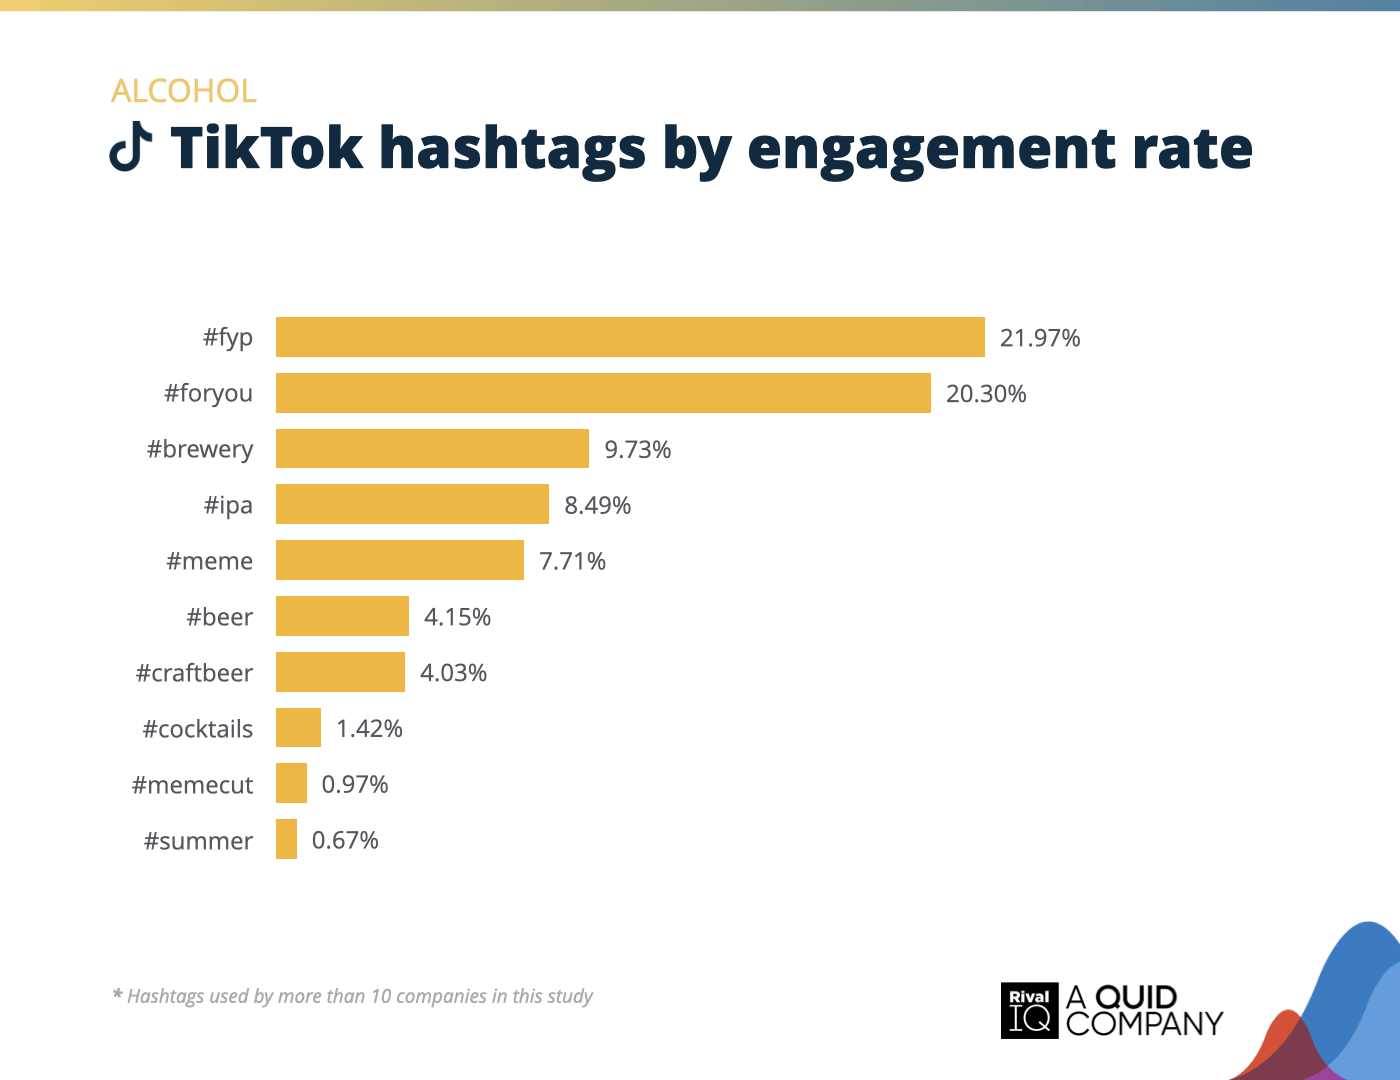
Top TikTok hashtags by engagement rate, Alcohol
Channel-specific hashtags like #fyp and #foryou still dominated on TikTok, but beer-related tags proved to be the real crowd-pleasers.
Fashion Social Media Benchmarks
Fashion brands saw engagement dip across platforms this year, particularly with Twitter activity coming to a standstill.
Some suggestions for Fashion brands:
- Invest more in TikTok, which is paying more engagement dividends than other channels right now.
- Double down on Reels and trending hashtags like #fitcheck on TikTok, where video content still drives engagement despite overall declines.
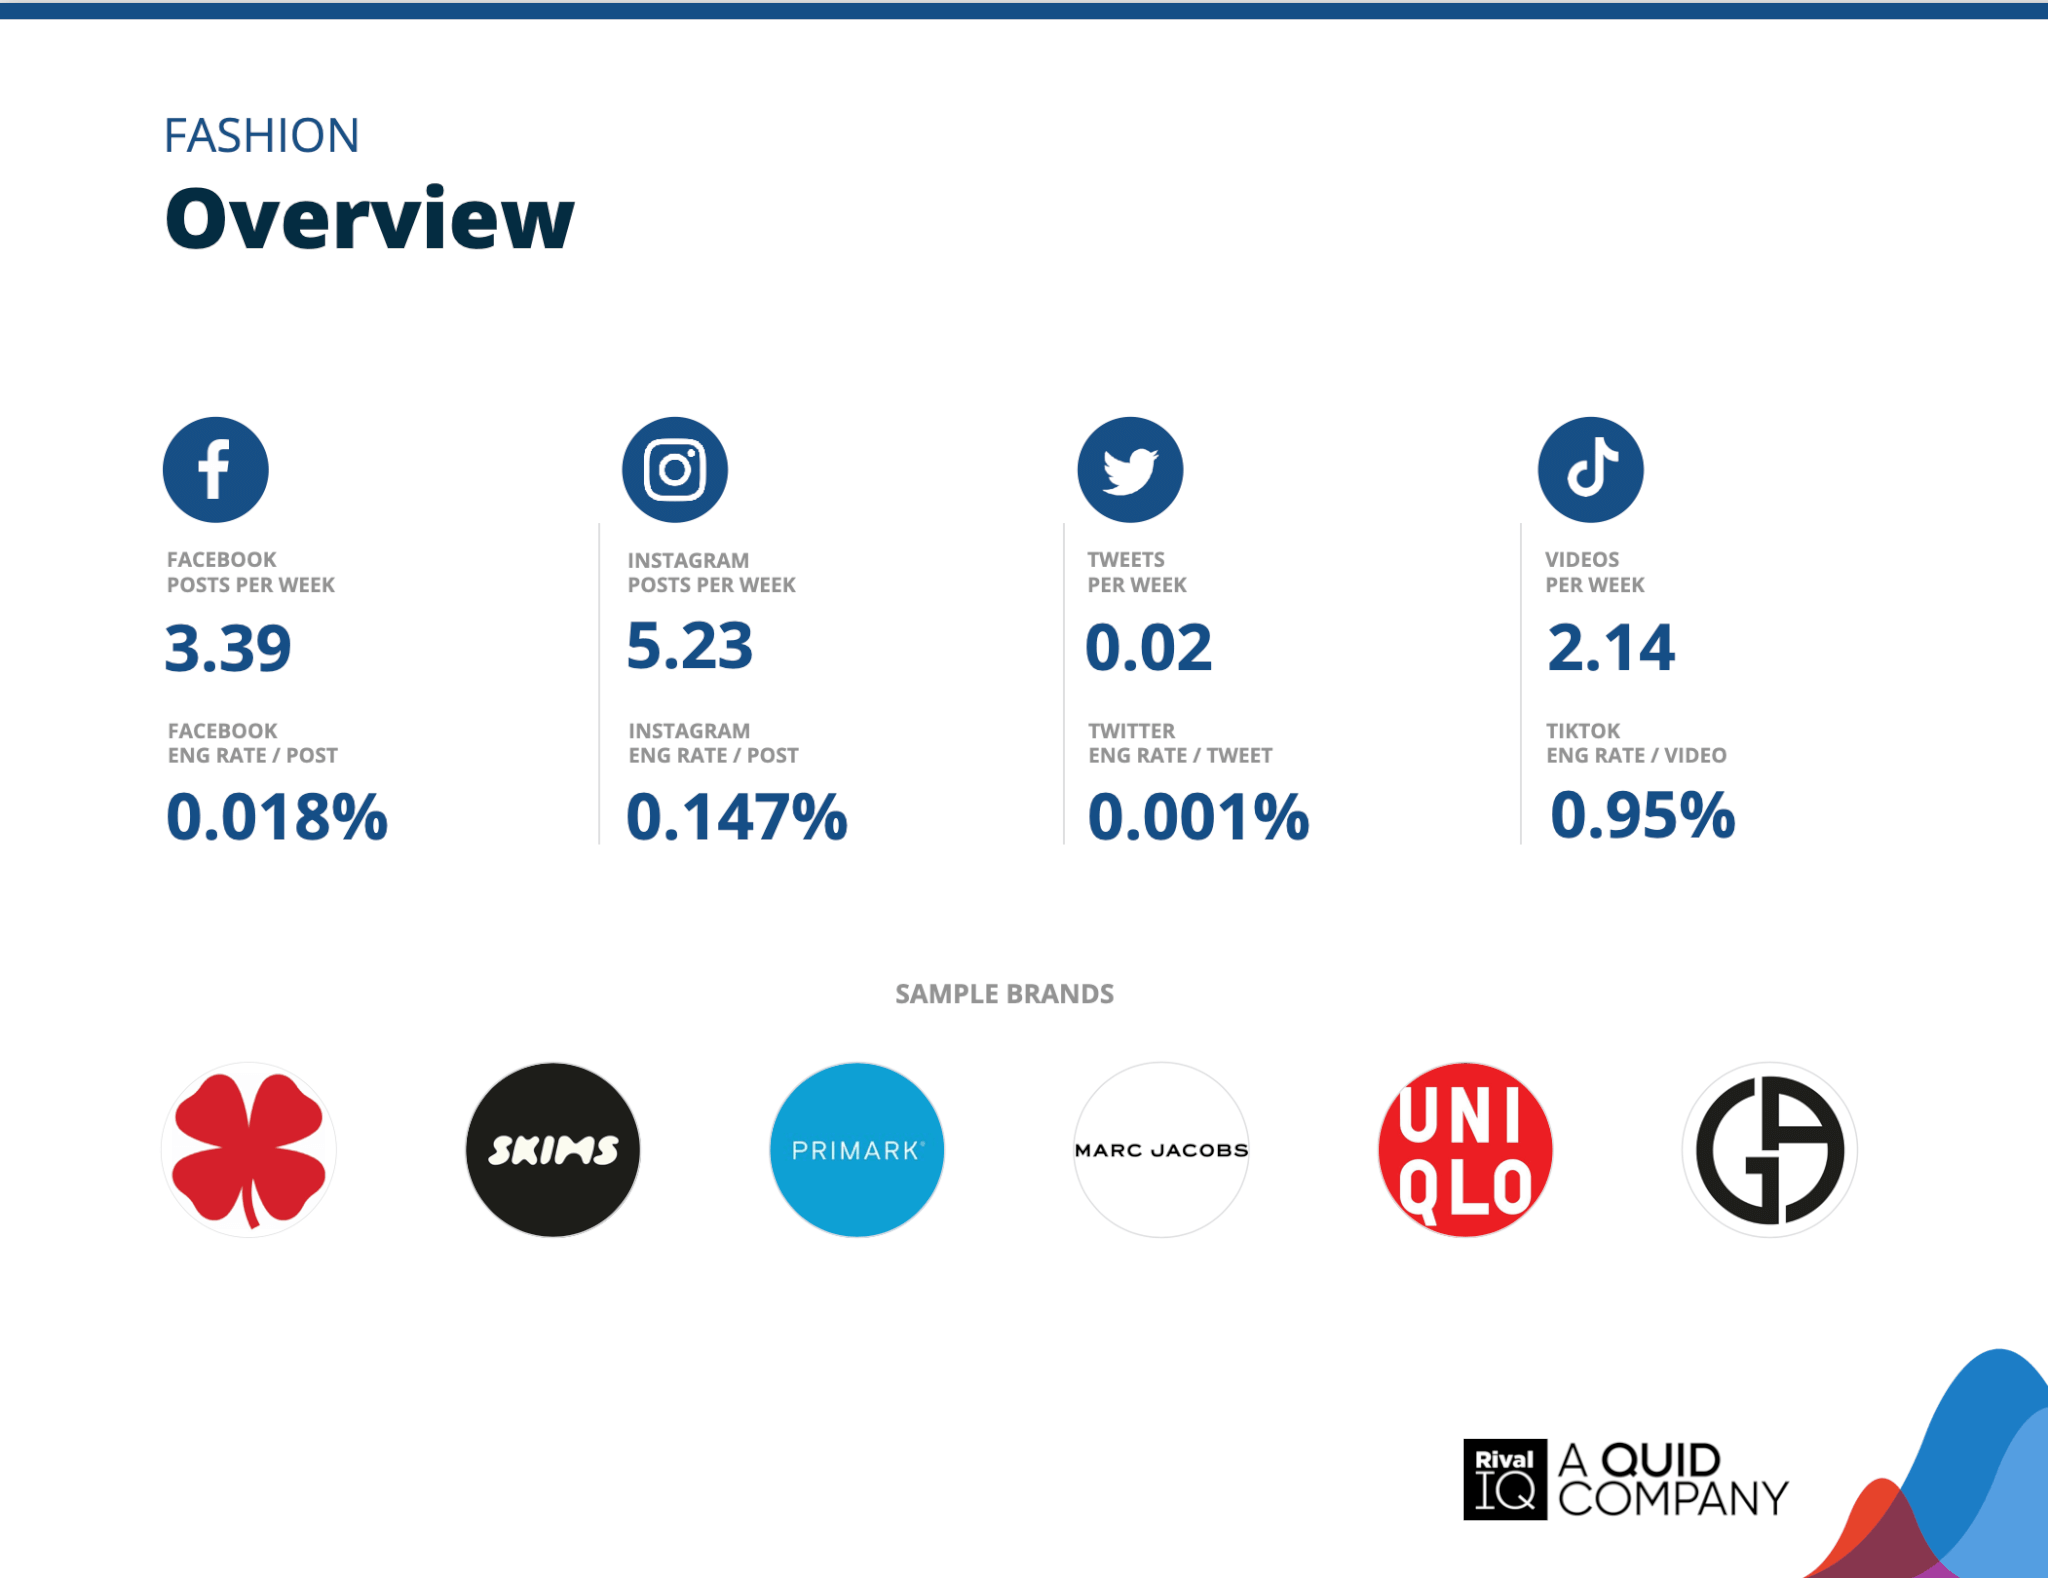
Overview of all benchmarks, Fashion
Notable brands in this year’s report include Armani, Lucky Brand, SKIMS, Marc Jacobs, Uniqlo, and Primark.
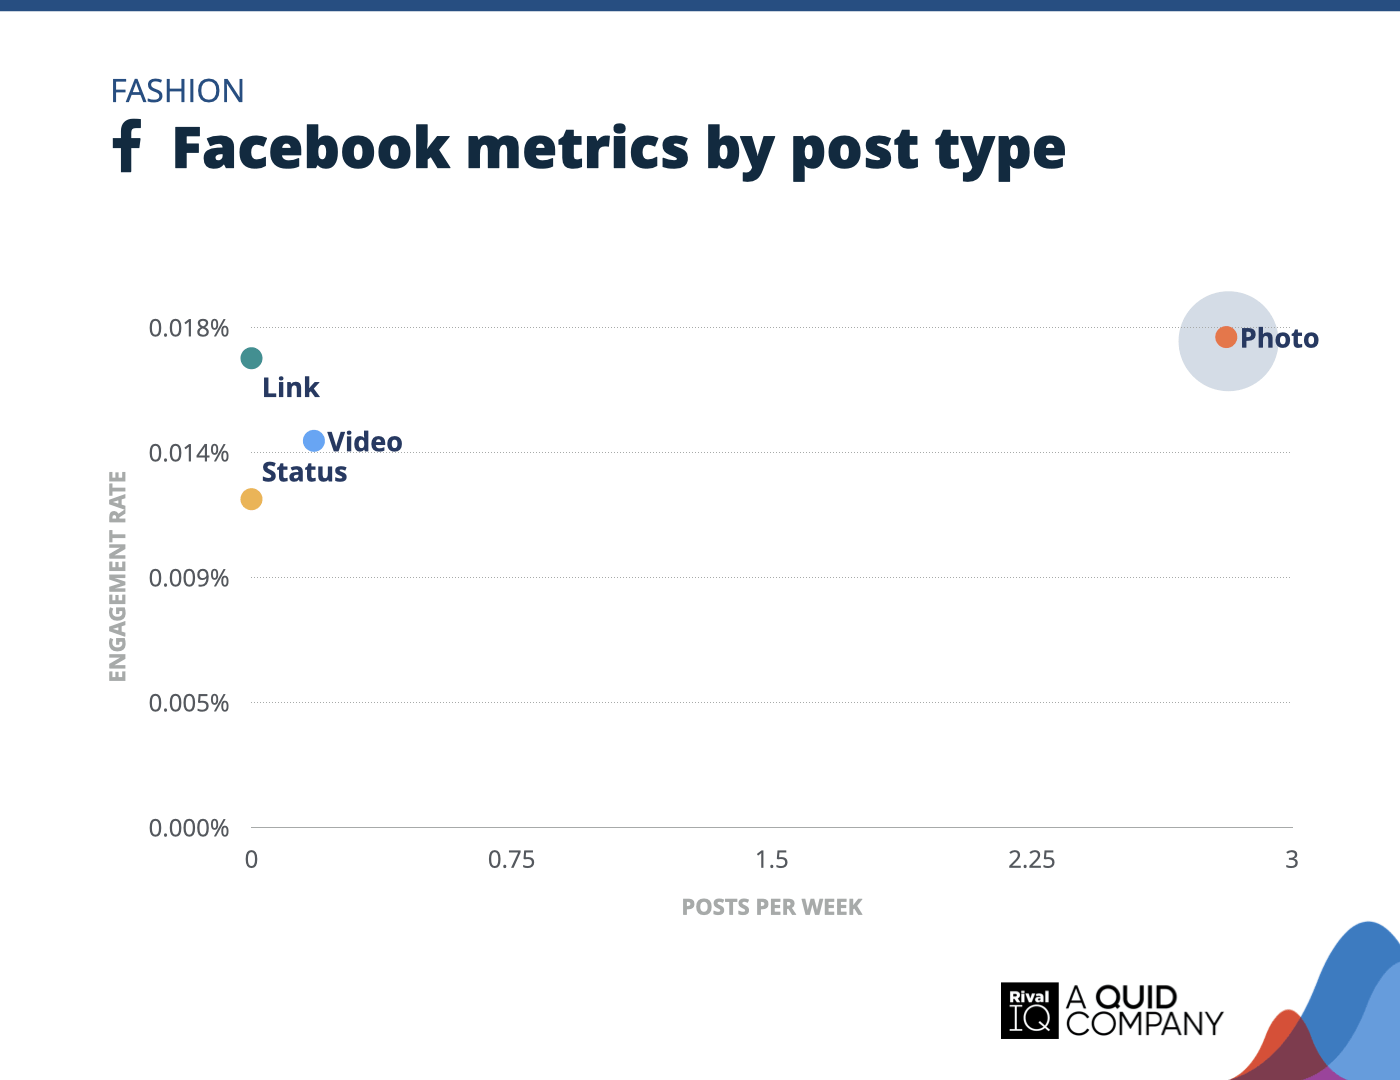
Facebook posts per week and engagement rate by post type, Fashion
Photos kept stealing the spotlight for Fashion brands on Facebook.
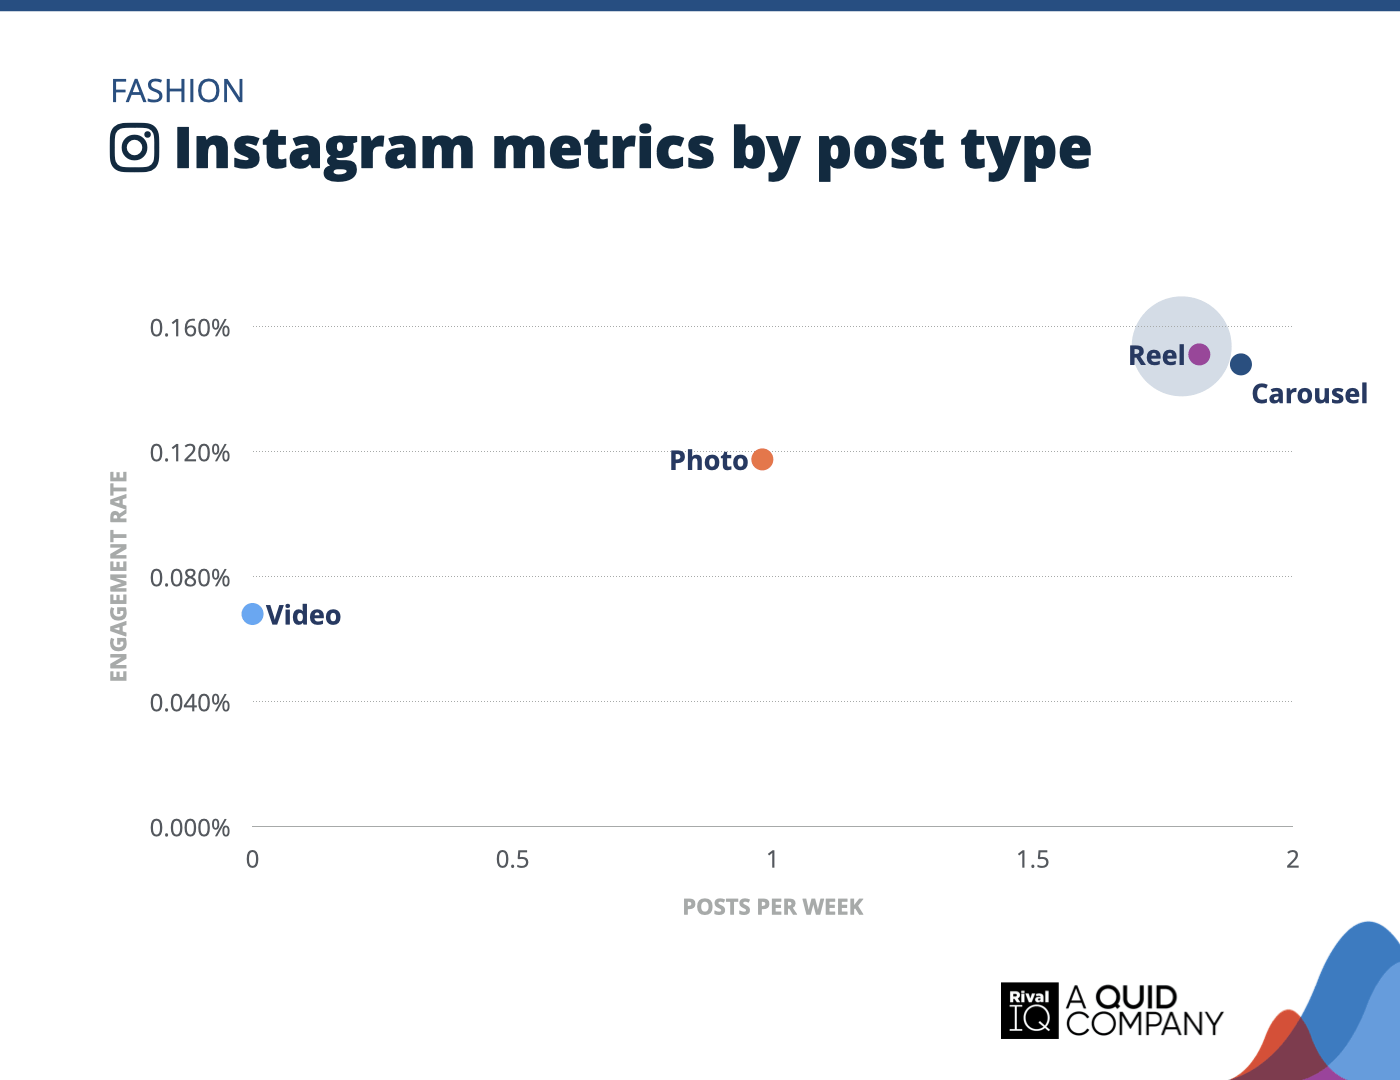
Instagram posts per week and engagement rate by post type, Fashion
Fashion brands leaned into Reels and Carousels on Instagram, both driving the highest engagement rates this year. Reels saw a slight edge over Carousels, marking a shift in how brands connect with their audiences.
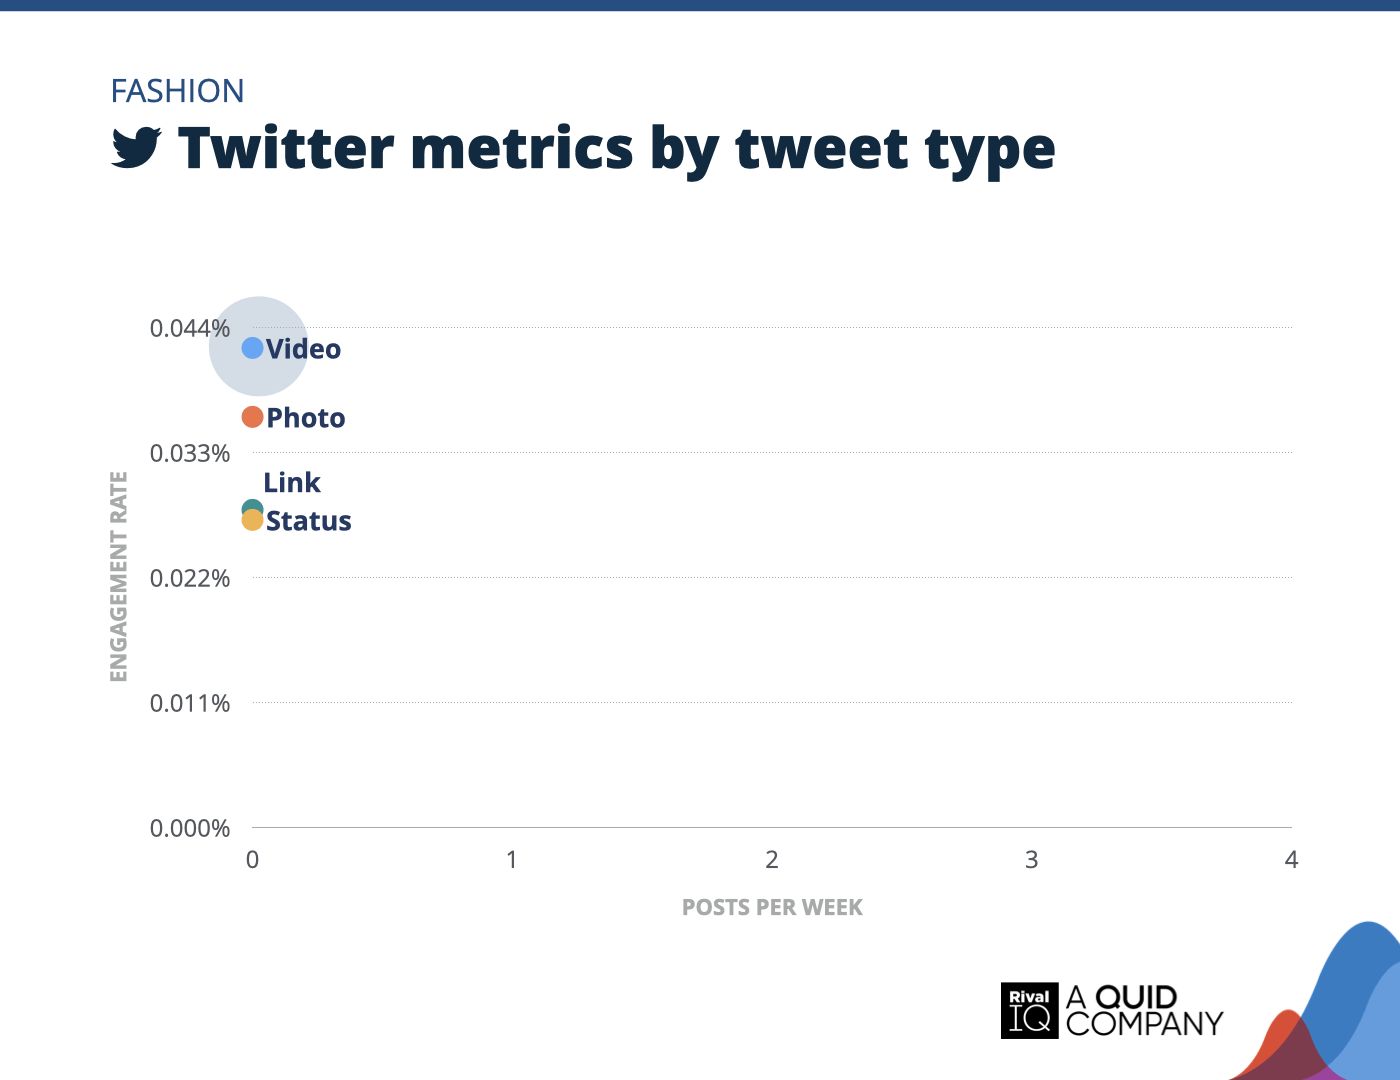
Twitter posts per week and engagement rate by tweet type, Fashion
Fashion brands kept Twitter activity light, with most post types seeing minimal use. Video tweets led in engagement, while status and link posts remained rare and less effective.
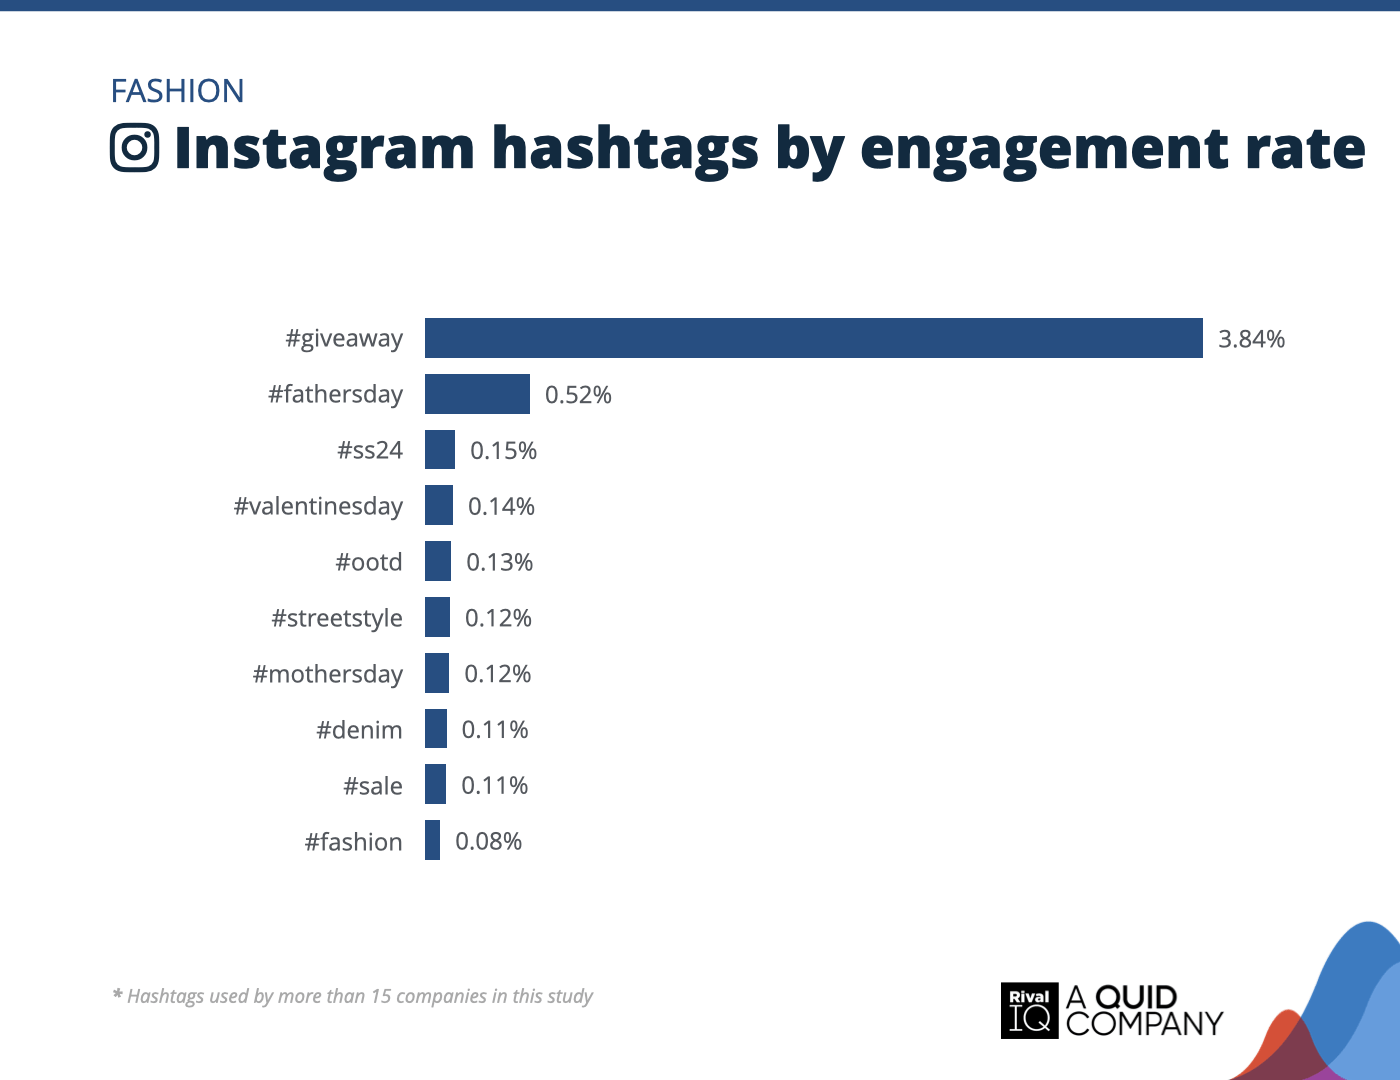
Top Instagram hashtags by engagement rate, Fashion
Seasonal favorites like #fathersday and #valentinesday were big hits on Instagram, while go-to fashion tags like #ootd and #streetstyle kept the likes rolling in.
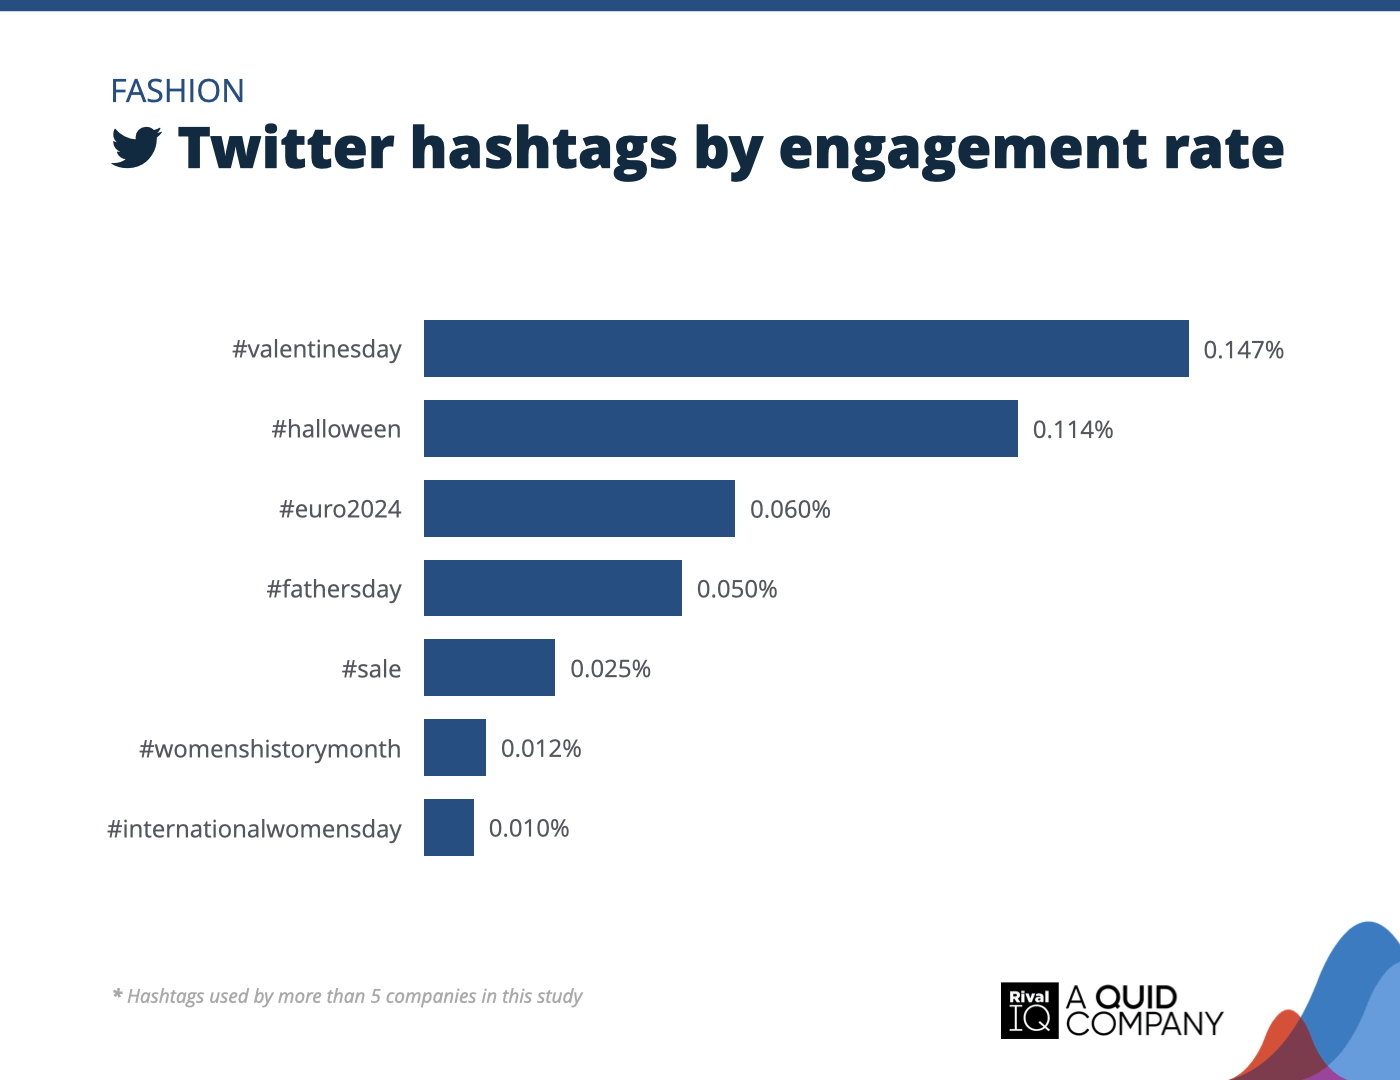
Top Twitter hashtags by engagement rate, Fashion
Fashion brands saw big wins with seasonal hashtags on Twitter.
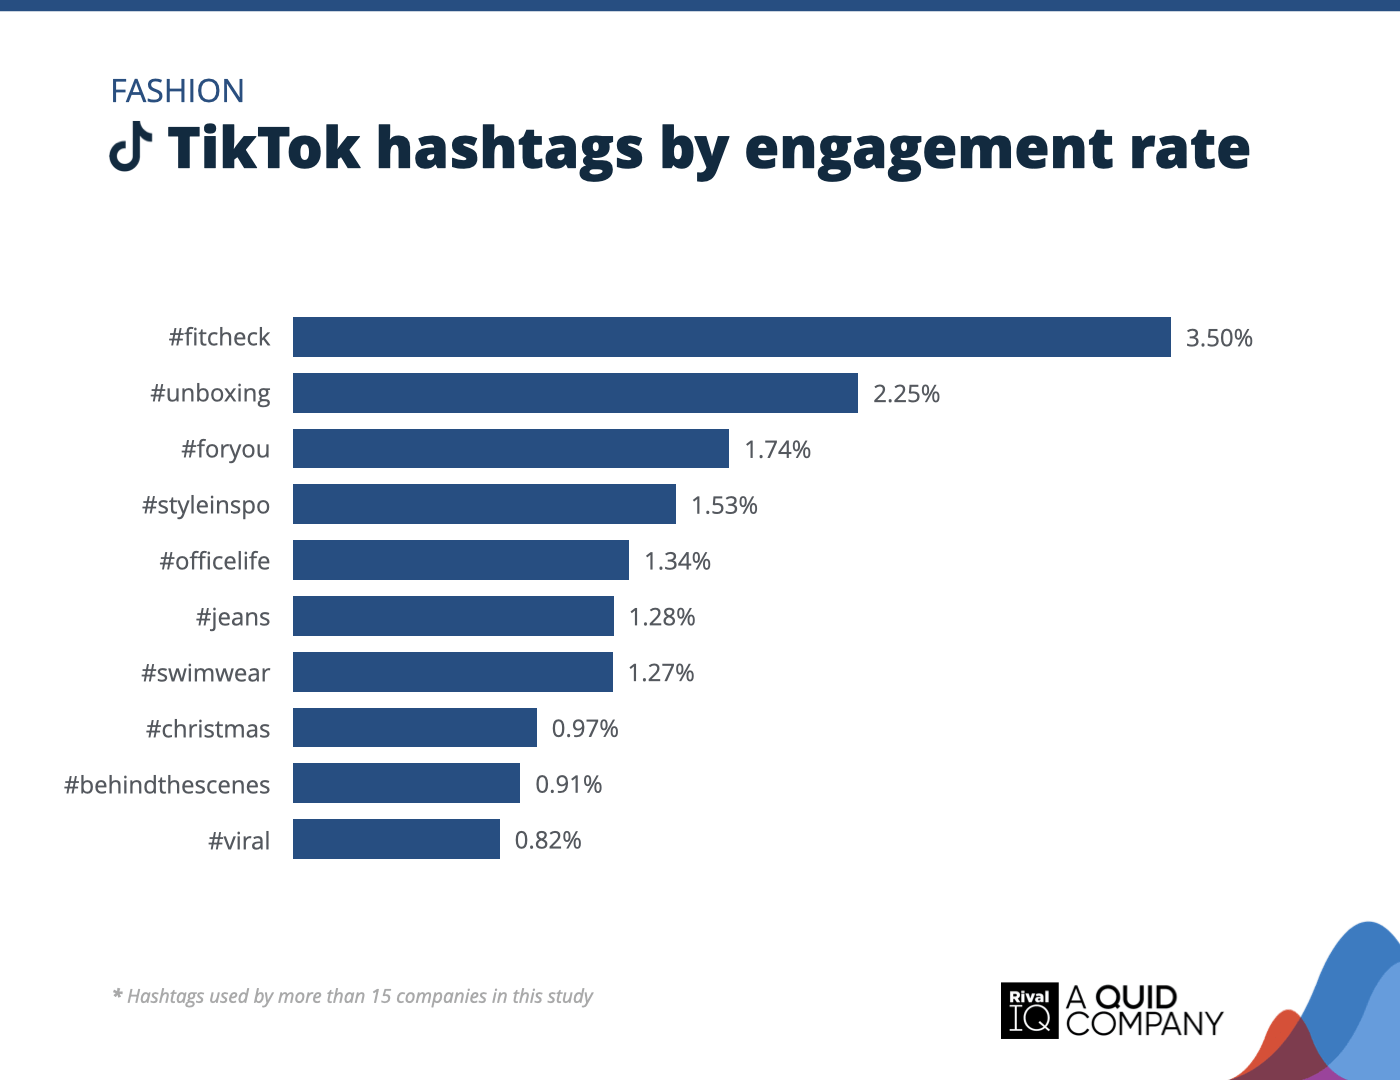
Top TikTok hashtags by engagement rate, Fashion
#fitcheck was the clear winner for Fashion brands on TikTok, pulling in an engagement rate over 1.5x higher than the next best hashtag
Financial Services Social Media Benchmarks
Twitter was a bright spot for Financial Services, doubling its engagement rate while nearly doubling post frequency.
A few ideas for Financial Services brands:
- Keep the momentum going on Twitter, where both engagement and post frequency have surged for FinServ brands.
- Educational hashtags like #FinTok and #Money were top performers, proving FinServ followers are down to learn.
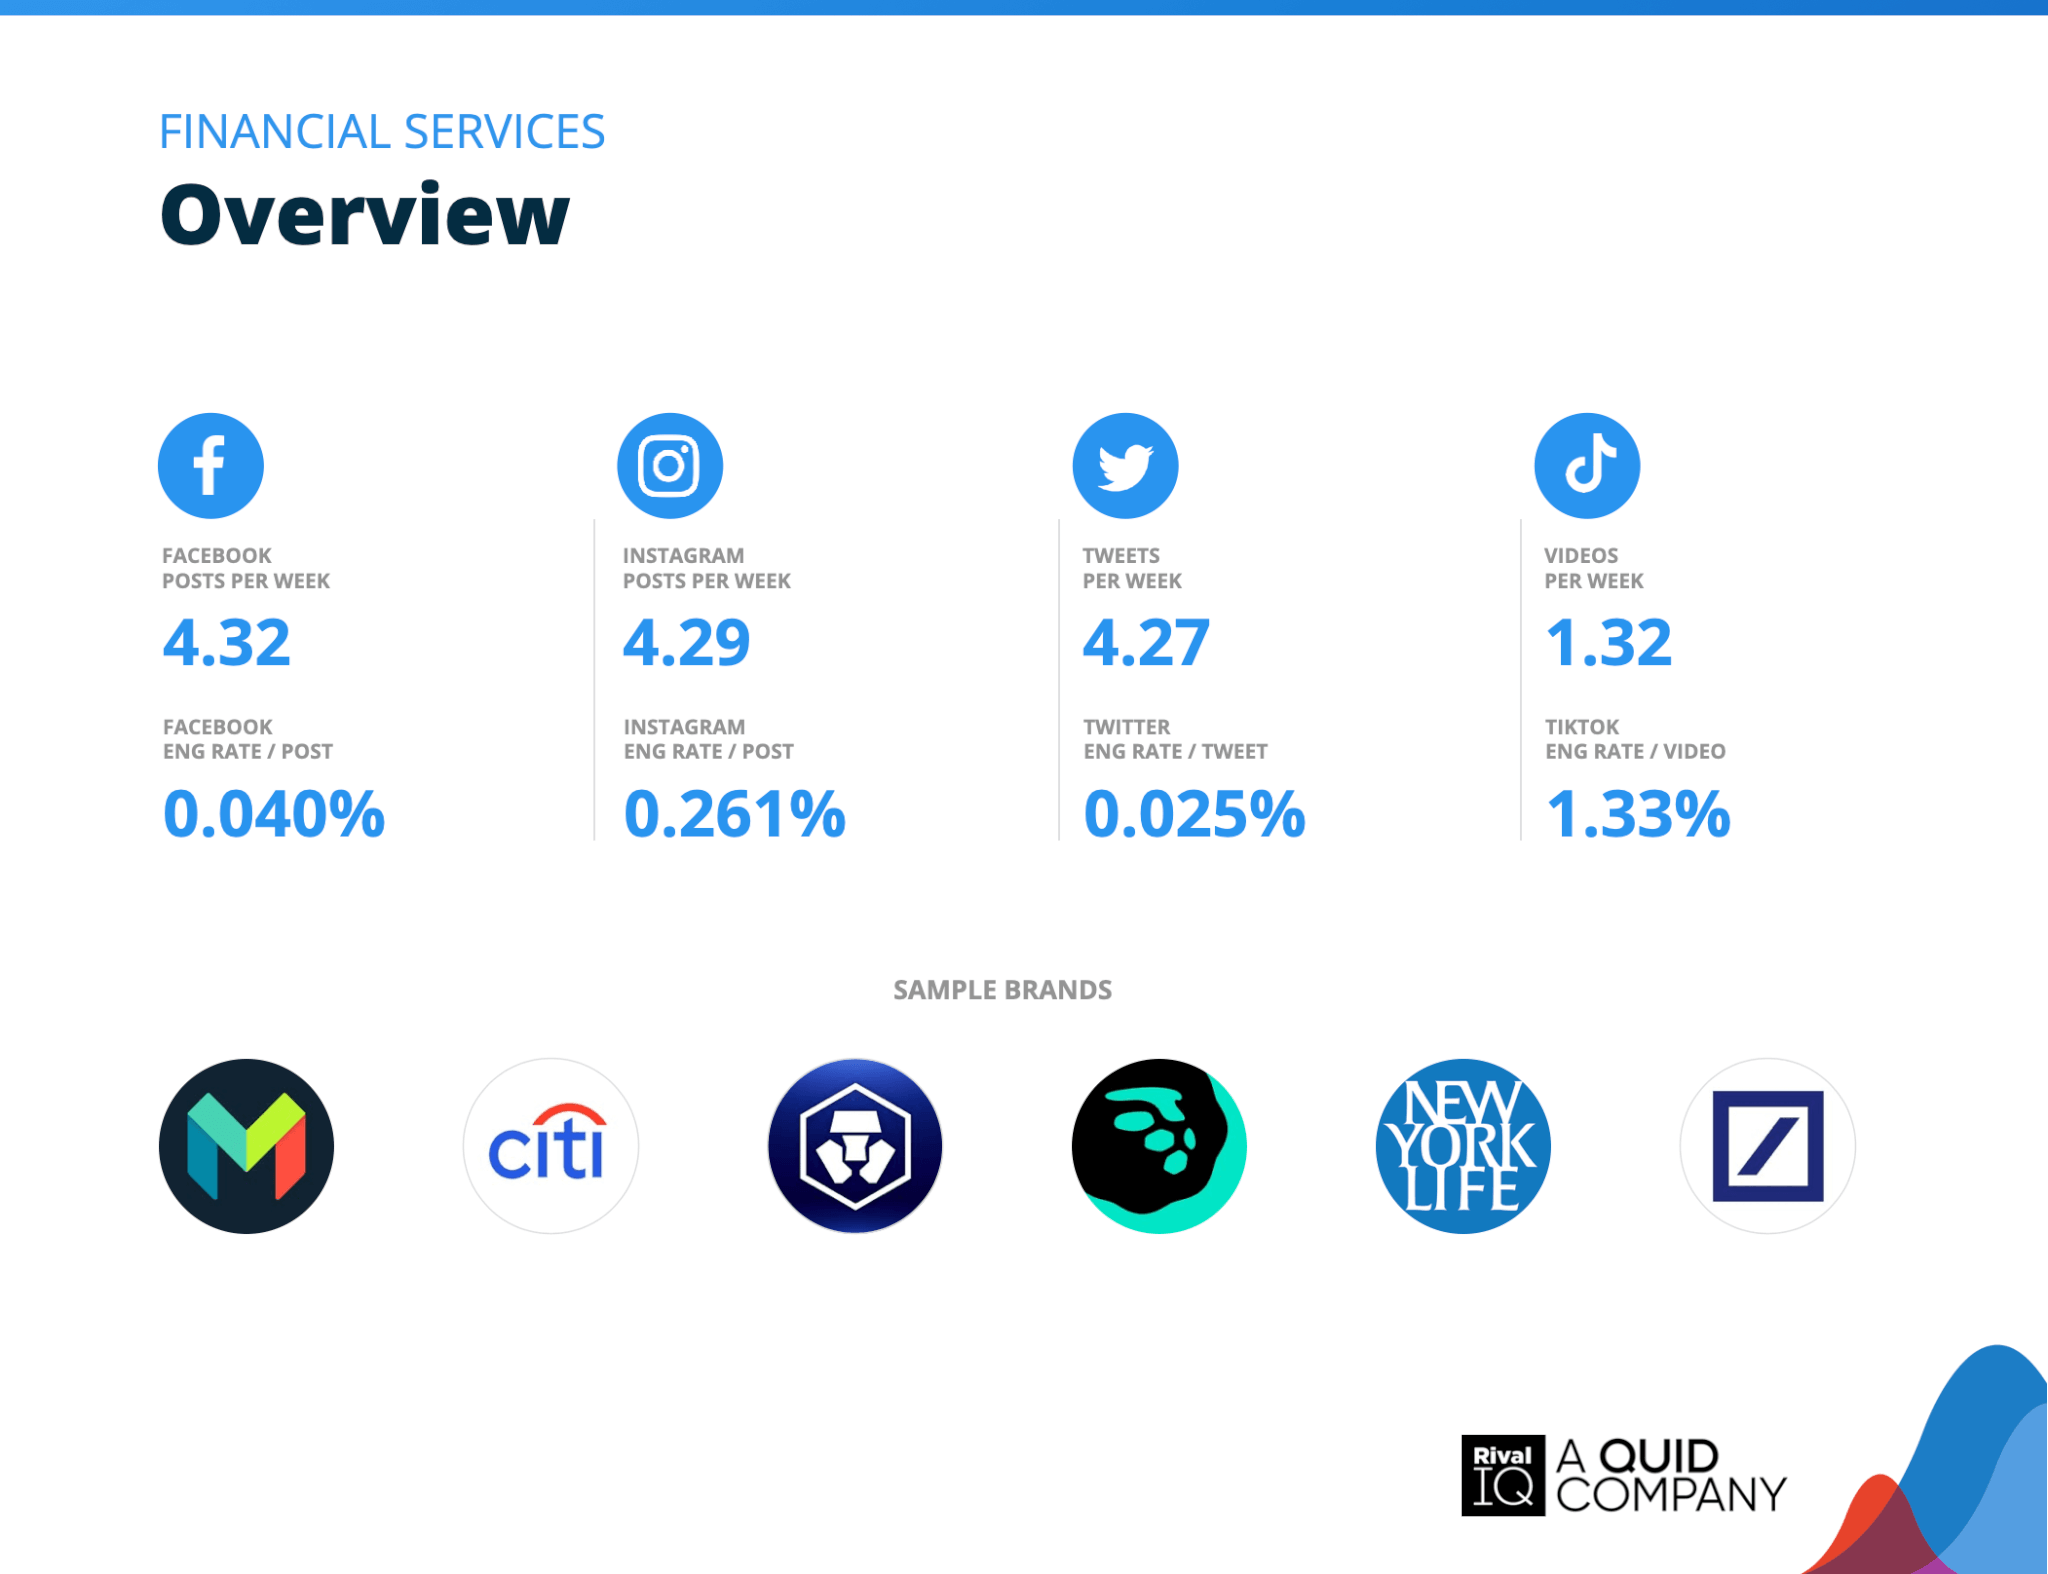
Overview of all benchmarks, Financial Services
Notable brands in this year’s report include Citi, Crypto.com, Deutsche Bank, MoneyLion, Monzo, and New York Life.
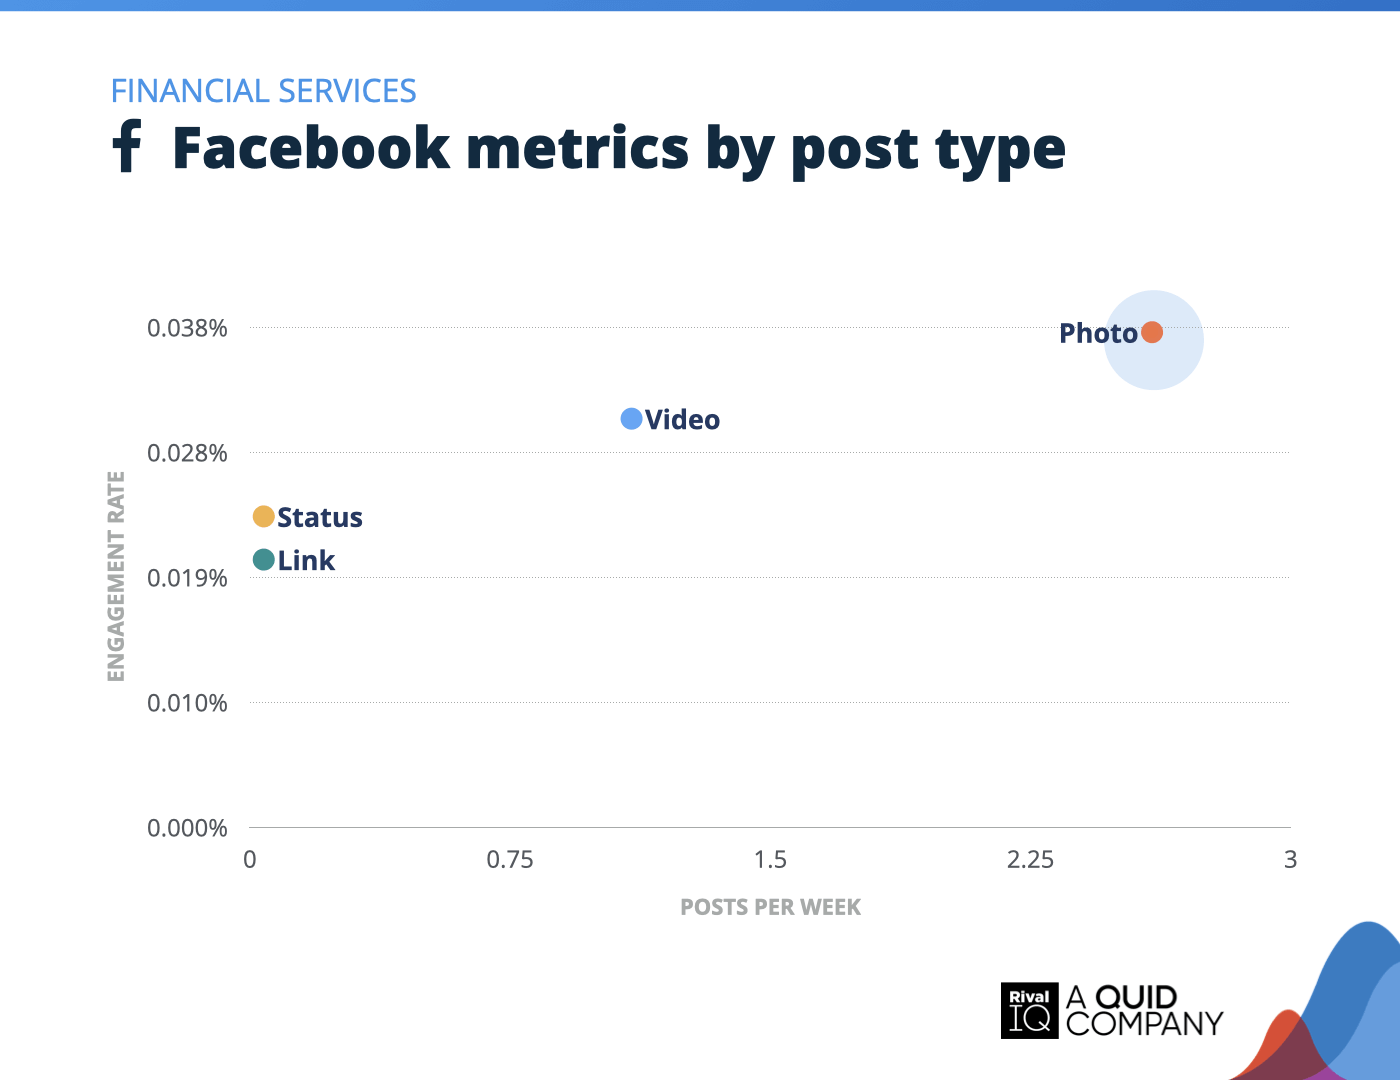
Facebook posts per week and engagement rate by post type, Financial Services
Photos topped the charts for Financial Services brands on Facebook, pulling in the highest engagement rates. Videos weren’t far behind, while status and link posts saw less love.
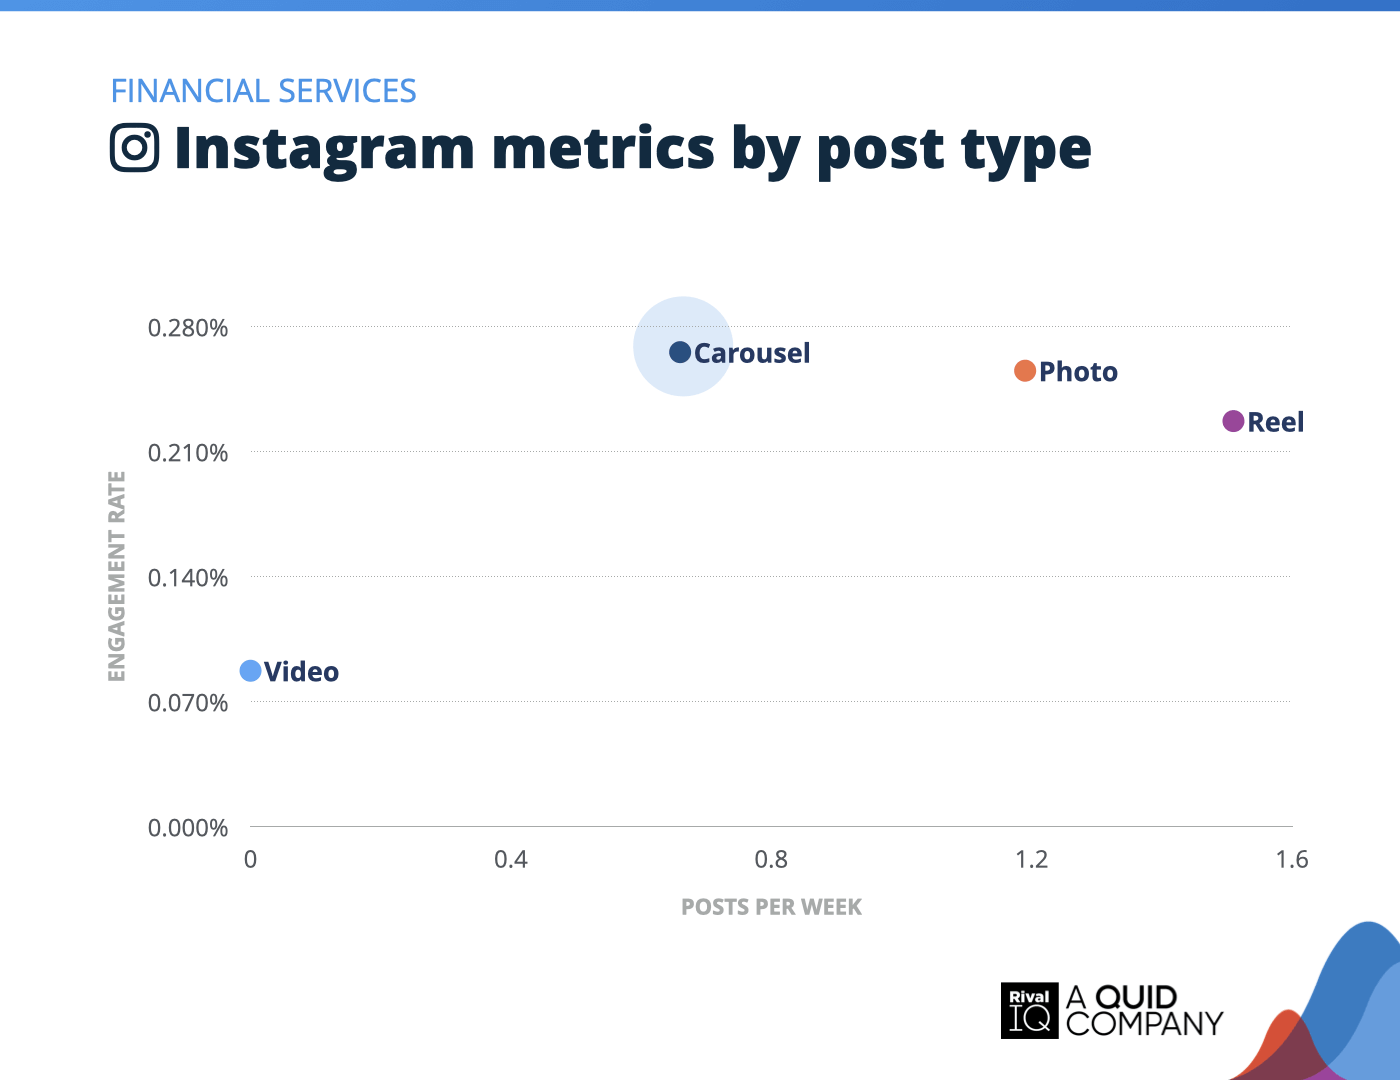
Instagram posts per week and engagement rate by post type, Financial Services
Carousels took the lead for Financial Services brands on Instagram, pulling in the highest engagement, even though Reels were posted more than twice as often.
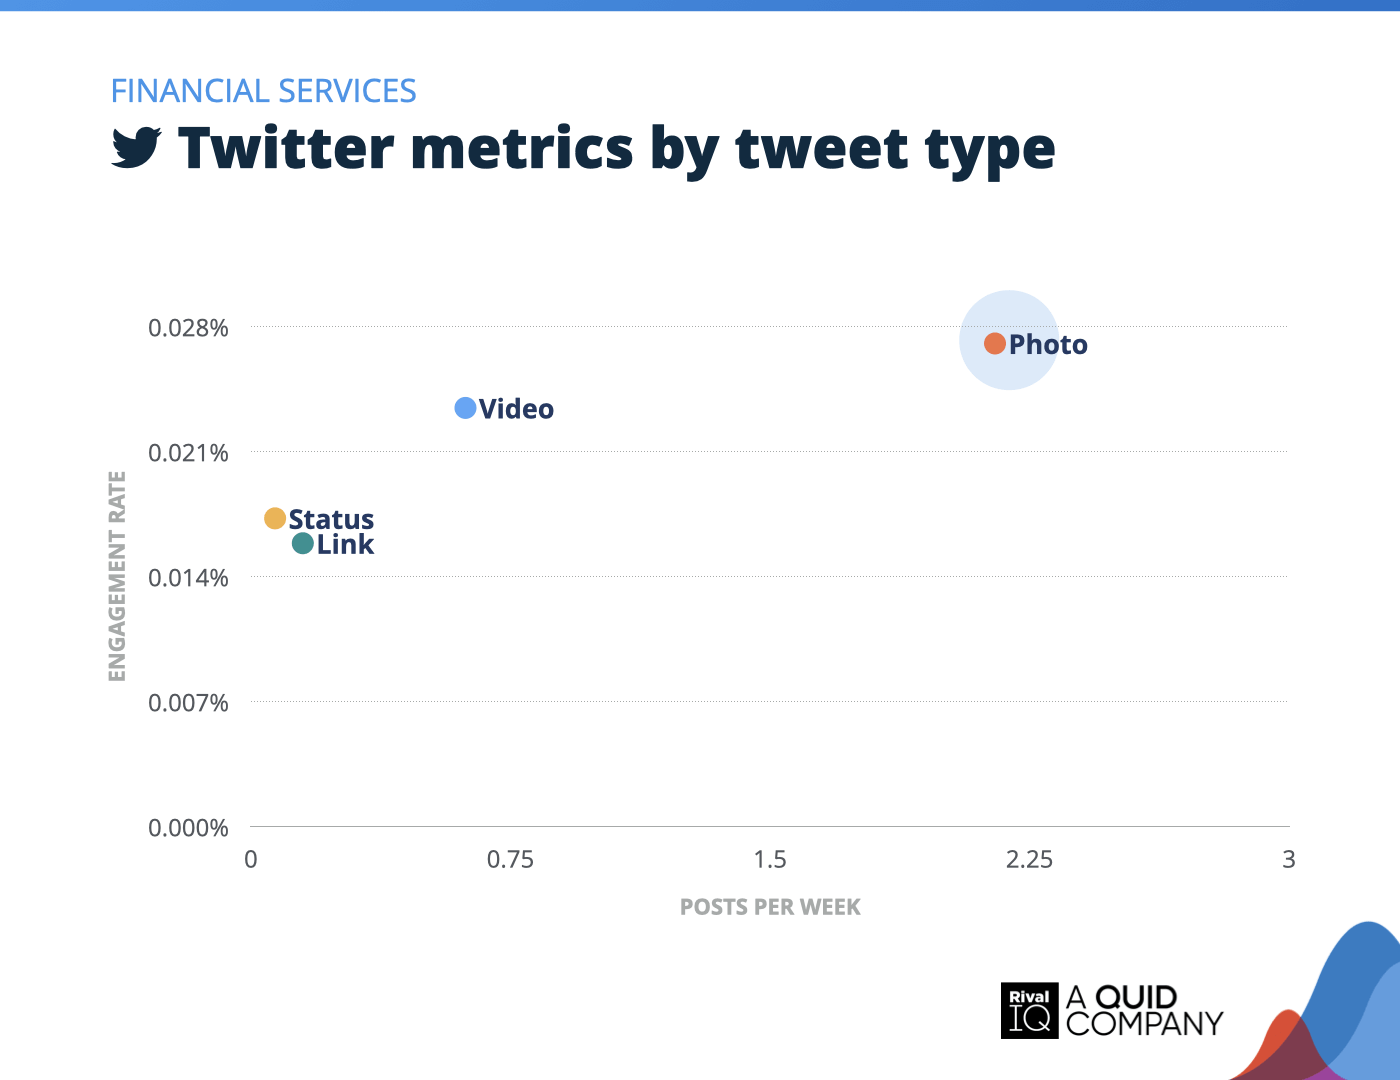
Twitter posts per week and engagement rate by tweet type, Financial Services
Photo tweets pulled in the highest engagement for Financial Services brands on Twitter, with videos close behind.
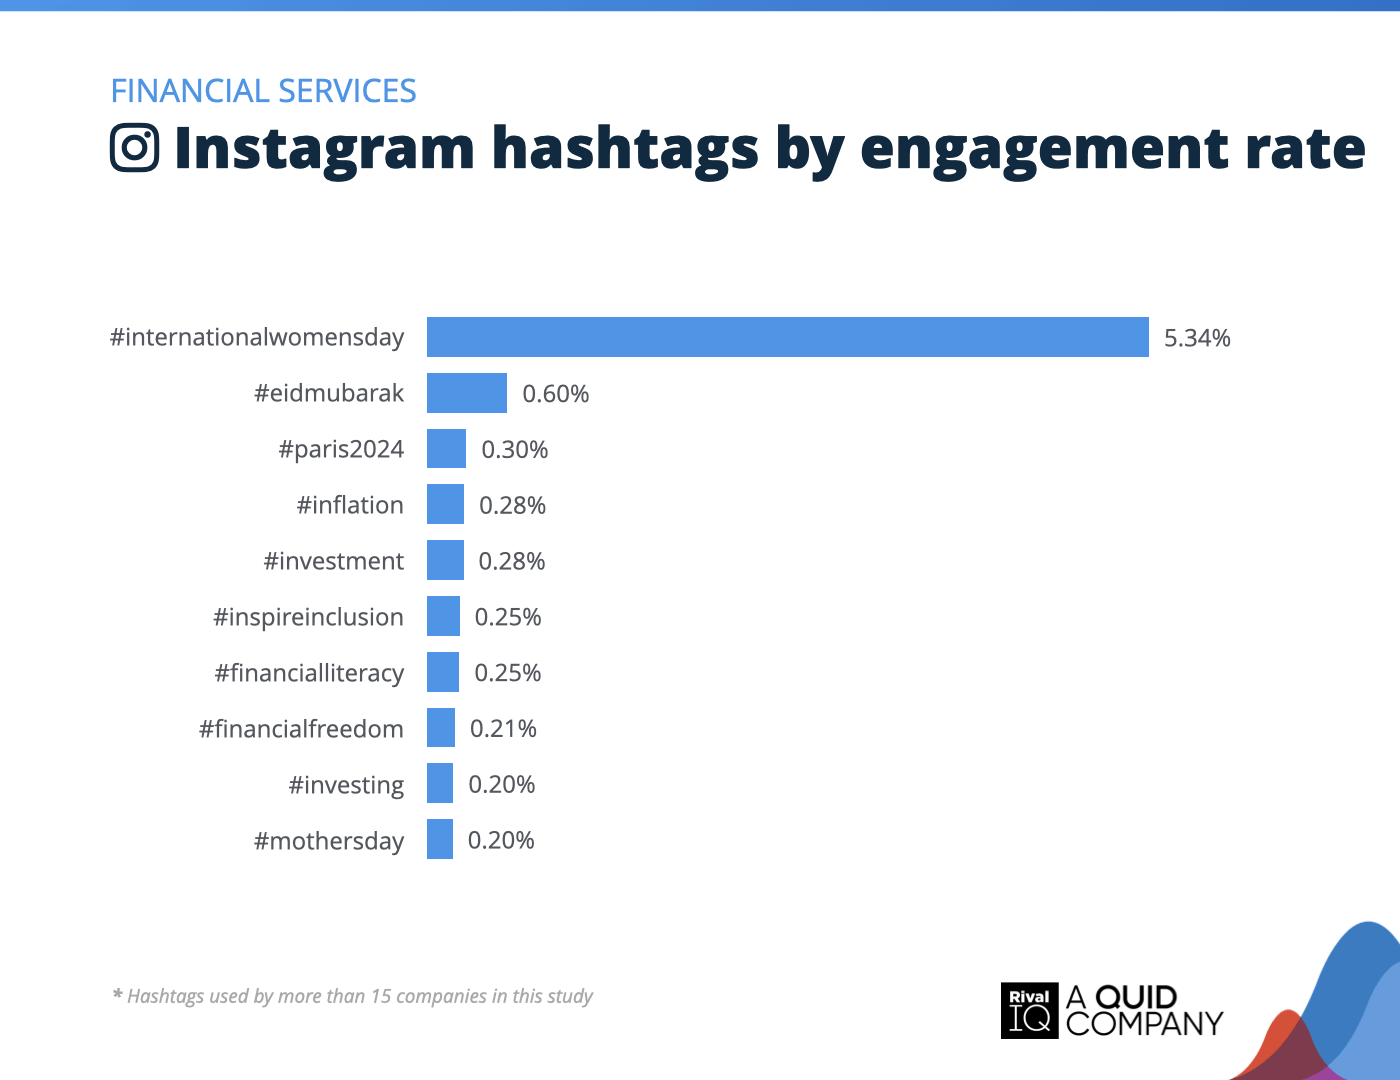
Top Instagram hashtags by engagement rate, Financial Services
Financial Services brands leaned into meaningful moments, with #internationalwomensday leading the way in engagement.
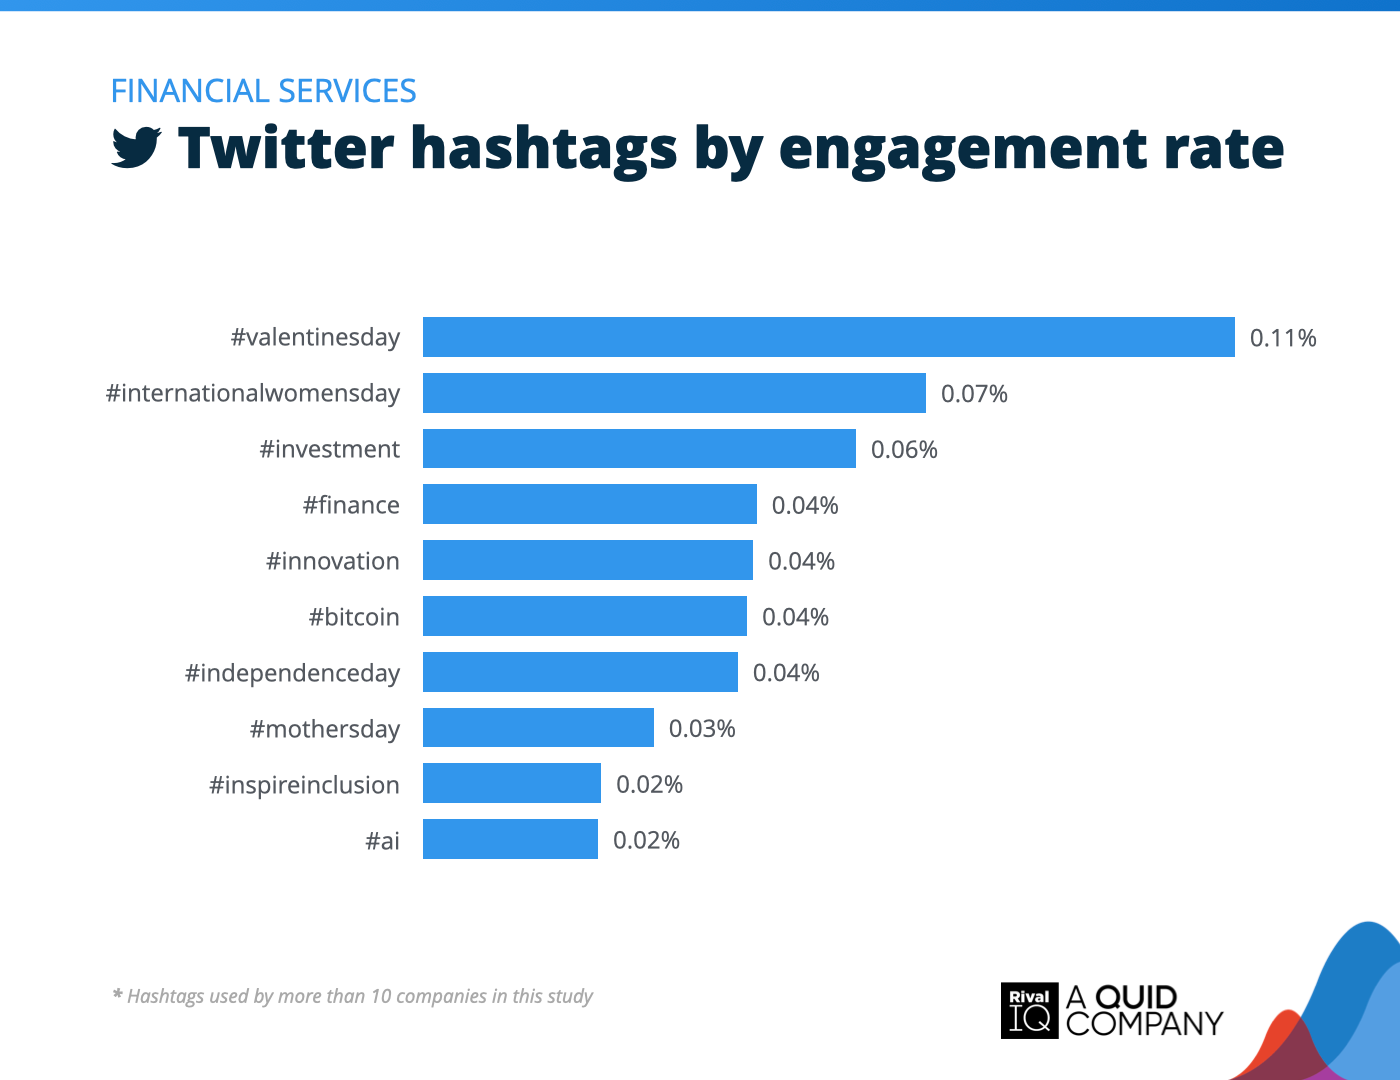
Top Twitter hashtags by engagement rate, Financial Services
Financial Services brands were all about holiday and finance hashtags this year on Twitter.
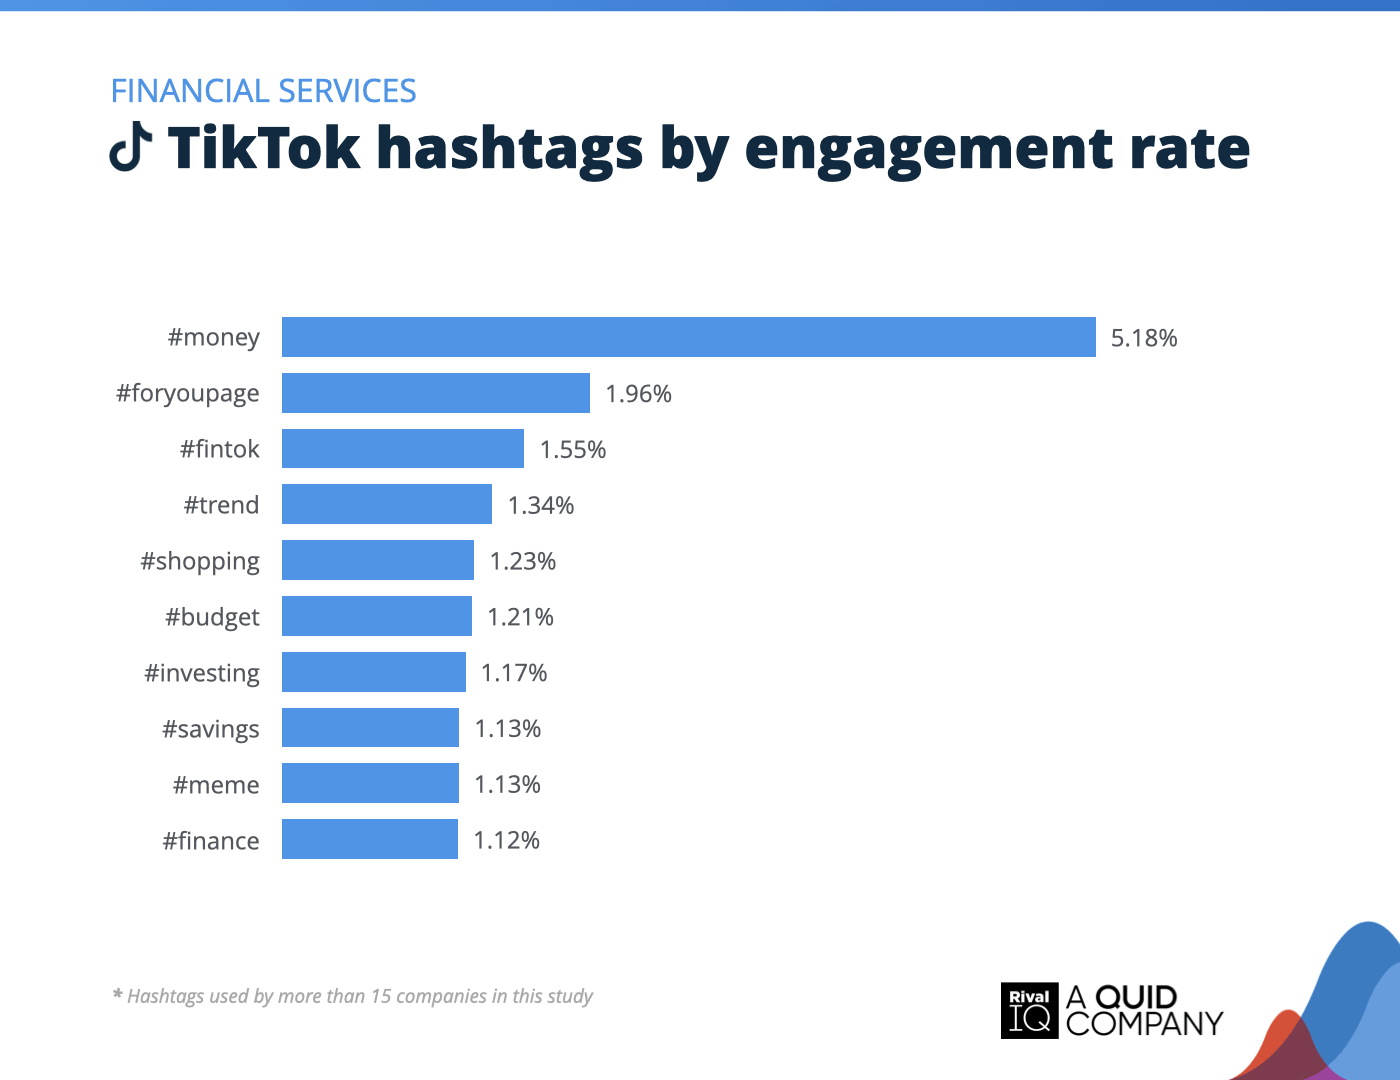
Top TikTok hashtags by engagement rate, Financial Services
While holiday-themed hashtags ruled Instagram and Twitter, Financial Services brands got straight to business on TikTok with money-focused tags.
Food & Beverage Social Media Benchmarks
Food & Beverage brands served up strong engagement on Instagram and TikTok, outperforming the median engagement rates across industries.
Some ideas for improvement:
- Short-form videos are still the recipe for success. Keep experimenting with Reels and trending TikTok content.
- Holiday and recipe-themed content continues to resonate \u2028year-round, keeping followers engaged and hungry for more.
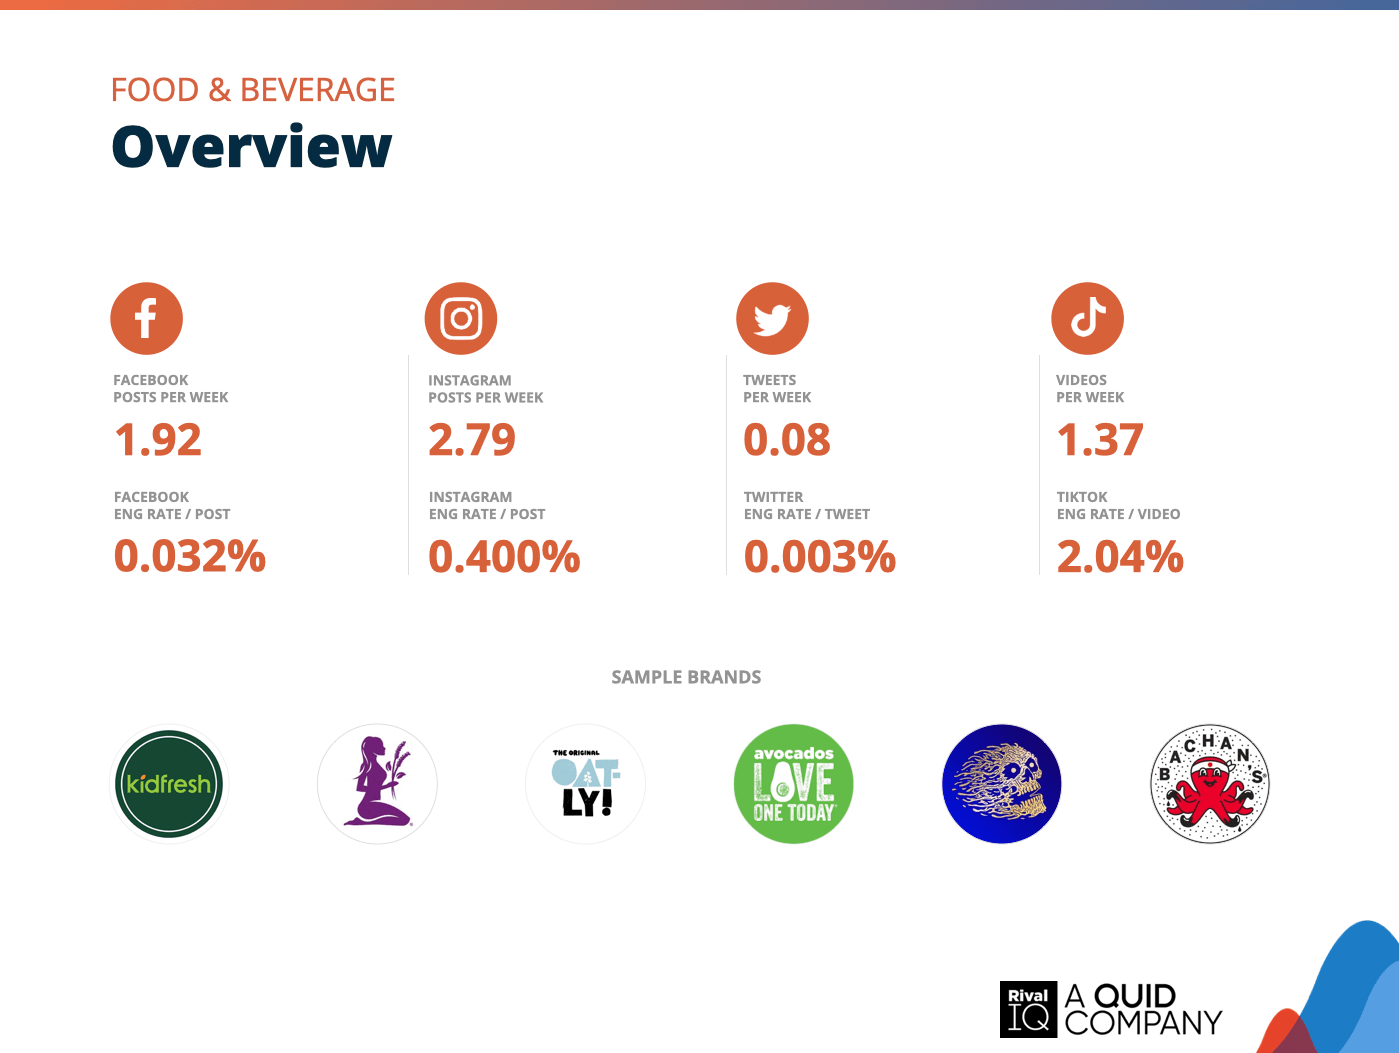
Overview of all benchmarks, Food & Beverage
Notable brands in this year’s report include Bachan’s, Kidfresh, Liquid Death, Love One Today, Mamma Chia, and Oatly.
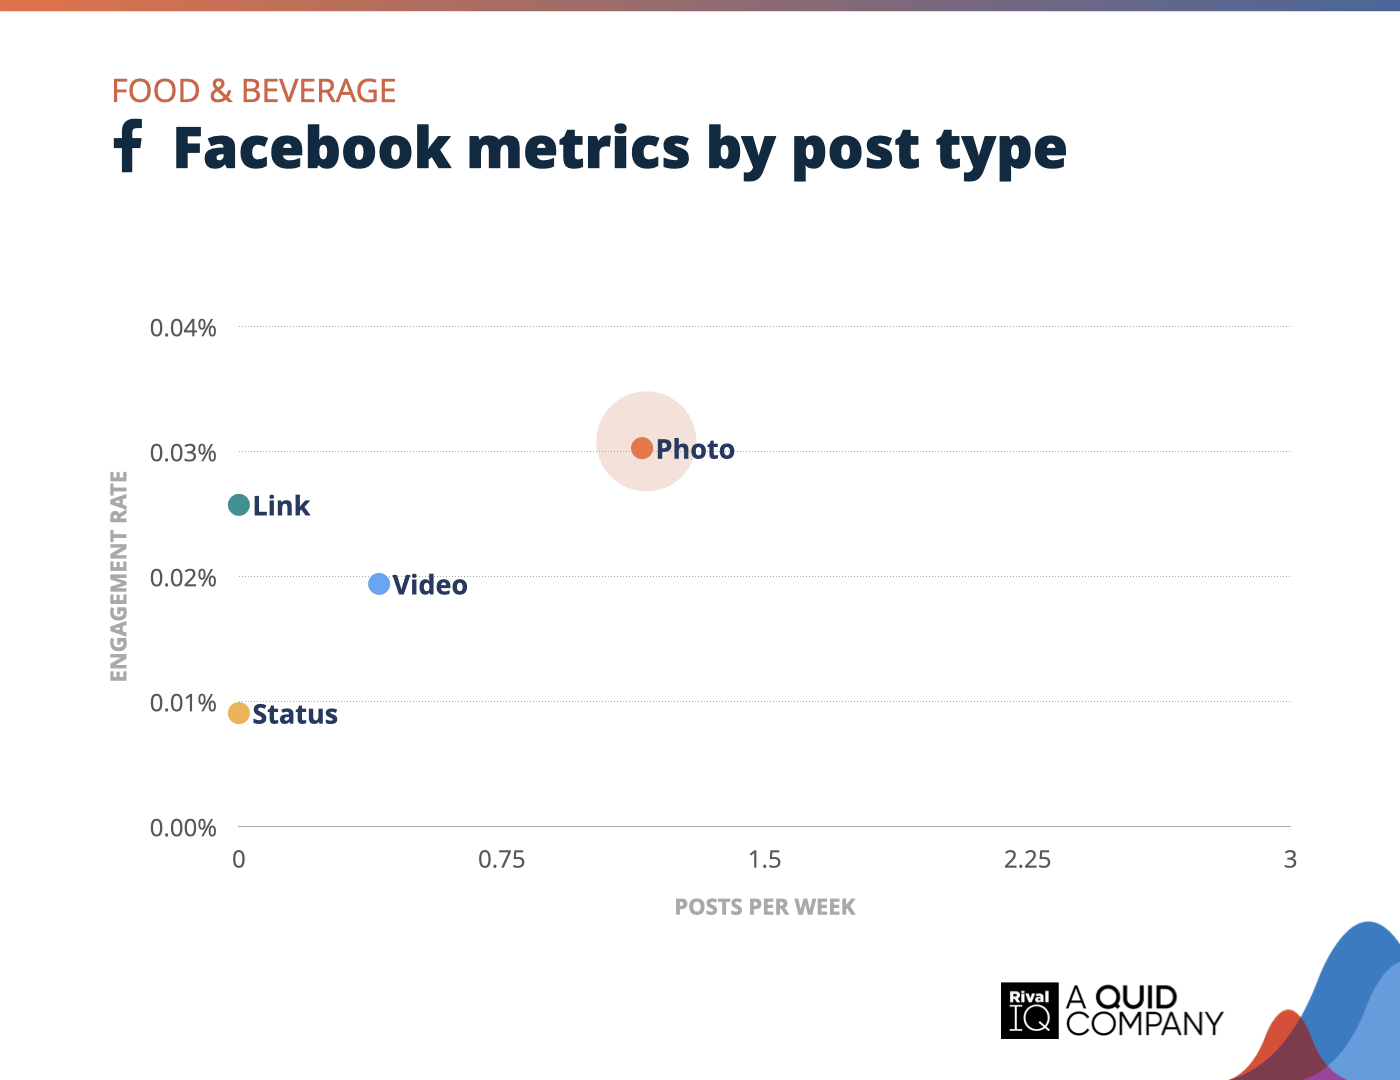
Facebook posts per week and engagement rate by post type, Food & Beverage
Photo posts stood out for Food & Beverage brands on Facebook this year hoping to entice followers to connect IRL with mouthwatering snaps of their offerings.
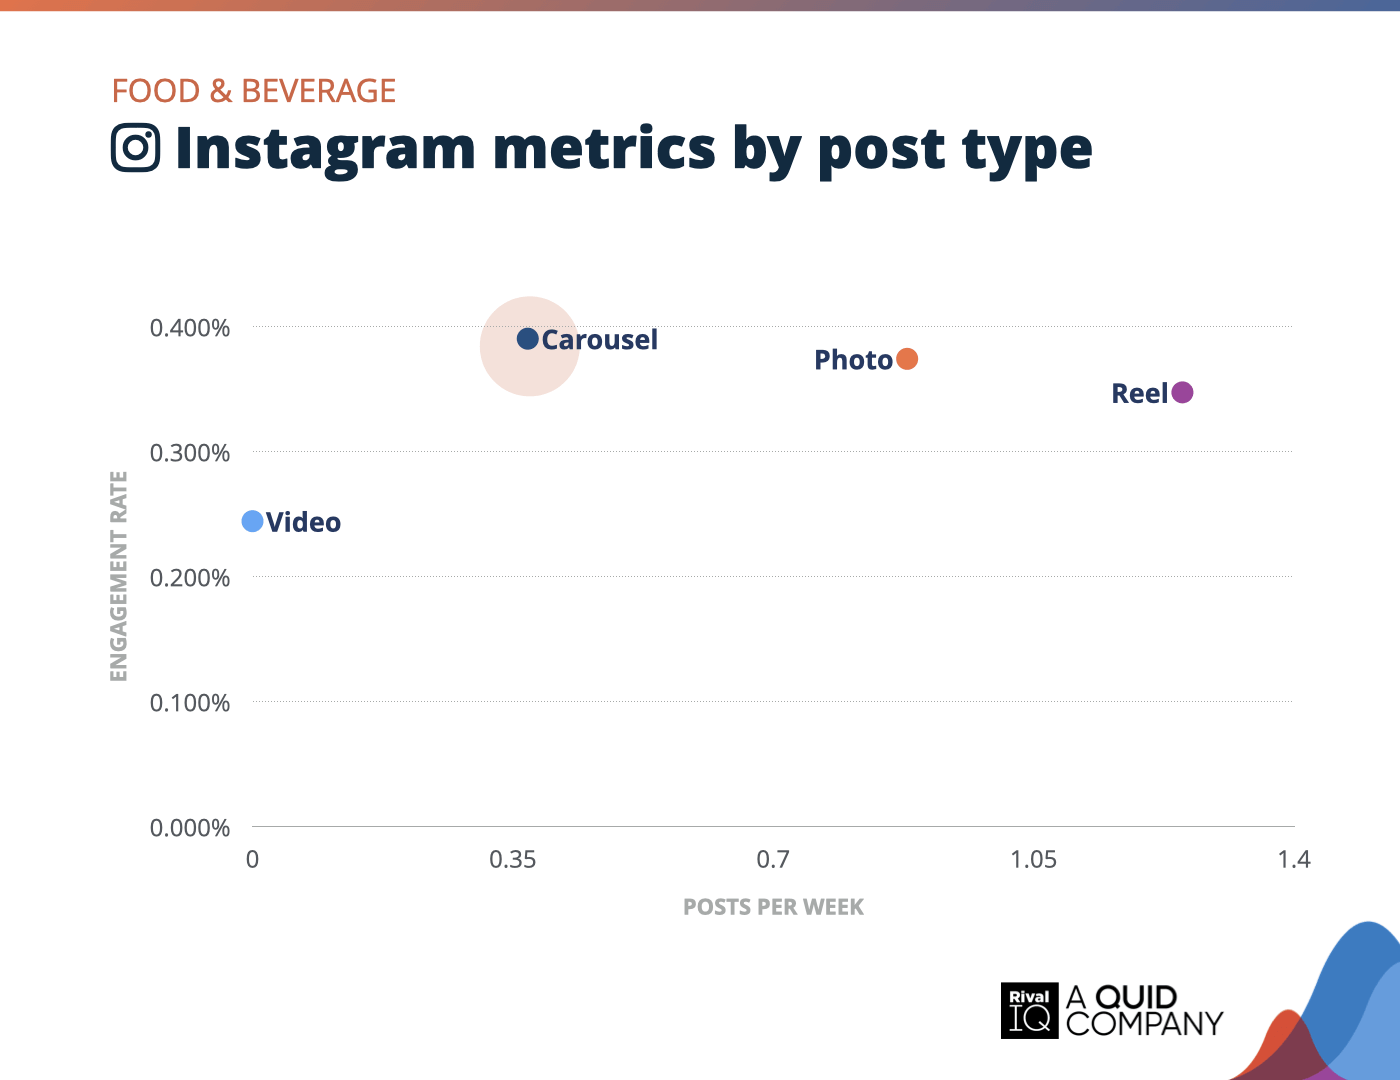
Instagram posts per week and engagement rate by post type, Food & Beverage
Food & Beverage brands cooked up success with Reels this year, shifting focus from traditional videos to short-form content that delivered strong engagement. But it was carousels that stole the spotlight, leading engagement rates despite being posted less frequently.
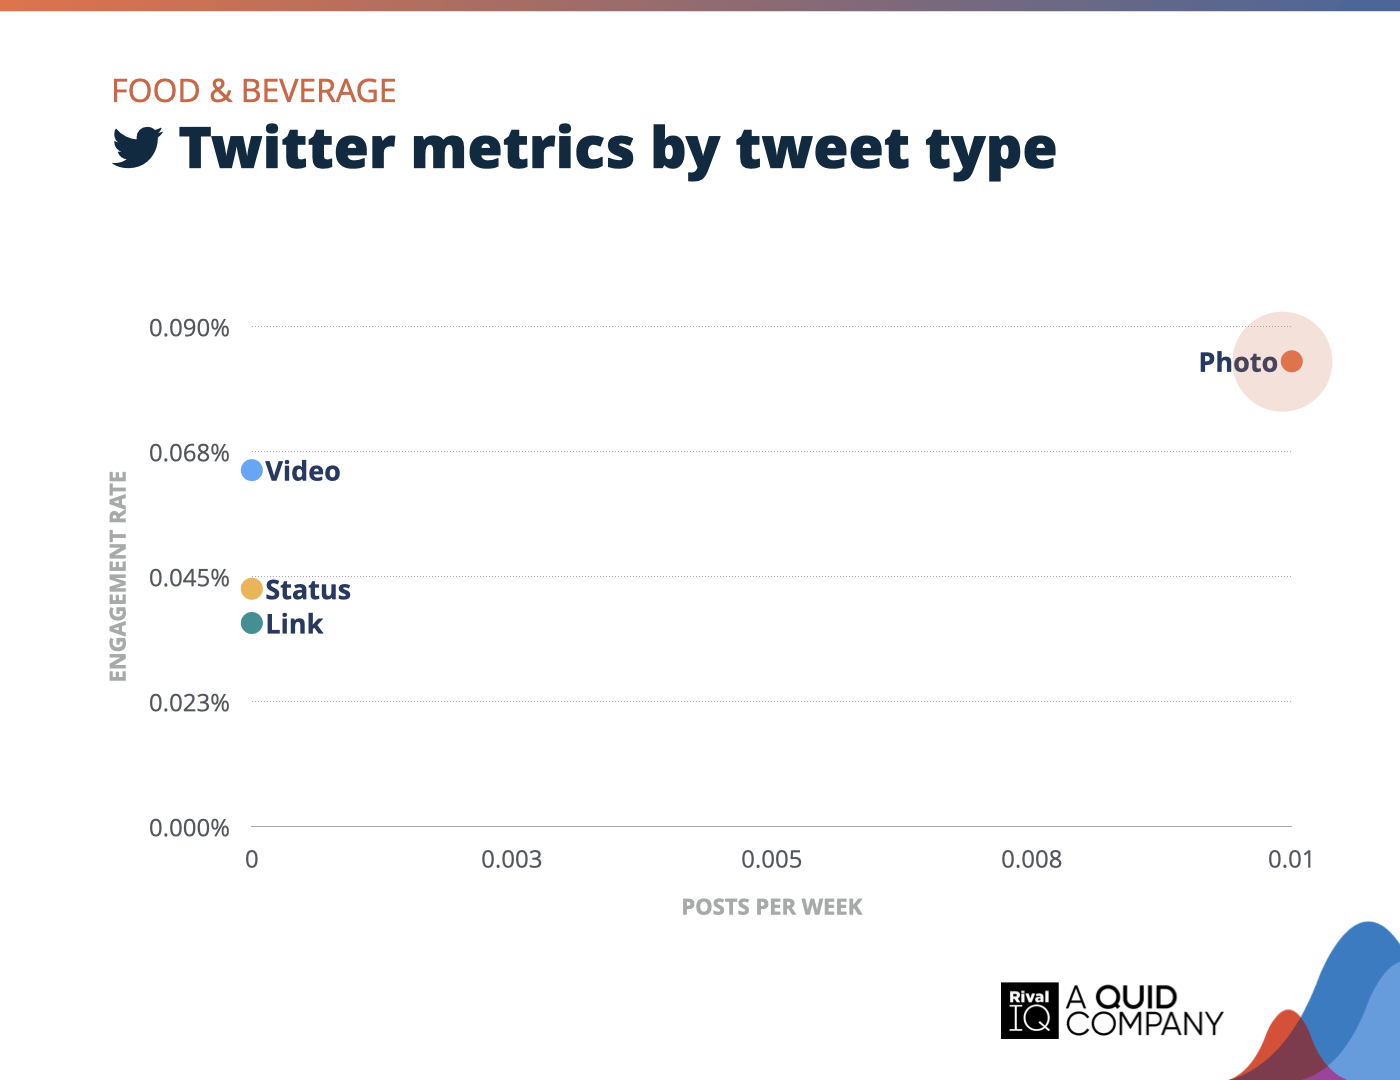
Twitter posts per week and engagement rate by tweet type, Food & Beverage
Photo tweets served up the highest engagement for Food & Beverage brands on Twitter this year.
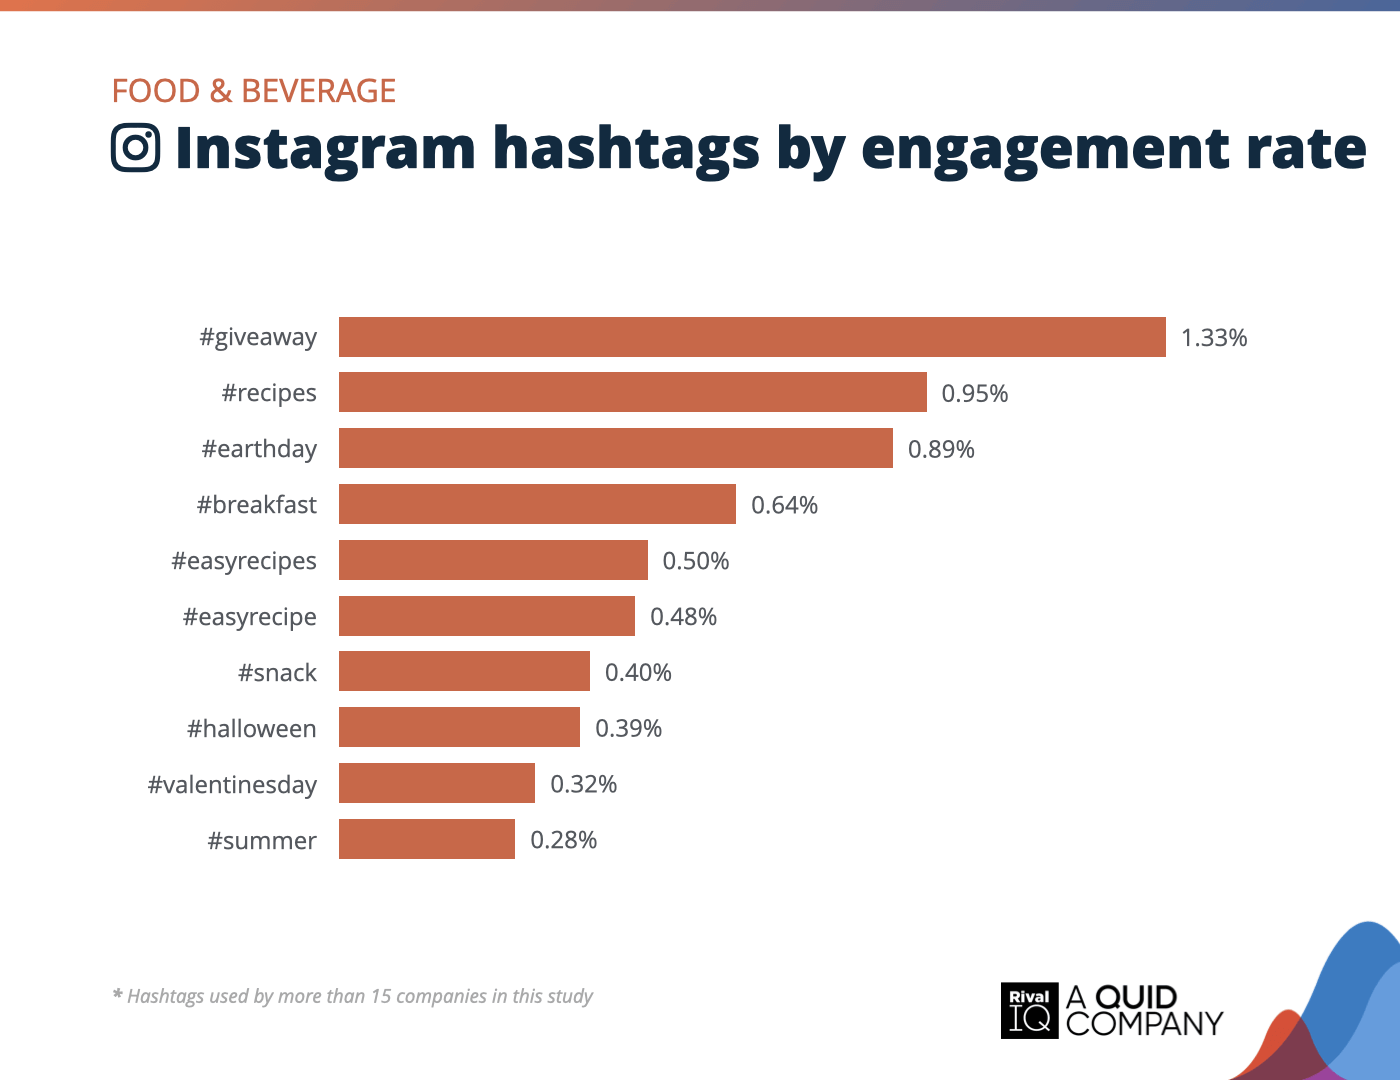
Top Instagram hashtags by engagement rate, Food & Beverage
Food & Beverage brands spiced up Instagram with hashtags like #giveaway and #recipes, driving the highest engagement rates.
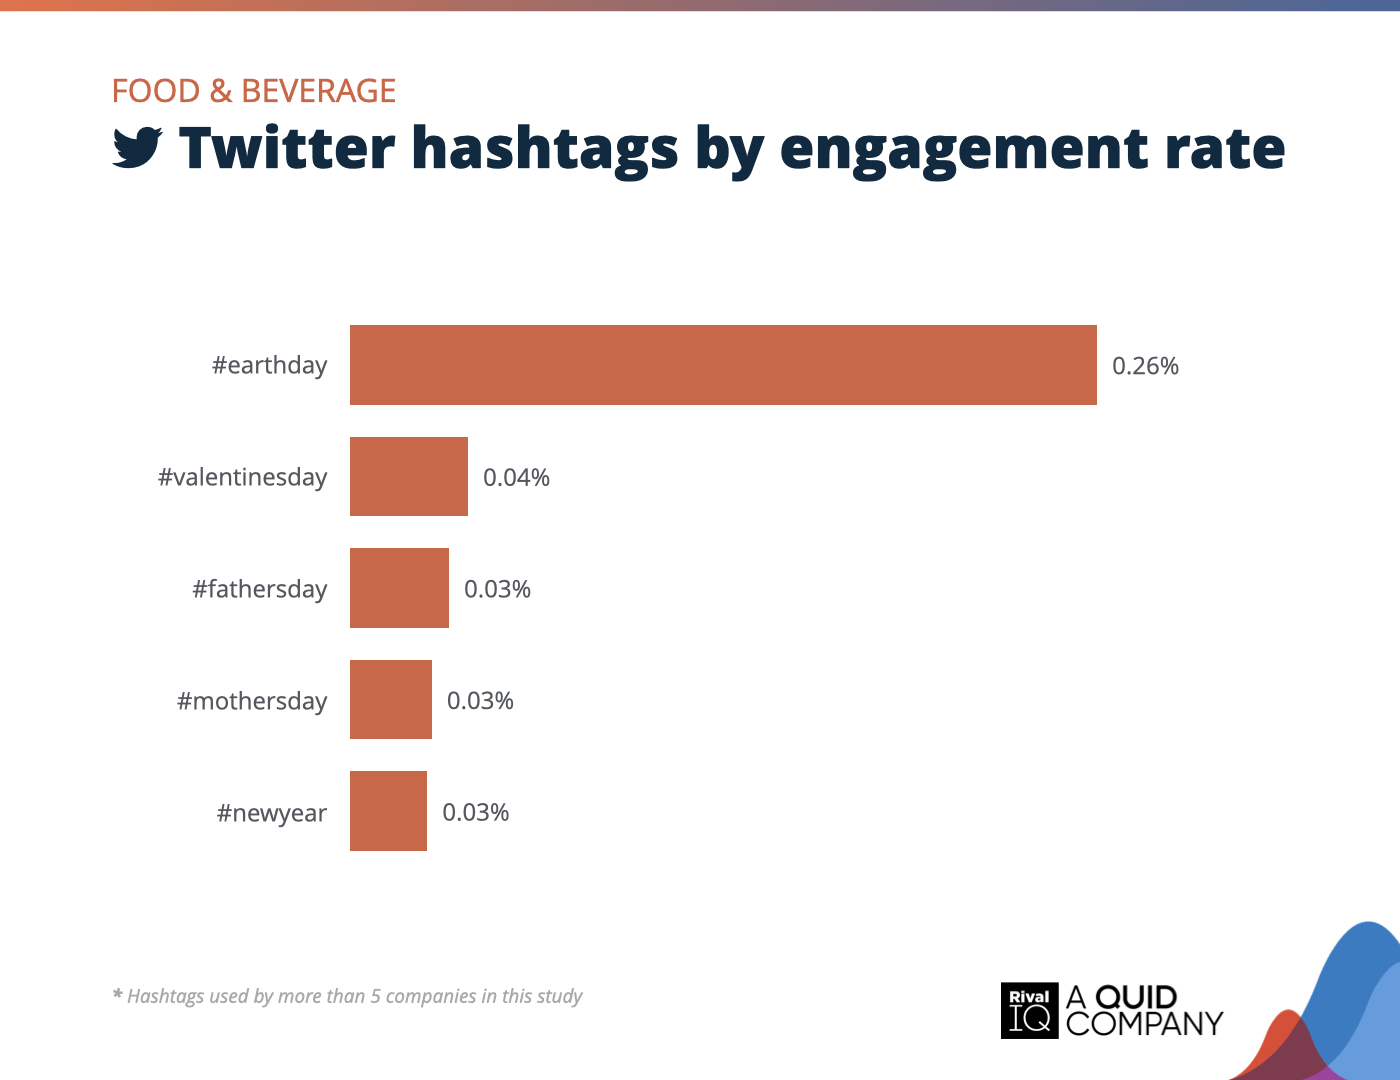
Top Twitter hashtags by engagement rate, Food & Beverage
Holiday-themed hashtags served up solid engagement for Food & Beverage brands on Twitter this year.
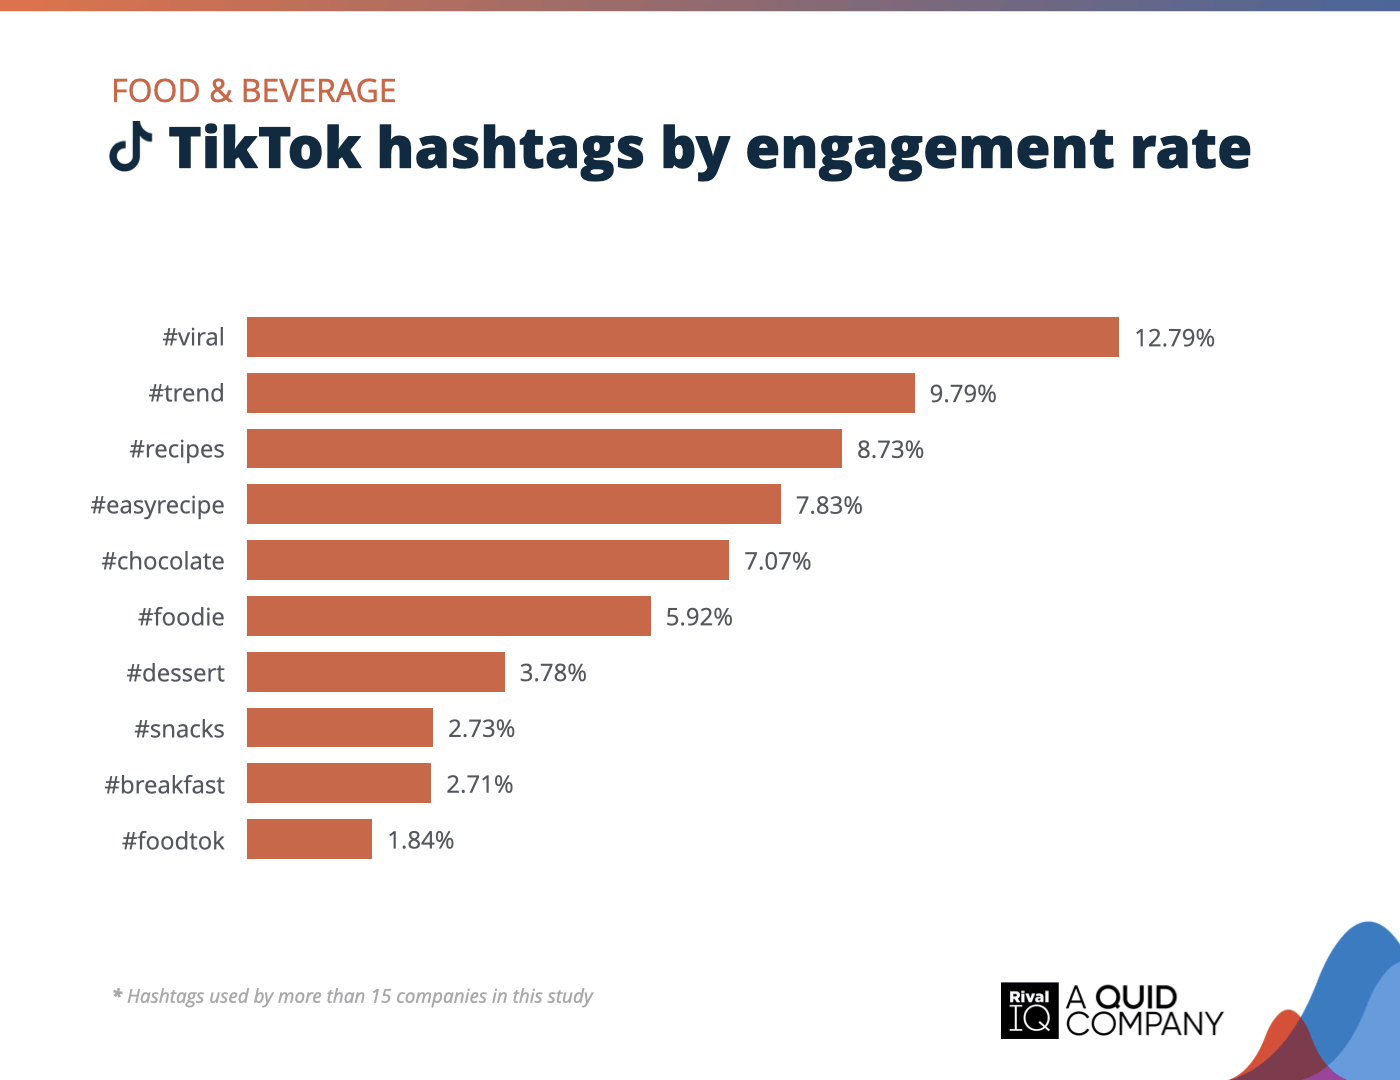
Top TikTok hashtags by engagement rate, Food & Beverage
Food & Beverage brands blended trend-driven hashtags into their TikTok strategy to cook up stronger engagement.
Health & Beauty Social Media Benchmarks
Health & Beauty brands struggled to engage fans and followers compared to their fellow industries, earning the lowest engagement rates far below the all-industry median across all four channels thanks in part to a saturated market.
A few growth ideas:
- Continue favoring TikTok and Instagram while keeping efforts low on Twitter, which doesn’t have much engagement payoff in this industry.
- Keep engaging fans with product releases and the next big trend in beauty.
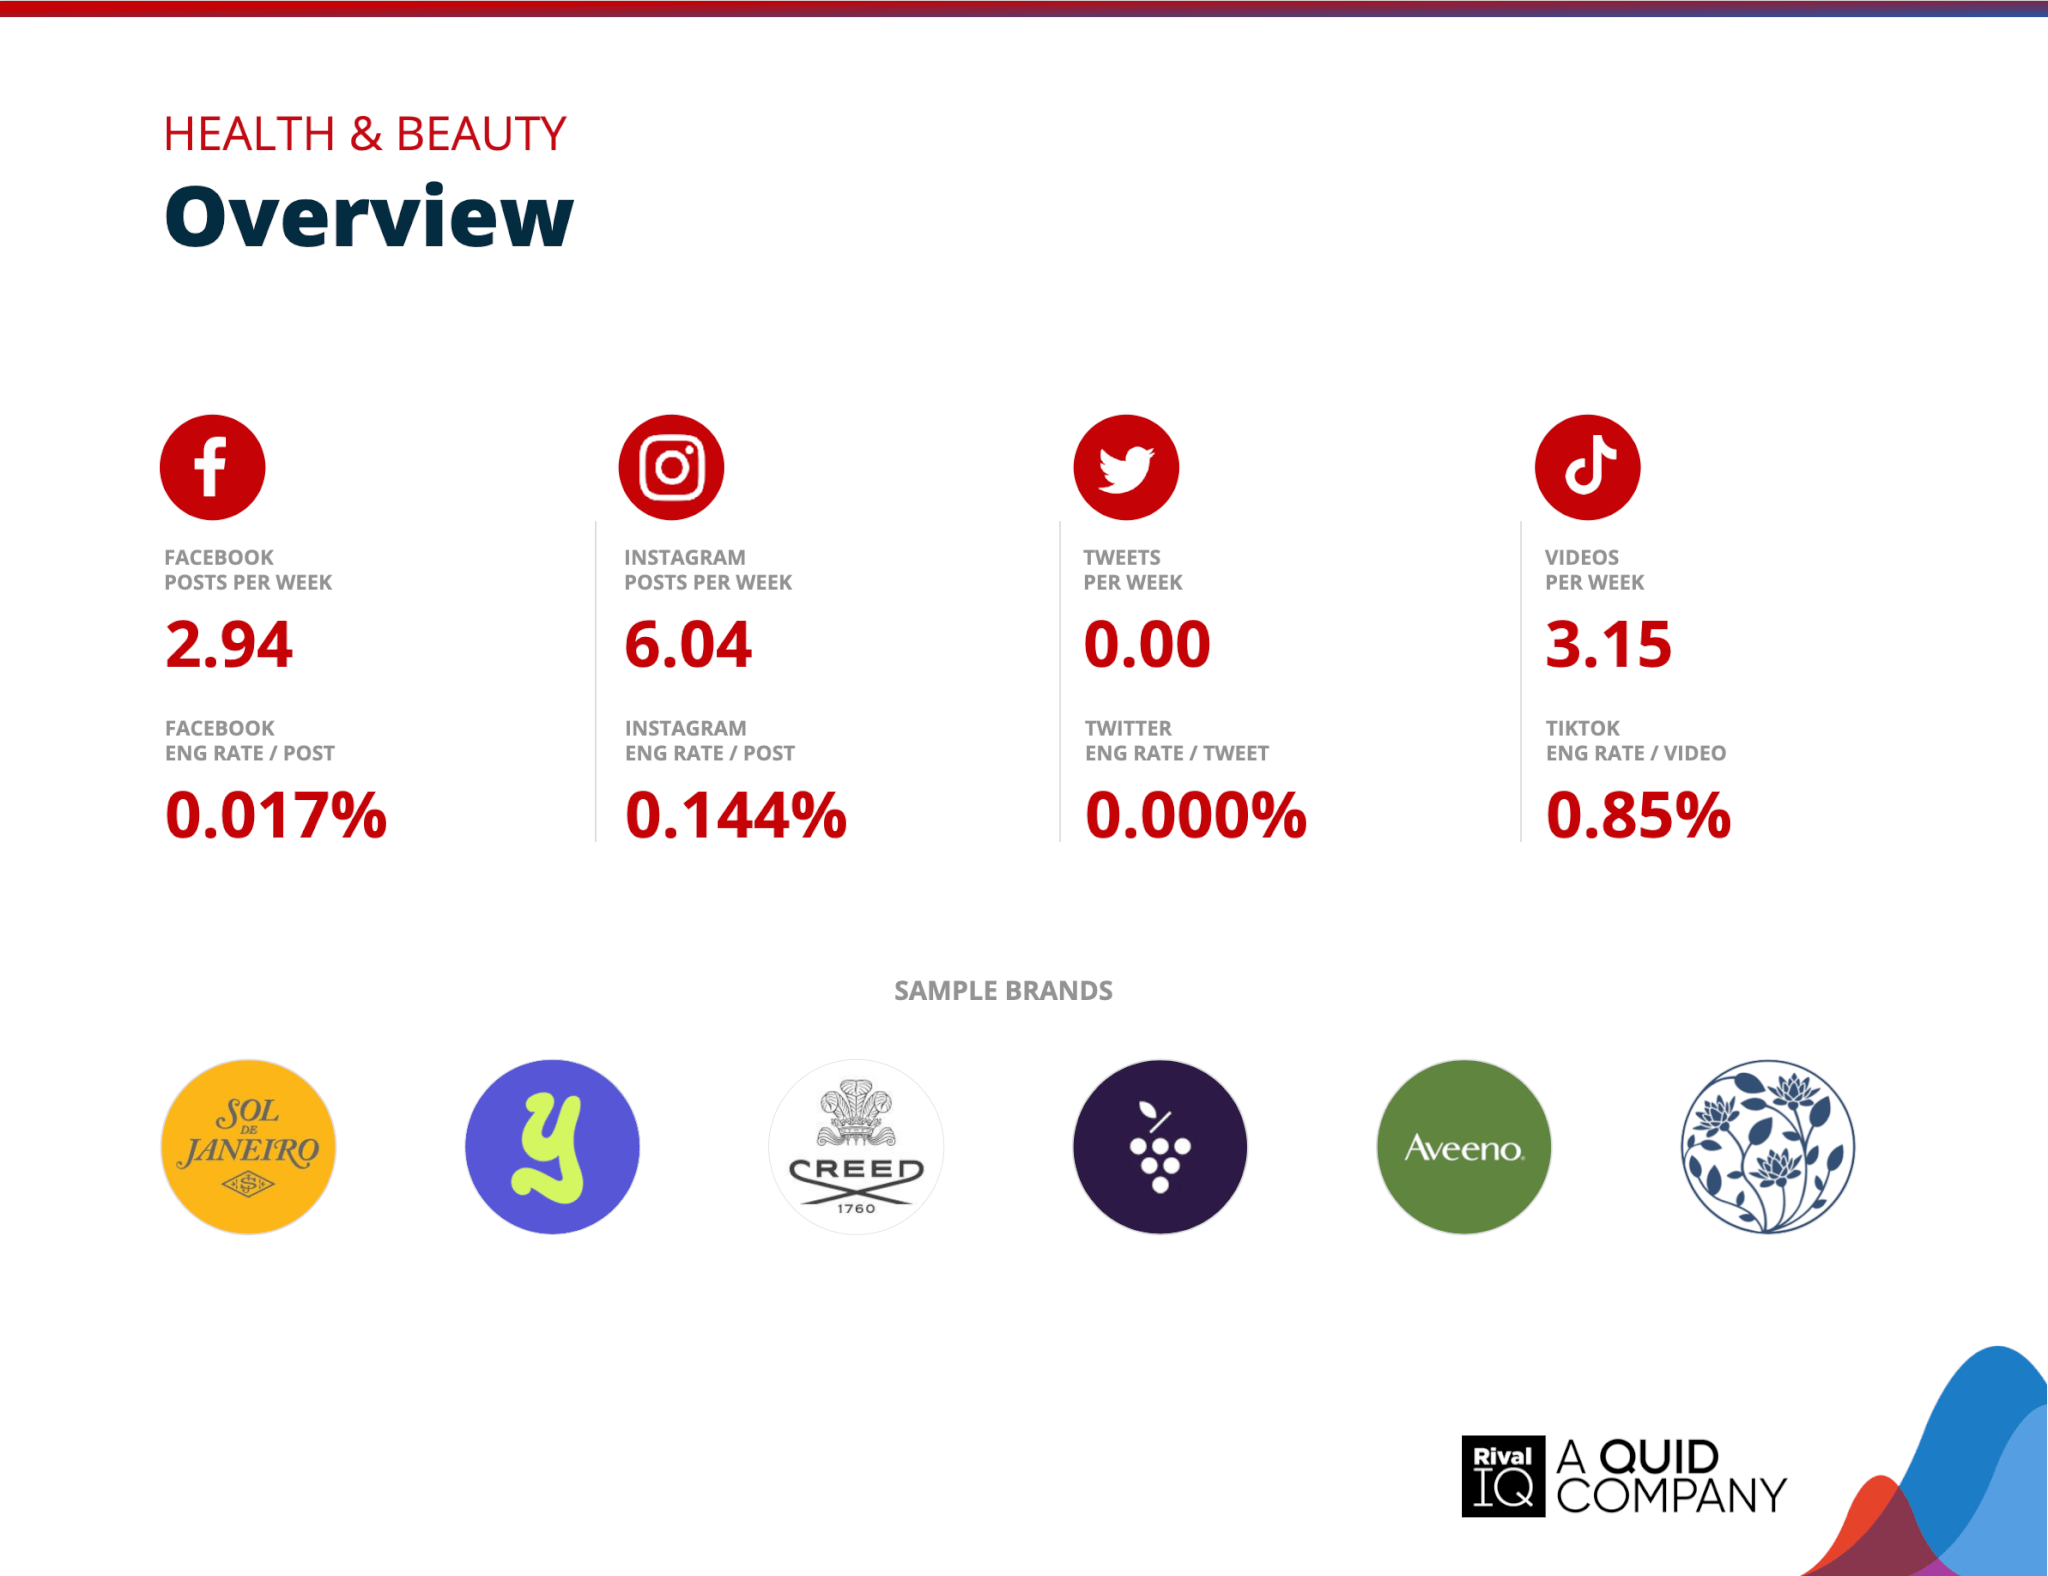
Overview of all benchmarks, Health & Beauty
Notable brands in this year’s report include Aveeno, Caudalíe, Creed Fragrance, Ranavat, Sol de Janeiro, and Youthforia.
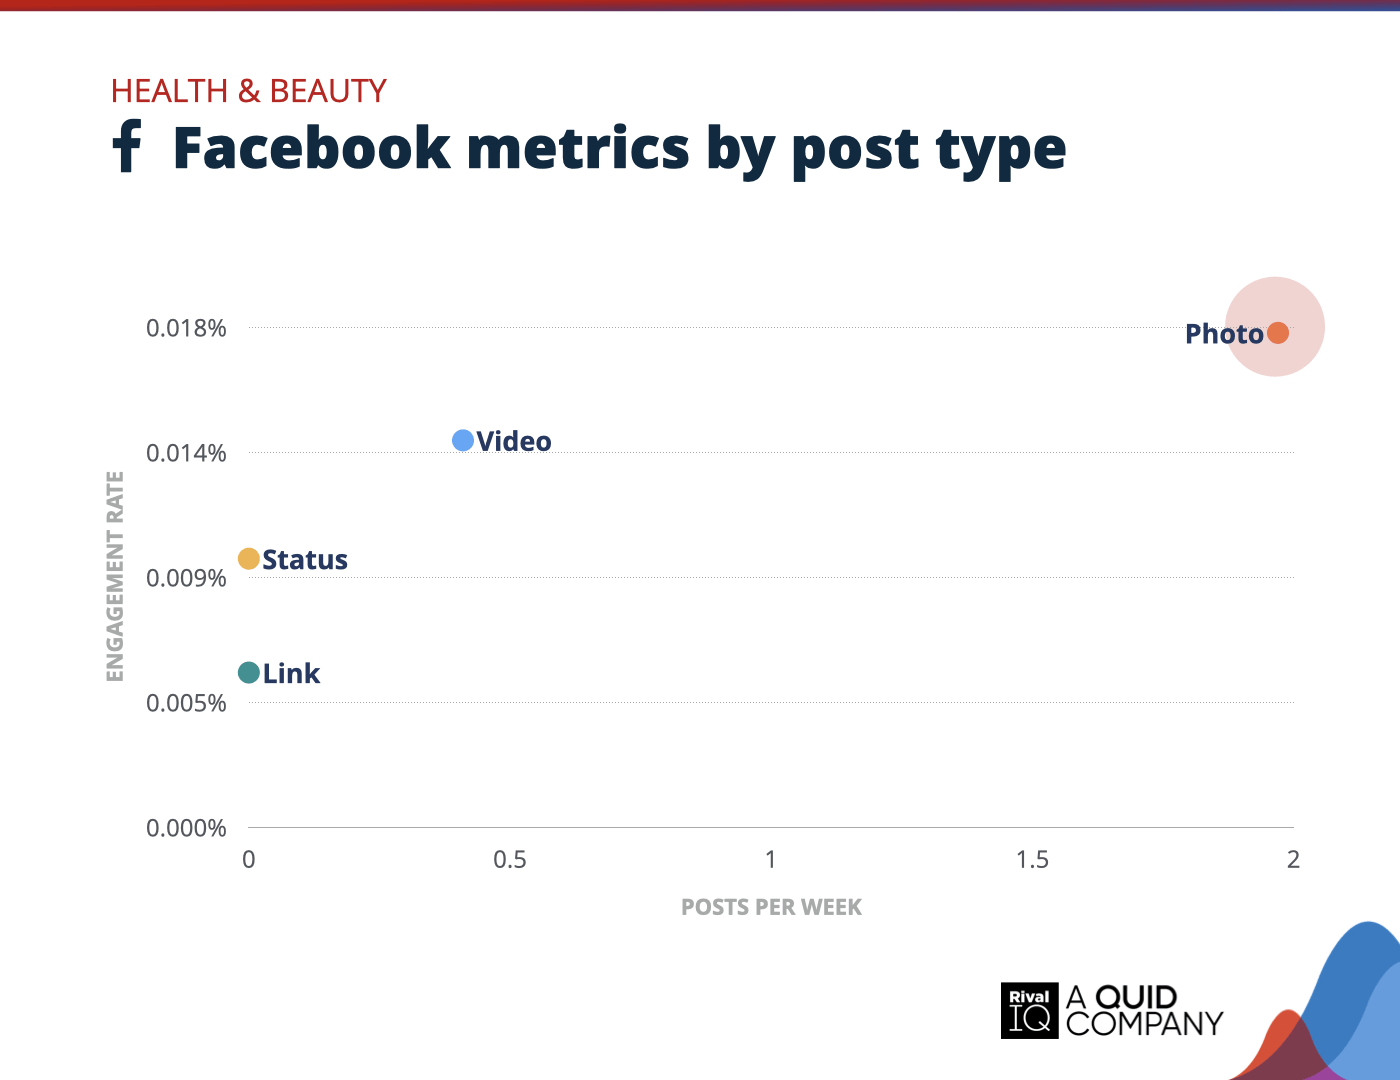
Facebook posts per week and engagement rate by post type, Health & Beauty
Photos took the lead for Health & Beauty brands on Facebook this year, pulling in the highest engagement rates by far. While videos performed decently, links and status updates lagged behind, proving that vibrant visuals are still the key to capturing attention.
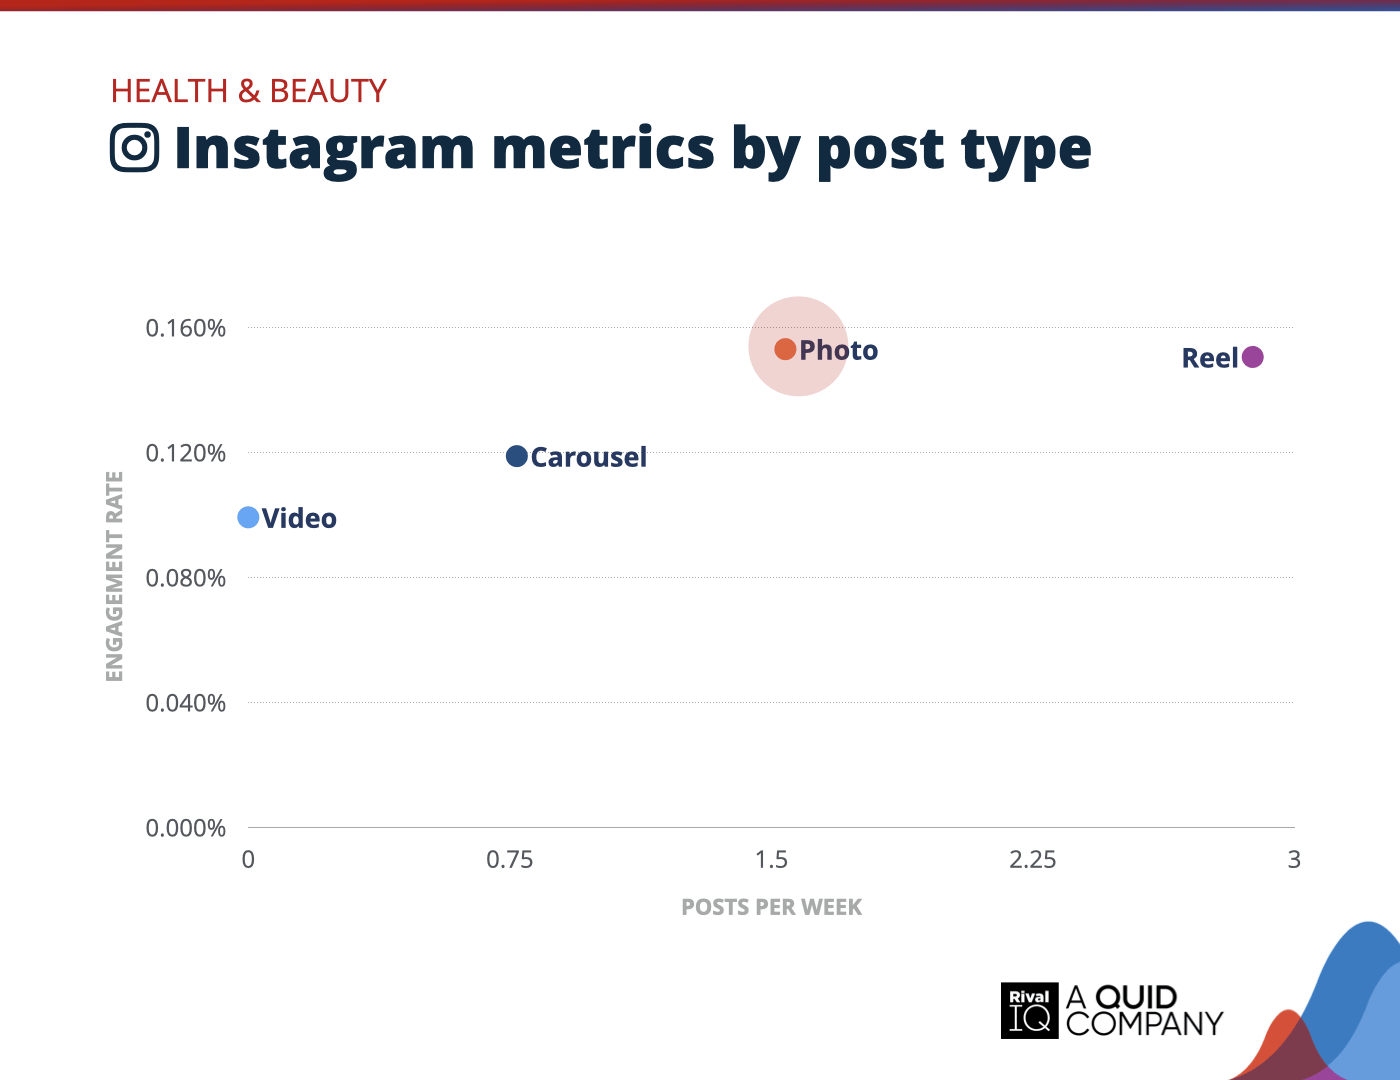
Instagram posts per week and engagement rate by post type, Health & Beauty
Photos stole the spotlight for Health & Beauty brands this year, earning the highest engagement rates. But Reels weren’t far behind—and brands posted nearly twice as many Reels as photos.
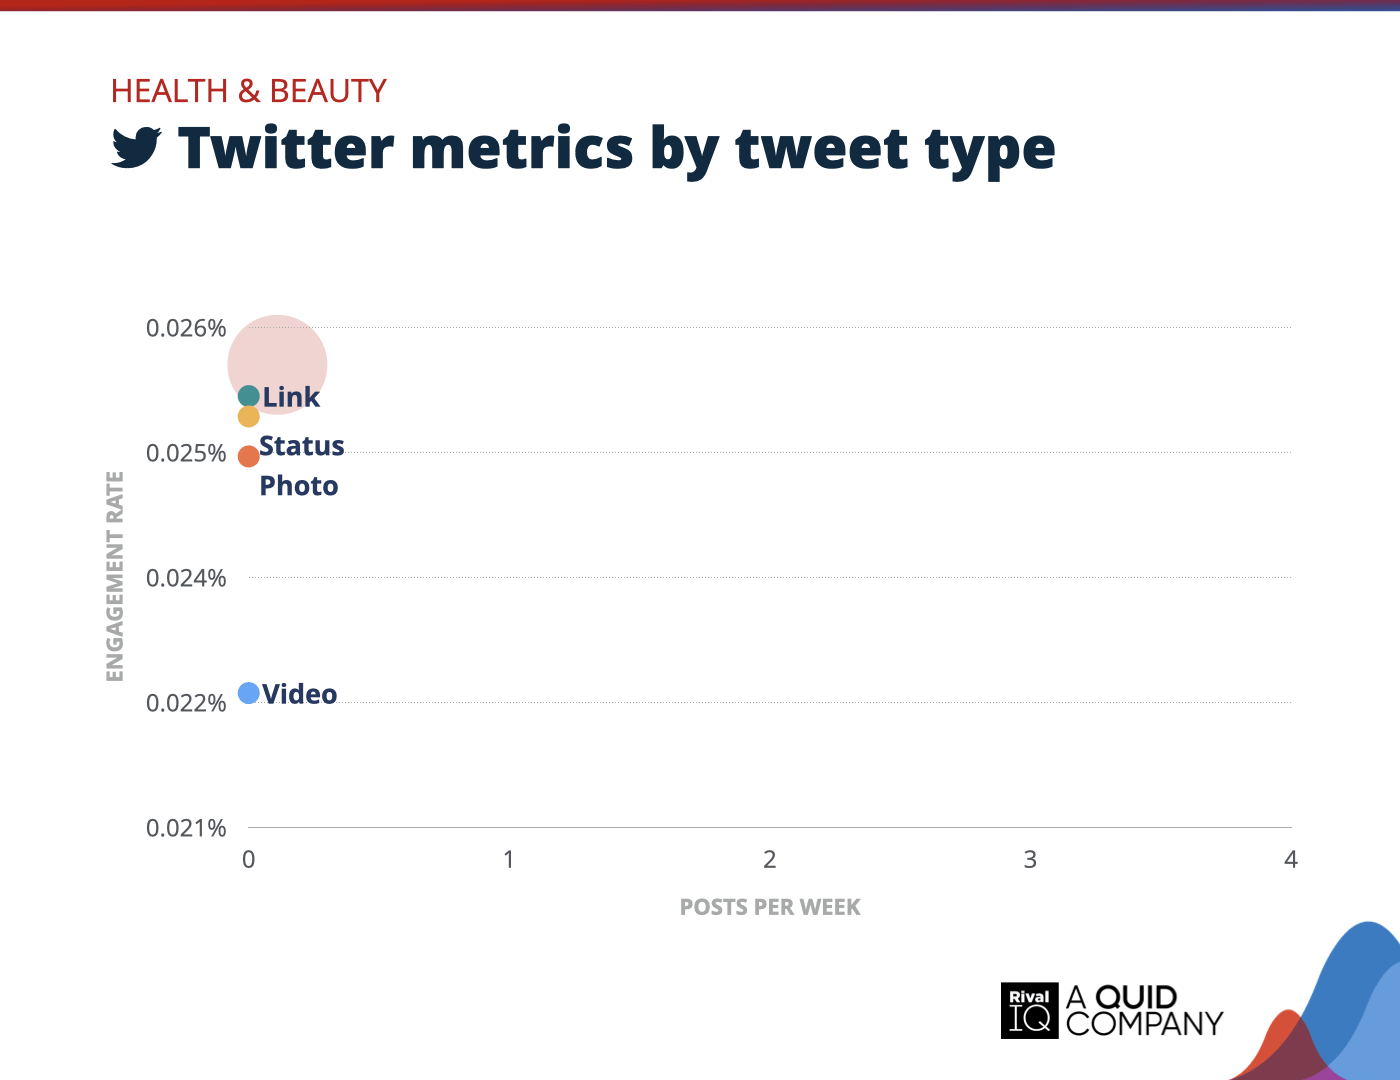
Twitter posts per week and engagement rate by tweet type, Health & Beauty
Health & Beauty brands tweeted less than ever this year, leaning slightly more on links and status updates, which edged out photos and videos in engagement rates.
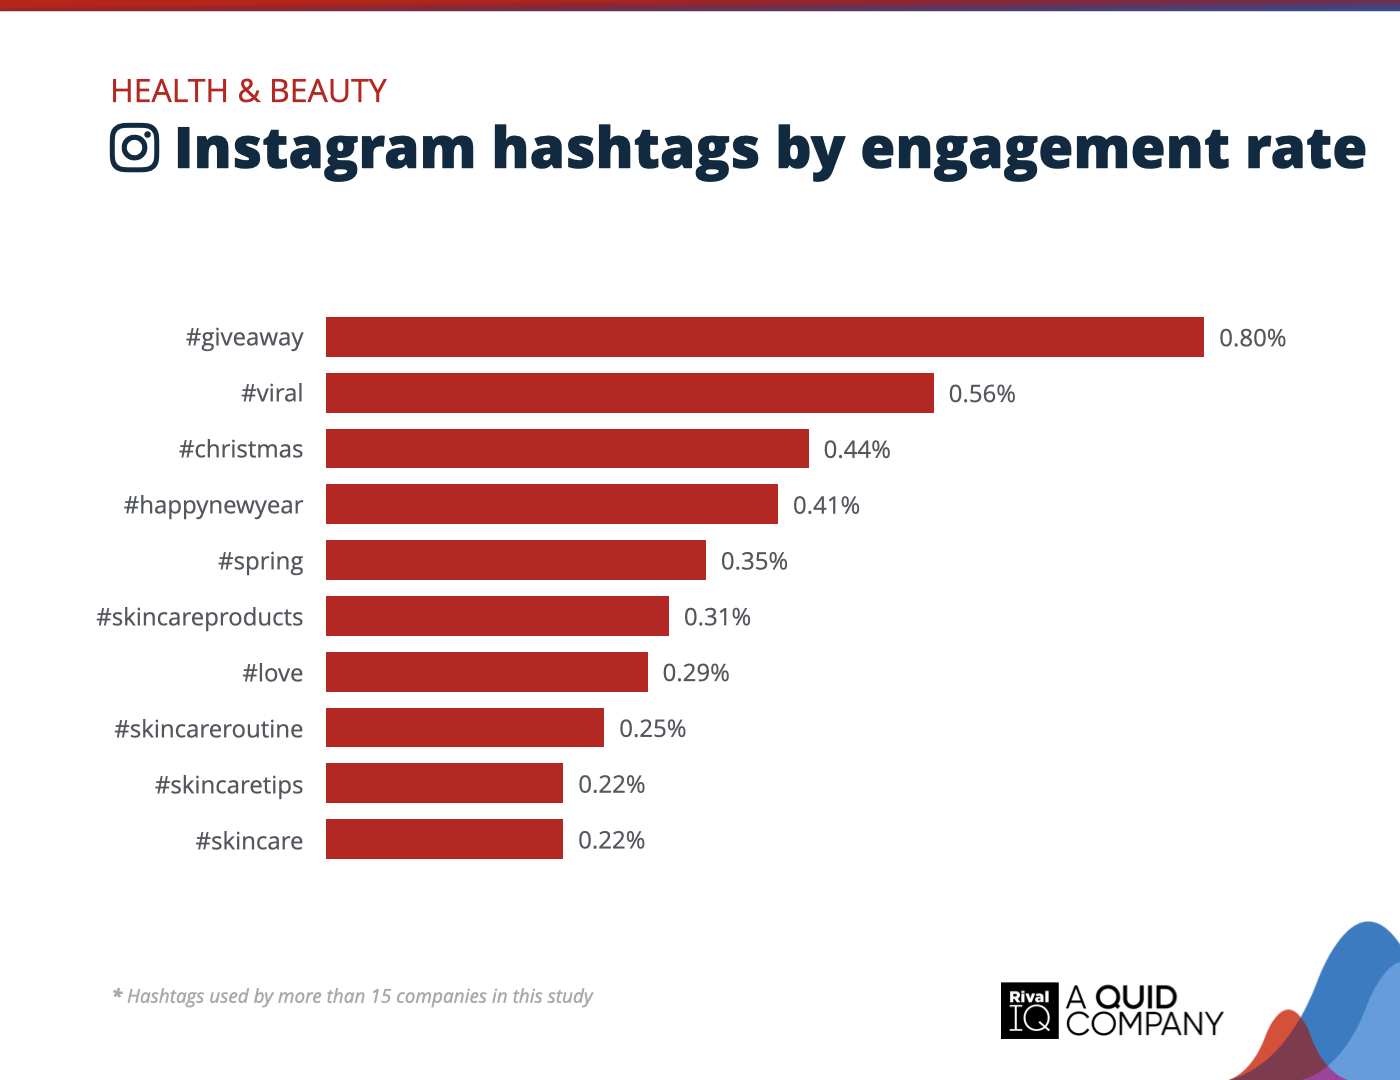
Top Instagram hashtags by engagement rate, Health & Beauty
Giveaways and festive vibes ruled for Health & Beauty brands on Instagram this year, with hashtags like #giveaway, #christmas, and #happynewyear leading the charge.
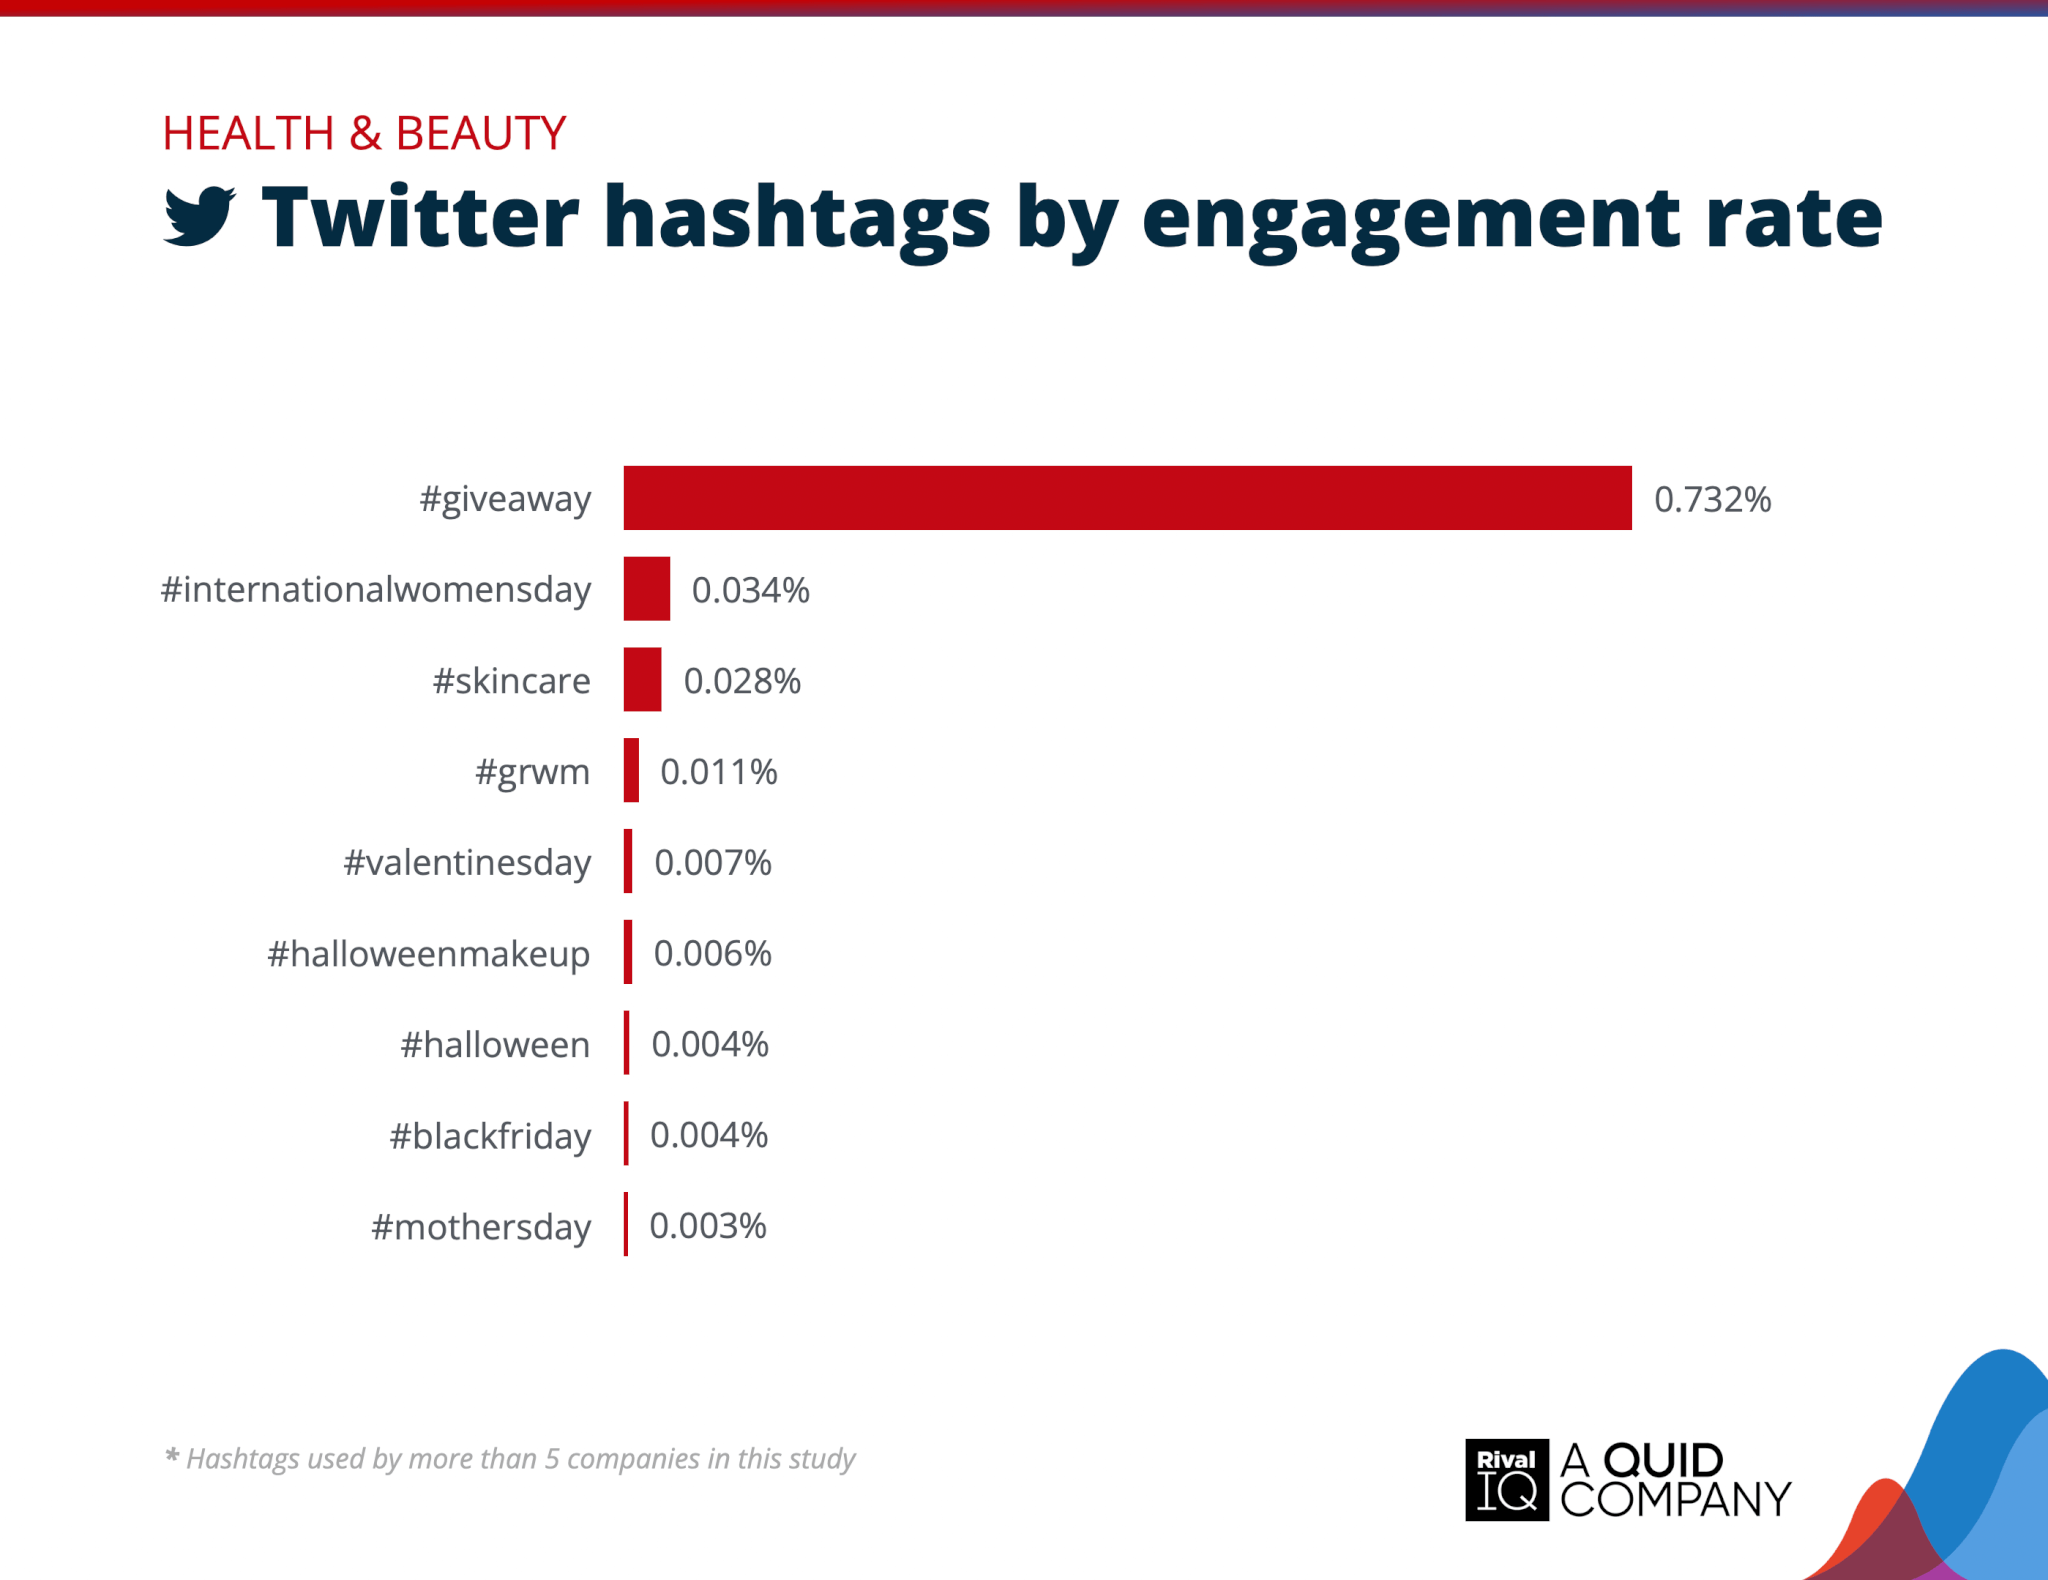
Top Twitter hashtags by engagement rate, Health & Beauty
Giveaways were the clear winners for Health & Beauty brands on Twitter this year, earning significantly more engagement than any other hashtag.
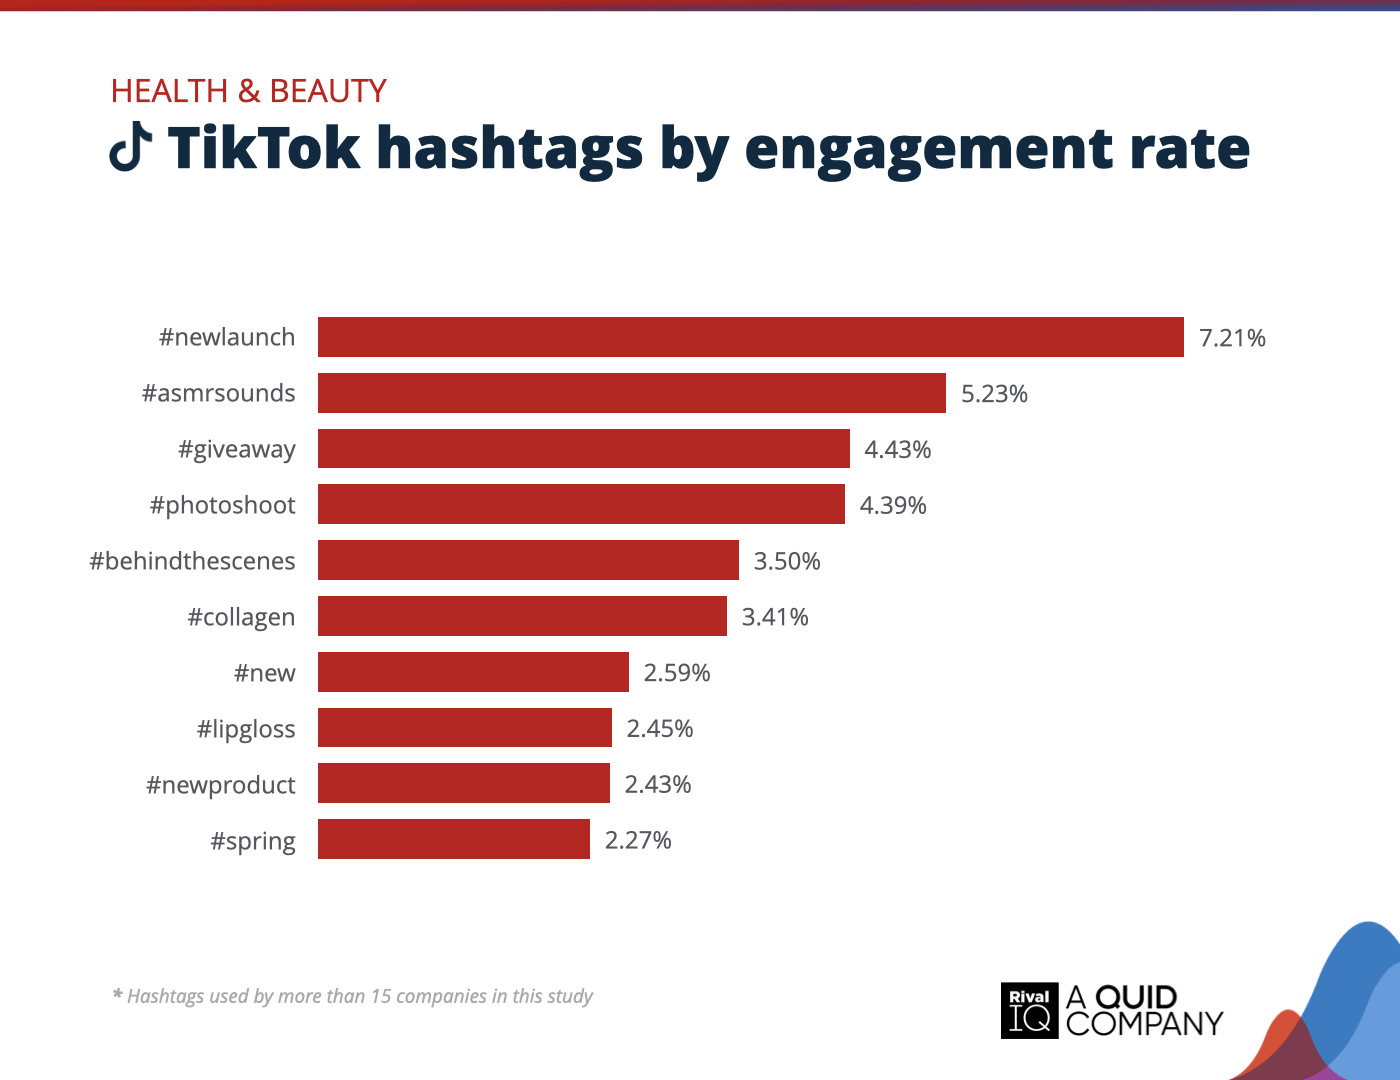
Top TikTok hashtags by engagement rate, Health & Beauty
Product launches stole the show for Health & Beauty brands on TikTok this year, with hashtags like #newlaunch and #newproduct driving top engagement.
Higher Ed Social Media Benchmarks
Colleges and universities saw massive engagement rate boosts, especially on Instagram and TikTok, where they more than quadrupled the median.
For even higher Higher Ed engagement rates:
- Photos and Carousels continue to drive strong engagement, so don’t underestimate its impact alongside video.
- Leverage campus-focused hashtags like #openingweek and #moveinday to tap into student pride and involvement.
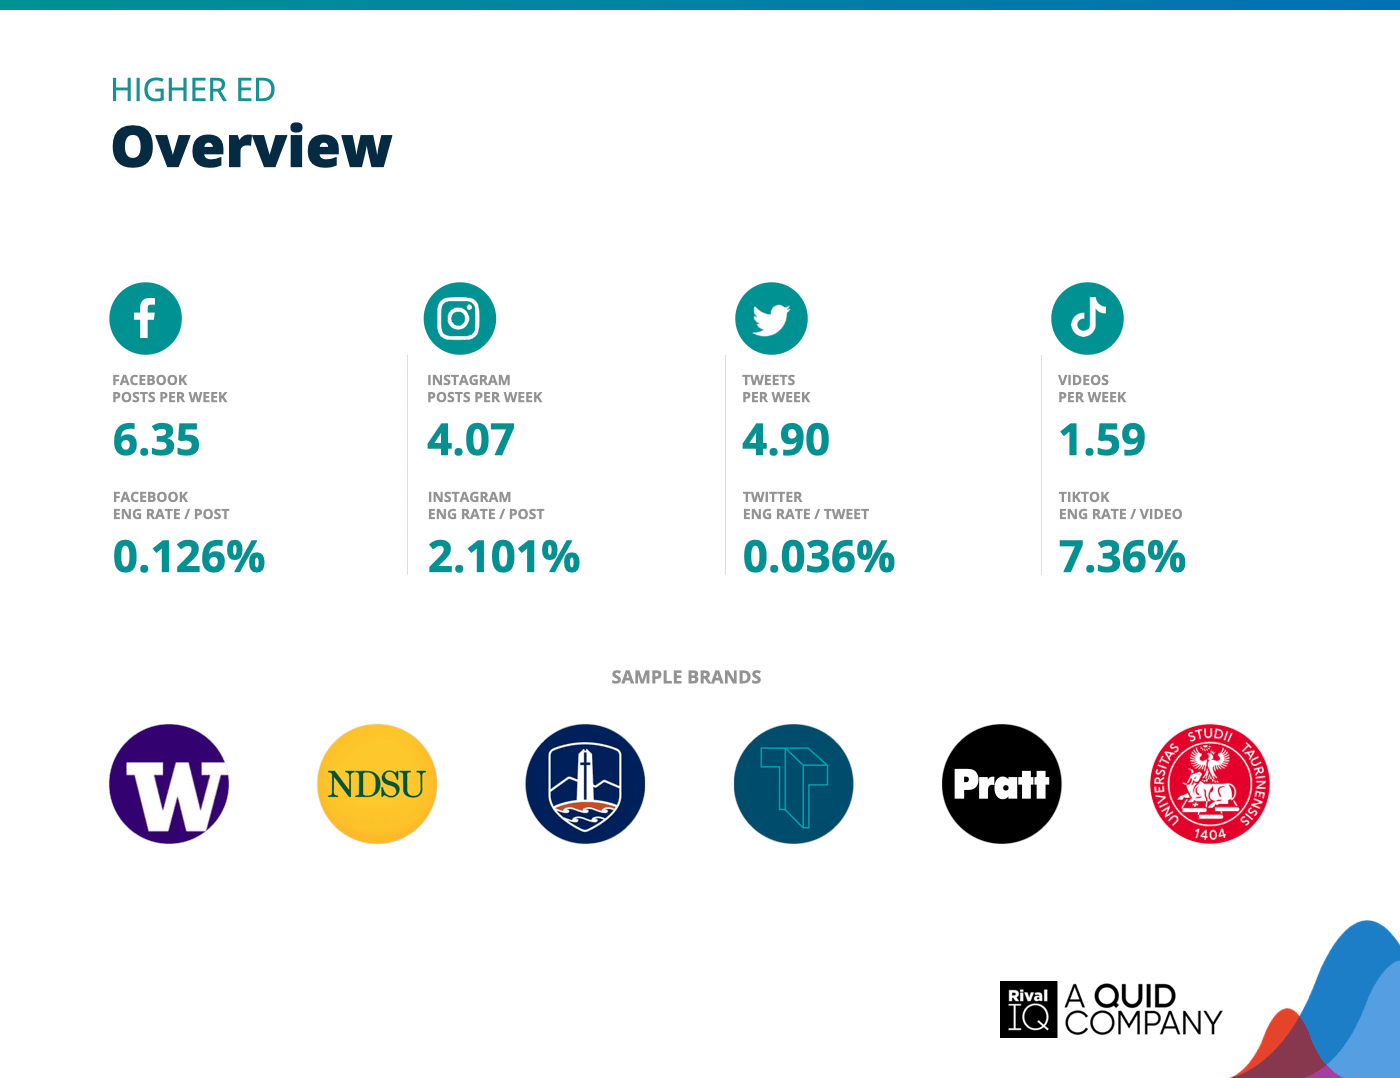
Overview of all benchmarks, Higher Ed
Notable brands in this year’s report include North Dakota State University, Pepperdine University, University of Turin, Technological University Dublin, Pratt Institute, and University of Washington.
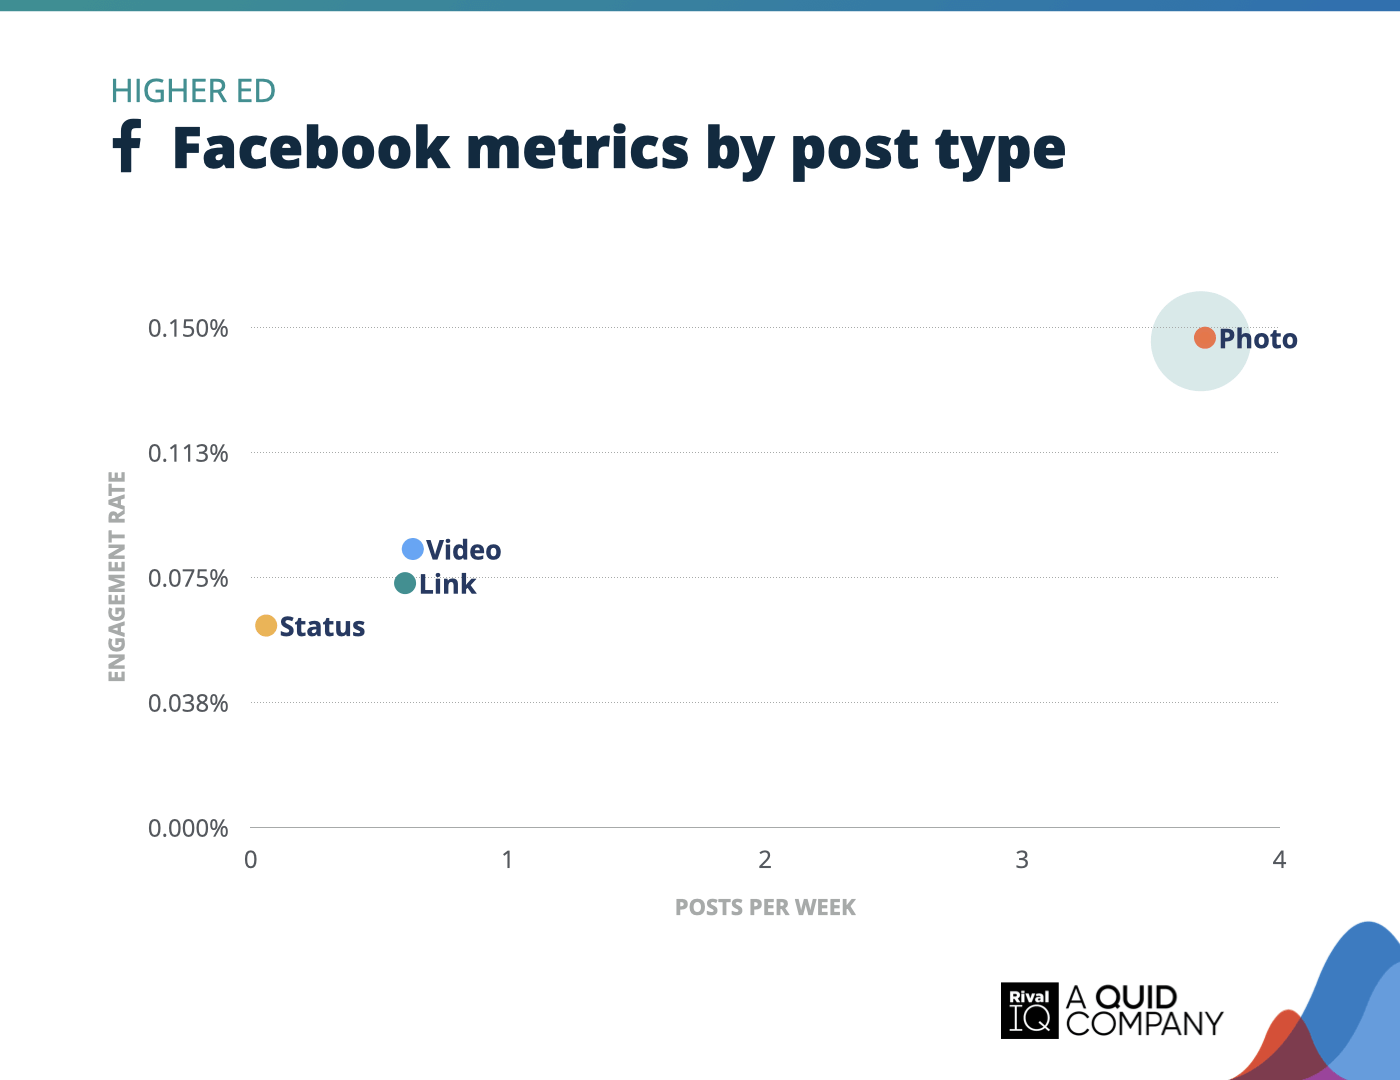
Facebook posts per week and engagement rate by post type, Higher Ed
Photo posts dominated the engagement charts for Higher Ed this year, with videos and links to content and campus news coming in a distant second.
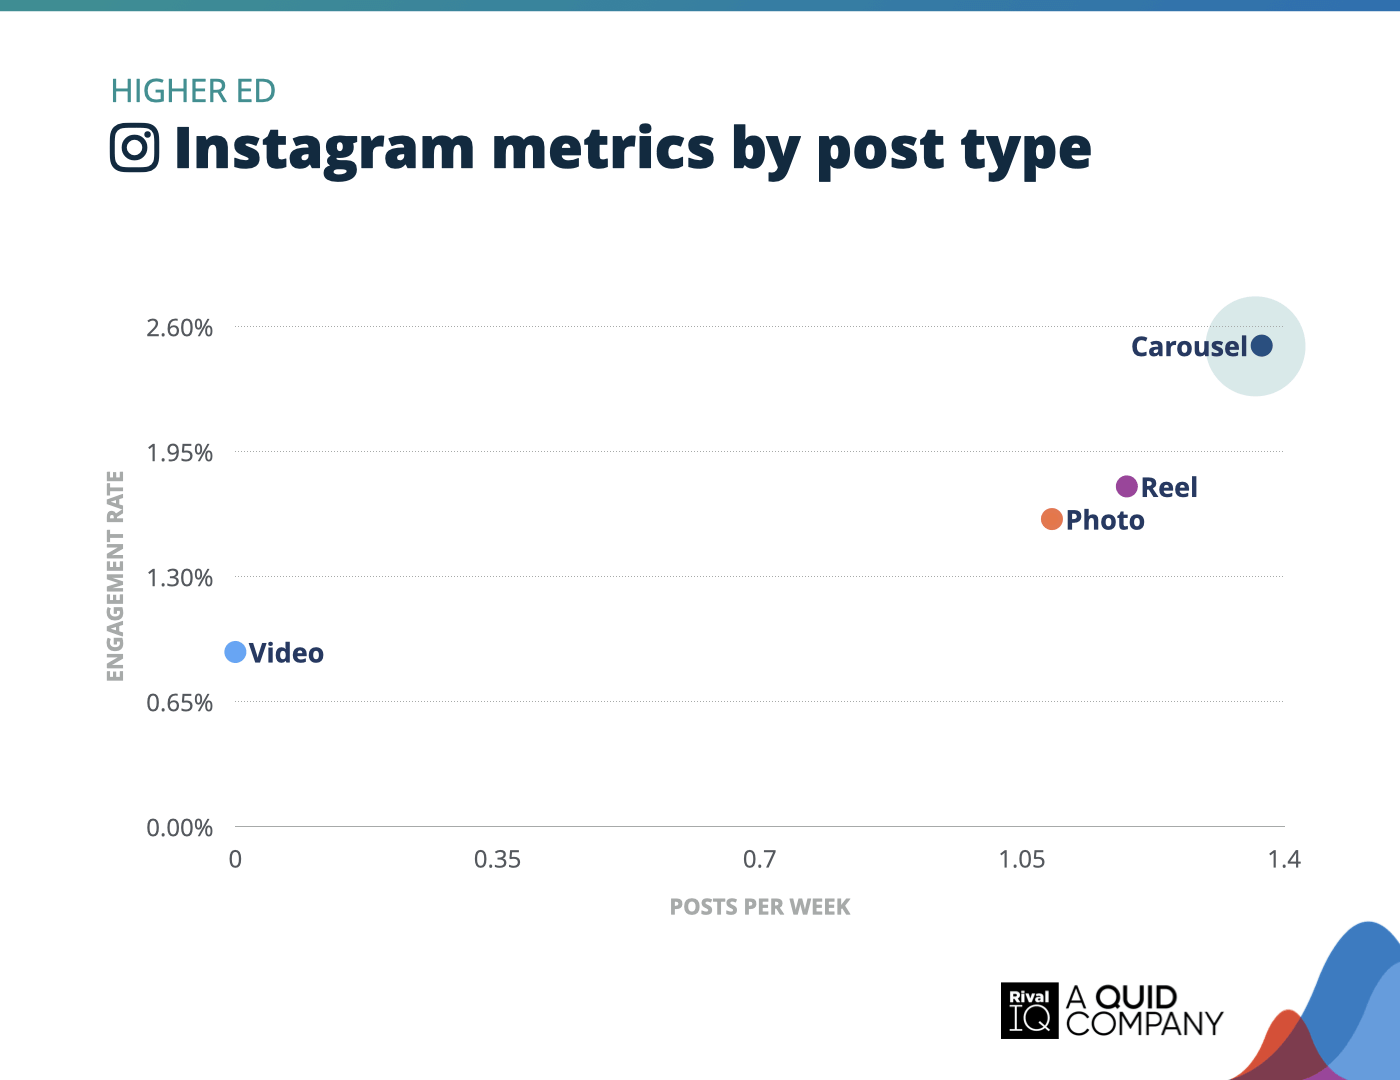
Instagram posts per week and engagement rate by post type, Higher Ed
Carousel posts soared for schools on Instagram this year, but Reels weren’t far behind as Higher Ed continued to reinvest energy normally spent on videos.
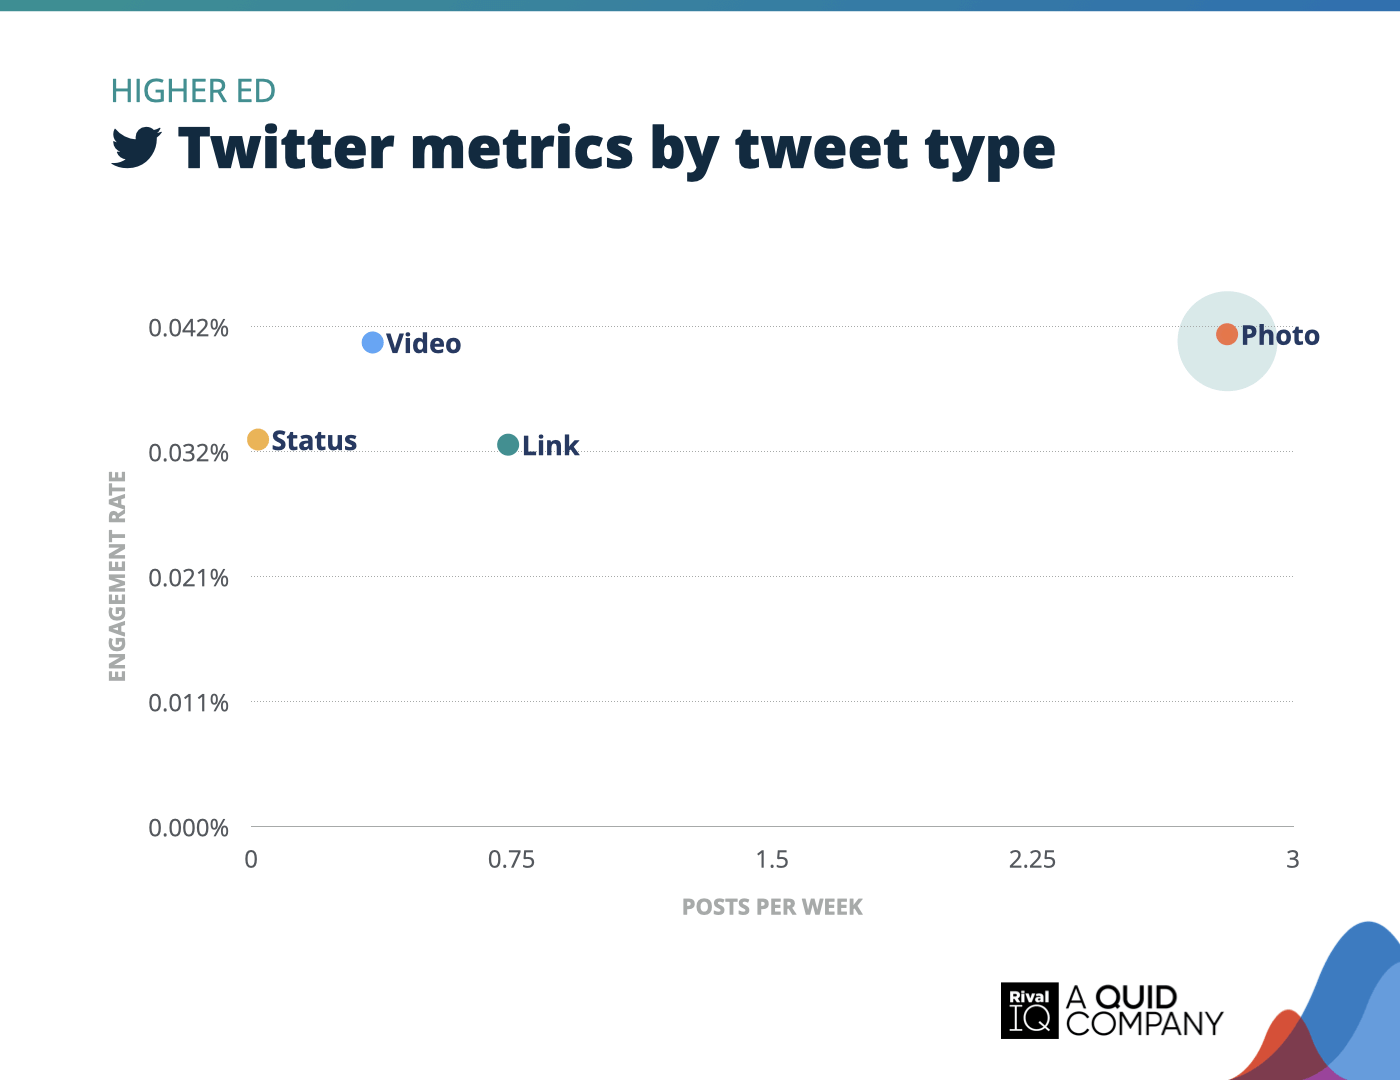
Twitter posts per week and engagement rate by tweet type, Higher Ed
Photos led the way for Higher Ed brands on Twitter this year, earning the highest engagement rates while being posted 3x more than any other tweet type.
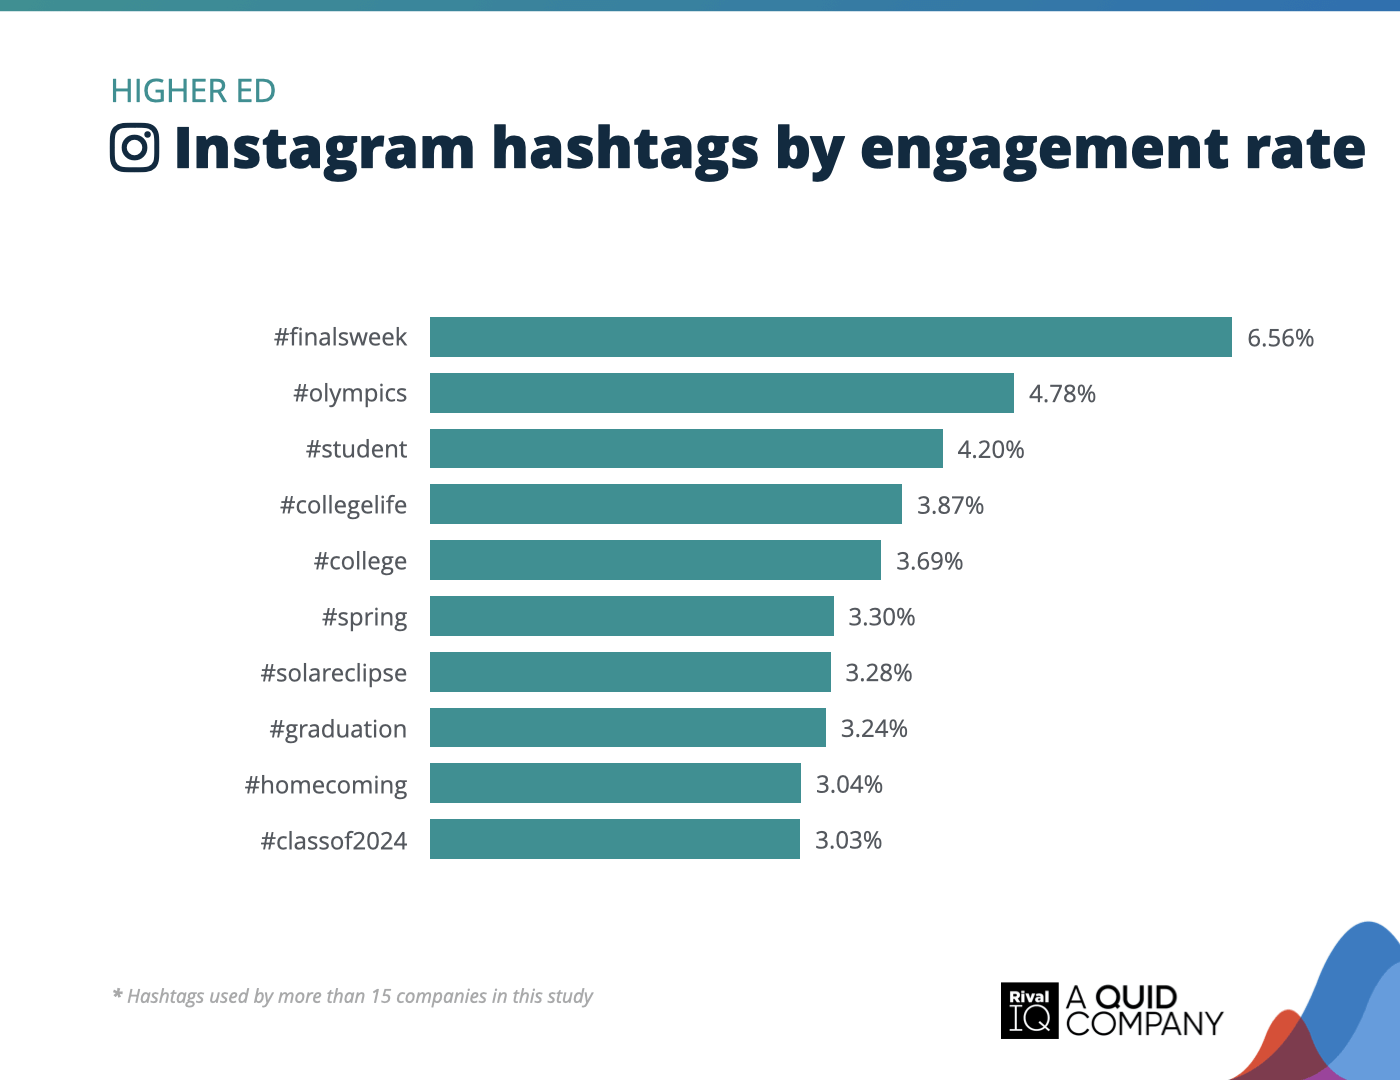
Top Instagram hashtags by engagement rate, Higher Ed
Campus life hashtags like #finalsweek, #collegelife, and #graduation struck a chord with Higher Ed audiences on Instagram this year, driving strong engagement.
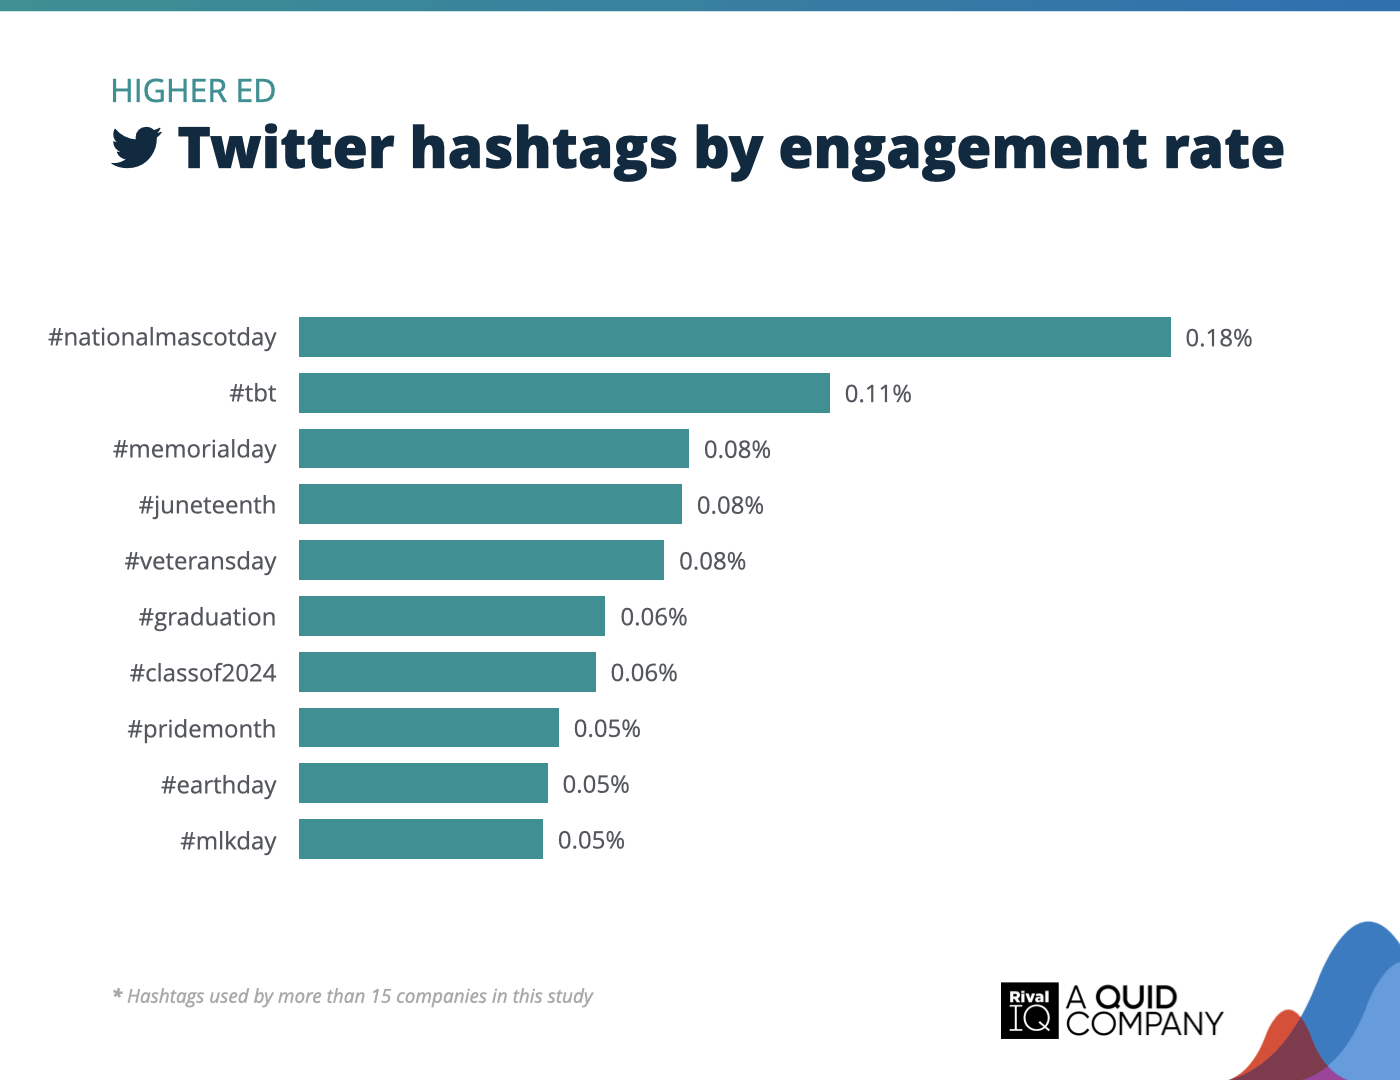
Top Twitter hashtags by engagement rate, Higher Ed
Colleges and universities were all about holiday-themed hashtags on Twitter this year.
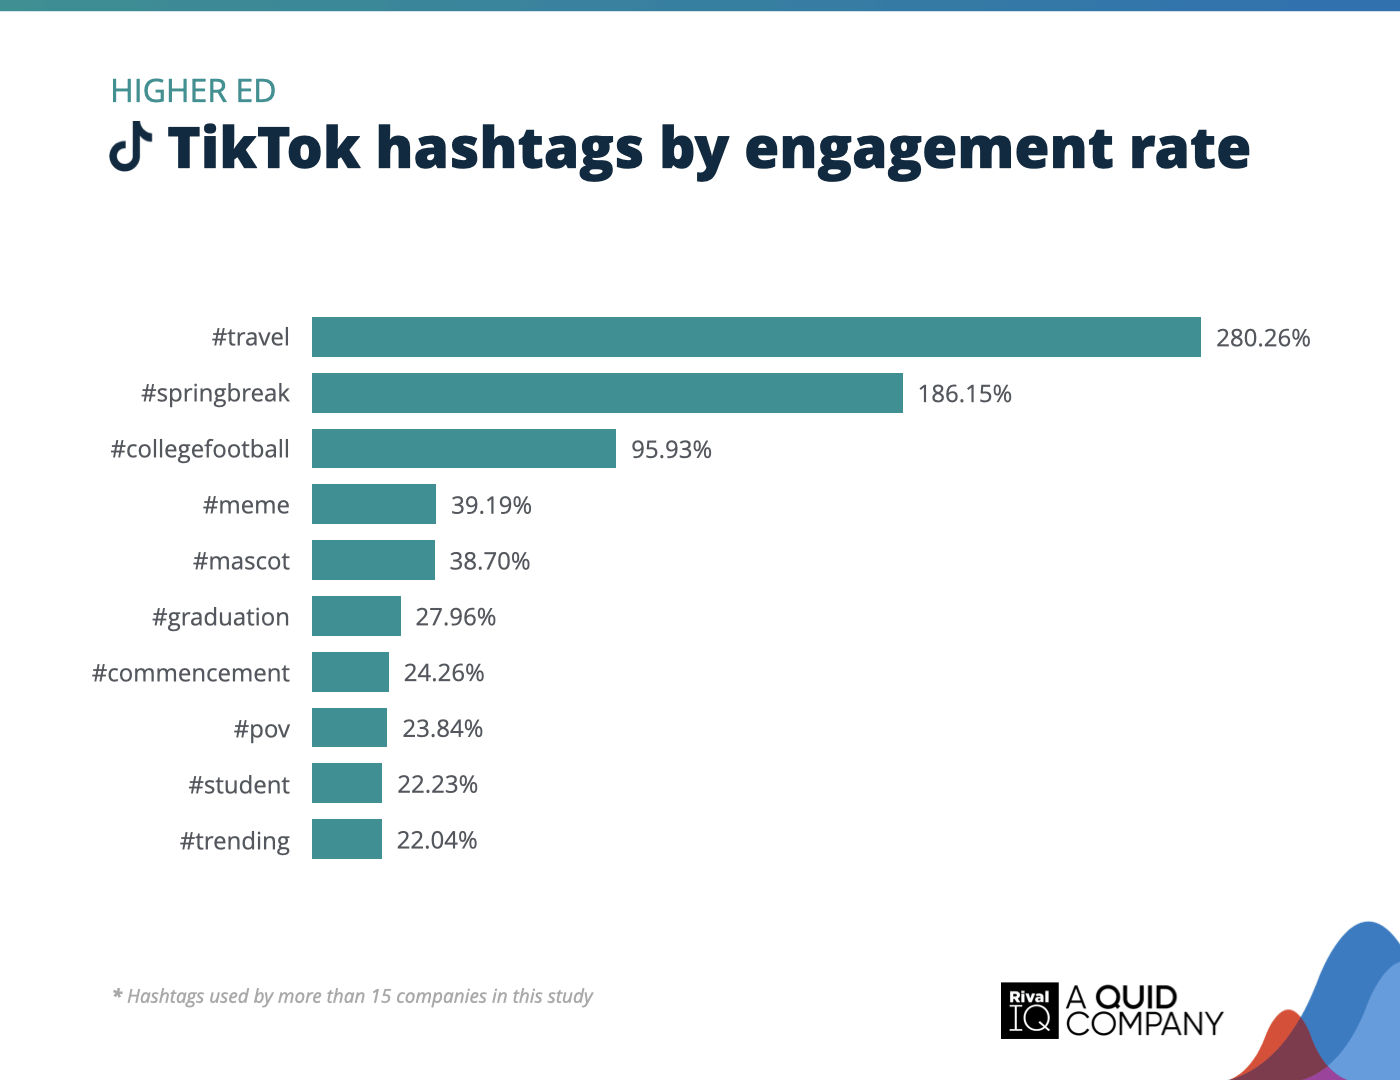
Top TikTok hashtags by engagement rate, Higher Ed
Travel and event-focused hashtags like #travel, #springbreak, and #collegefootball scored big for Higher Ed brands on TikTok this year. By tapping into student adventures and campus pride, schools kept their content relatable and highly engaging.
Home Decor Social Media Benchmarks
Home Decor brands earned engagement rates towards the bottom of the pack on all channels,
Some ideas for increasing engagement:
- Industry-themed hashtags helped followers find Home Decor content, so keep those up.
- Photos and Reels are the way to go on most channels.
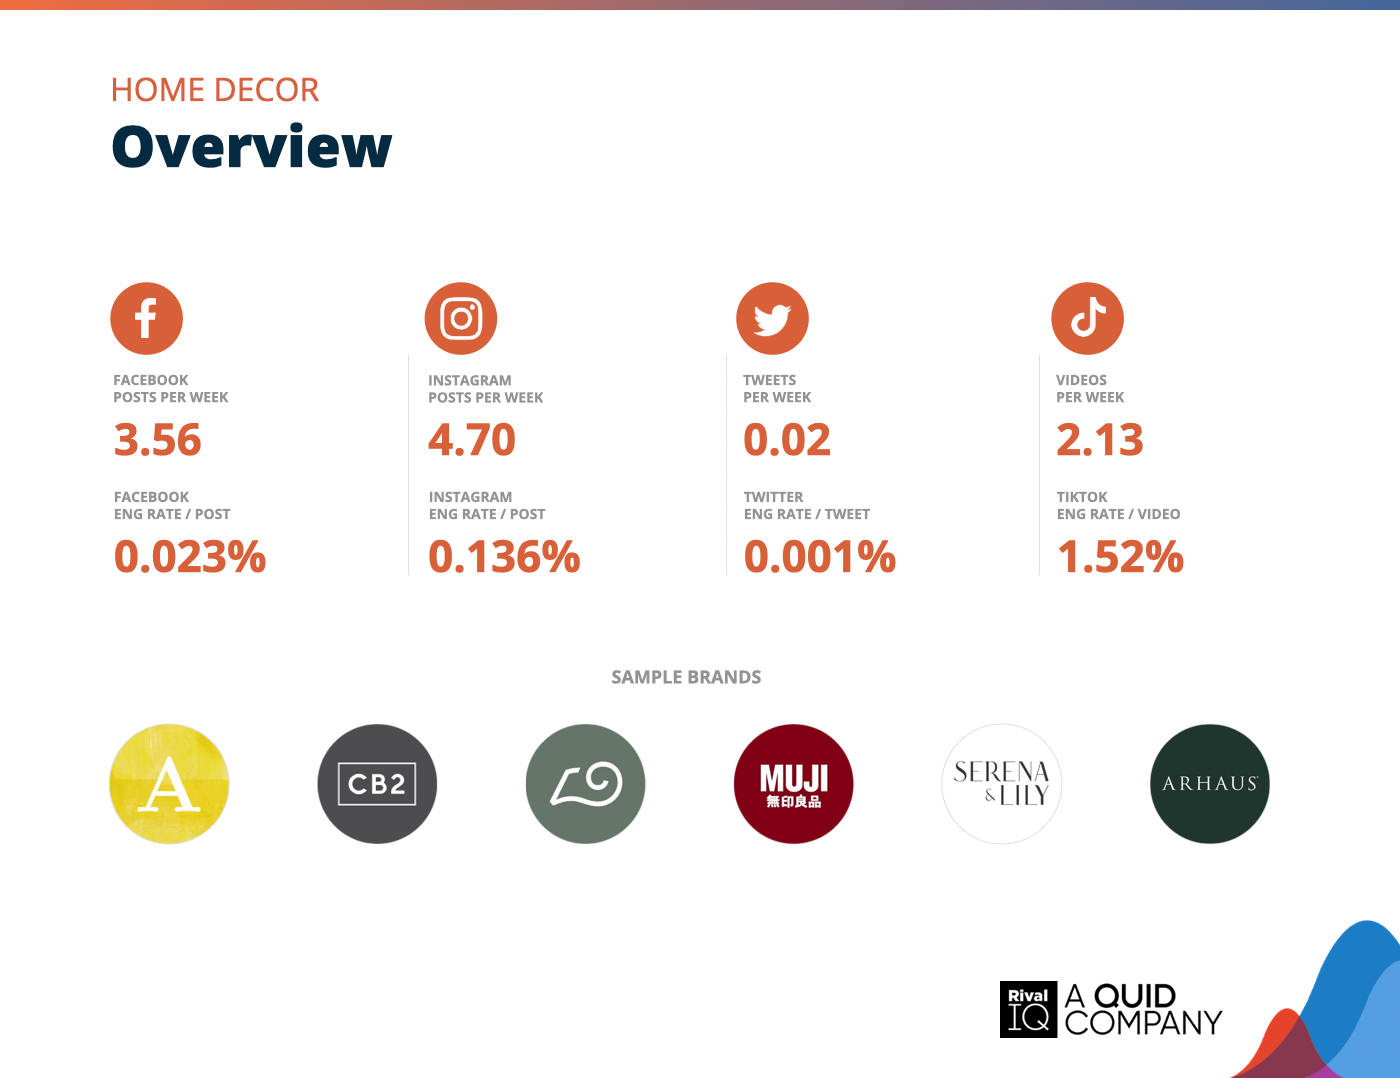
Overview of all benchmarks, Home Decor
Notable brands in this year’s report include Anthropologie, Arhaus, CB2, MUJI, Ruggable, and Serena & Lily.
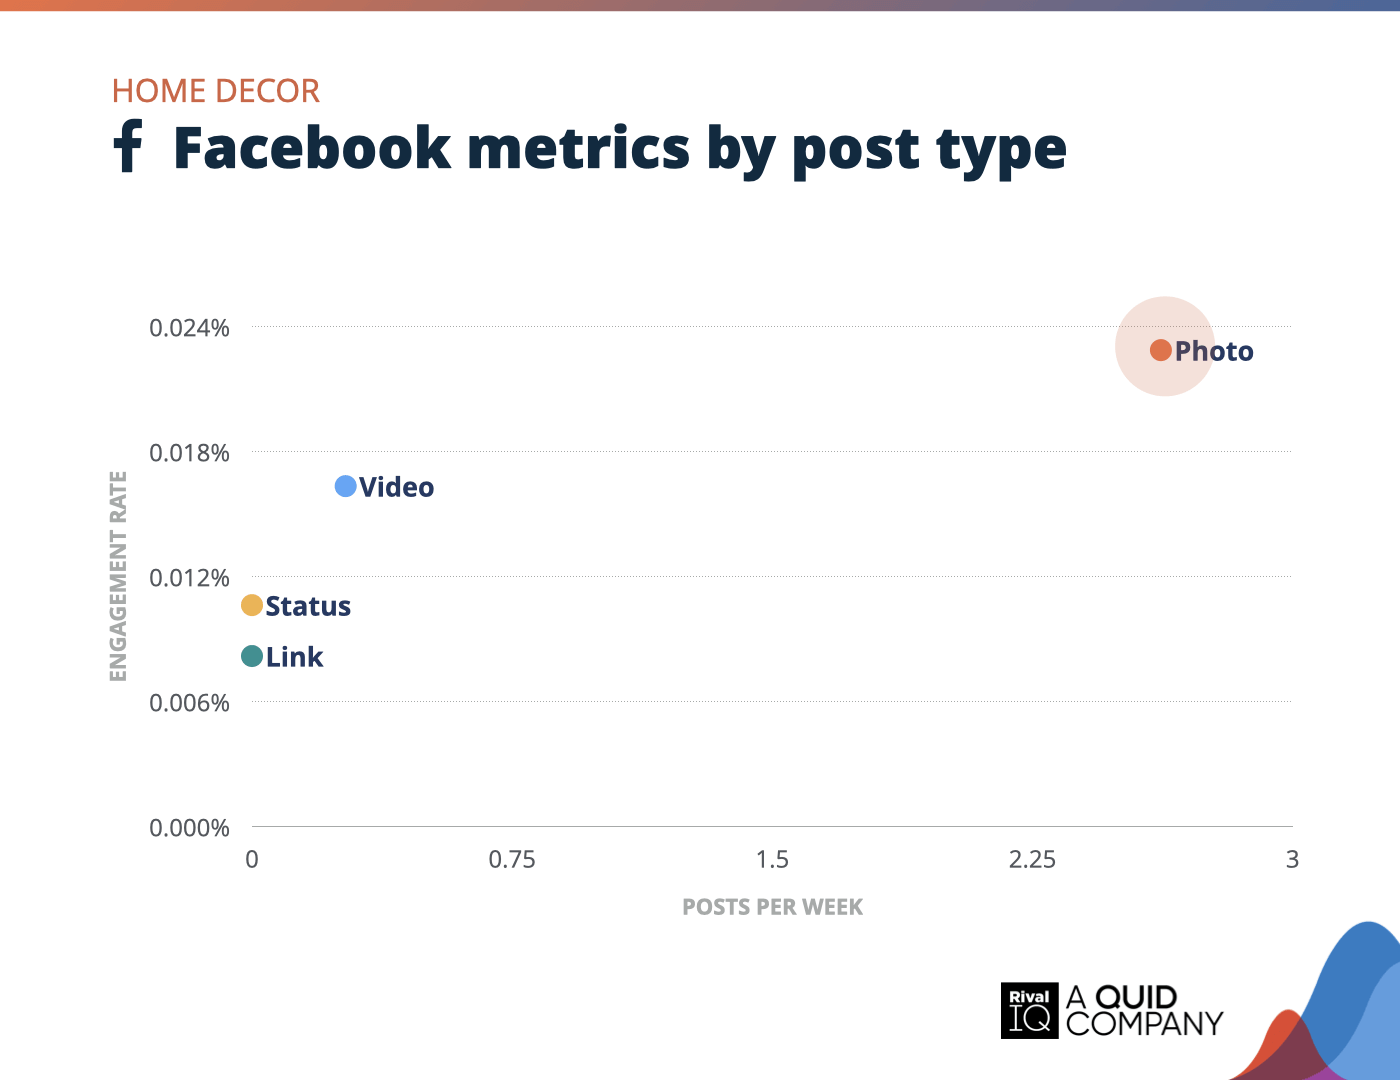
Facebook posts per week and engagement rate by post type, Home Decor
Home Decor brands were way likelier to post a photo on Facebook than any other post type, which is a smart move, since photos grabbed much higher engagement rates.
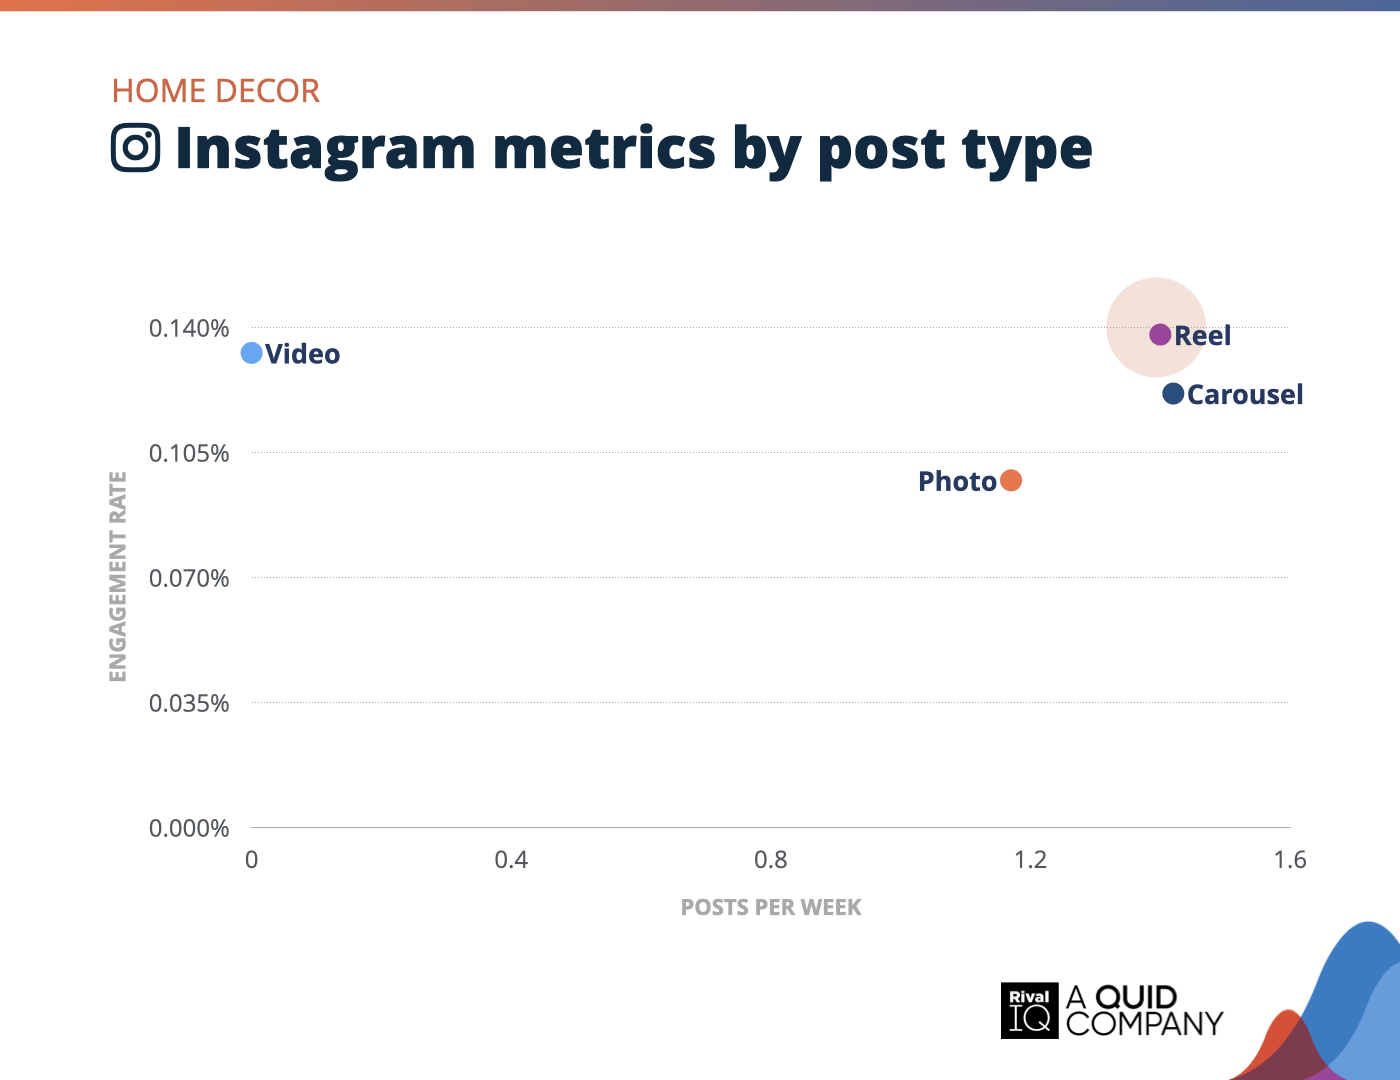
Instagram posts per week and engagement rate by post type, Home Decor
Home Decor brands left video behind in a big way this year in favor of Reels, which paid off with the highest engagement rates of any post type.
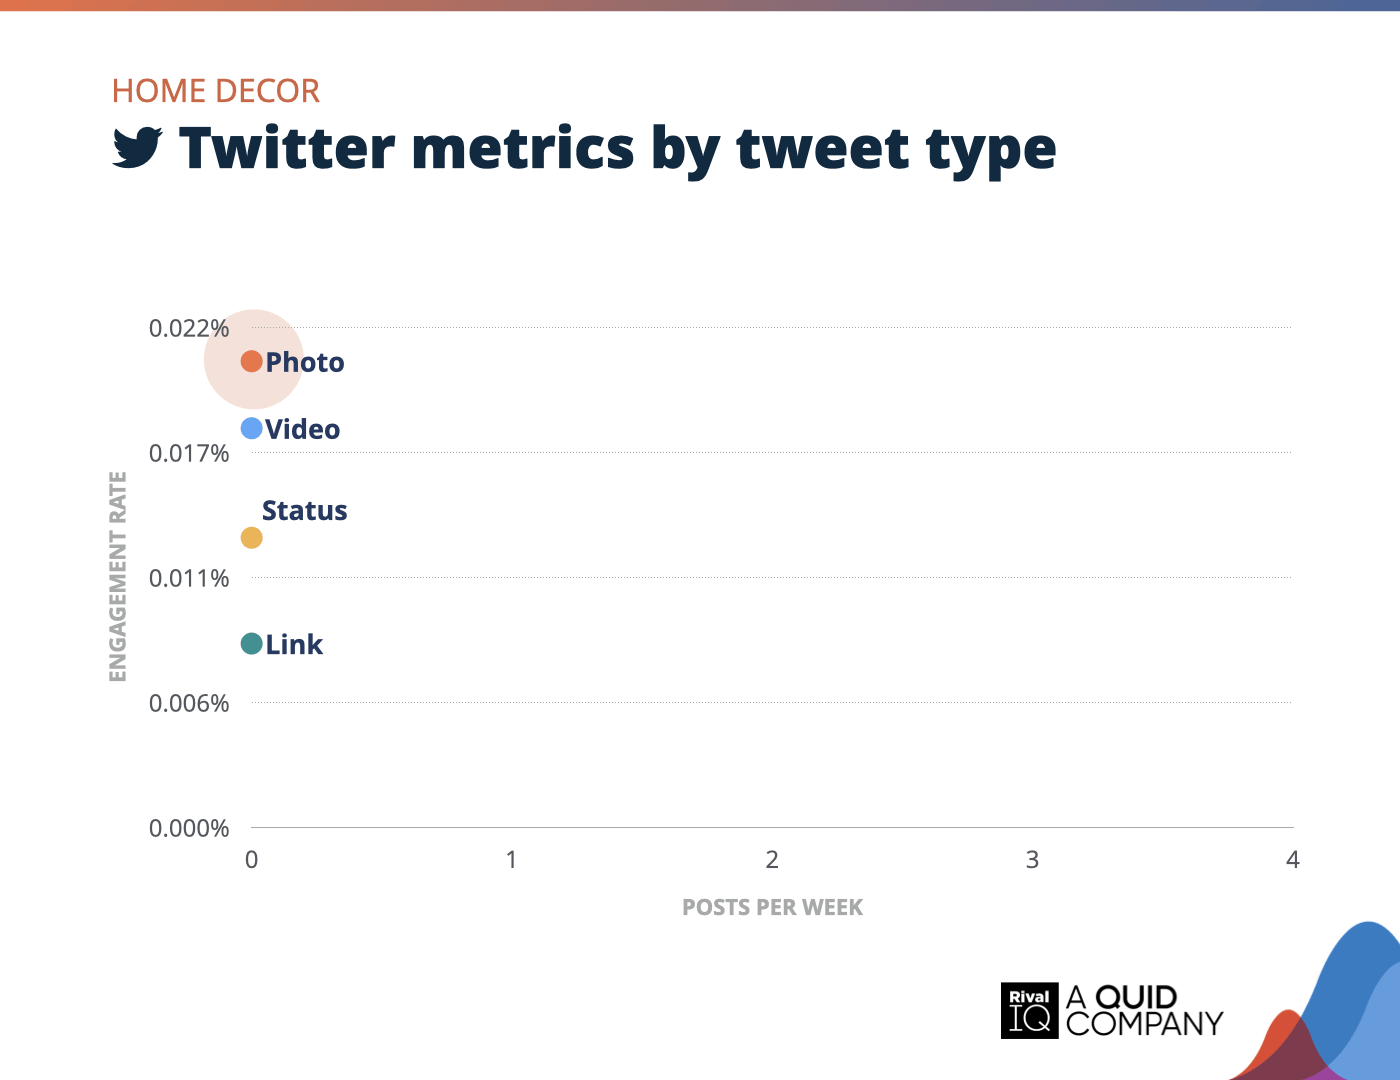
Twitter posts per week and engagement rate by tweet type, Home Decor
Photo tweets earned the highest engagement rates for Home Decor brands on Twitter this year, even though posting overall was pretty sparse.
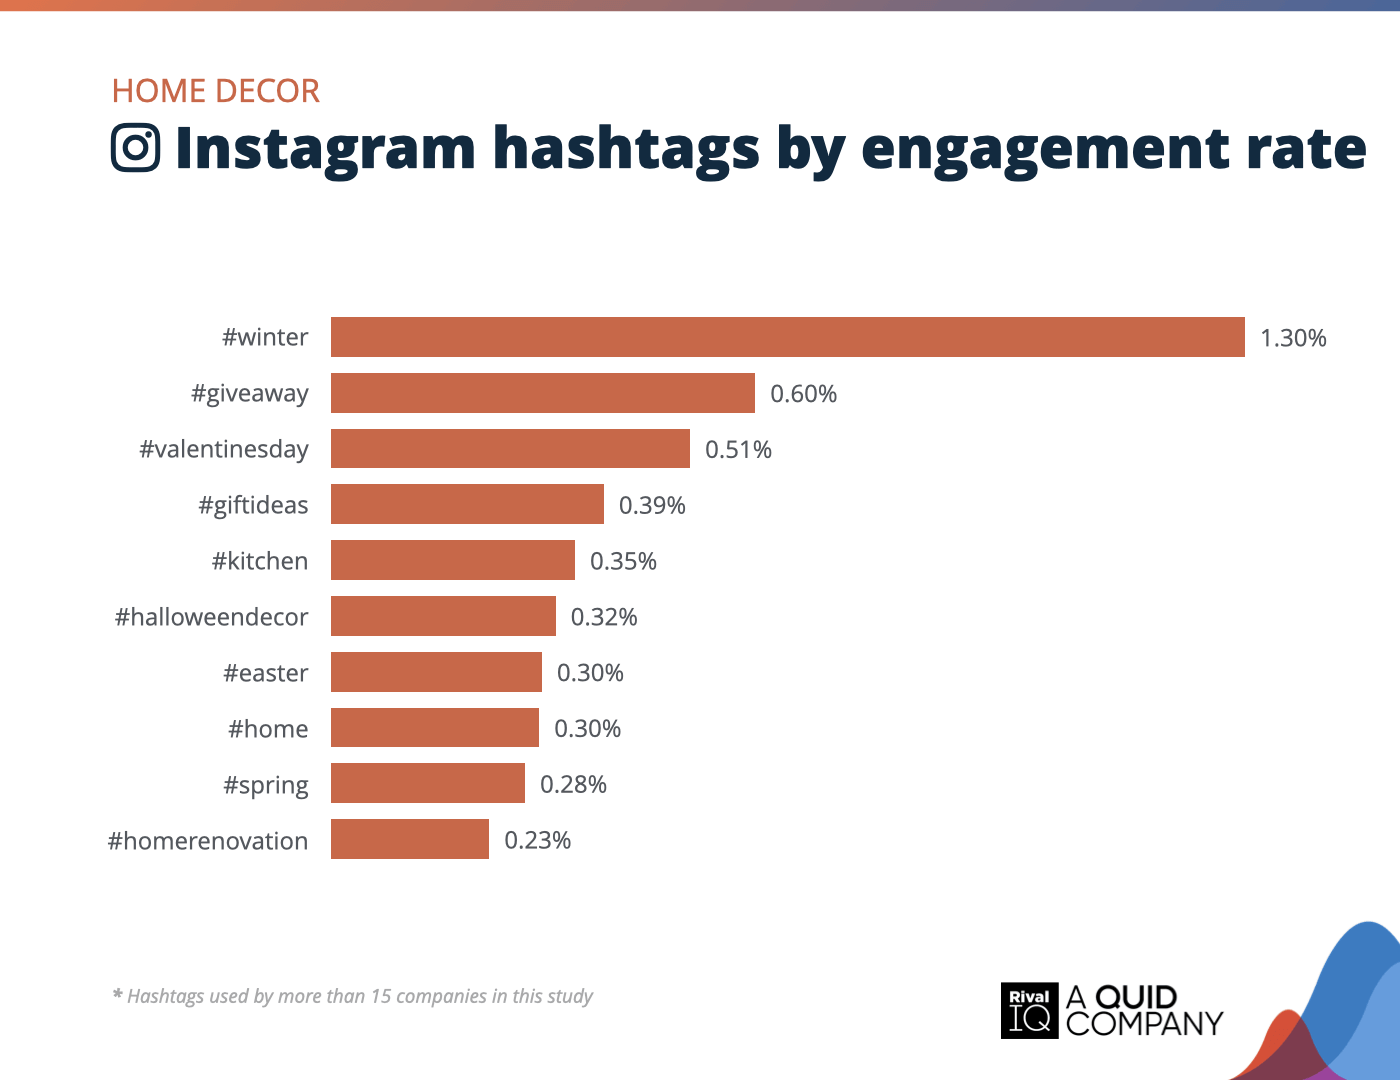
Top Instagram hashtags by engagement rate, Home Decor
Holiday-themed hashtags like #winter and #valentinesday brought the most engagement for Home Decor brands on Instagram this year, showing that seasonal content really resonates with followers
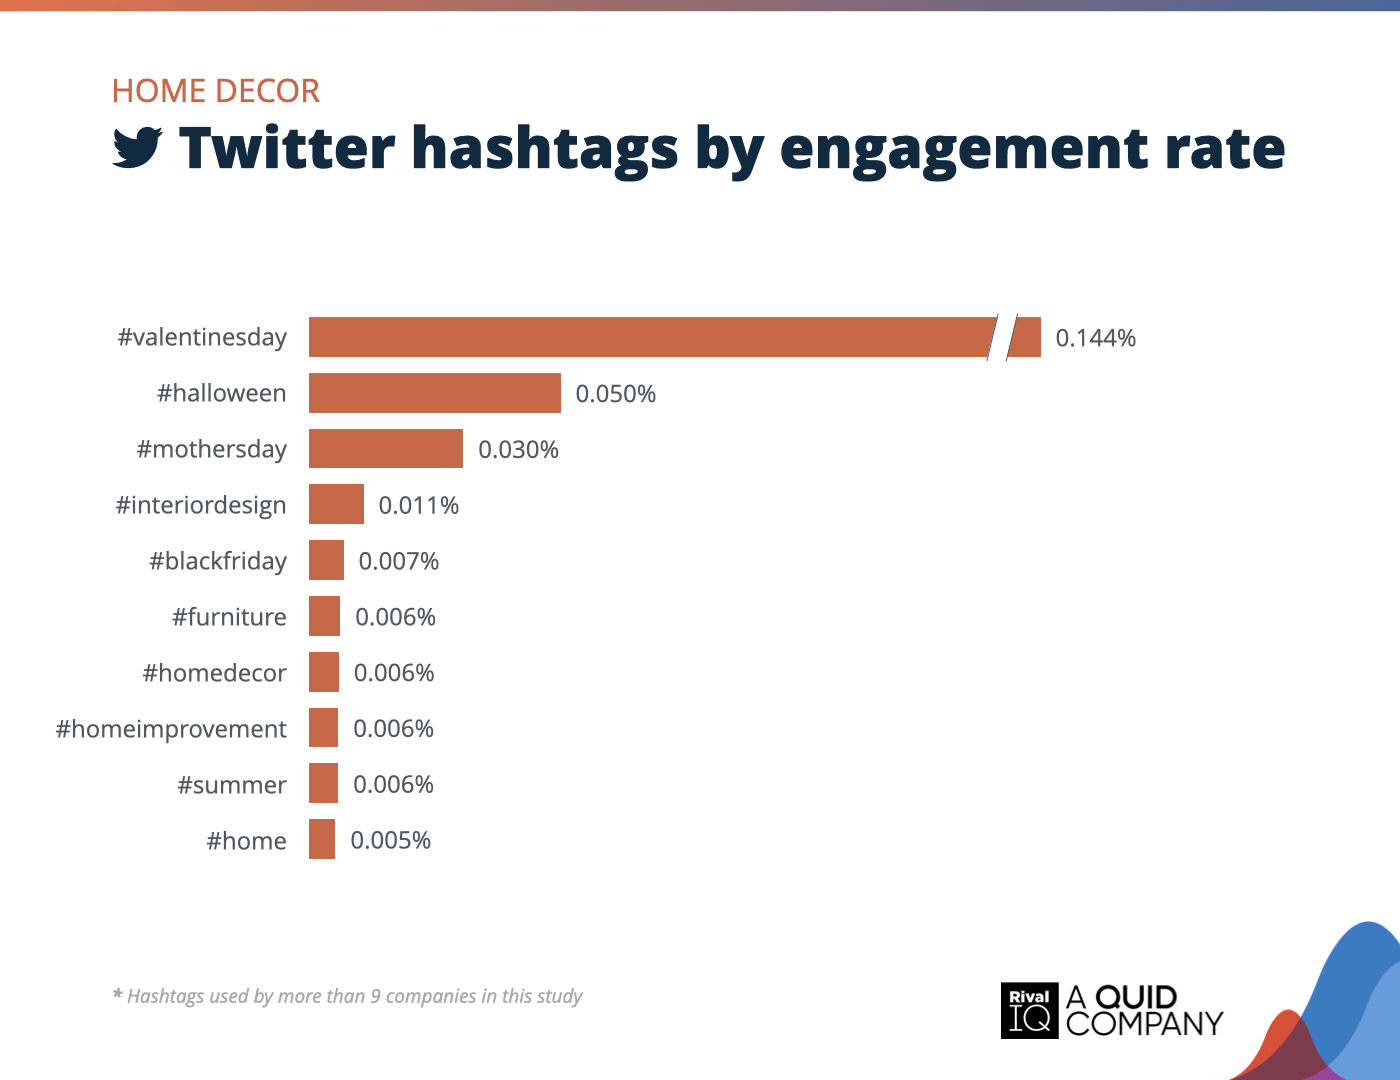
Top Twitter hashtags by engagement rate, Home Decor
Valentine’s Day tweets outpaced other Home Decor hashtags on Twitter by a mile for Home Decor brands this year.
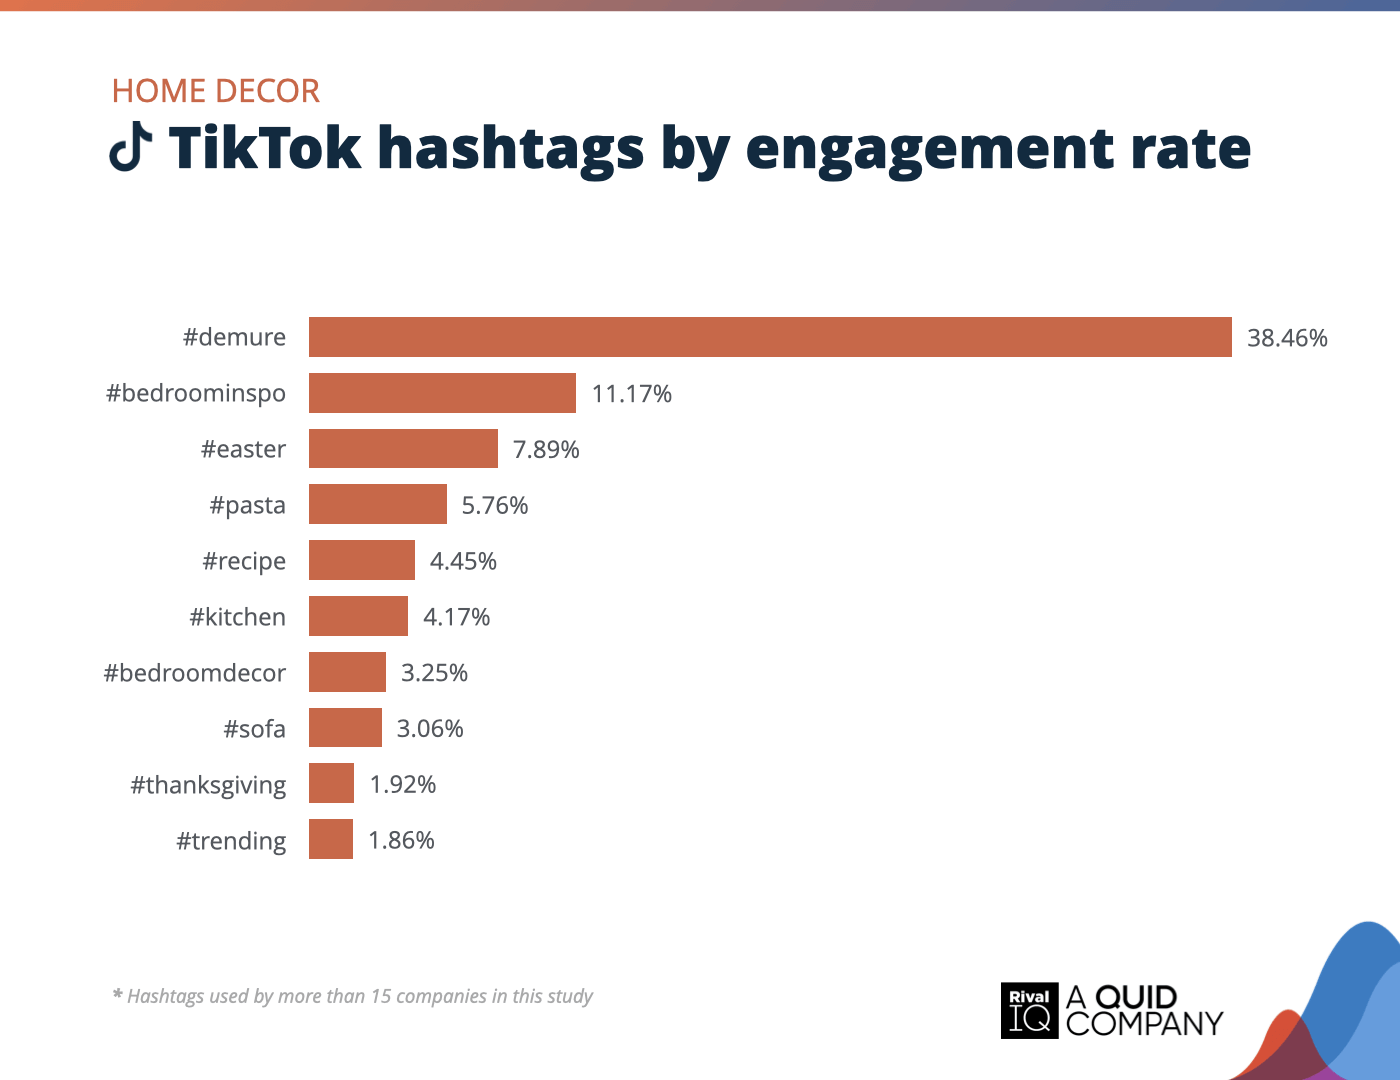
Top TikTok hashtags by engagement rate, Home Decor
Home Decor brands mixed things up on TikTok this year, pairing seasonal and room-focused hashtags like #easter and #bedroominspo with unexpected favorites like #pasta and #recipe.
Influencers Social Media Benchmarks
Influencers saw strong success on Facebook and Instagram this year. However TikTok was the toughest nut to crack, falling 36% below the median engagement rate.
Ideas to boost that engagement even more:
- Motivational hashtags like #love and #mindset resonated with fans on Instagram.
- Try shaking up your posting frequency and content on TikTok to dominate on this channel as well.
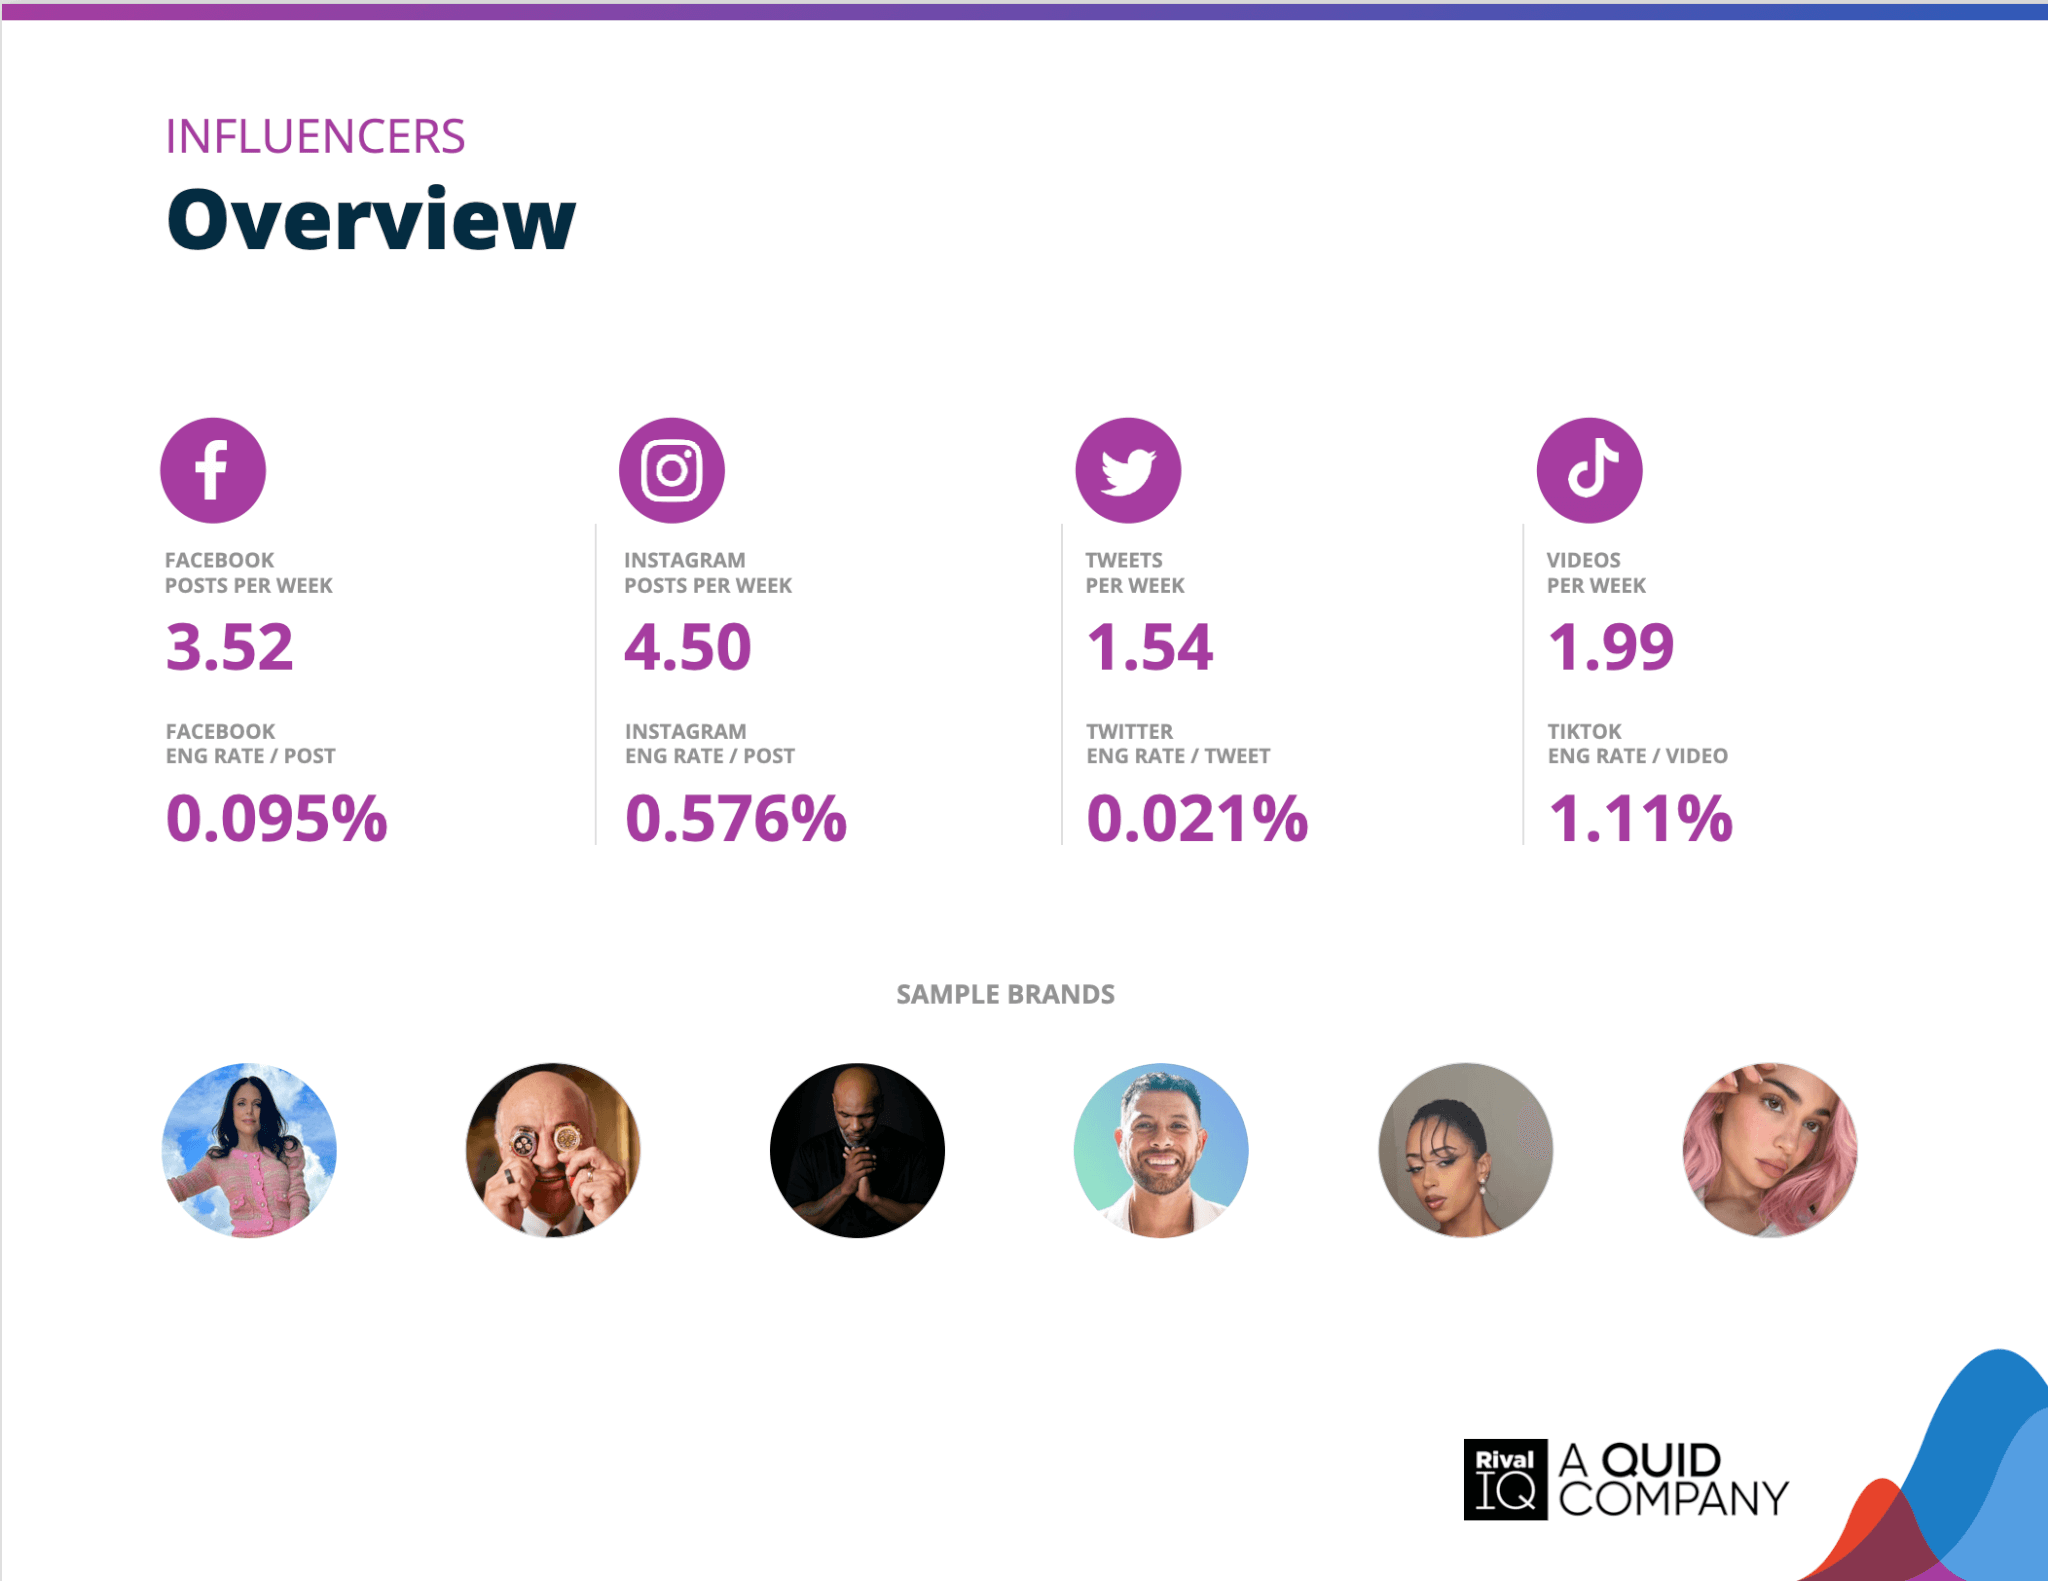
Overview of all benchmarks, Influencers
Notable brands in this year’s report include Bethenny Frankel, Gerard Adams, Kevin O’Leary, Kylie Jenner, Liza Koshy, and Mike Tyson.
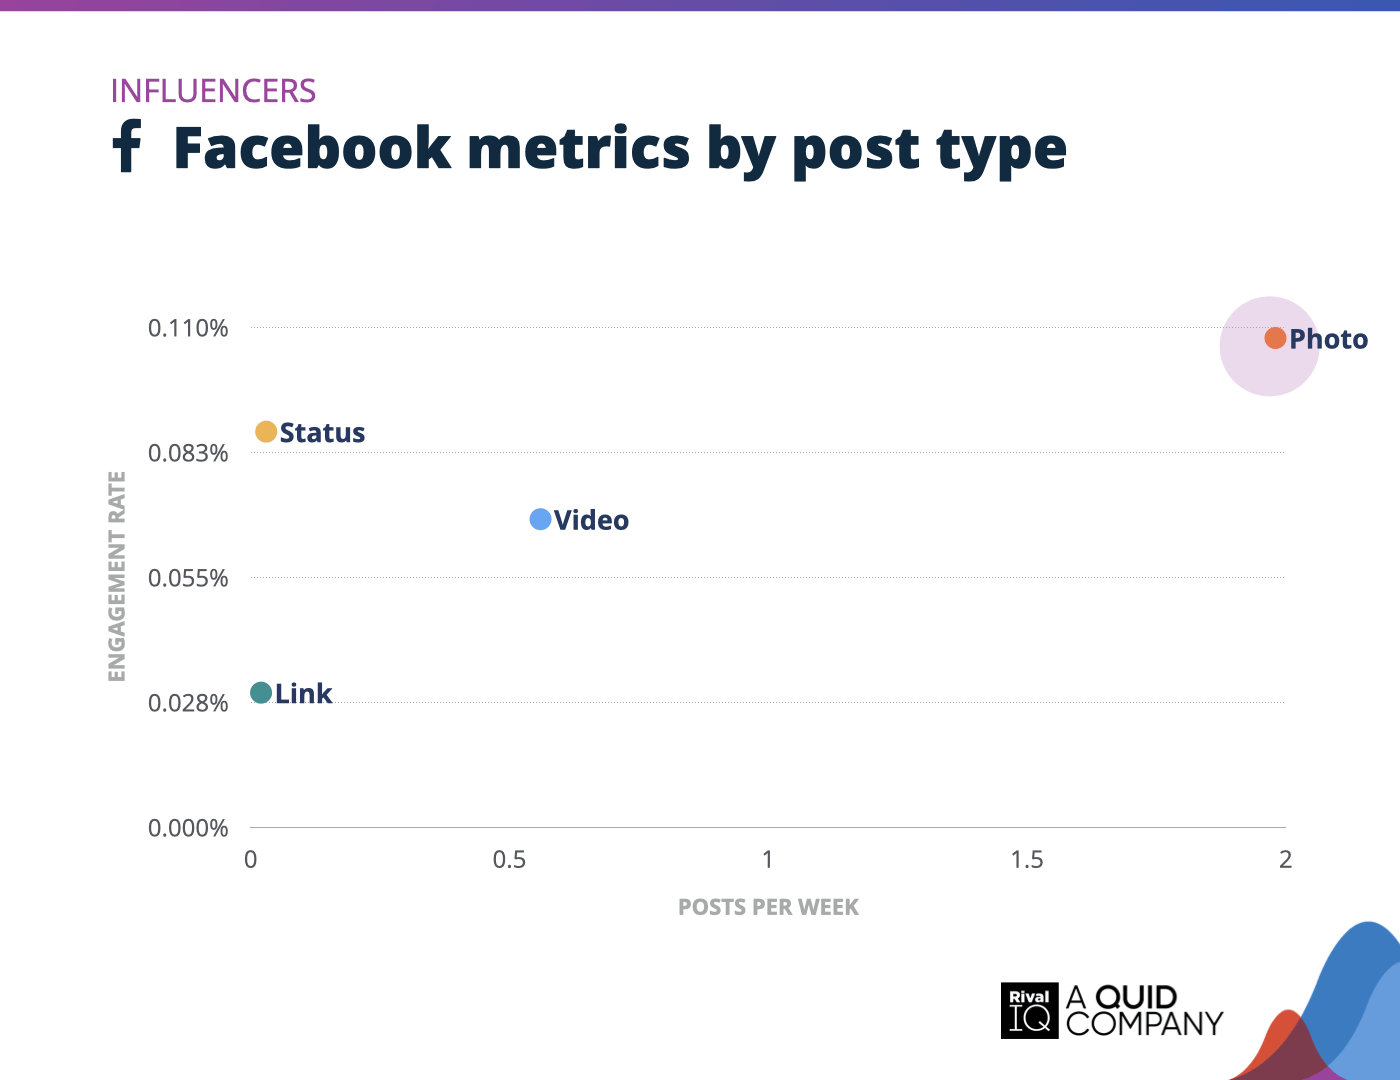
Facebook posts per week and engagement rate by post type, Influencers
Photos were the top-performing post type for Influencers on Facebook this year, bringing in the highest engagement rates compared to videos, status updates, and links. Prioritizing visual content paid off for these creators.
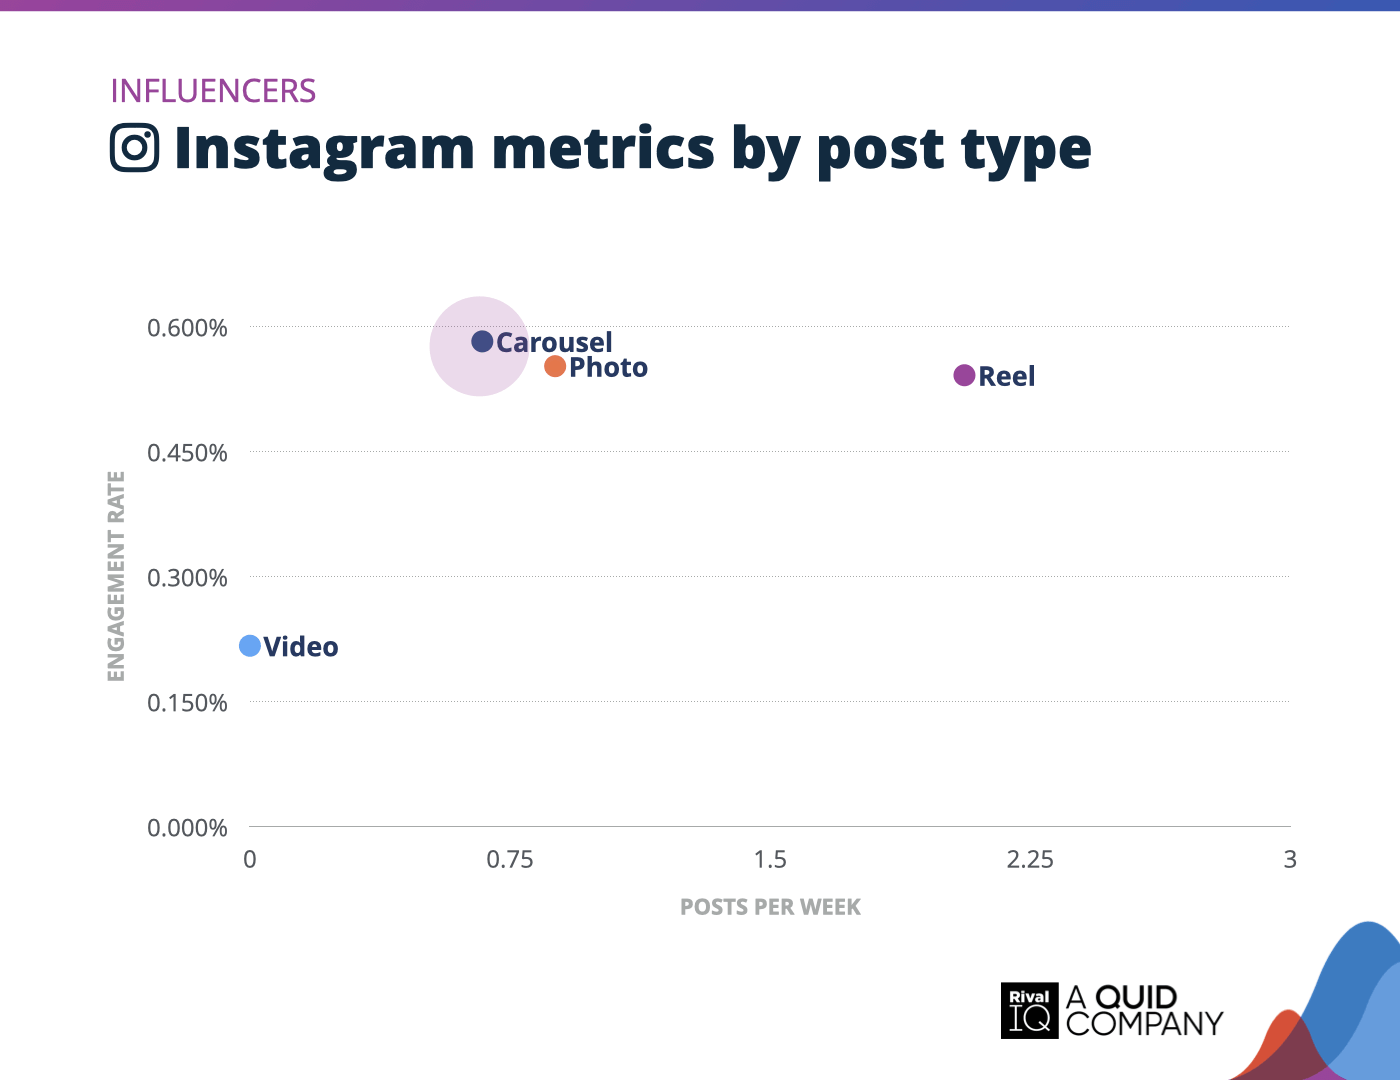
Instagram posts per week and engagement rate by post type, Influencers
Carousels led the way for Influencers on Instagram this year with the highest engagement rates, closely followed by photos and Reels.
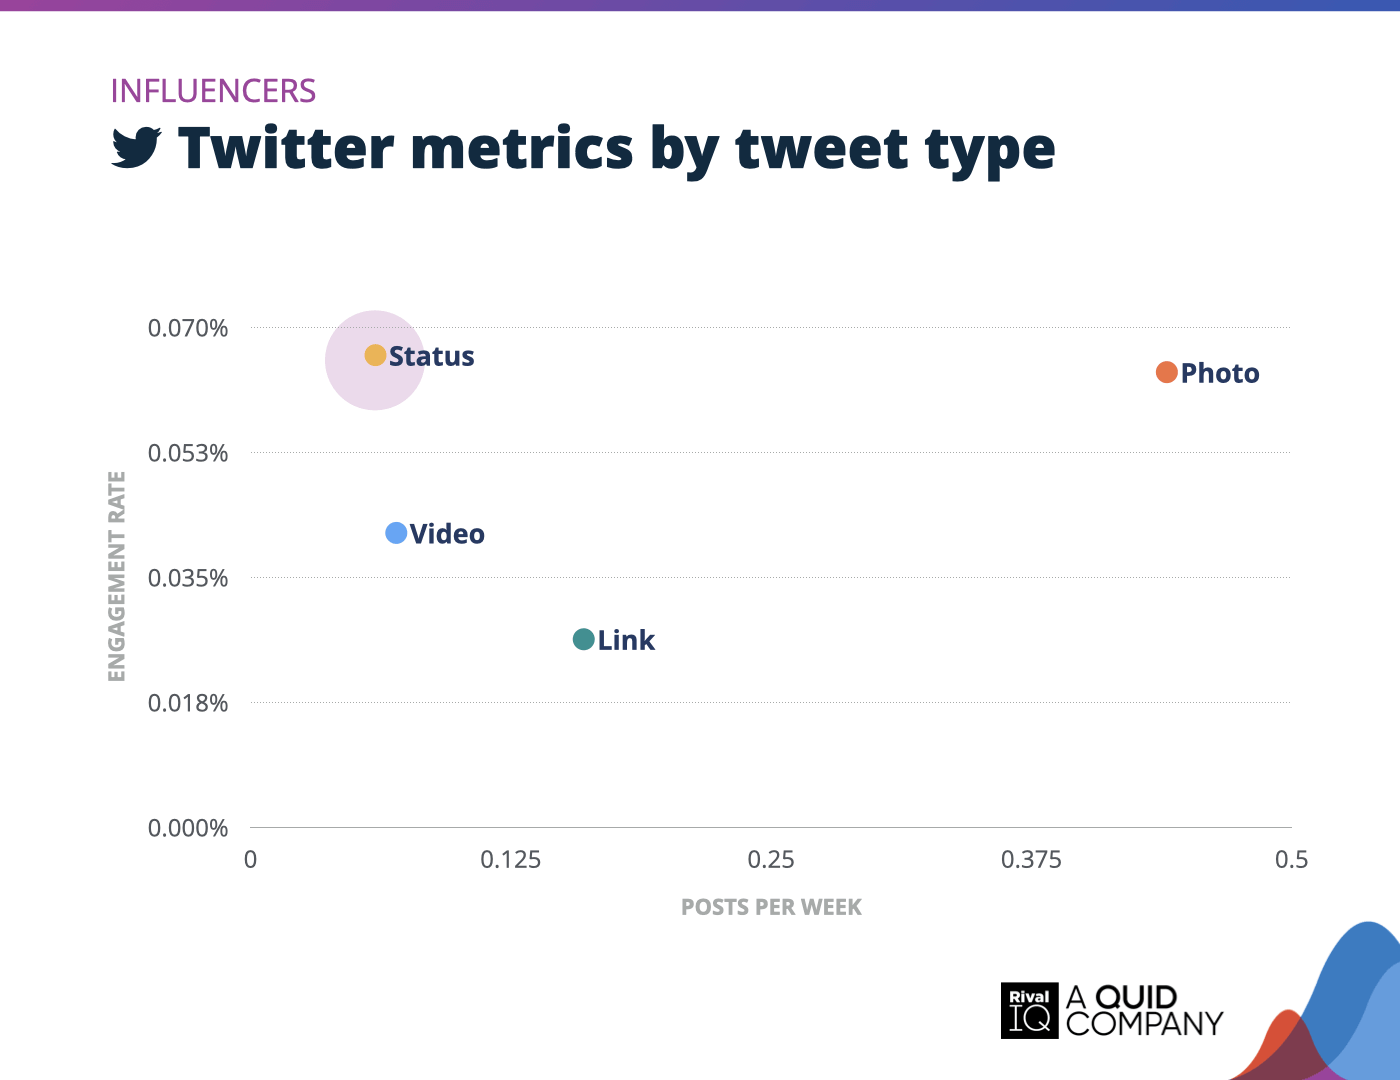
Twitter posts per week and engagement rate by tweet type, Influencers
Status updates edged out photos as the most engaging tweet type for Influencers this year, even though photos were posted nearly three times as often.
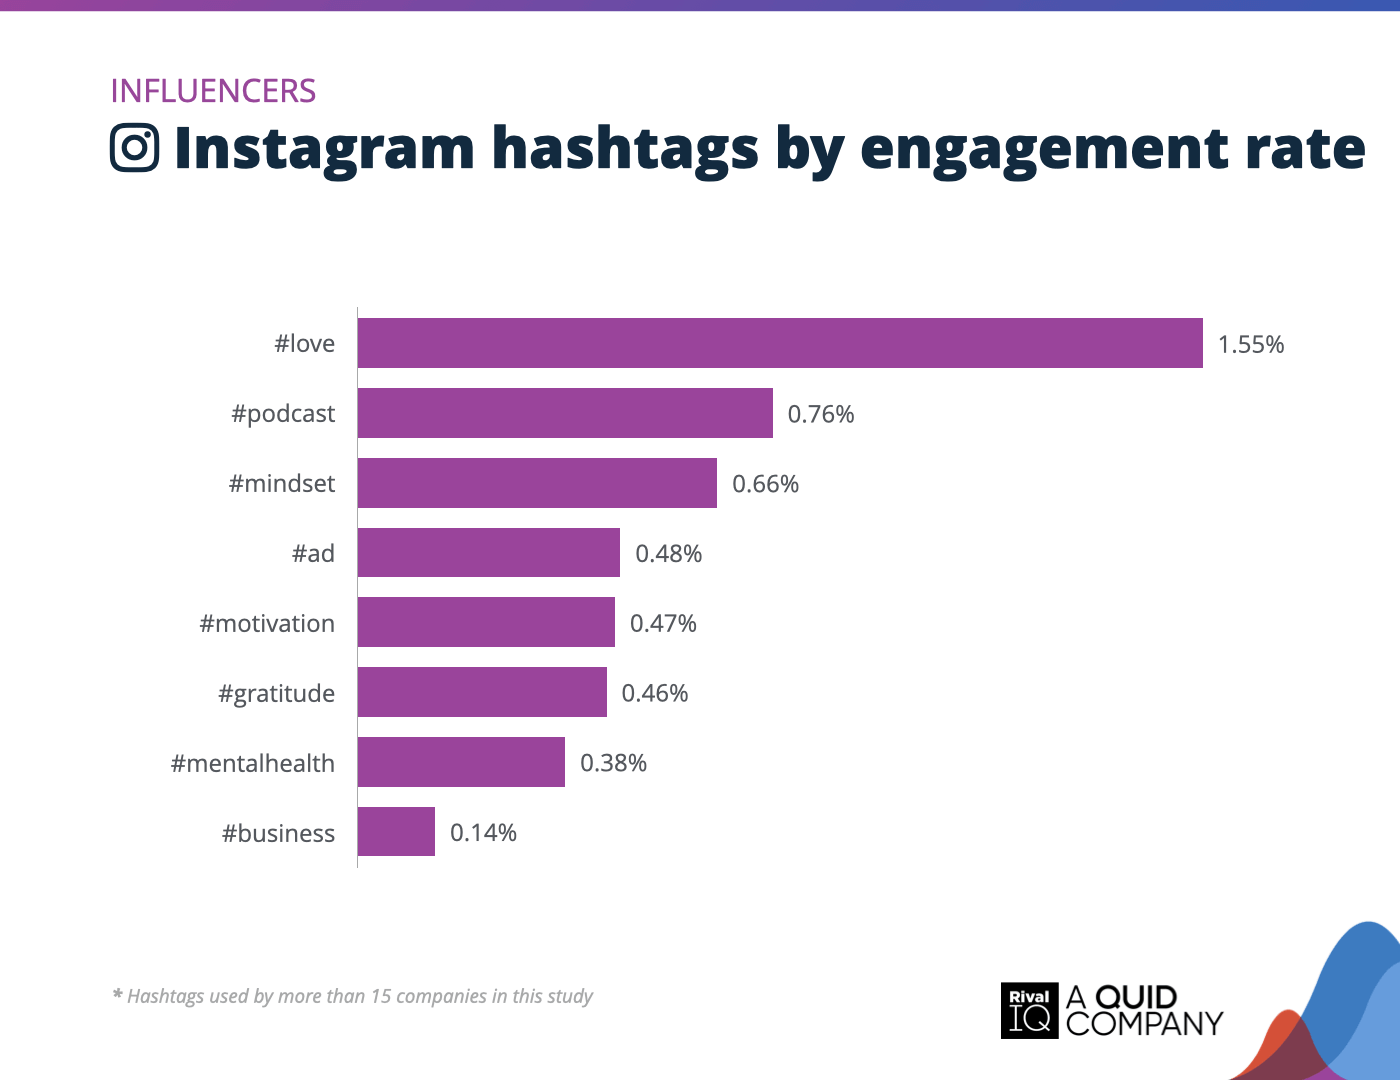
Top Instagram hashtags by engagement rate, Influencers
Positive vibes ruled for Influencers on Instagram this year, with hashtags like #love, #gratitude, and #mindset driving strong engagement. Even branded hashtags like #ad found their place among the top performers, showing that authenticity and promotion can go hand-in-hand.
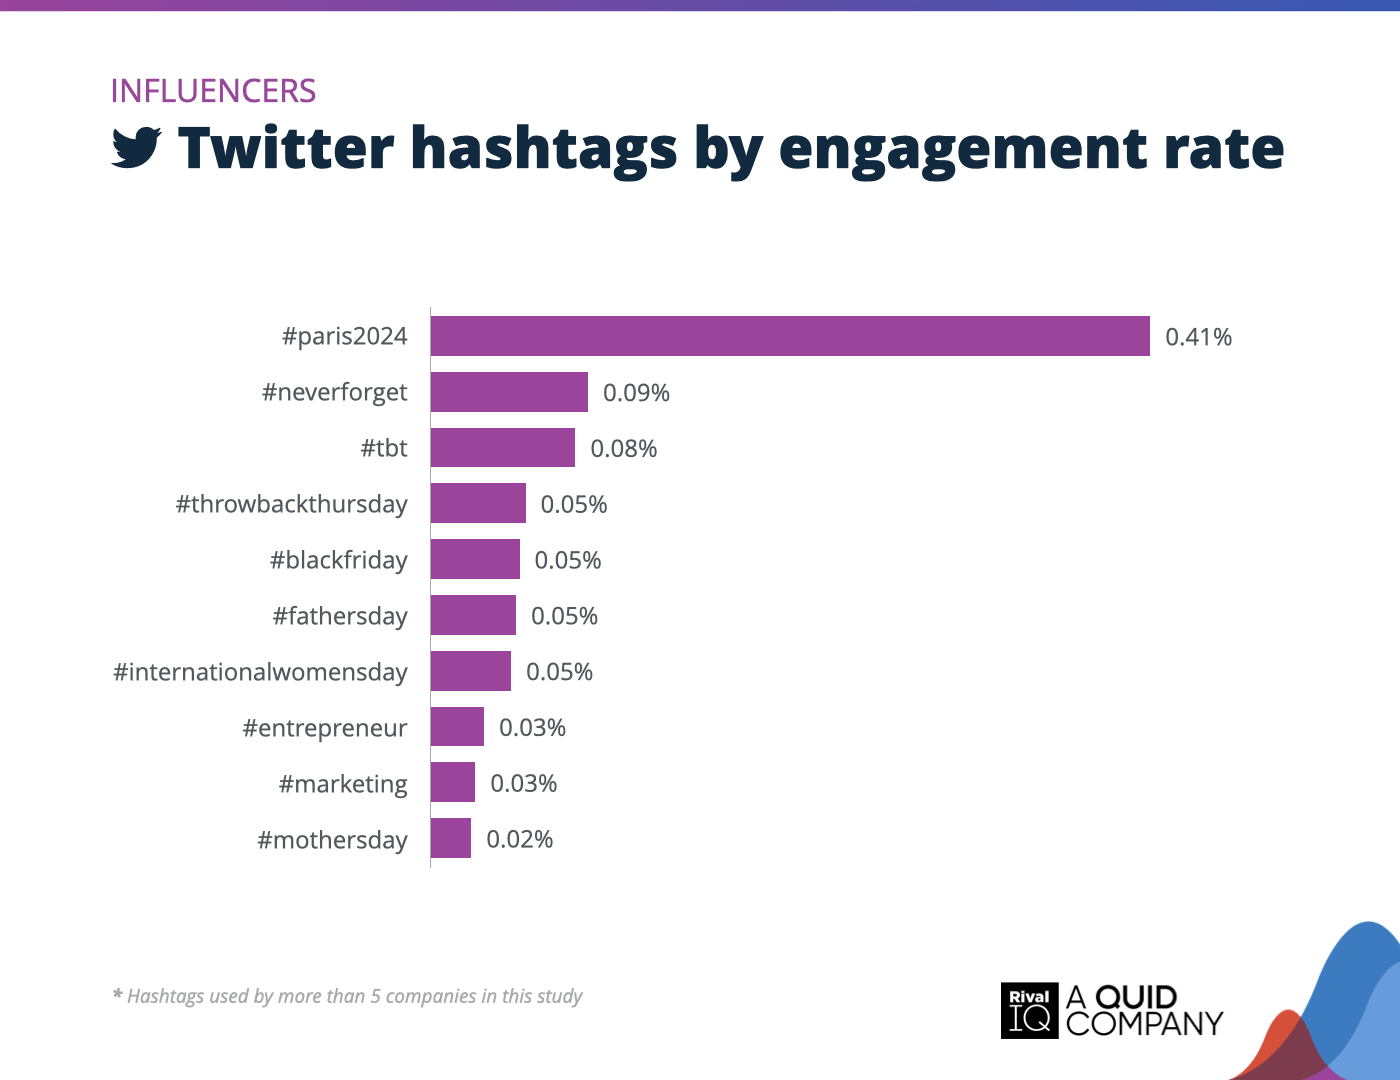
Top Twitter hashtags by engagement rate, Influencers
Influencers tapped into trending events and nostalgic moments on Twitter this year. Hashtags like #paris2024 and #tbt topped engagement charts.
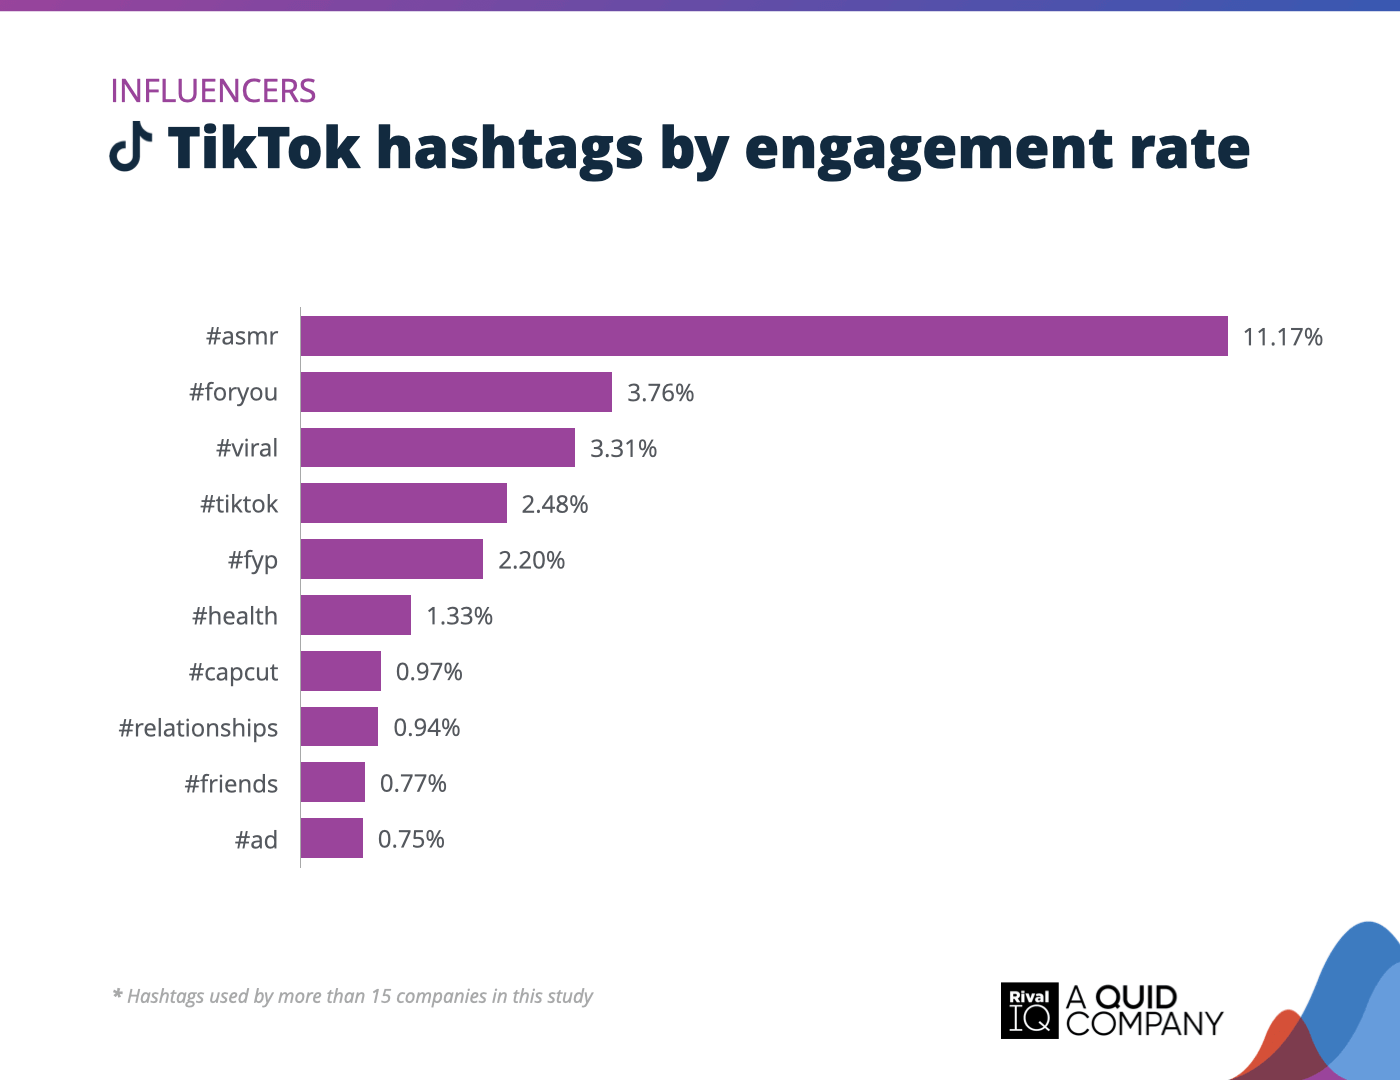
Top TikTok hashtags by engagement rate, Influencers
TikTok-themed hashtags like #asmr, #foryou, and #viral helped Influencers hop onto the For You Page of fans and followers.
Media Social Media Benchmarks
Media brands dramatically ramped up their posting frequency (no surprise there with the US election coverage) across all four channels this year, especially on Facebook and TikTok, but struggled to maintain engagement rates.
A few ideas to improve engagement rates:
- Visual content like photos and Reels outperformed links, which remained Media brands’ go-to post type.
- Current events and political hashtags like #debate and #election2024 drove strong engagement, especially on TikTok.
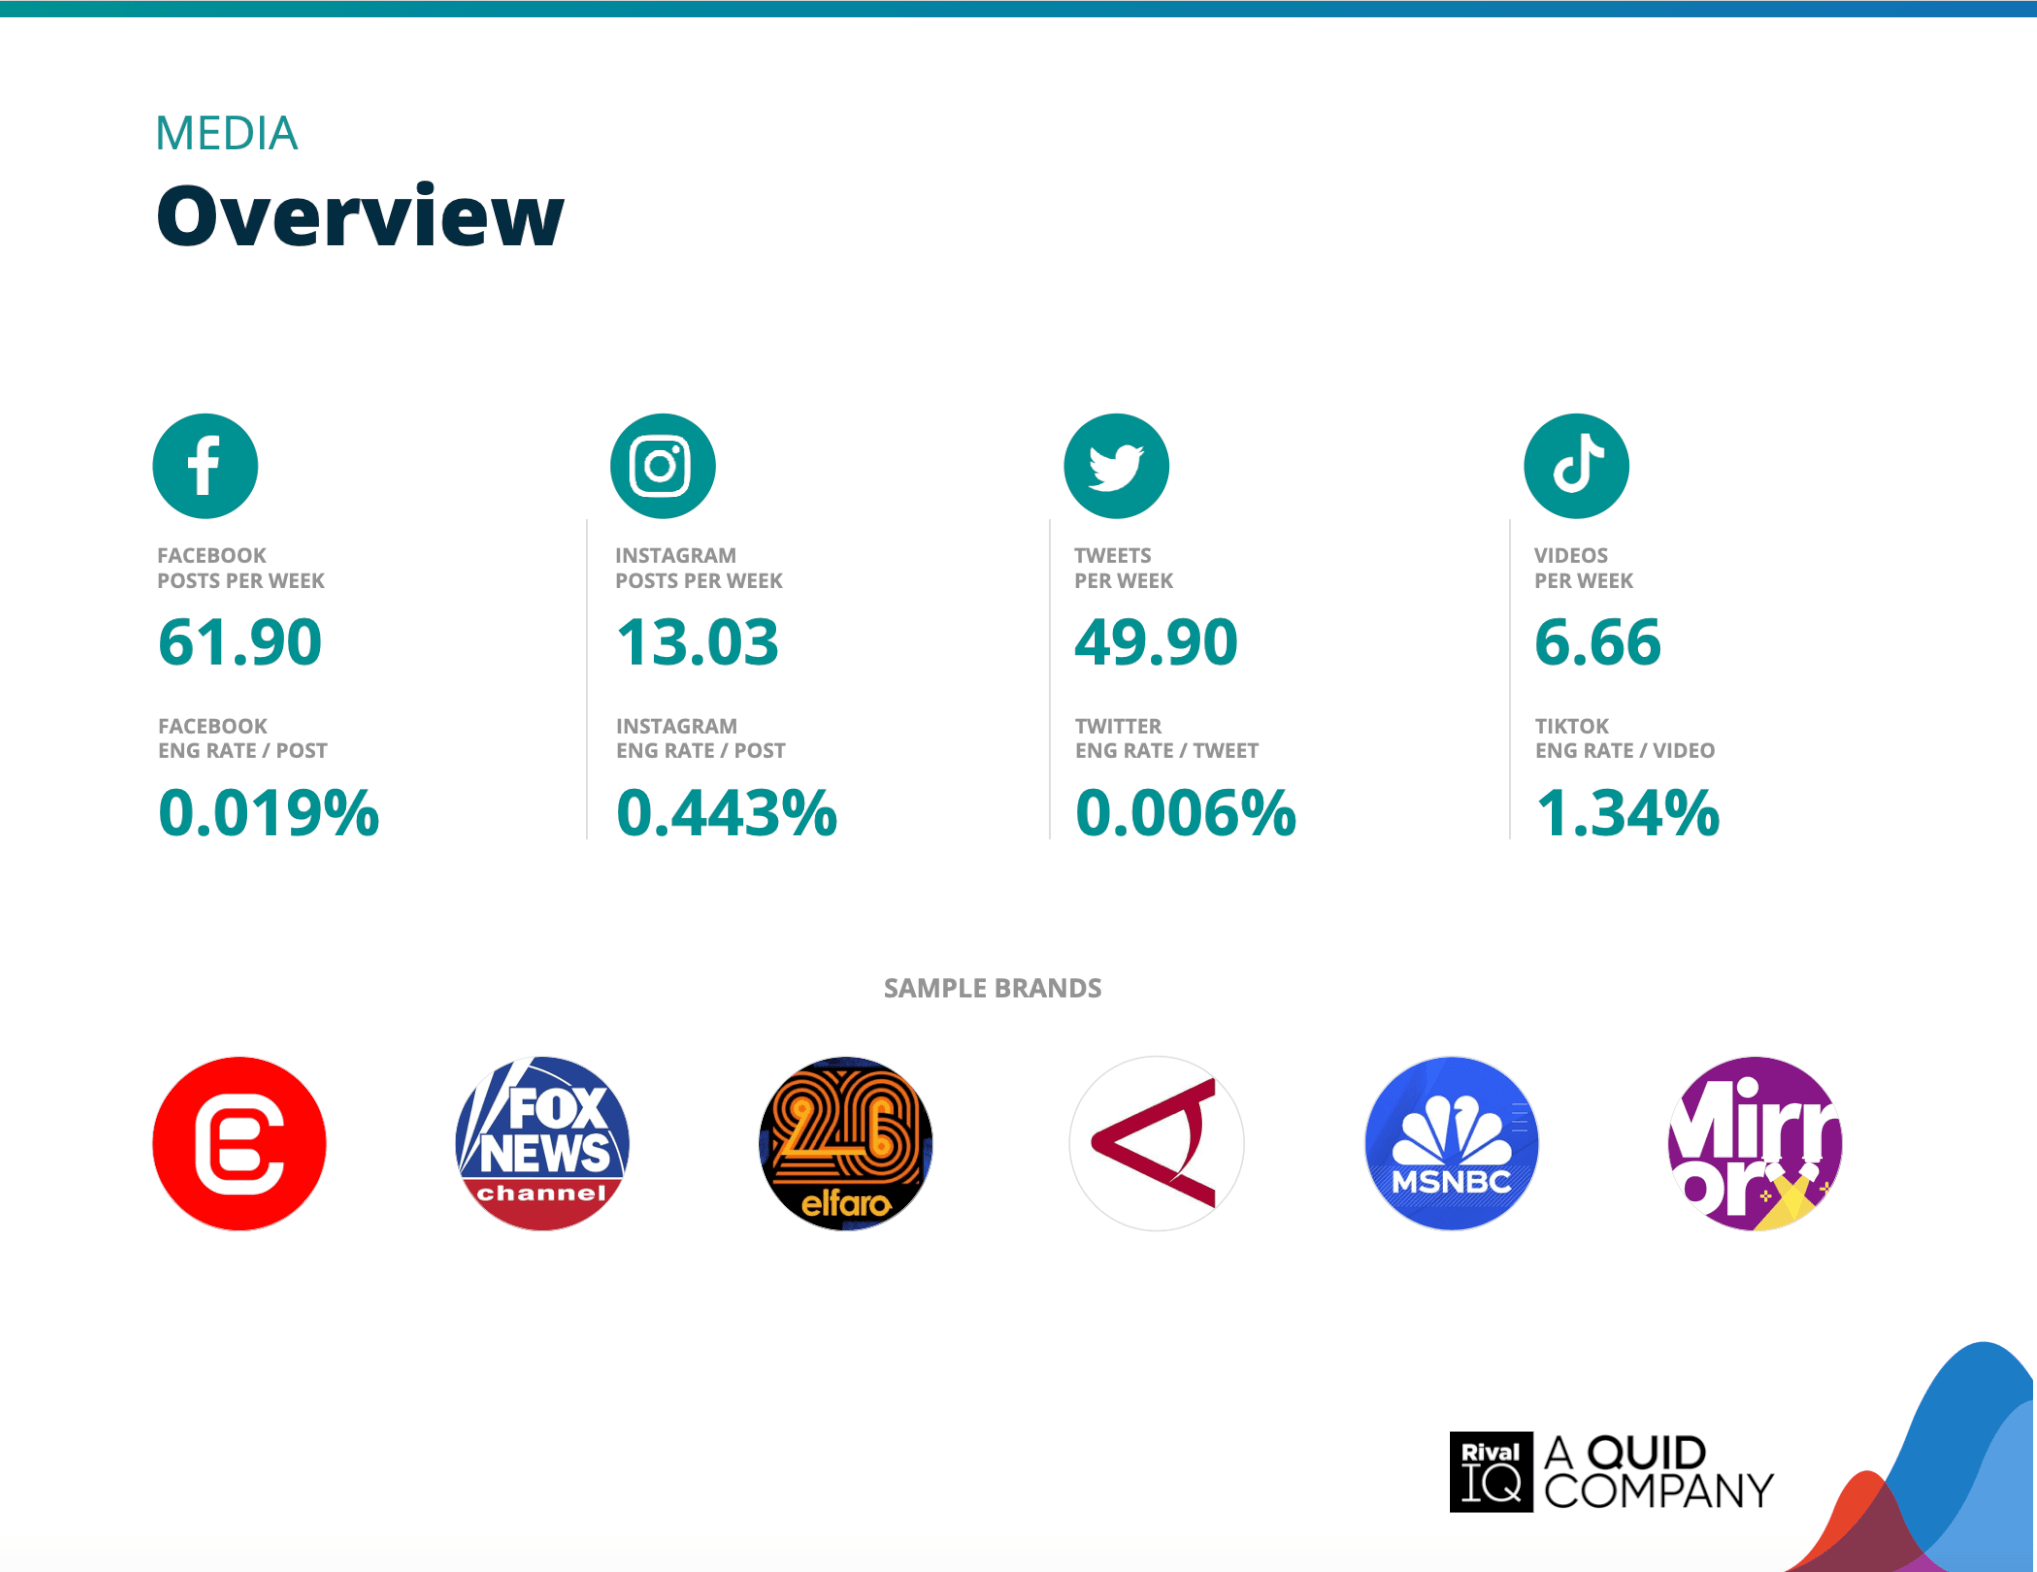
Overview of all benchmarks, Media
Notable brands in this year’s report include Antara News, Fox News, El Faro, Crypto Banter, The Mirror, and MSNBC.
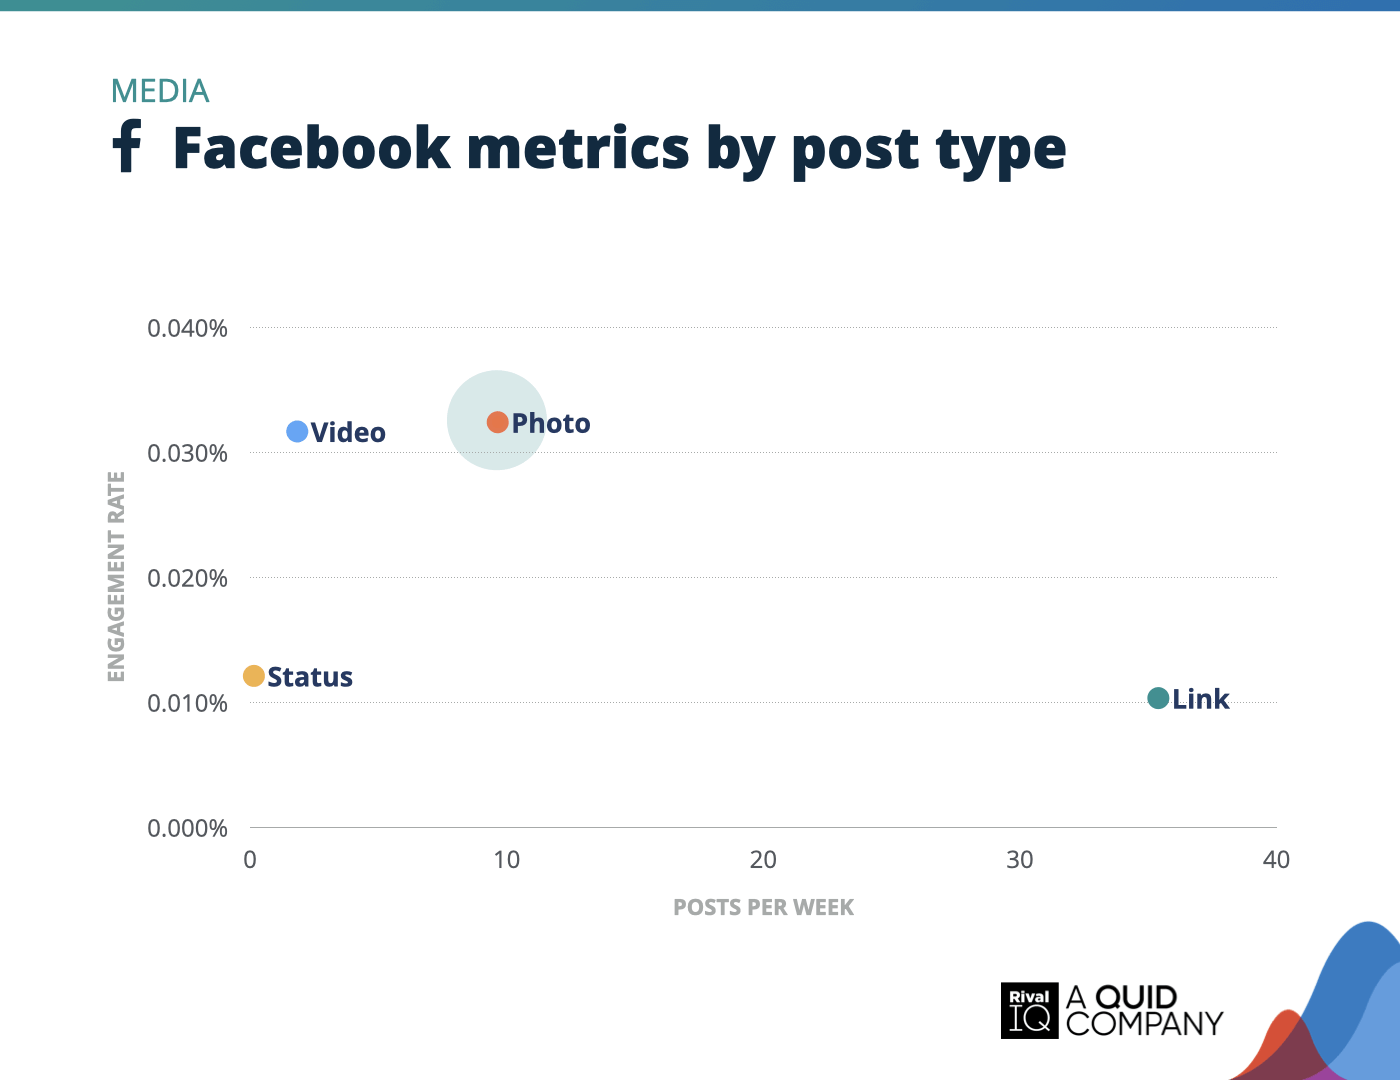
Facebook posts per week and engagement rate by post type, Media
Photos rocked top engagement rates for Media brands on Facebook, though these brands were more than 3x as likely to post a link.
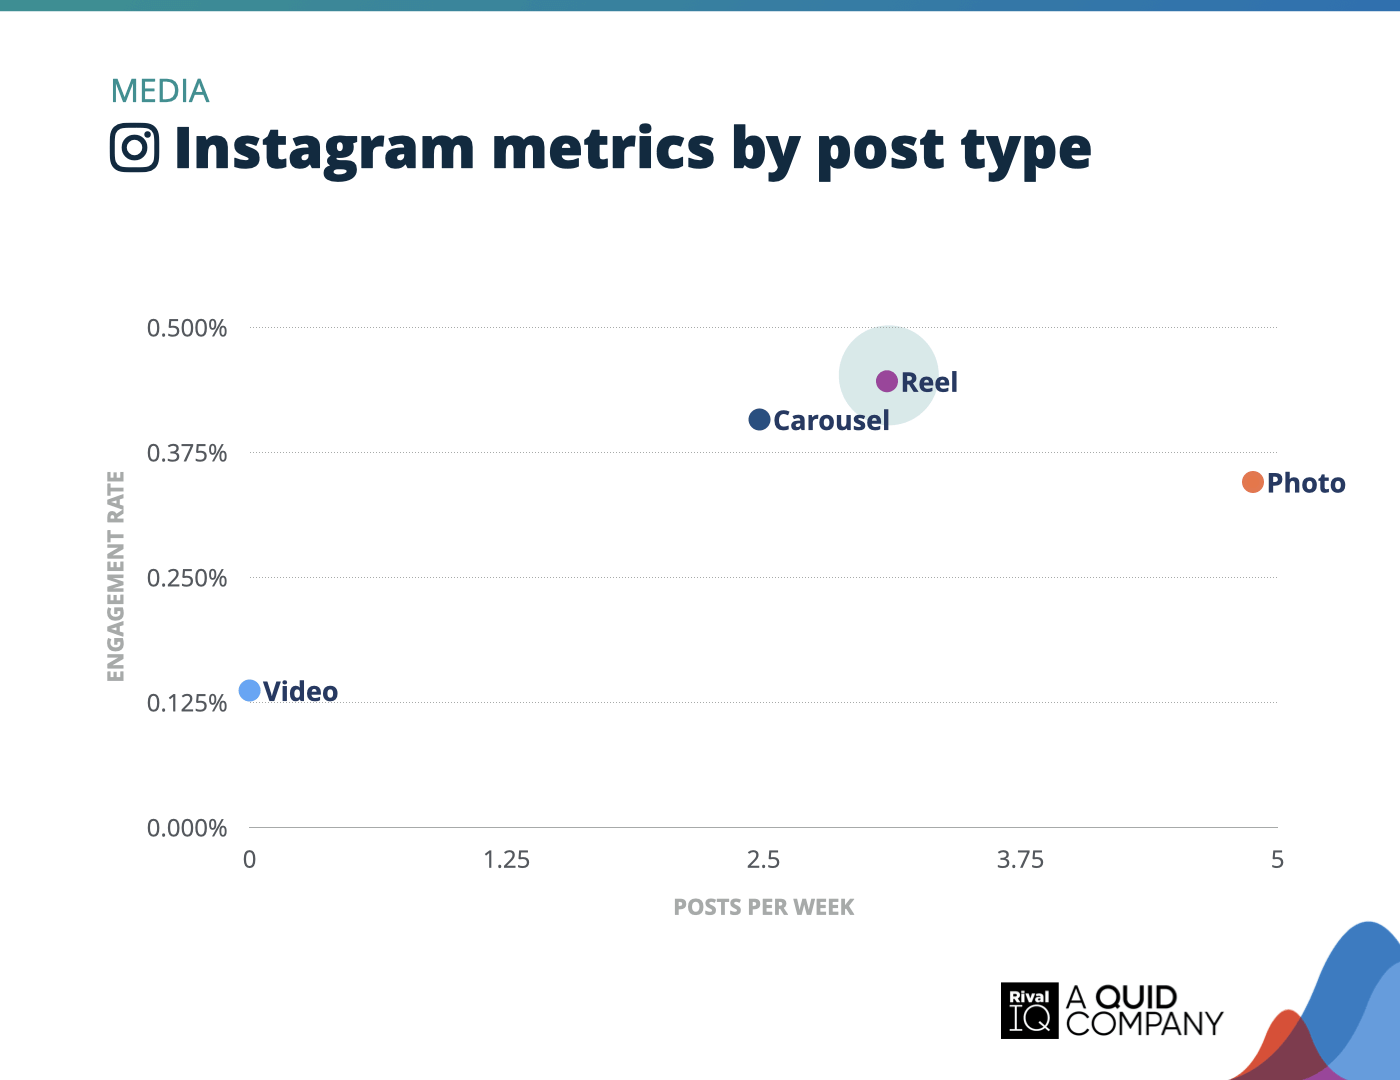
Instagram posts per week and engagement rate by post type, Media
Reels earned more than thrice the engagement rates of video posts for Media brands on Instagram this year.
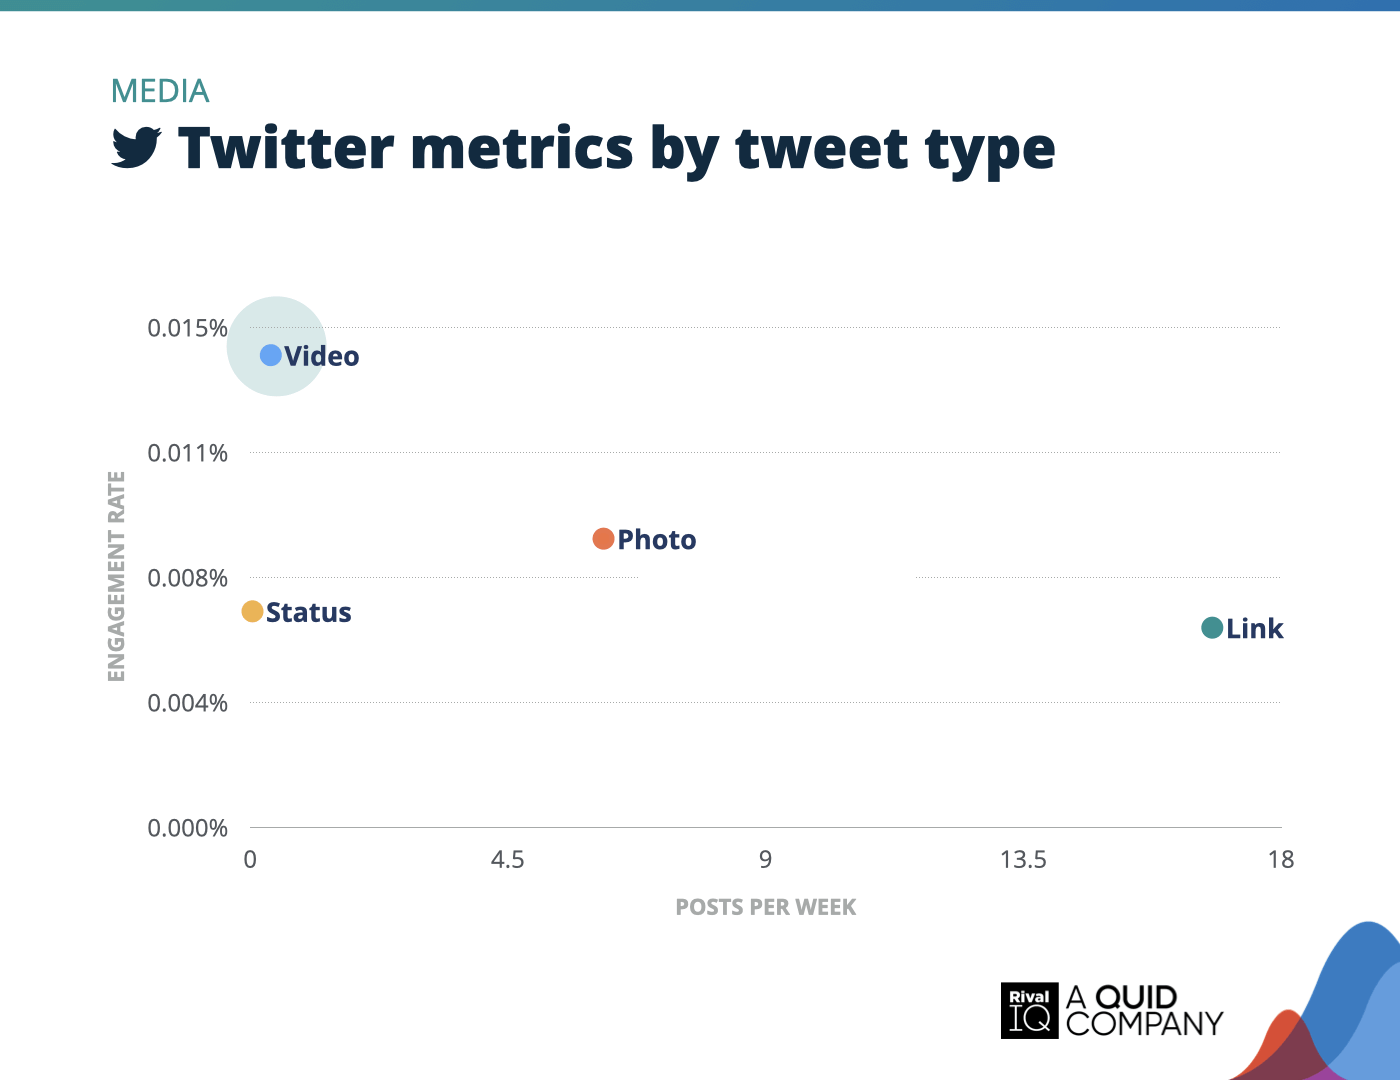
Twitter posts per week and engagement rate by tweet type, Media
Media brands favored link tweets this year, but video tweets pulled in about 2.5x more engagement, signaling an opportunity to shift focus toward richer content.
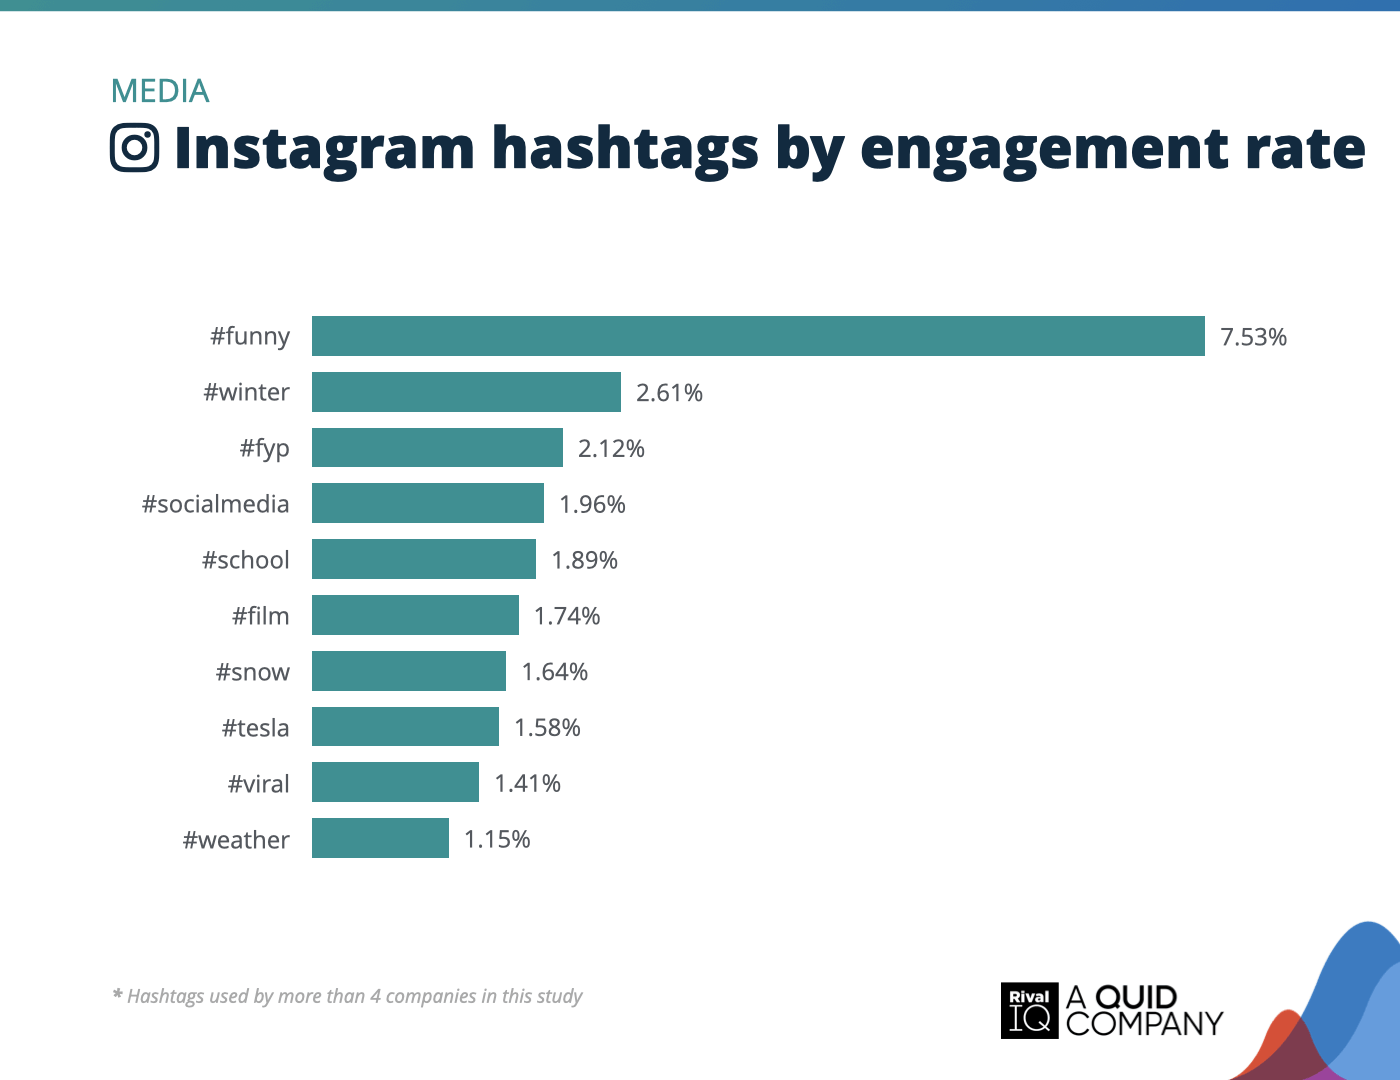
Top Instagram hashtags by engagement rate, Media
Media brands leaned into entertainment on Instagram this year, with hashtags like #funny, #film, and #viral leading engagement.
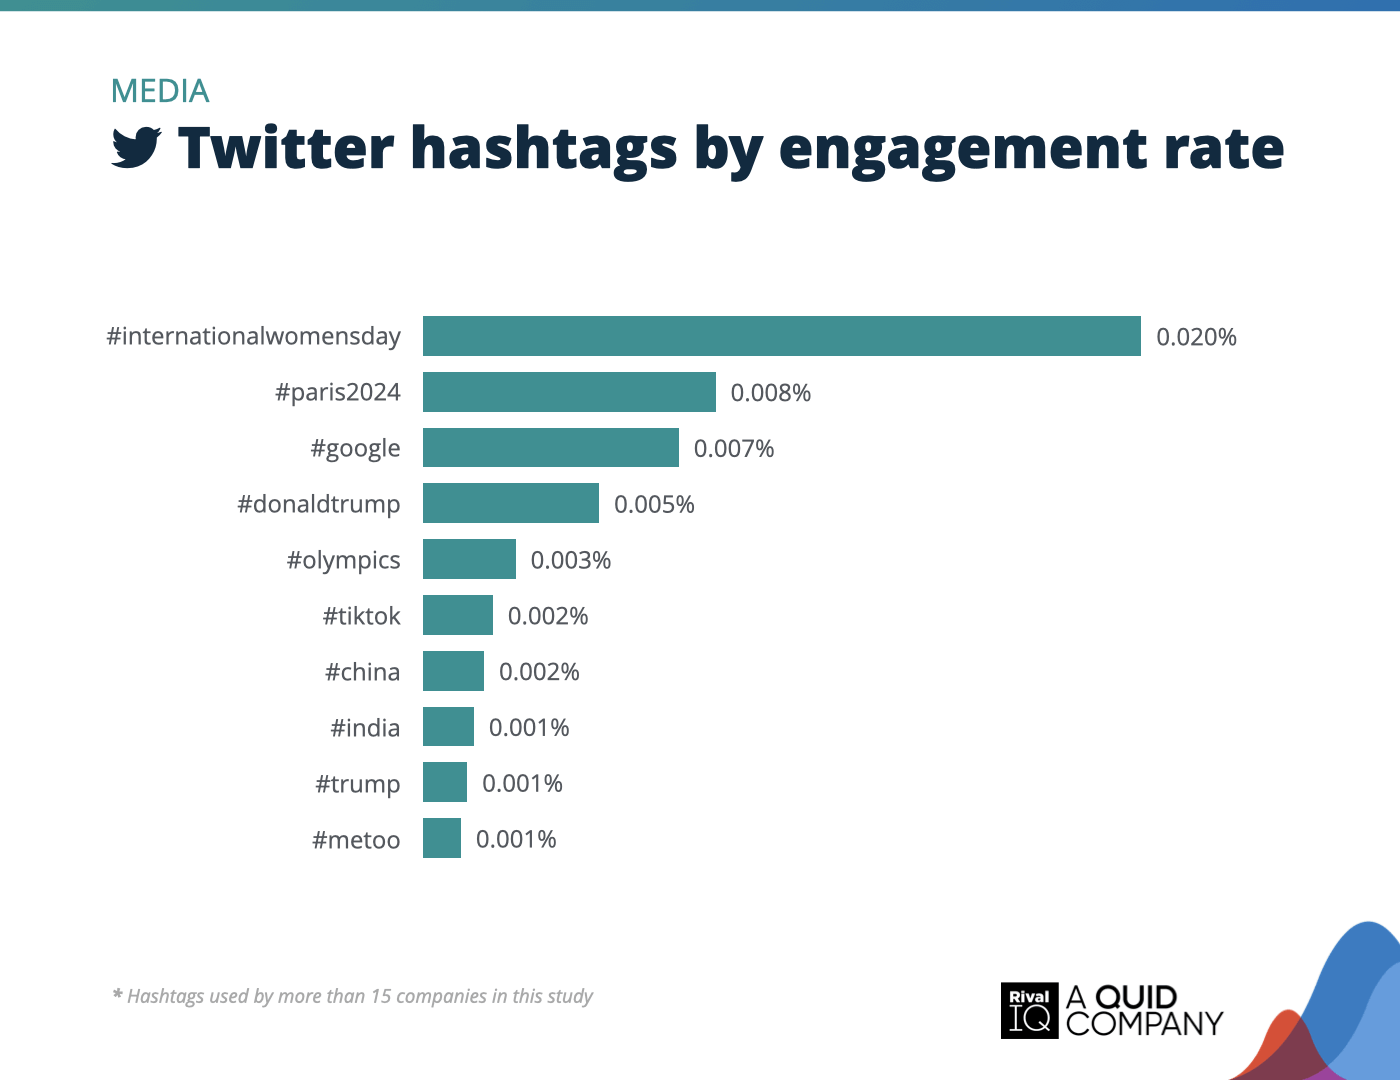
Top Twitter hashtags by engagement rate, Media
Media brands leaned into social issues and major global events on Twitter this year. Hashtags like #paris2024,#internationalwomensday, and #donaldtrump topped engagement charts, proving that timely, newsworthy content continues to resonate with followers.
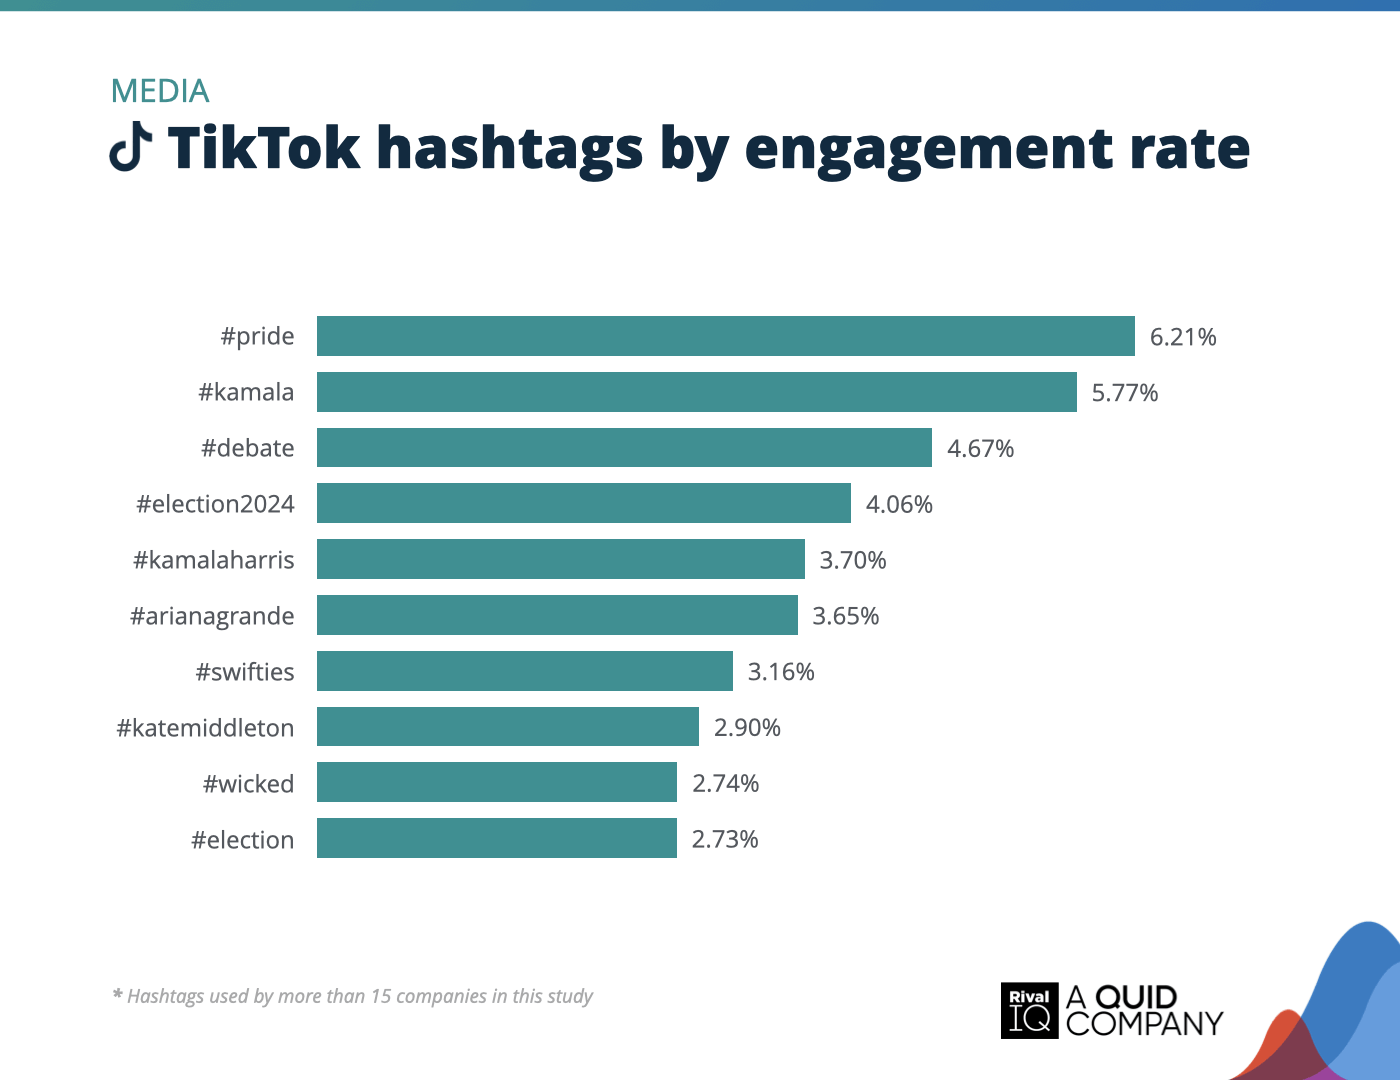
Top TikTok hashtags by engagement rate, Media
Election chatter was a big win for Media brands on TikTok this year, with hashtags like #election2024 and #debate driving solid engagement alongside trending celeb moments.
Nonprofits Social Media Benchmarks
Nonprofits saw above-median engagement rates across all social channels this year and earned the silver on TikTok.
Suggestions for Nonprofits:
- Event-themed hashtags helped followers find your content.
- Keep investing in post types that resonate on each channel.
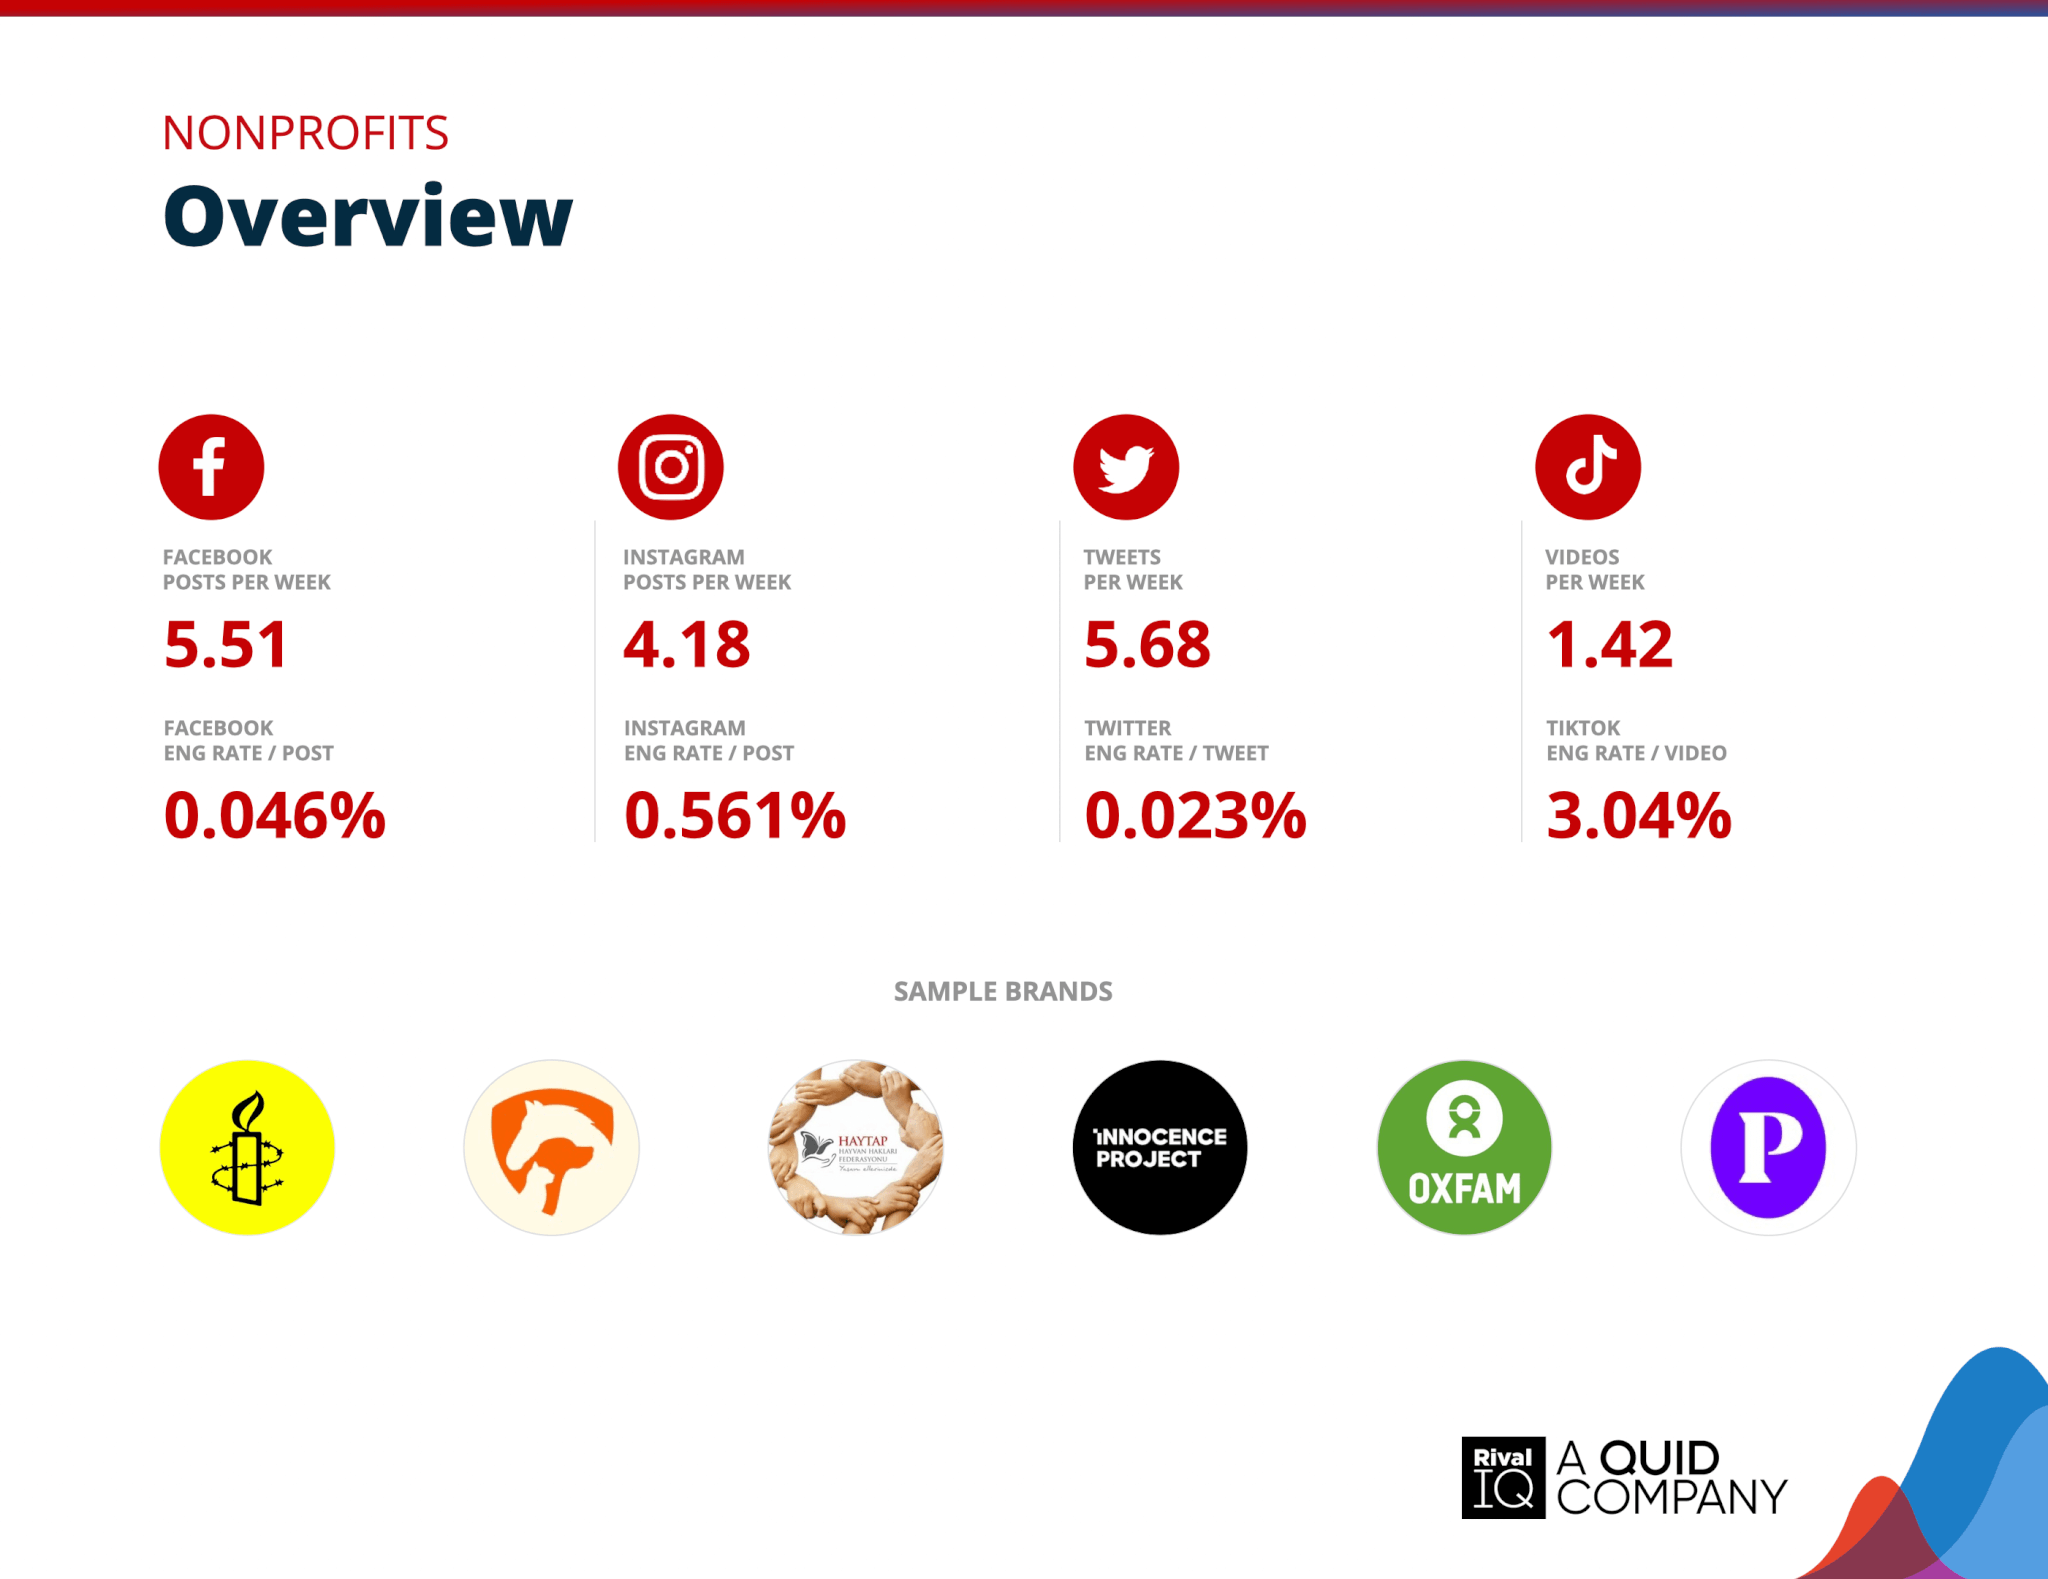
Overview of all benchmarks, Nonprofits
Notable brands in this year’s report include Amnesty International, ASPCA, HAYTAP, Innocence Project, Oxfam, and Pancreatic Cancer UK.
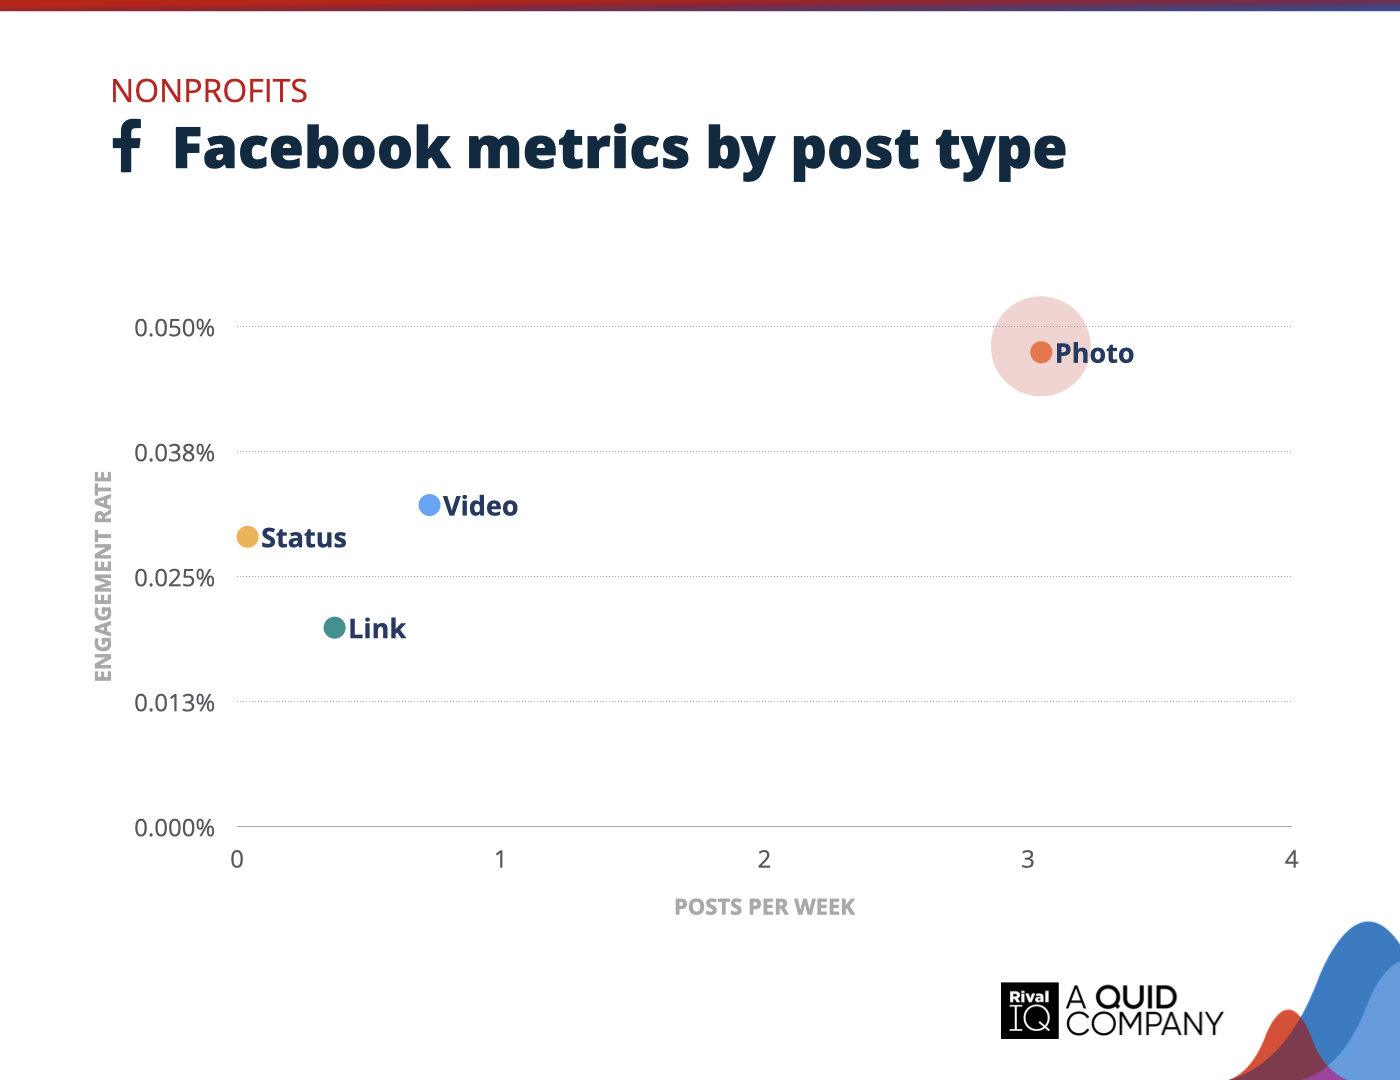
Facebook posts per week and engagement rate by post type, Nonprofits
Photos earned top engagement rates for Nonprofits this year, who shared this post type 3x more often than any other.
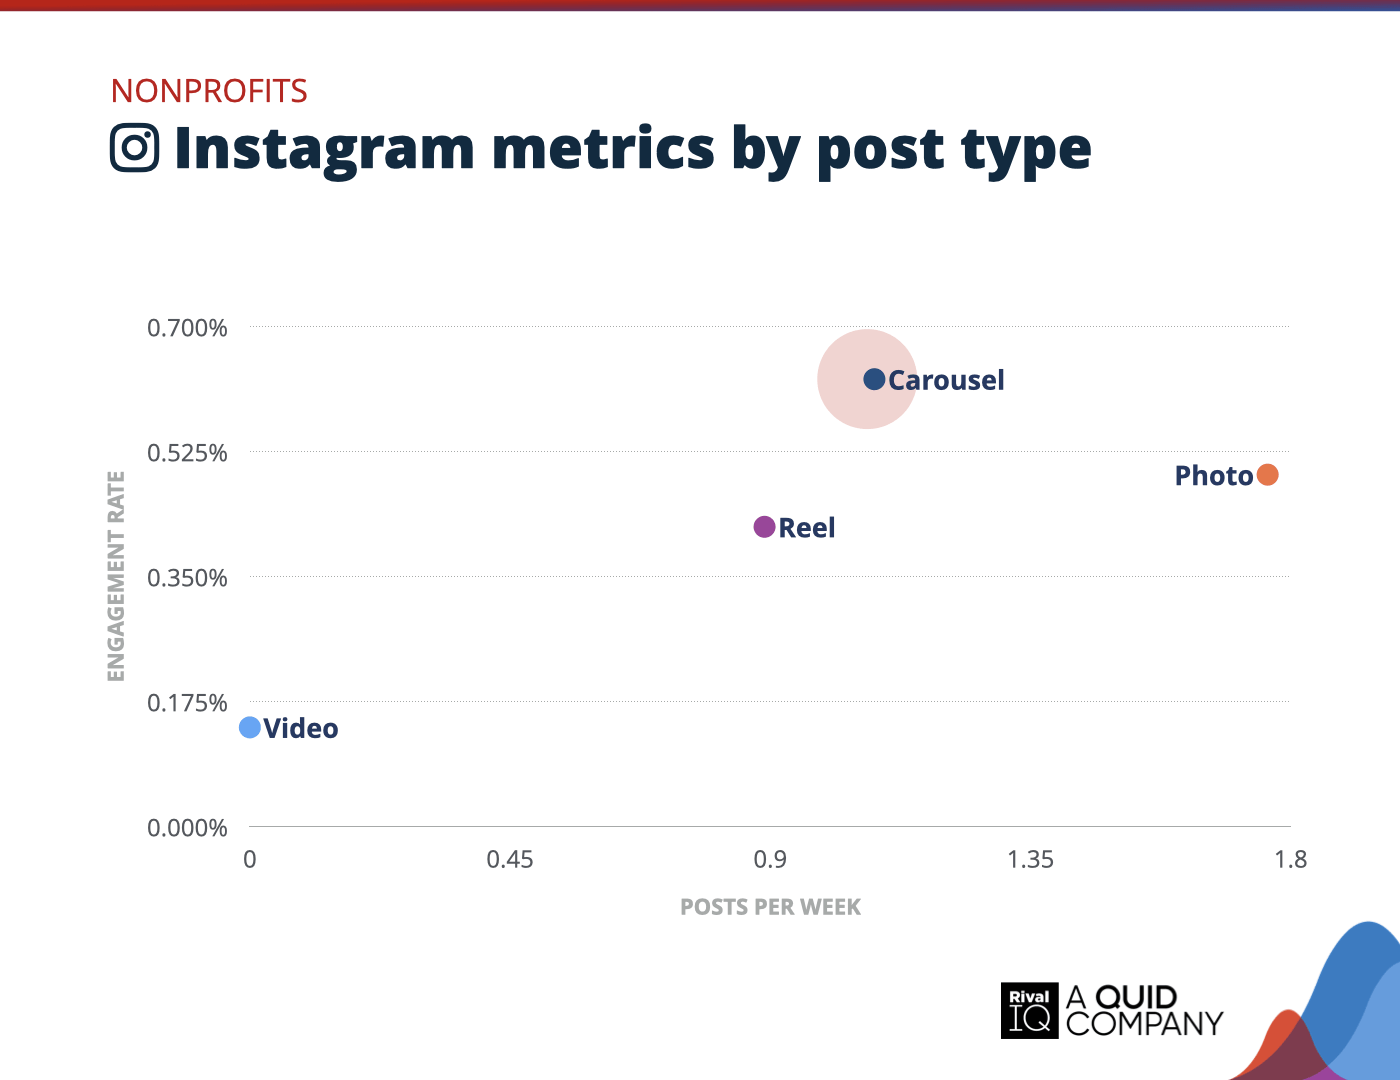
Instagram posts per week and engagement rate by post type, Nonprofits
Carousels outdid other posts types for Nonprofits on Instagram this year, who might want to increase their investment in that post type to capture more of their audience’s attention.
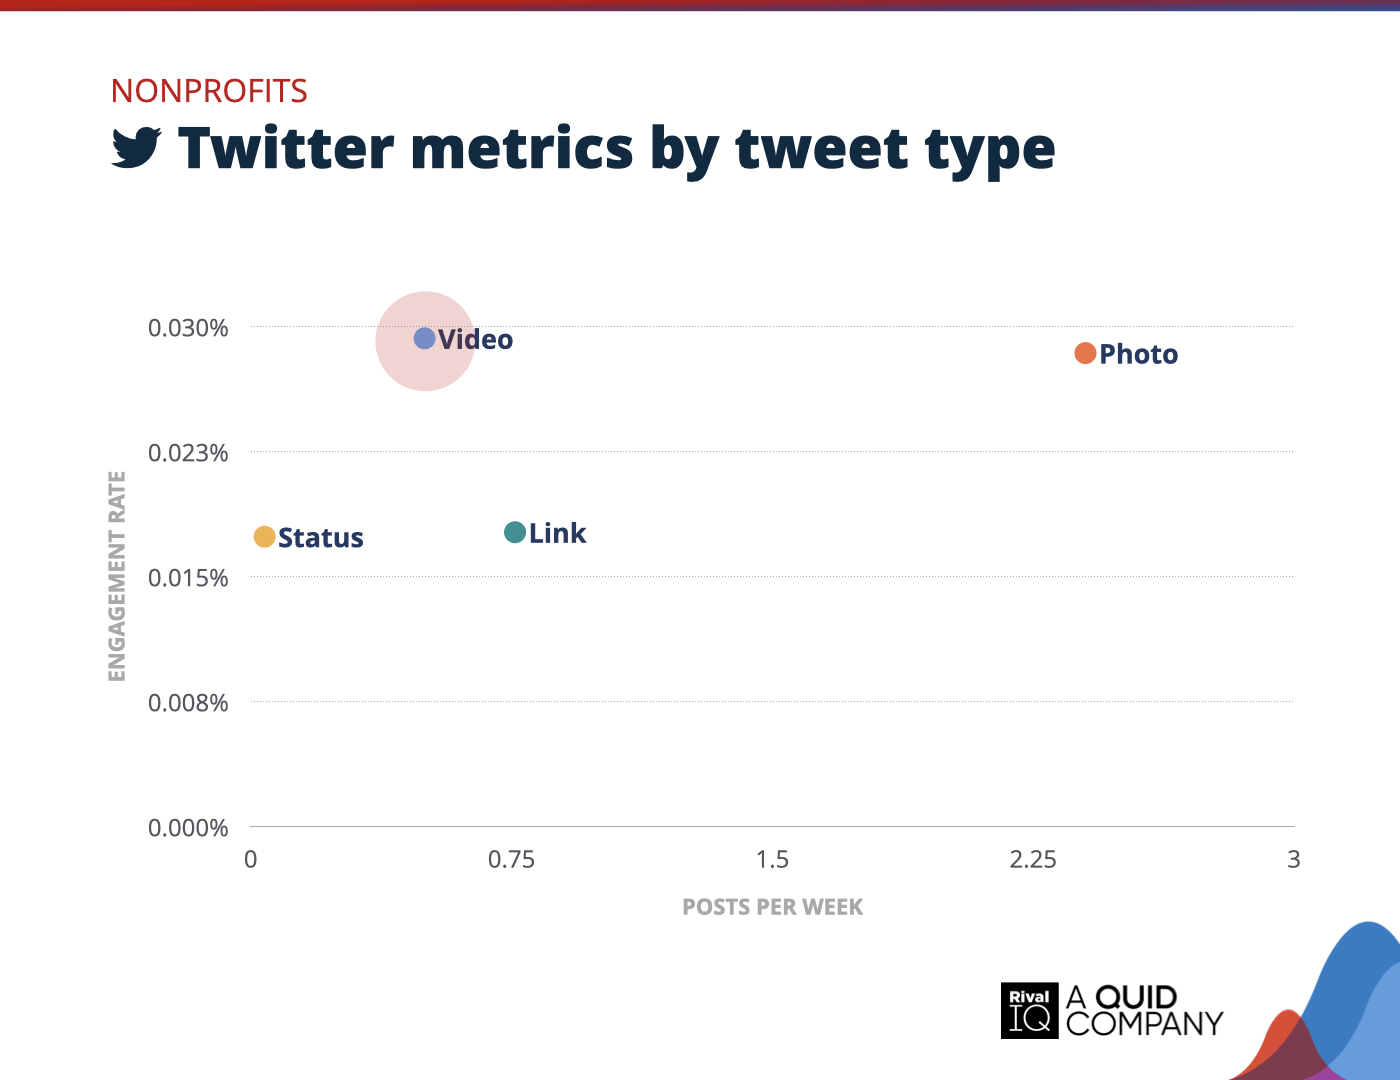
Twitter posts per week and engagement rate by tweet type, Nonprofits
Videos earned top engagement rates for Nonprofits this year on Twitter, but the extra work that goes into producing a video meant photo and link tweets were more common for these organizations.
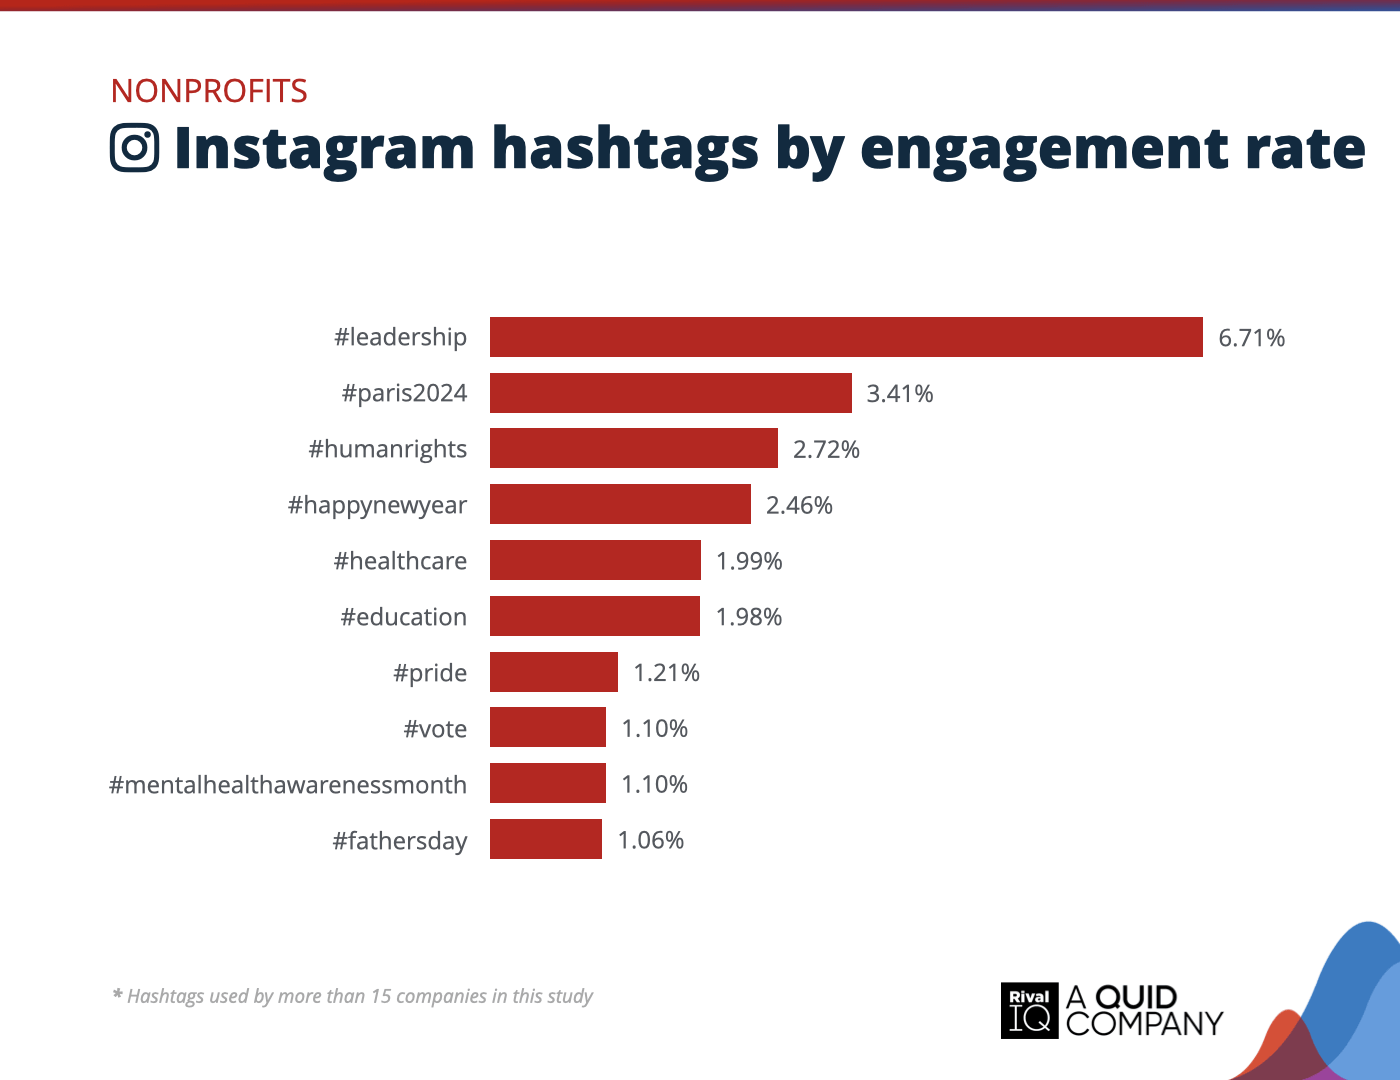
Top Instagram hashtags by engagement rate, Nonprofits
Hashtags tied to social issues and global events drove strong engagement for Nonprofits on Instagram this year. From #paris2024 to #humanrights, followers were eager to connect with causes that matter.
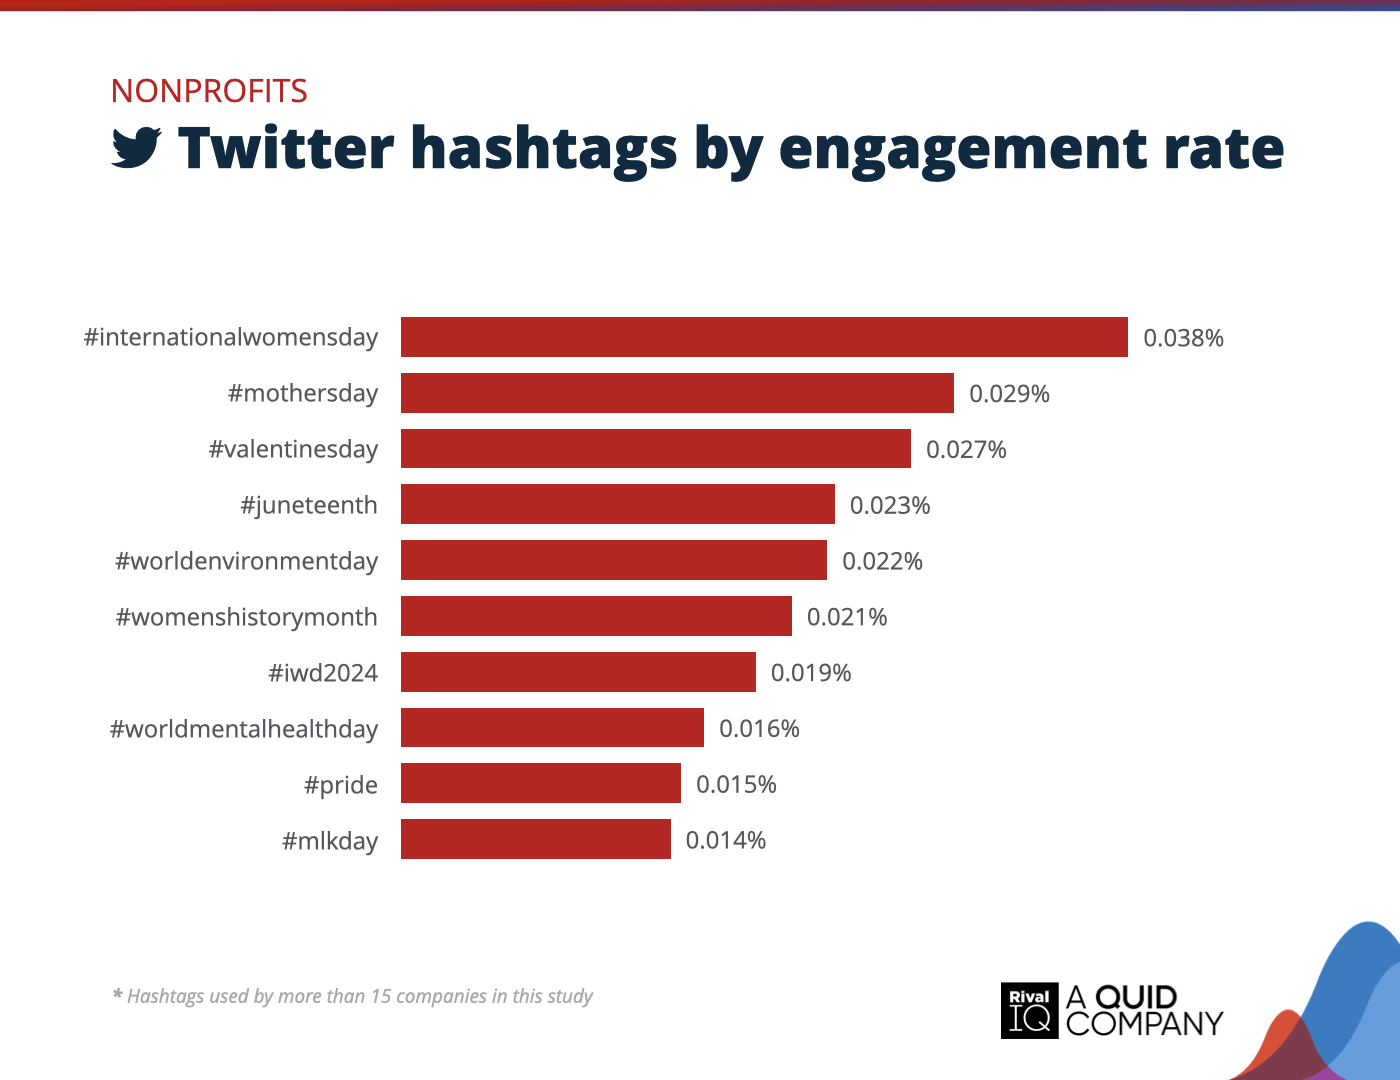
Top Twitter hashtags by engagement rate, Nonprofits
Hashtags tied to awareness days and social causes dominated engagement for Nonprofits on Twitter this year.
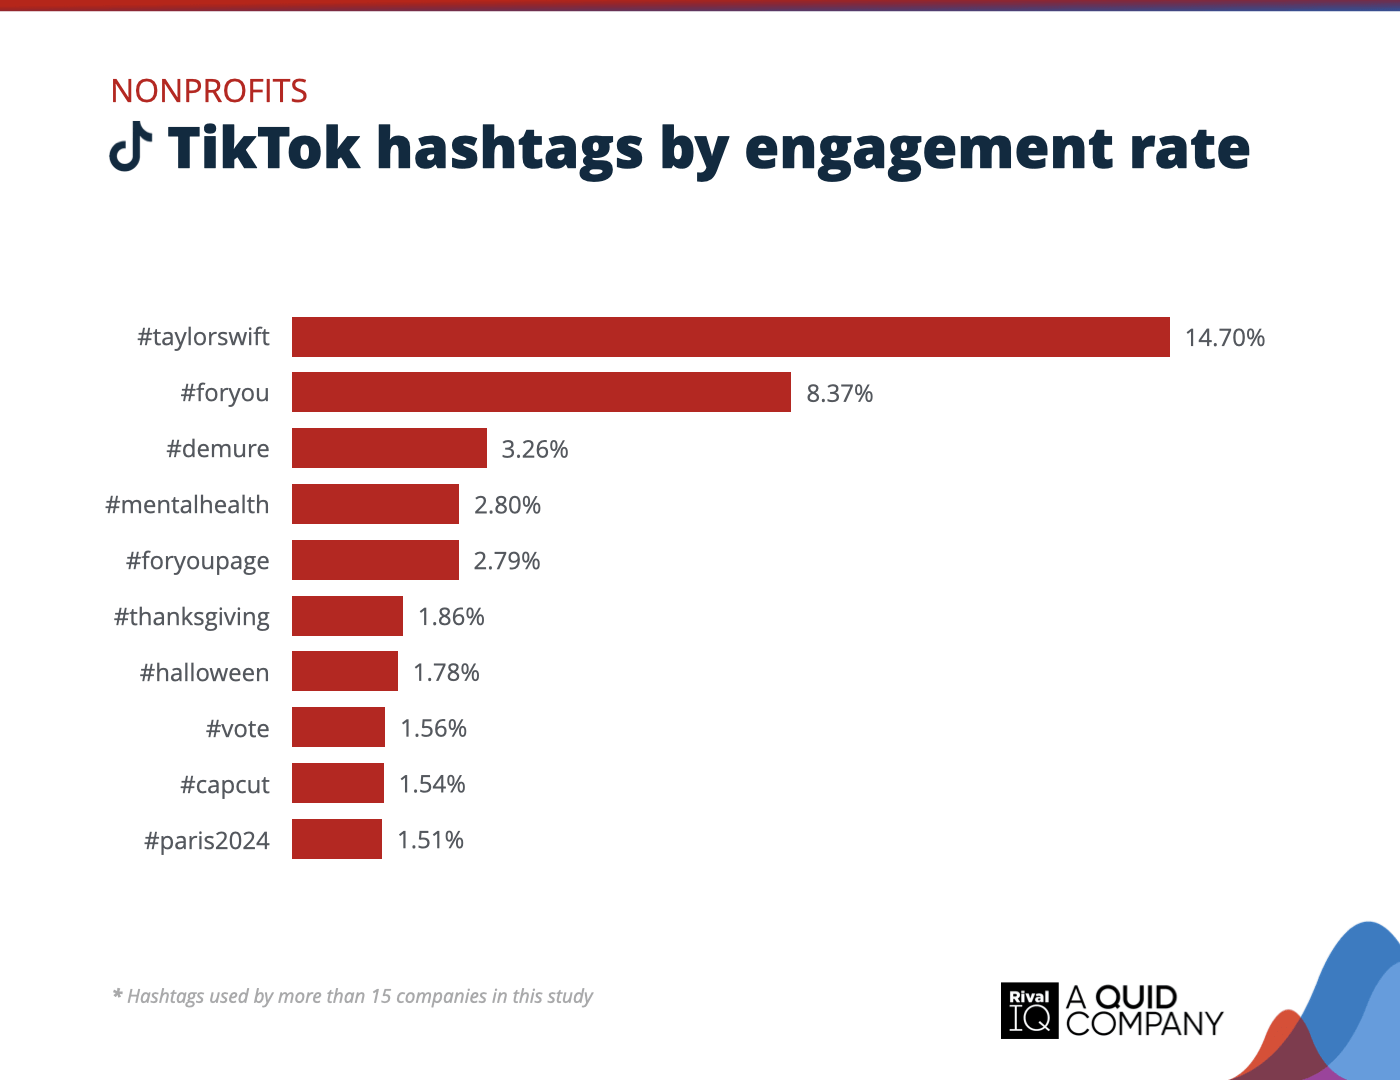
Top TikTok hashtags by engagement rate, Nonprofits
Nonprofits saw strong TikTok engagement with hashtags tied to both social causes and timely events.
Retail Social Media Benchmarks
Retail brands struggled on social media this year, with engagement rates dropping across all channels—most notably on Instagram, where rates fell by over 50% despite more frequent posting.
Some ideas for improving social performance this year:
- Stick with photo posts to help boost engagement, and have some fun experimenting with videos, especially Reels and TikToks.
- Get creative with hashtags like #officelife, and #unboxing to connect with followers in a more playful, everyday way—not just during the holidays!
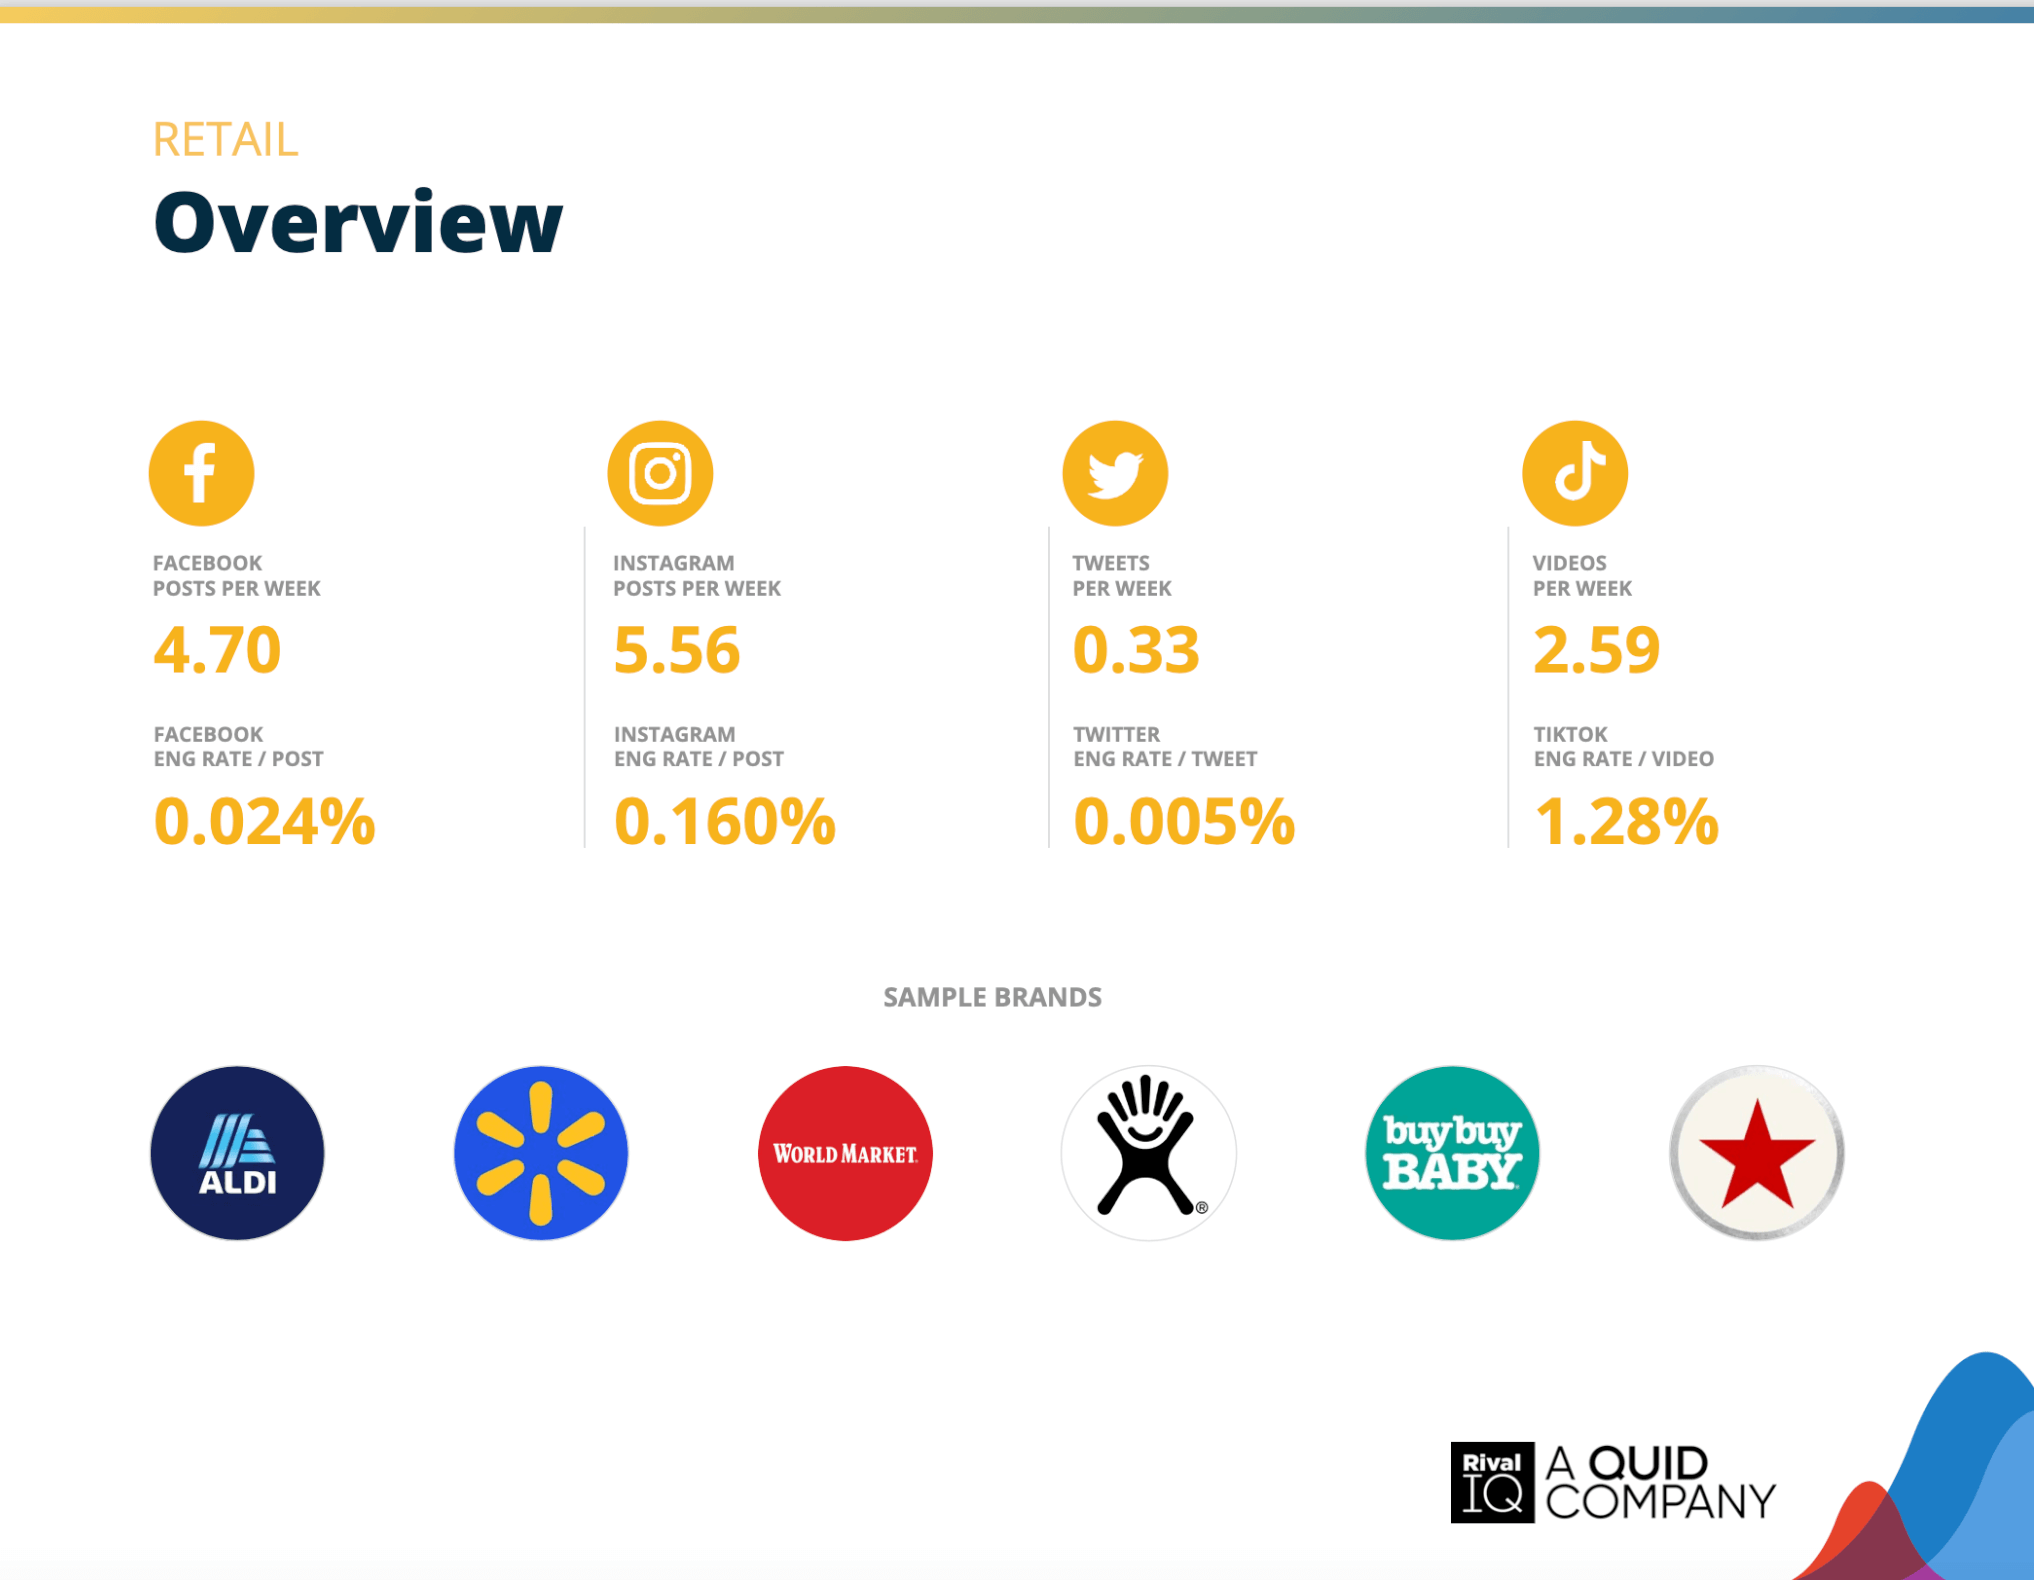
Overview of all benchmarks, Retail
Notable brands in this year’s report include Aldi, Buy Buy Baby, Hydro Flask, Macys, Walmart, and World Market.
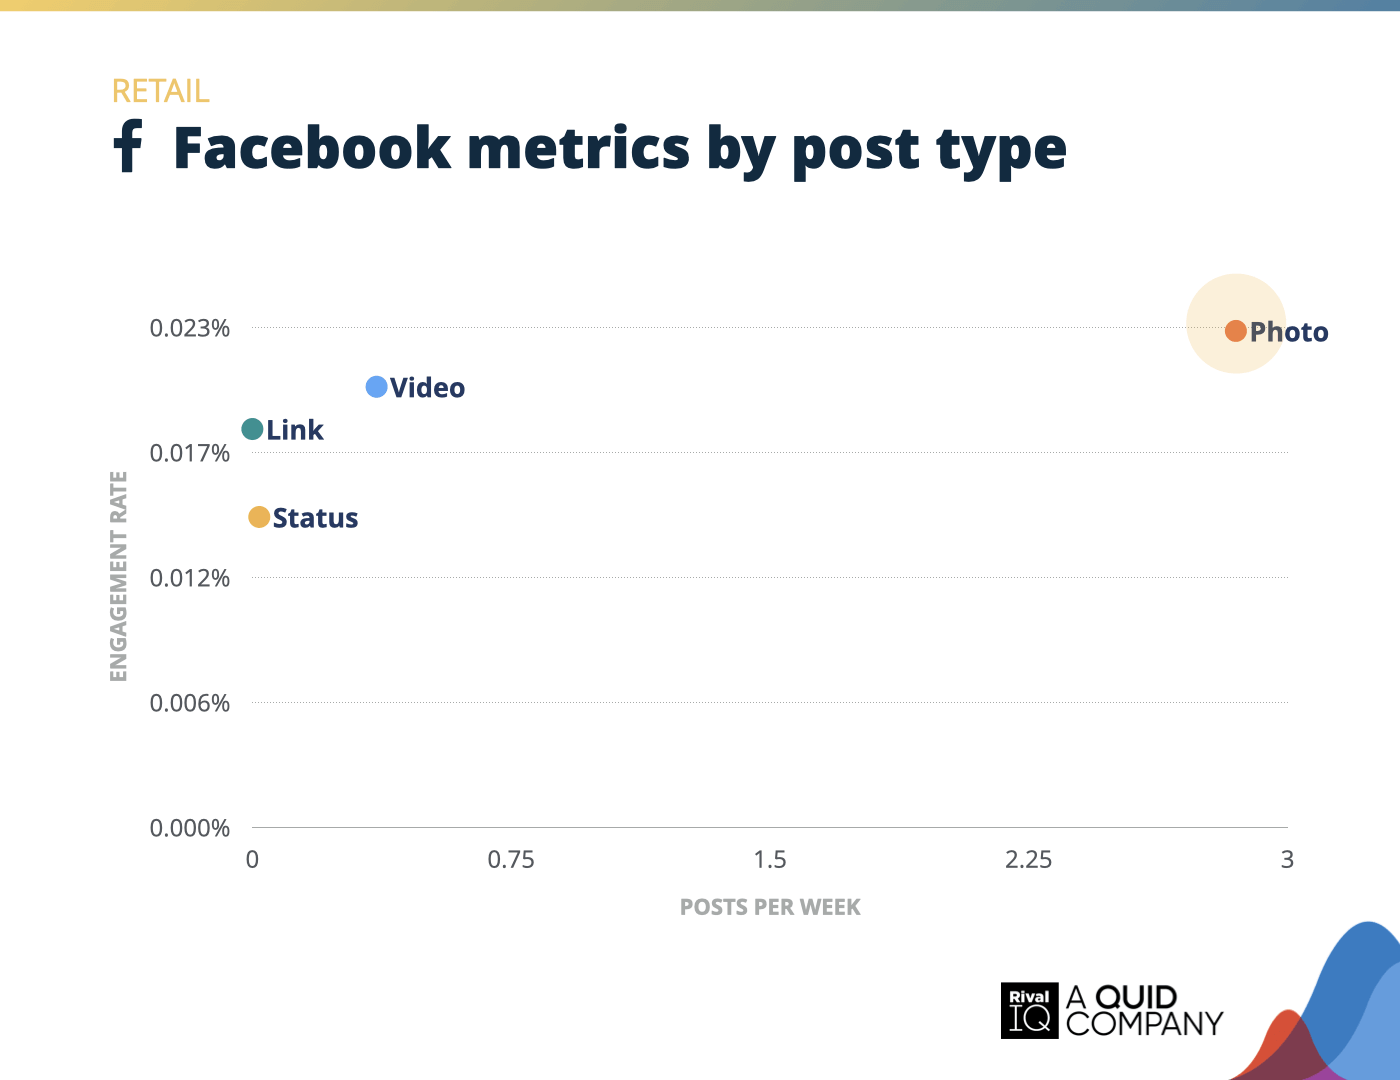
Facebook posts per week and engagement rate by post type, Retail
Retail brands found success with photos on Facebook this year, earning the highest engagement rates across post types. While videos and links saw moderate engagement, photos clearly resonated most and brands leaned into this by posting them 3x more frequently.
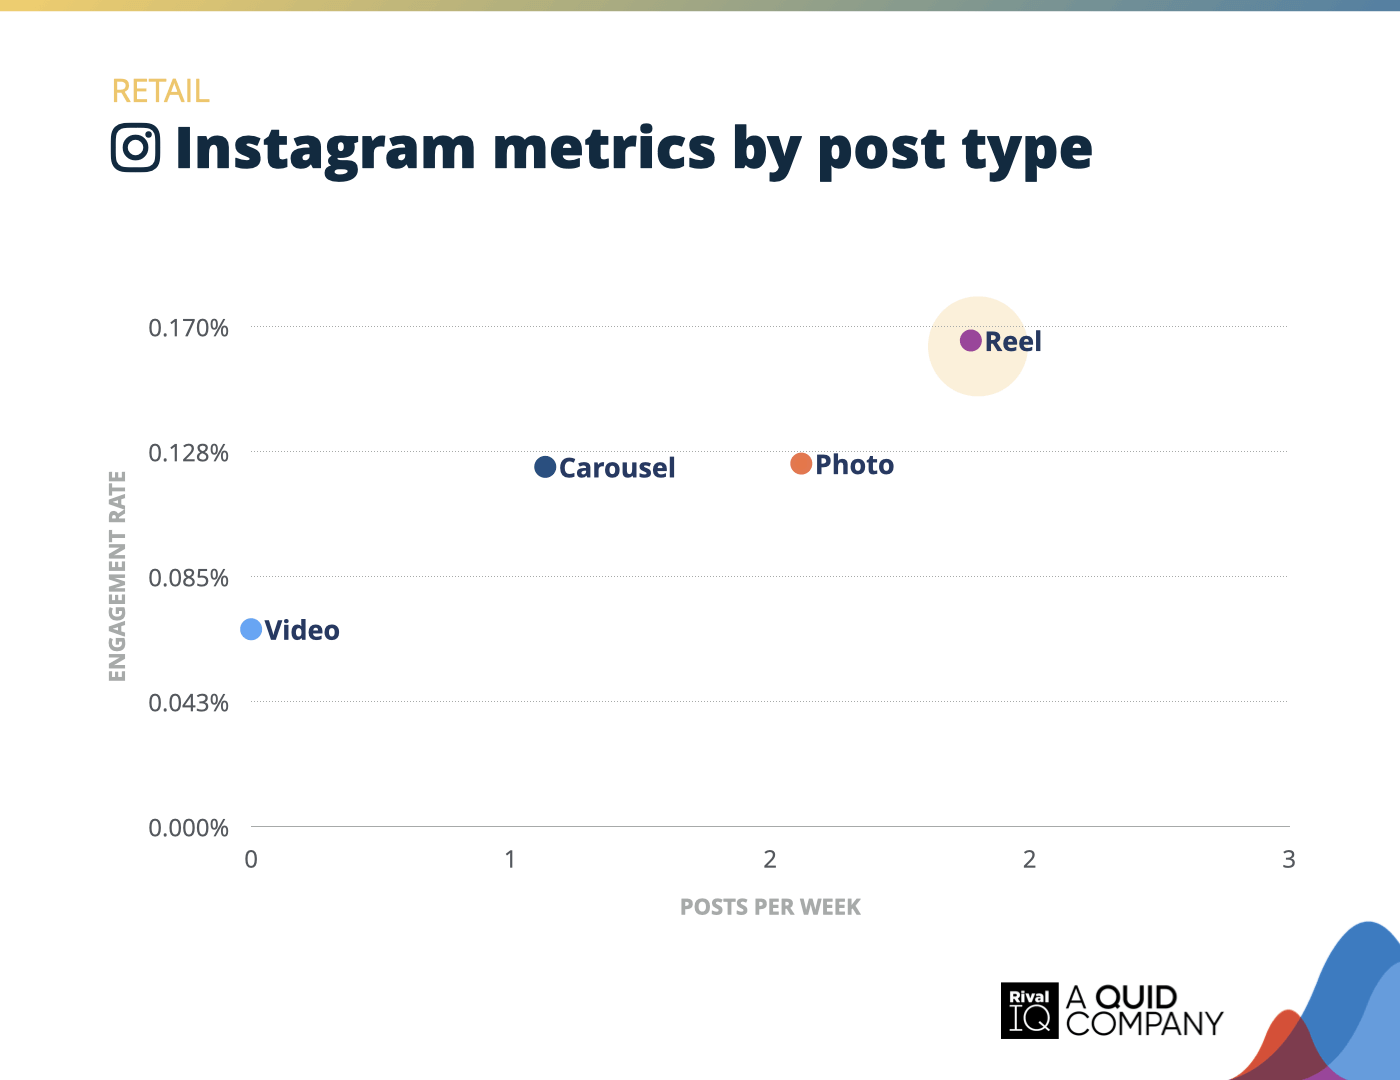
Instagram posts per week and engagement rate by post type, Retail
Reels led the way for Retail brands on Instagram this year, earning the highest engagement rates among post types.
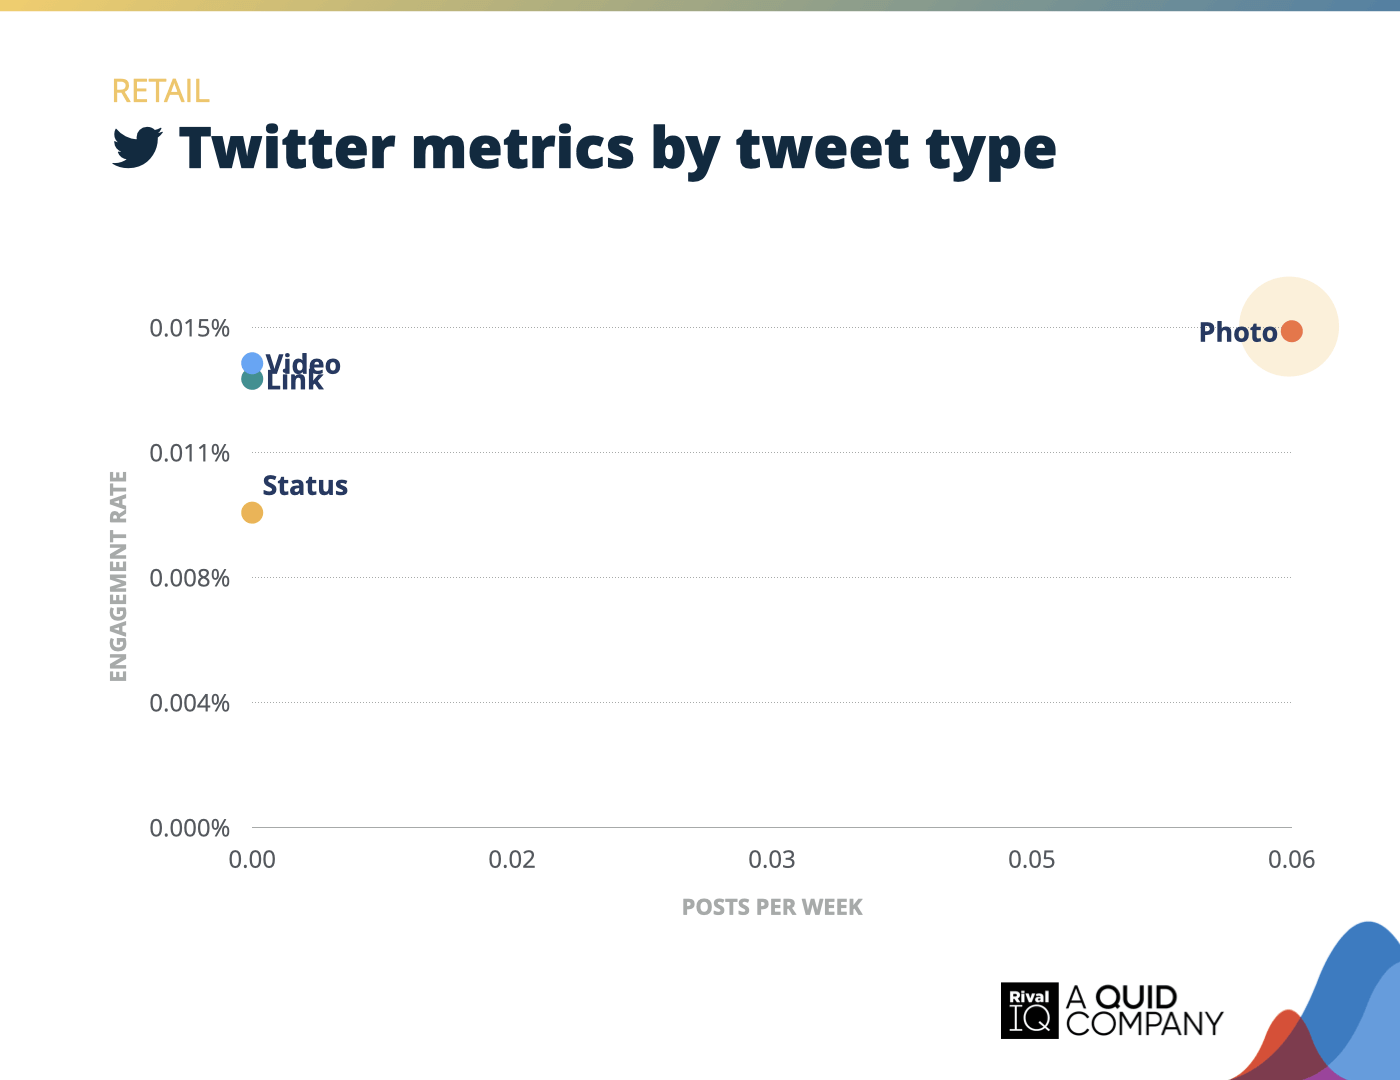
Twitter posts per week and engagement rate by tweet type, Retail
Photos earned the highest engagement rates for Retail brands on Twitter this year, but videos and links weren’t far behind. Despite this, Retail brands hardly posted videos, links, or status updates, suggesting an opportunity to diversify content.
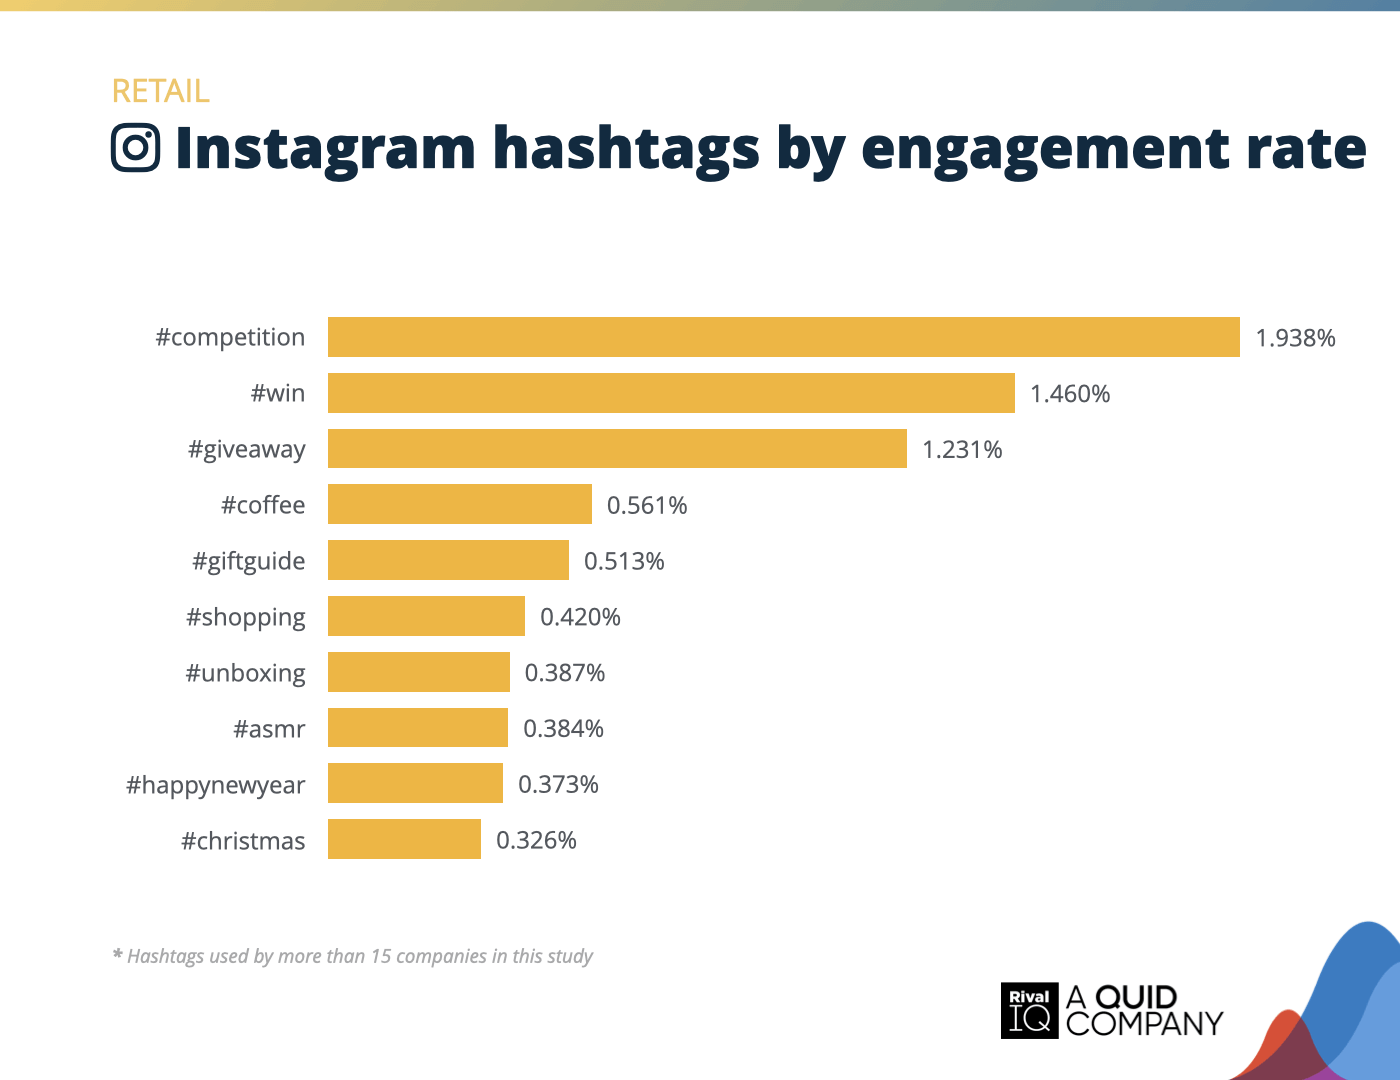
Top Instagram hashtags by engagement rate, Retail
Retail brands leaned into contest-themed hashtags on Instagram this year, with #competition, #win, and #giveaway topping the charts for engagement.
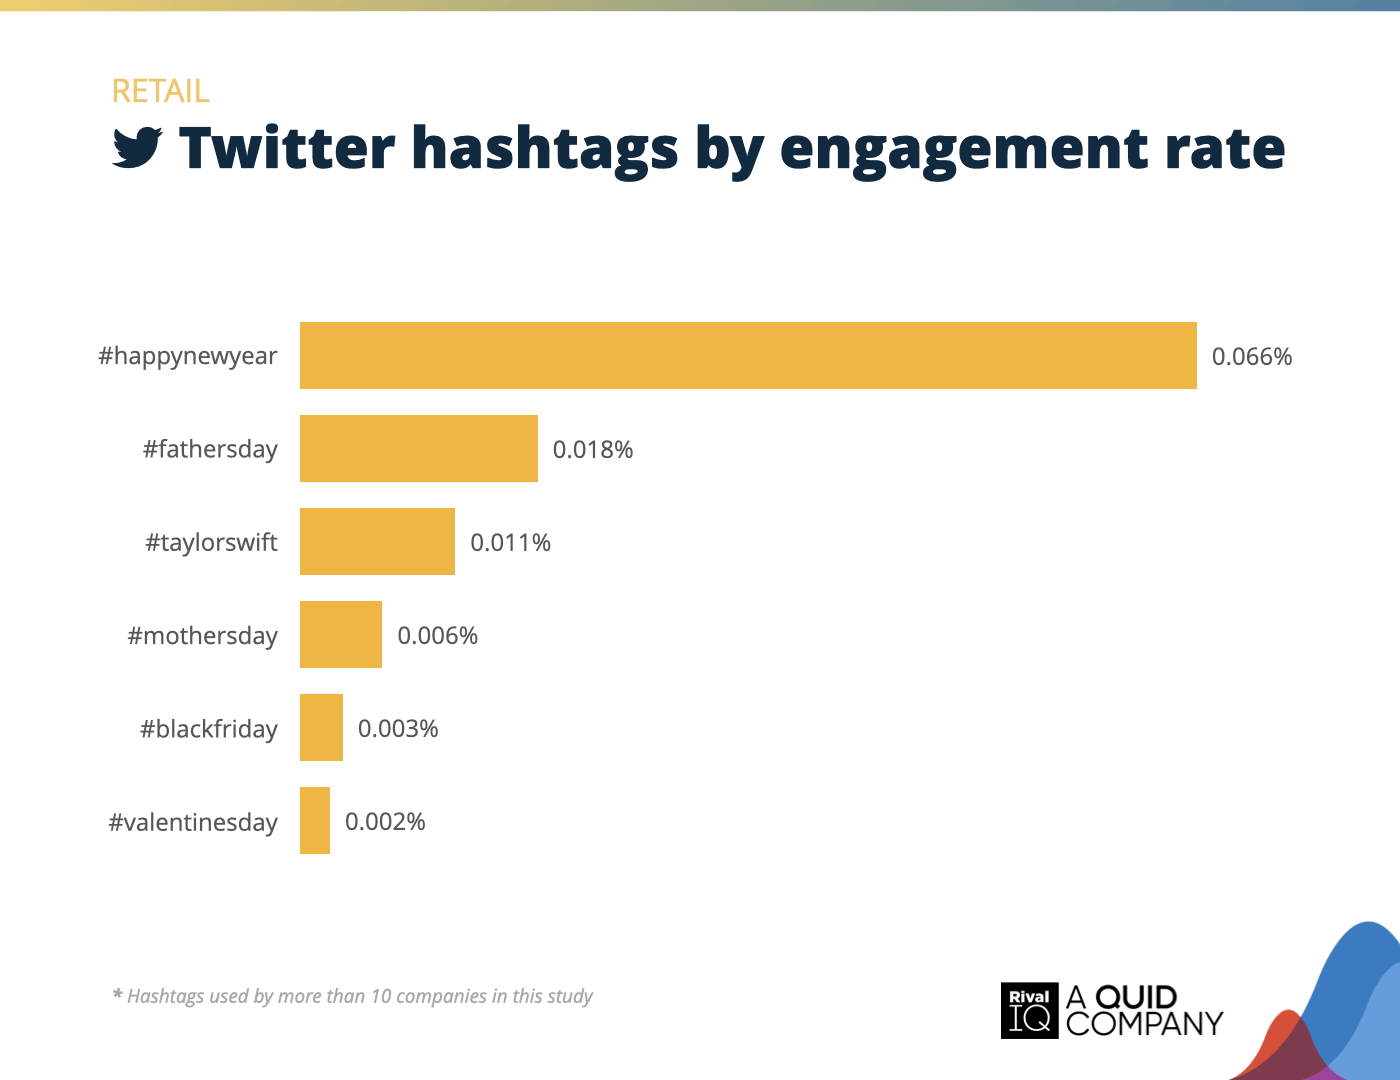
Top Twitter hashtags by engagement rate, Retail
Retail brands got festive on Twitter this year, but it was #taylorswift, #happynewyear, and #fathersday that stole the spotlight, beating out classic shopping events like #blackfriday.
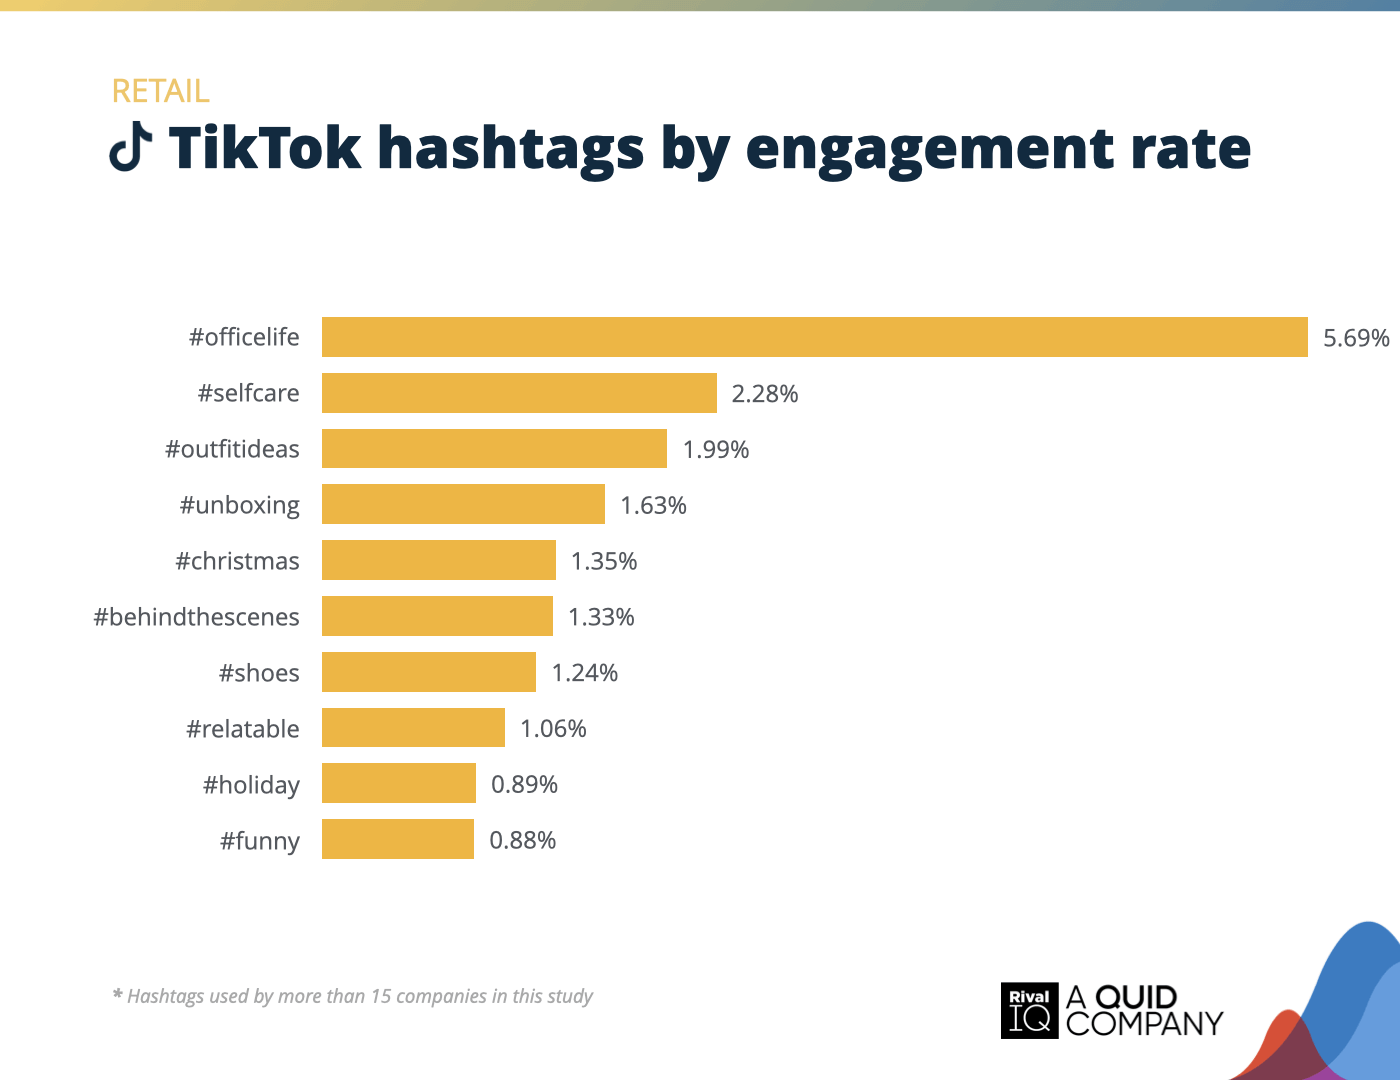
Top TikTok hashtags by engagement rate, Retail
Retail brands leaned into lifestyle content on TikTok this year, with hashtags like #officelife, #selfcare, and #outfitideas earning top engagement. Turns out, followers love a little behind-the-scenes peek while they shop!
Sports Teams Social Media Benchmarks
Once again, Sports Teams saw top engagement rates on Facebook and Twitter and were runners-up on Instagram. More posting doesn’t always equal more engagements, but it certainly did for Sports Teams this year.
Some ways to improve engagement rates even more:
- Keep the content coming—frequent posting is clearly winning over fans.
- Play into fans’ love of nostalgia with throwback hashtags like #onthisday and #tbt.
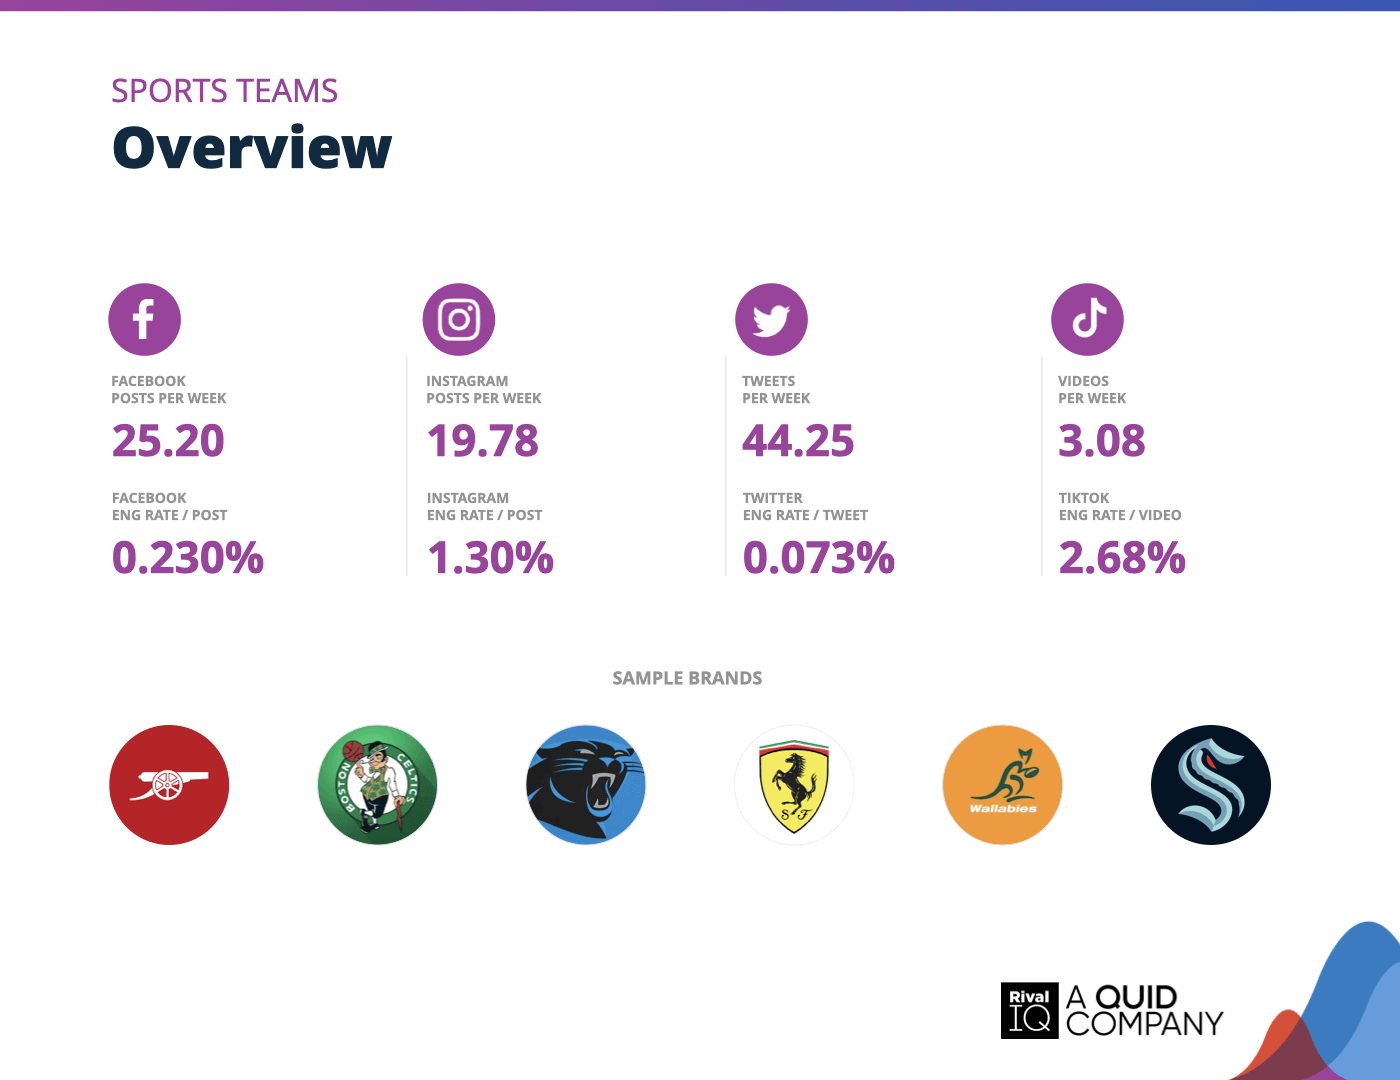
Overview of all benchmarks, Sports Teams
Notable brands in this year’s report include Arsenal, Boston Celtics, Carolina Panthers, Seattle Kraken, Scuderia Ferrari, and Wallabies.

Facebook posts per week and engagement rate by post type, Sports Teams
Photo posts helped Sports Teams earn nearly 5x the median engagement rate on Facebook, putting these brands comfortably in first place.
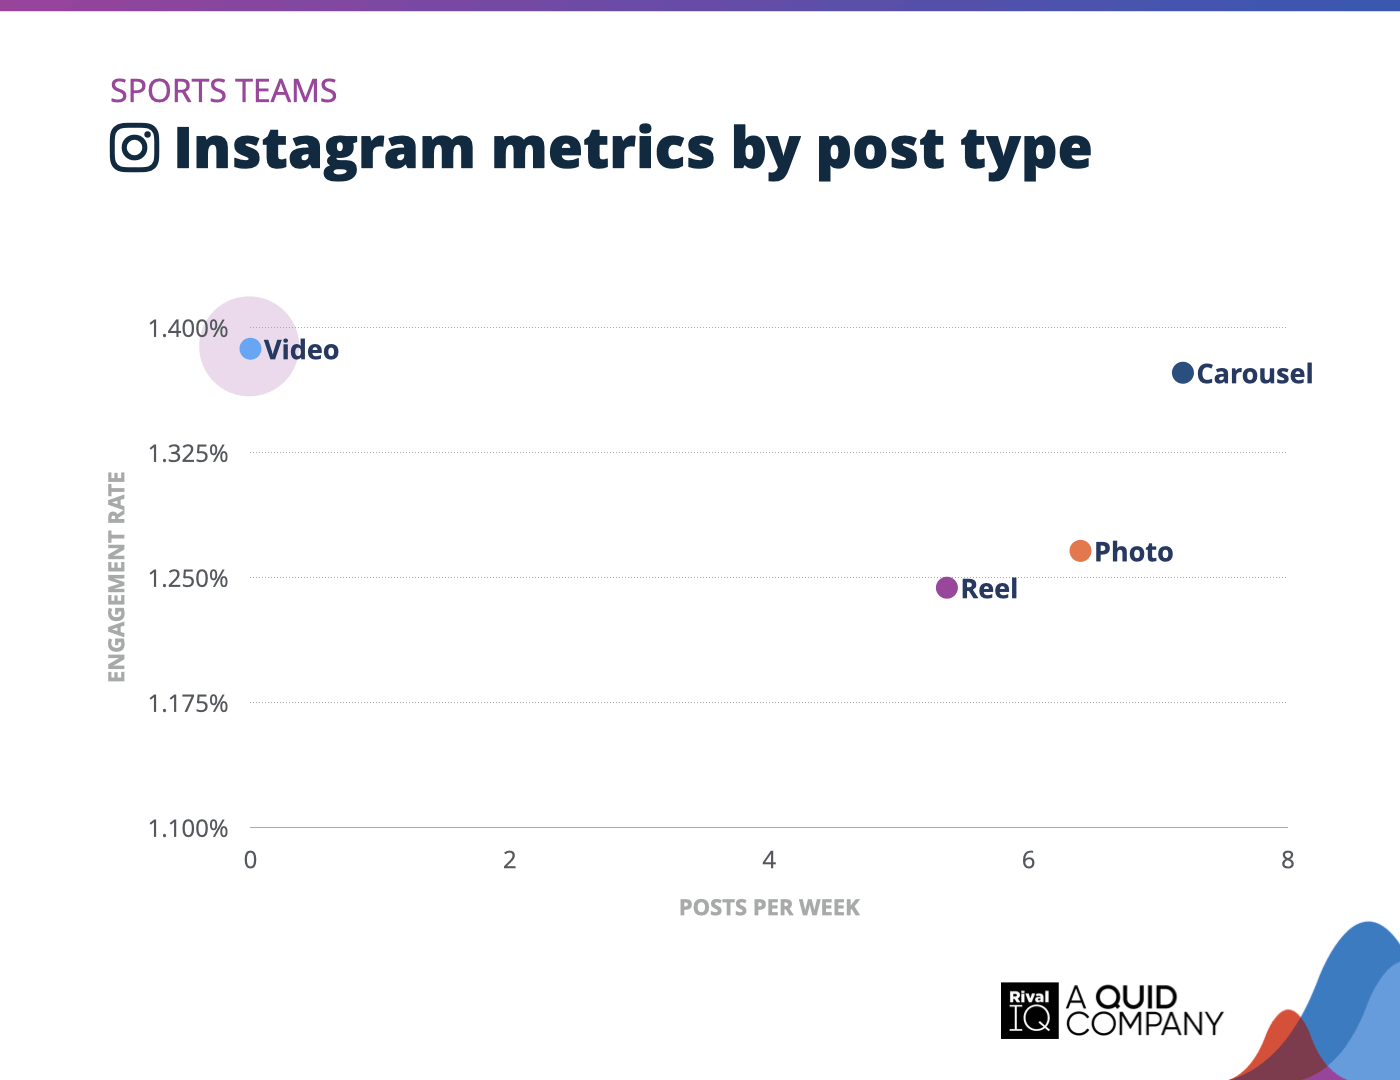
Instagram posts per week and engagement rate by post type, Sports Teams
Video posts stole the show for Sports Teams on Instagram this year, pulling ahead of the more frequently posted Reels, Carousels, and Photos.
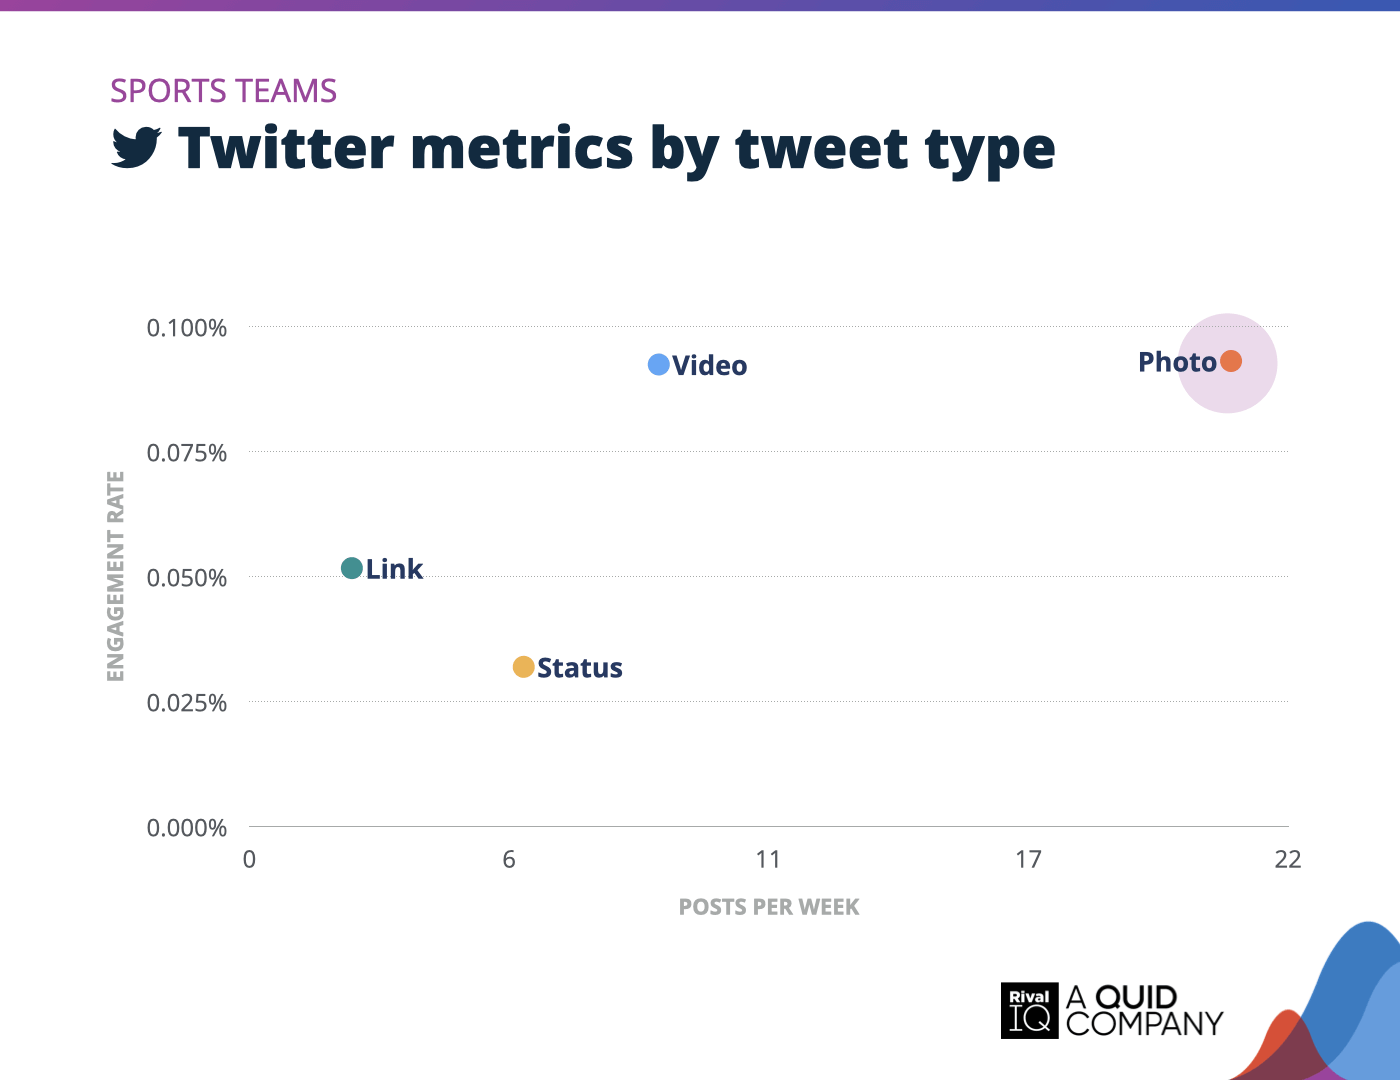
Twitter posts per week and engagement rate by tweet type, Sports Teams
Photos were the MVPs for Sports Teams on Twitter this year, but videos were a strong runner-up with higher engagement despite fewer posts.
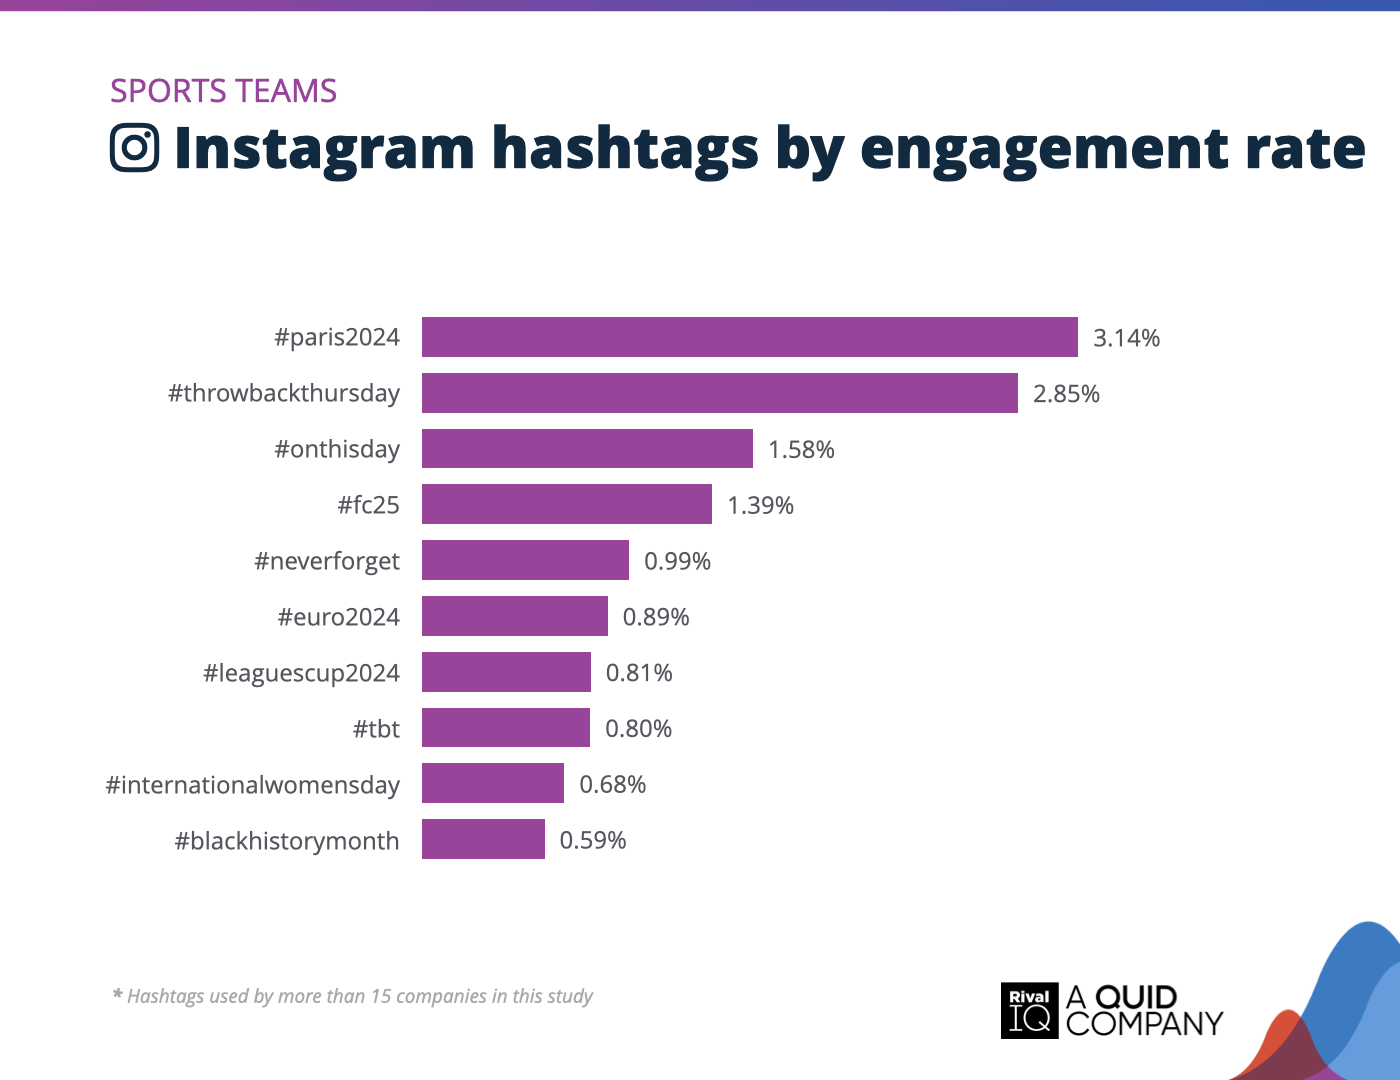
Top Instagram hashtags by engagement rate, Sports Teams
Sports Teams went all-in on major events and memorable moments on Instagram this year, with hashtags like #paris2024 and #throwbackthursday leading the pack.
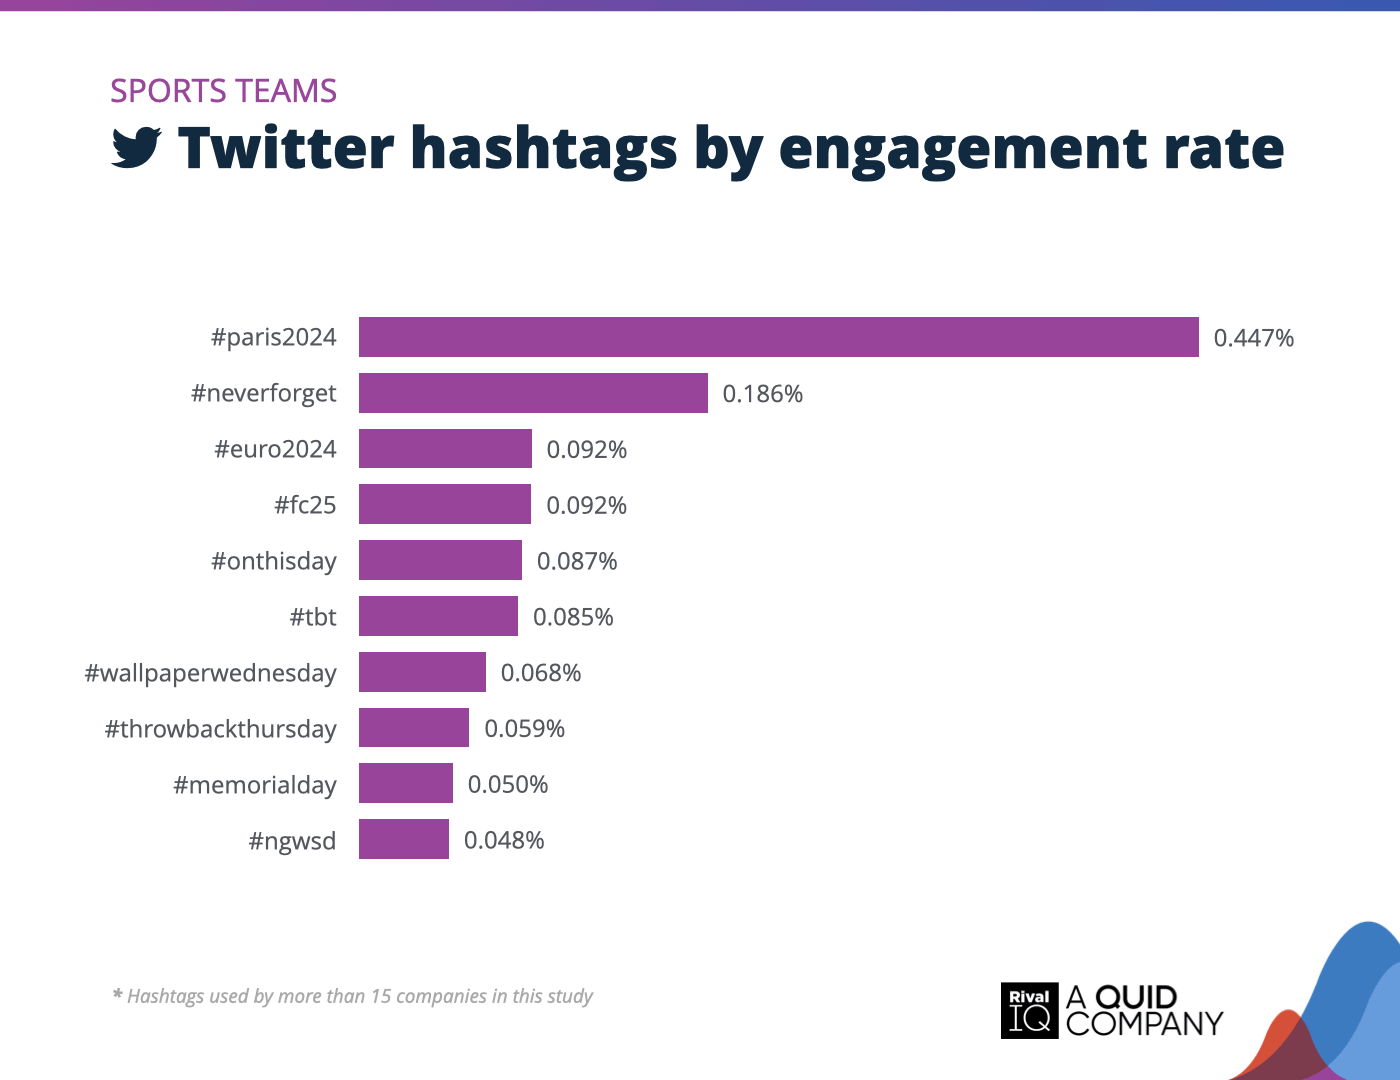
Top Twitter hashtags by engagement rate, Sports Teams
Sports teams kept the nostalgia alive on Twitter this year with throwback hashtags like #onthisday and #tbt, helping fans relive memorable moments.
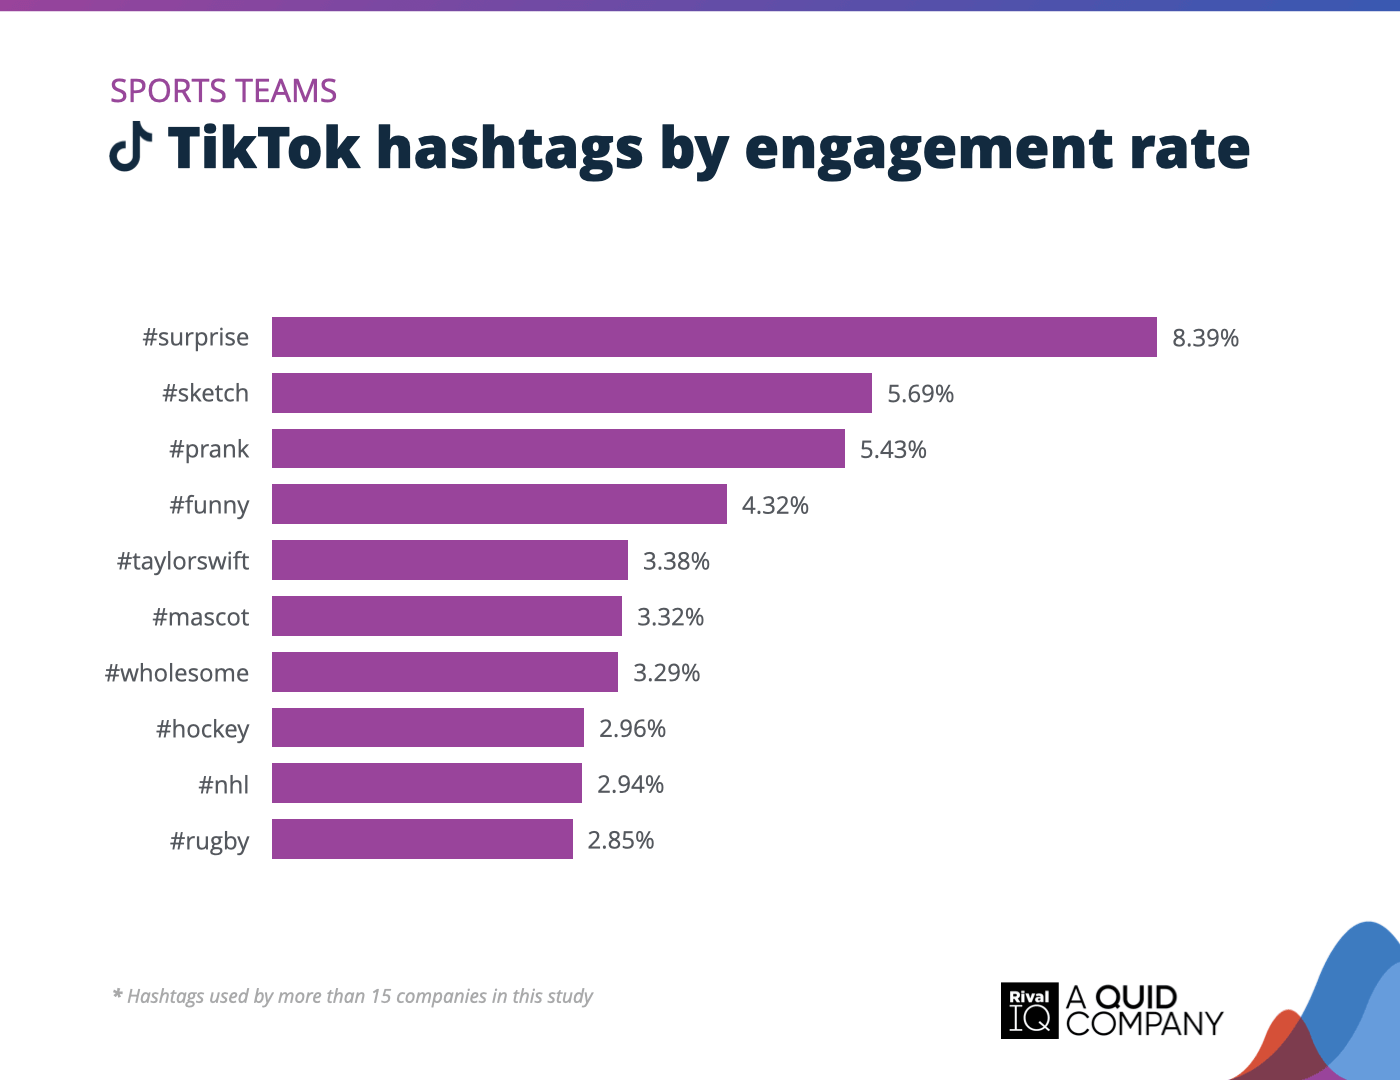
Top TikTok hashtags by engagement rate, Sports Teams
Sports teams brought the fun to TikTok this year, mixing playful hashtags like #prank, #funny, and #mascot with pop culture hits like #taylorswift.
Tech & Software Social Media Benchmarks
Engagement rates dipped for Tech & Software brands across all channels this year. Posting slowed down too, except on Twitter, where a small engagement boost showed some promise.
Here are two ideas for improving engagement rates:
- Carousels outshined other post types on Instagram, even though they were posted less often—time to give them a whirl!
- Hashtags like #marketing and playful picks like #foryou and #funny kept things lively. Mixing in more of these could help reignite follower interest.
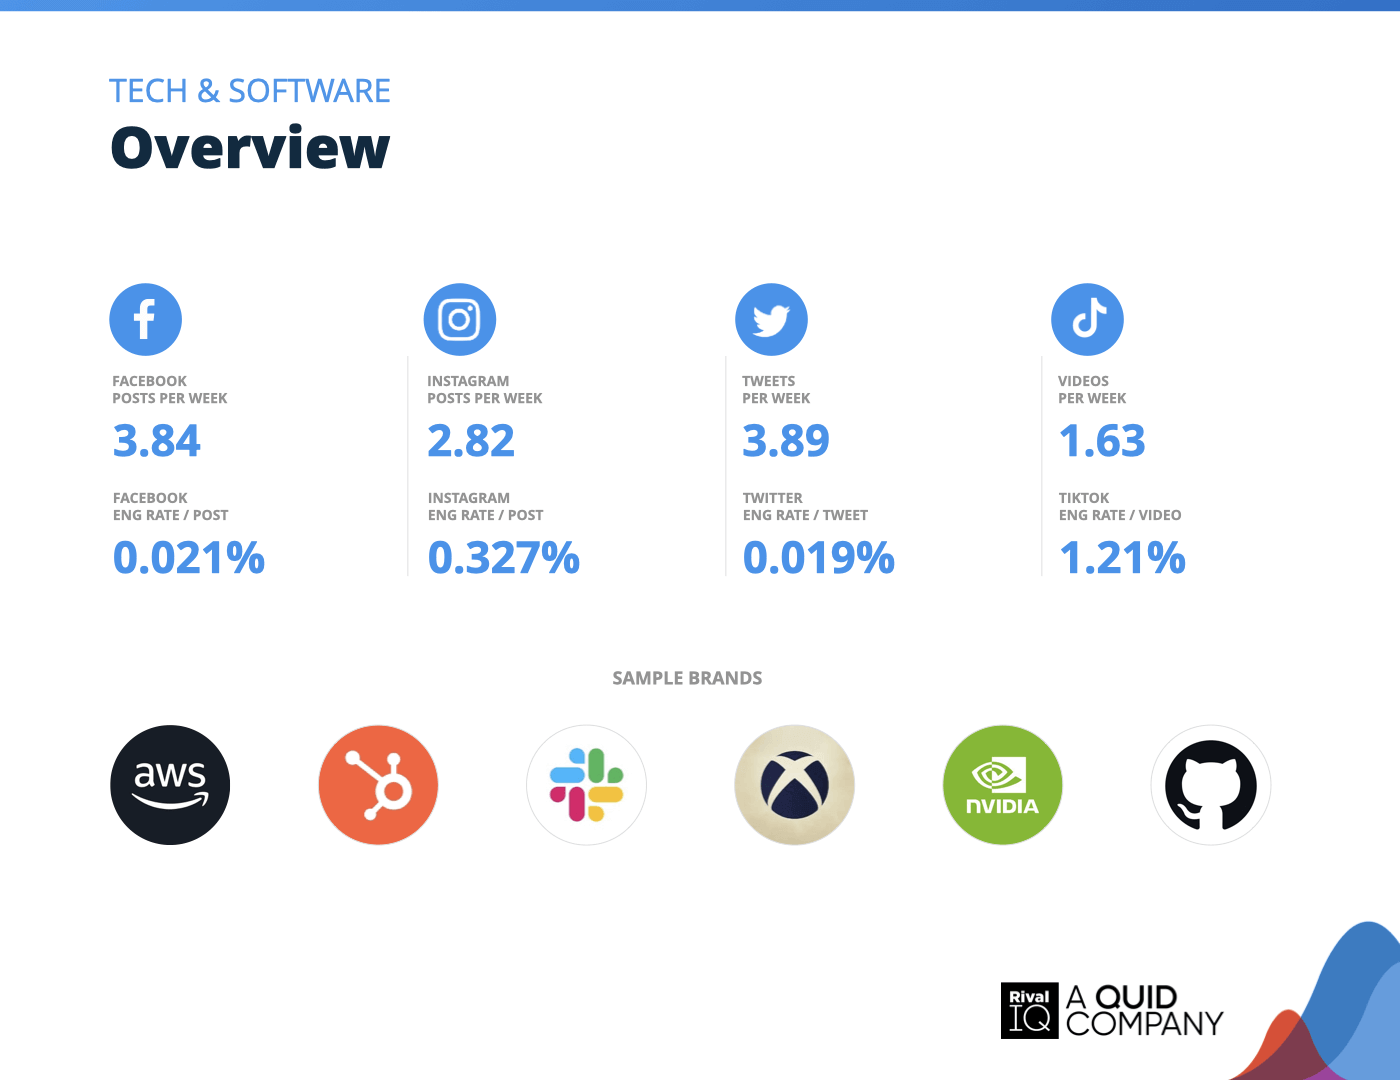
Overview of all benchmarks, Tech & Software
Notable brands in this year’s report include AWS, GitHub, HubSpot, NVIDIA, Slack, and Xbox.
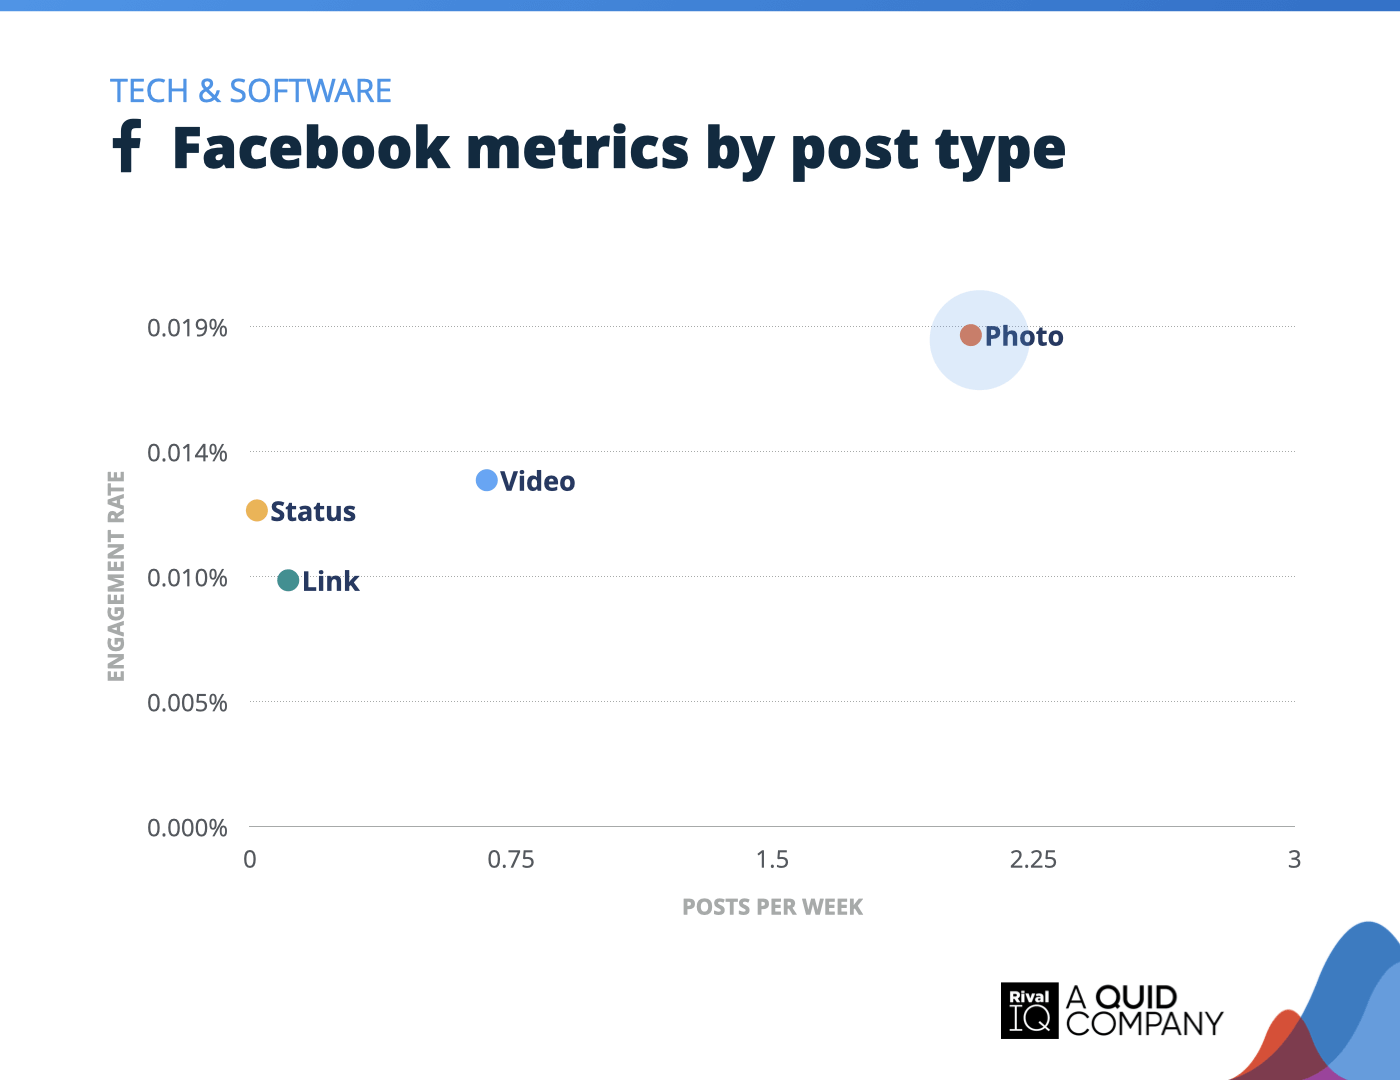
Facebook posts per week and engagement rate by post type, Tech & Software
Photos grabbed great engagement rates on Facebook for Tech & Software brands and were posted most frequently.
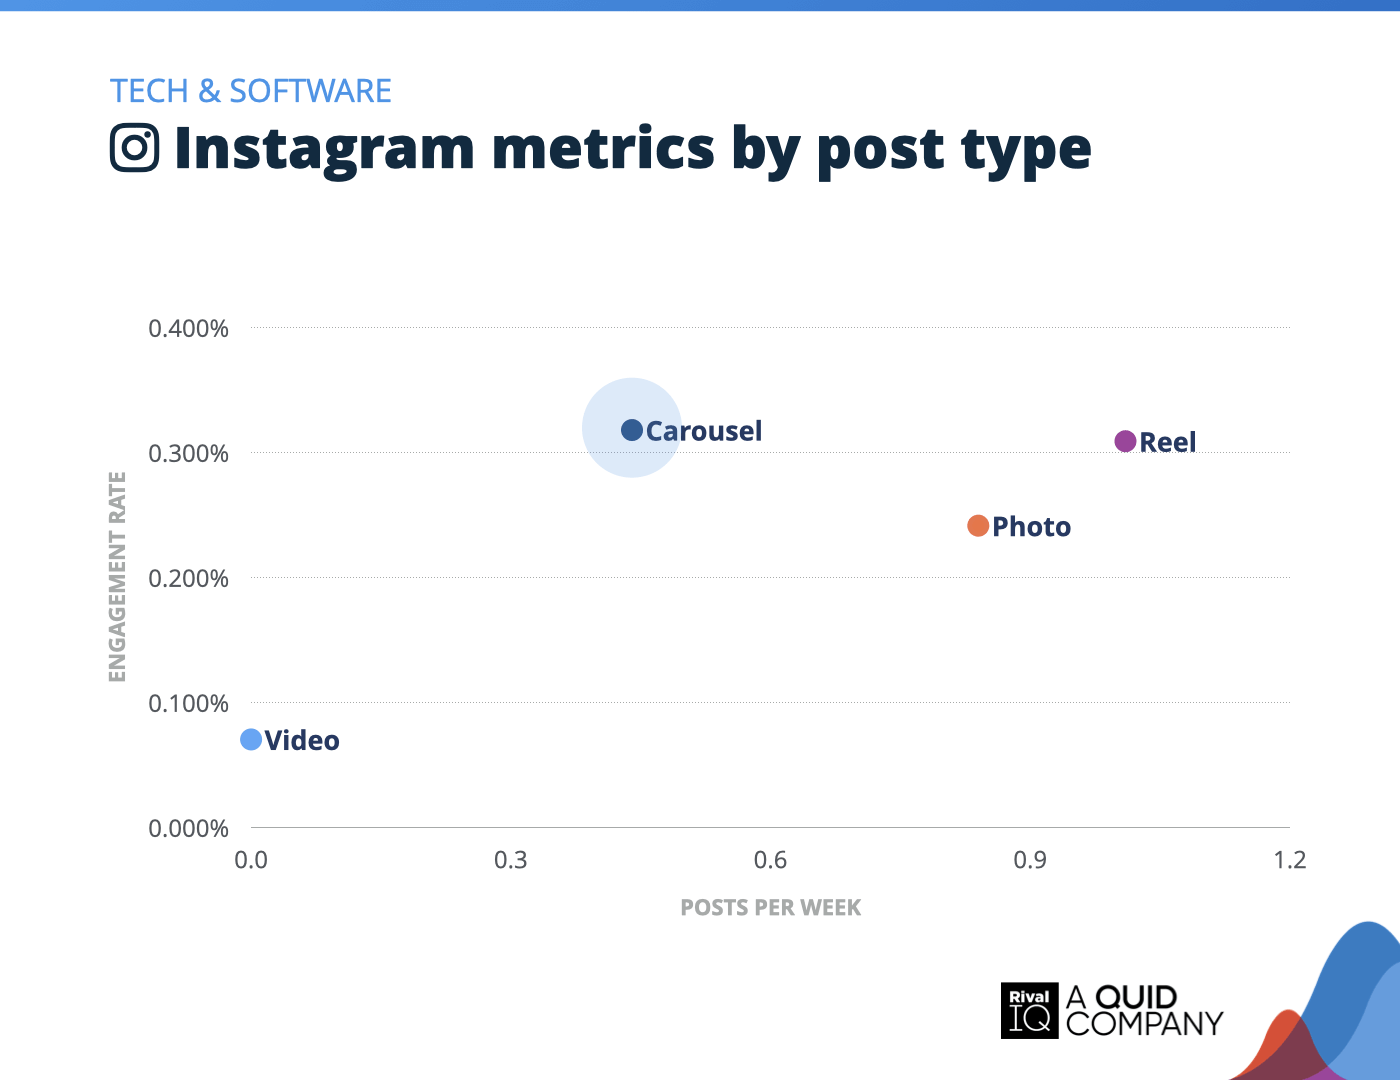
Instagram posts per week and engagement rate by post type, Tech & Software
Carousels and Reels battled for the top spot on Instagram for Tech & Software brands this year, with Carousels edging ahead slightly in engagement rates. Despite this, brands posted Carousels less frequently than Reels, suggesting an opportunity to boost engagement by increasing Carousel content.
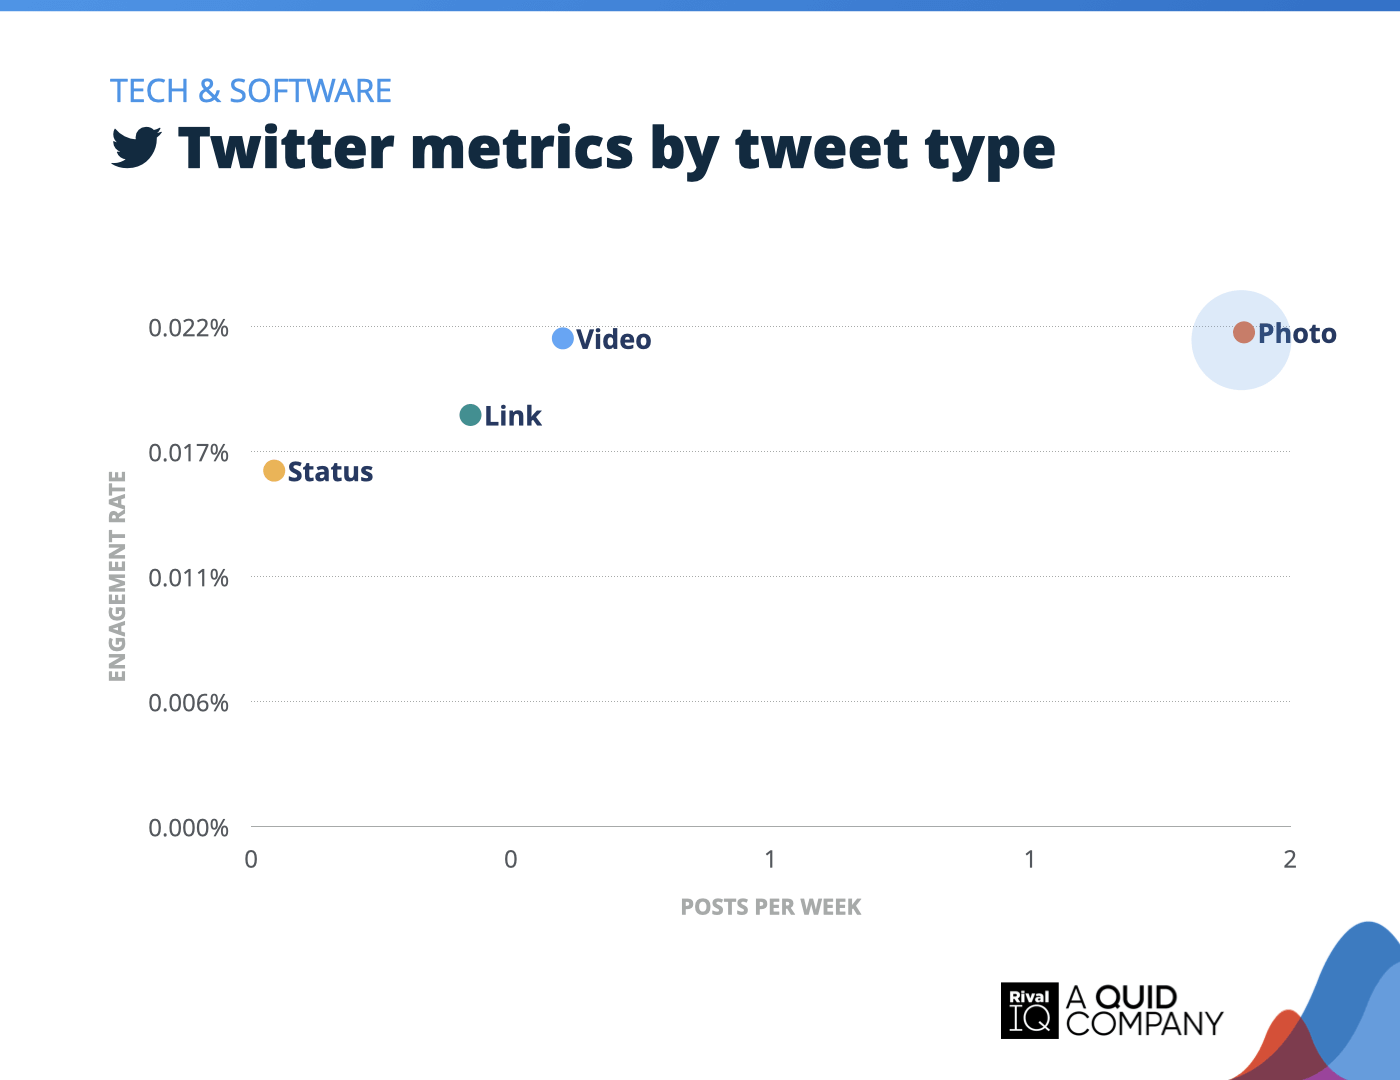
Twitter posts per week and engagement rate by tweet type, Tech & Software
Photo tweets were the go-to for Tech & Software brands on Twitter this year, leading in both engagement rate and posting frequency.
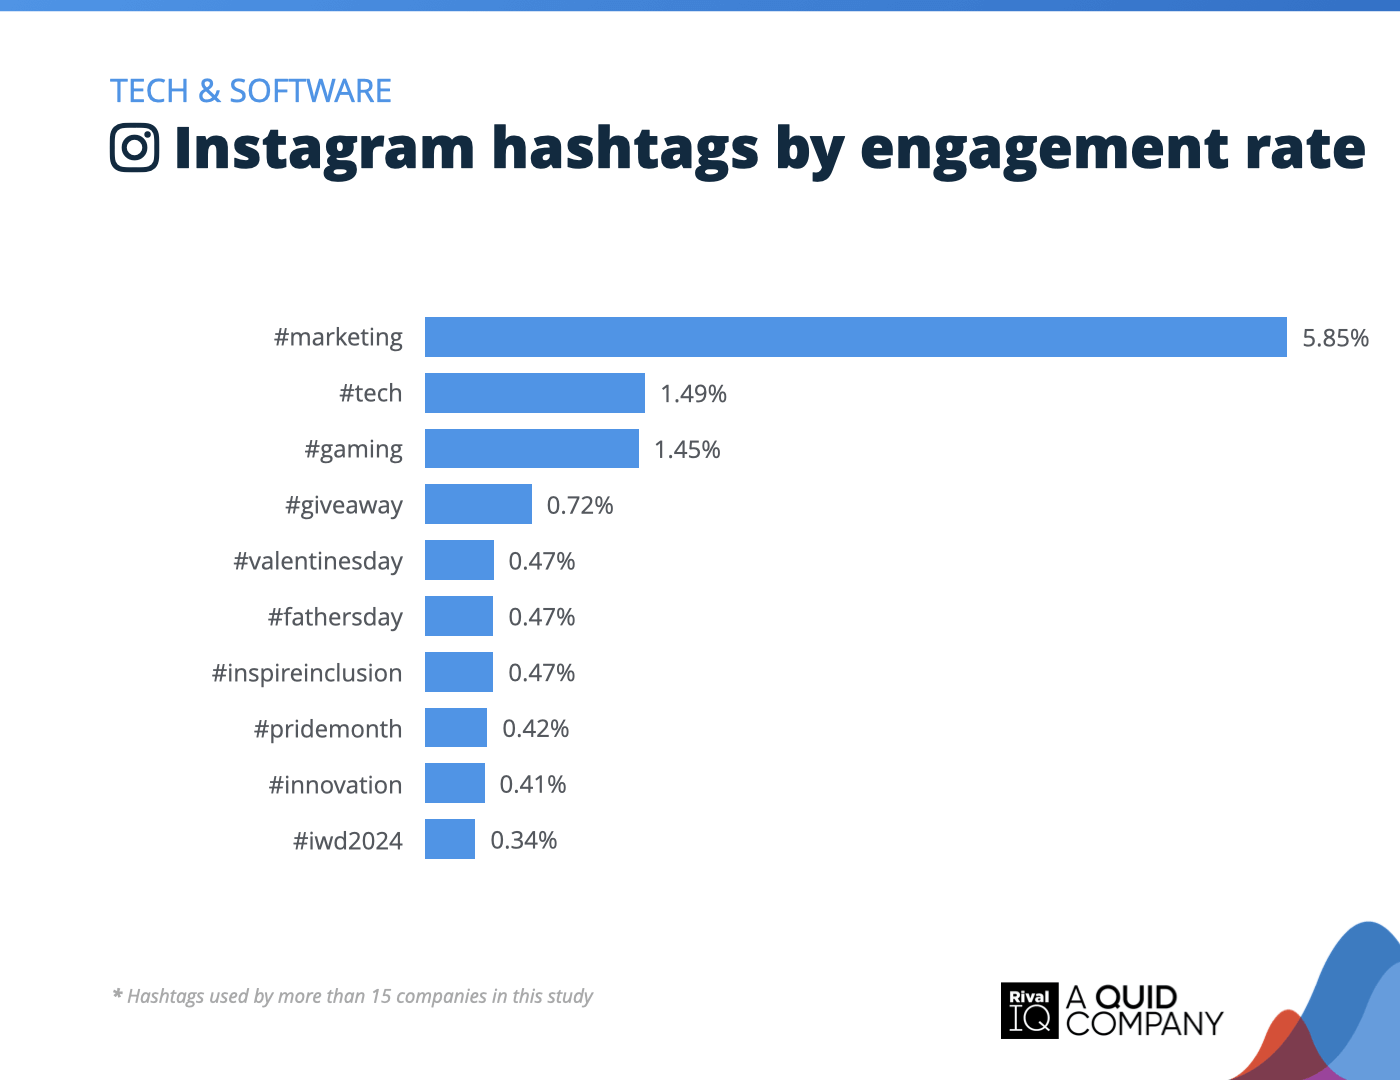
Top Instagram hashtags by engagement rate, Tech & Software
Tech & Software brands had #marketing on lock this year, pulling in nearly 4x more engagement than industry-focused hashtags like #tech and #gaming on Instagram.
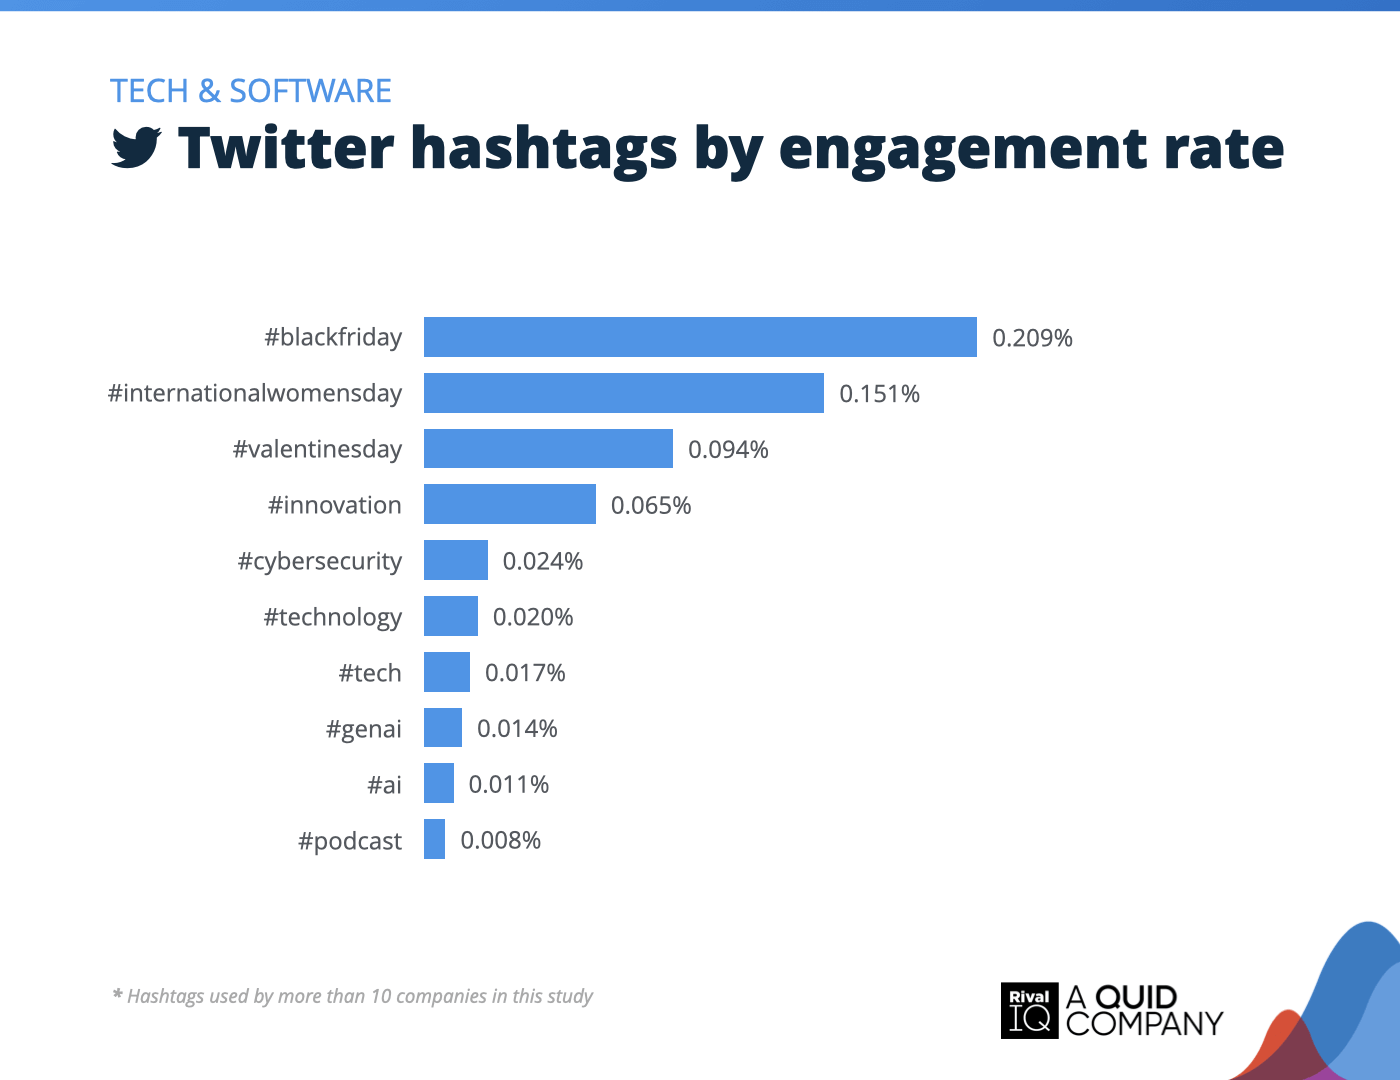
Top Twitter hashtags by engagement rate, Tech & Software
Tech & Software brands were all about the deals this year, with #blackfriday leading engagement by a wide margin on Twitter.
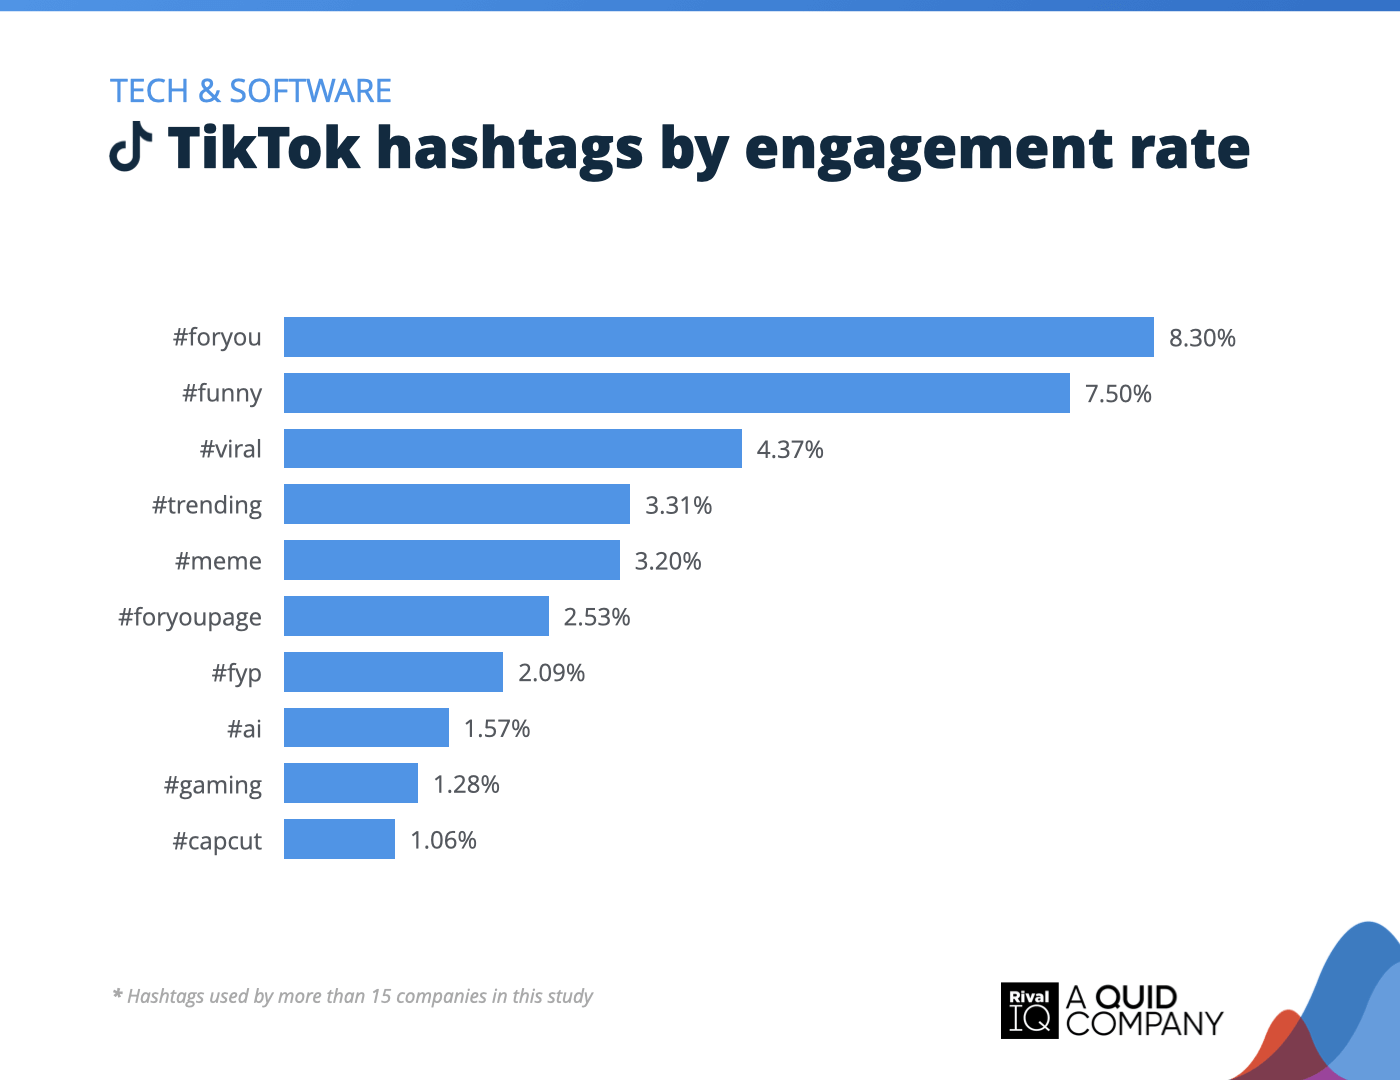
Top TikTok hashtags by engagement rate, Tech & Software
Tech & Software brands leaned into playful, trending hashtags like #foryou and #funny on TikTok this year, proving even techies love a good laugh.
Travel Social Media Benchmarks
Travel brands earned above-media engagement rates on Facebook and TikTok while running in the middle of the pack on Instagram and Twitter.
A few suggestions to grow engagement:
- Luxury and destination hashtags performed especially well for Travel brands this year.
- Posting frequency was below-median across the board, so experiment with an uptick here to see if you can increase your current engagement rates without sacrificing content quality.
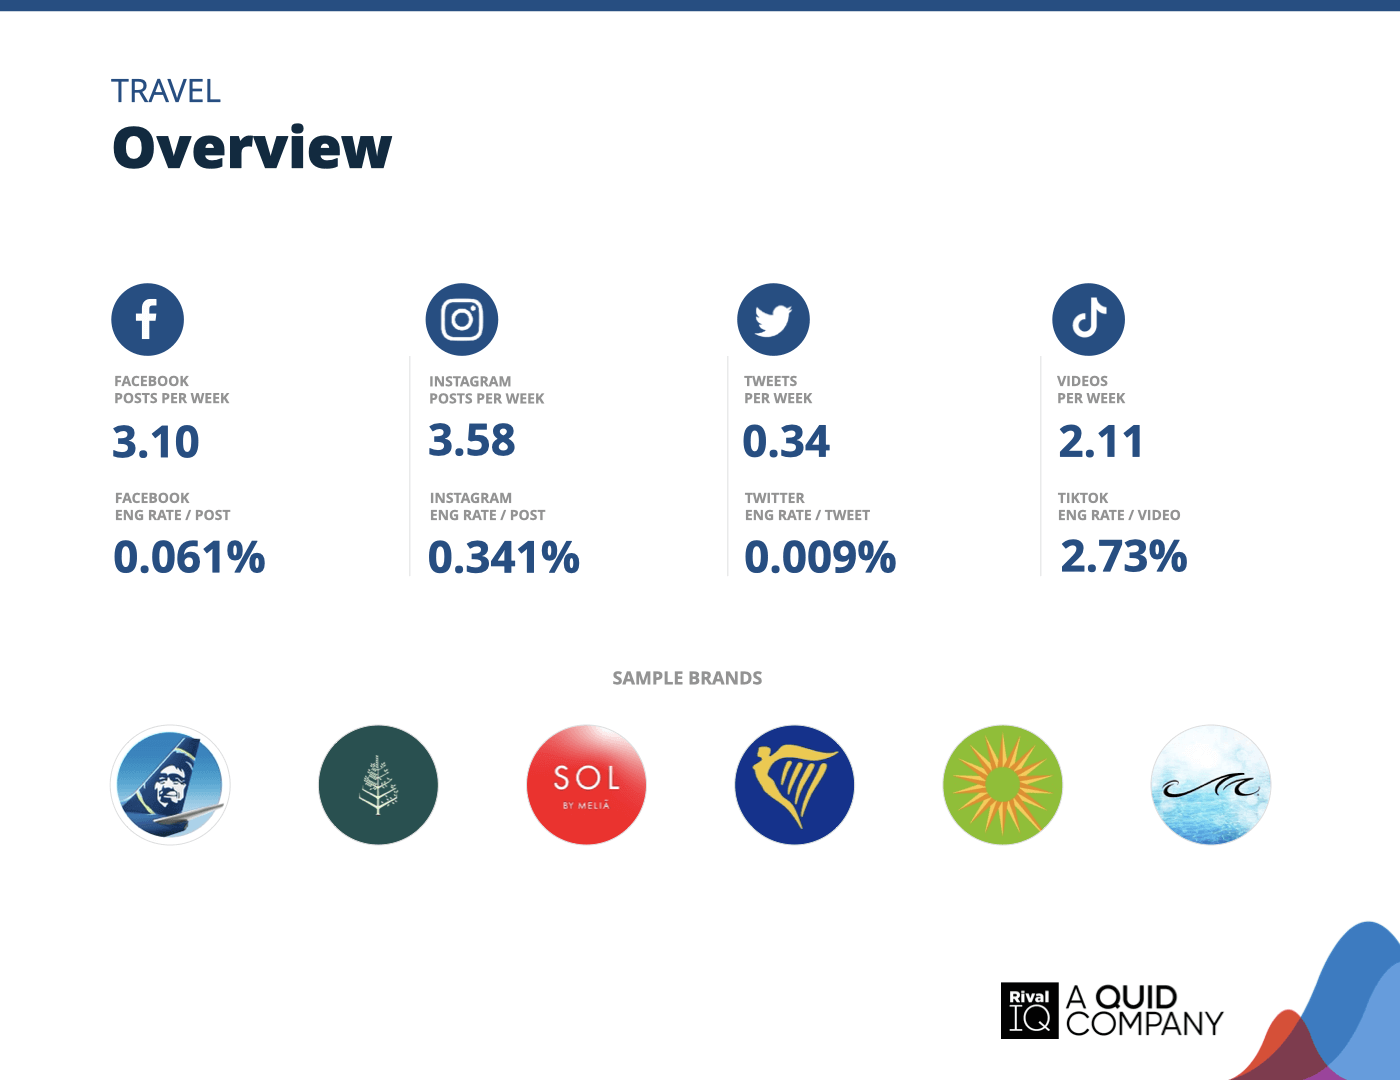
Overview of all benchmarks, Travel
Notable brands in this year’s report include Alaska Airlines, Four Seasons, La Quinta, Mandalay Bay, Ryan Air, and Sol by Melia.
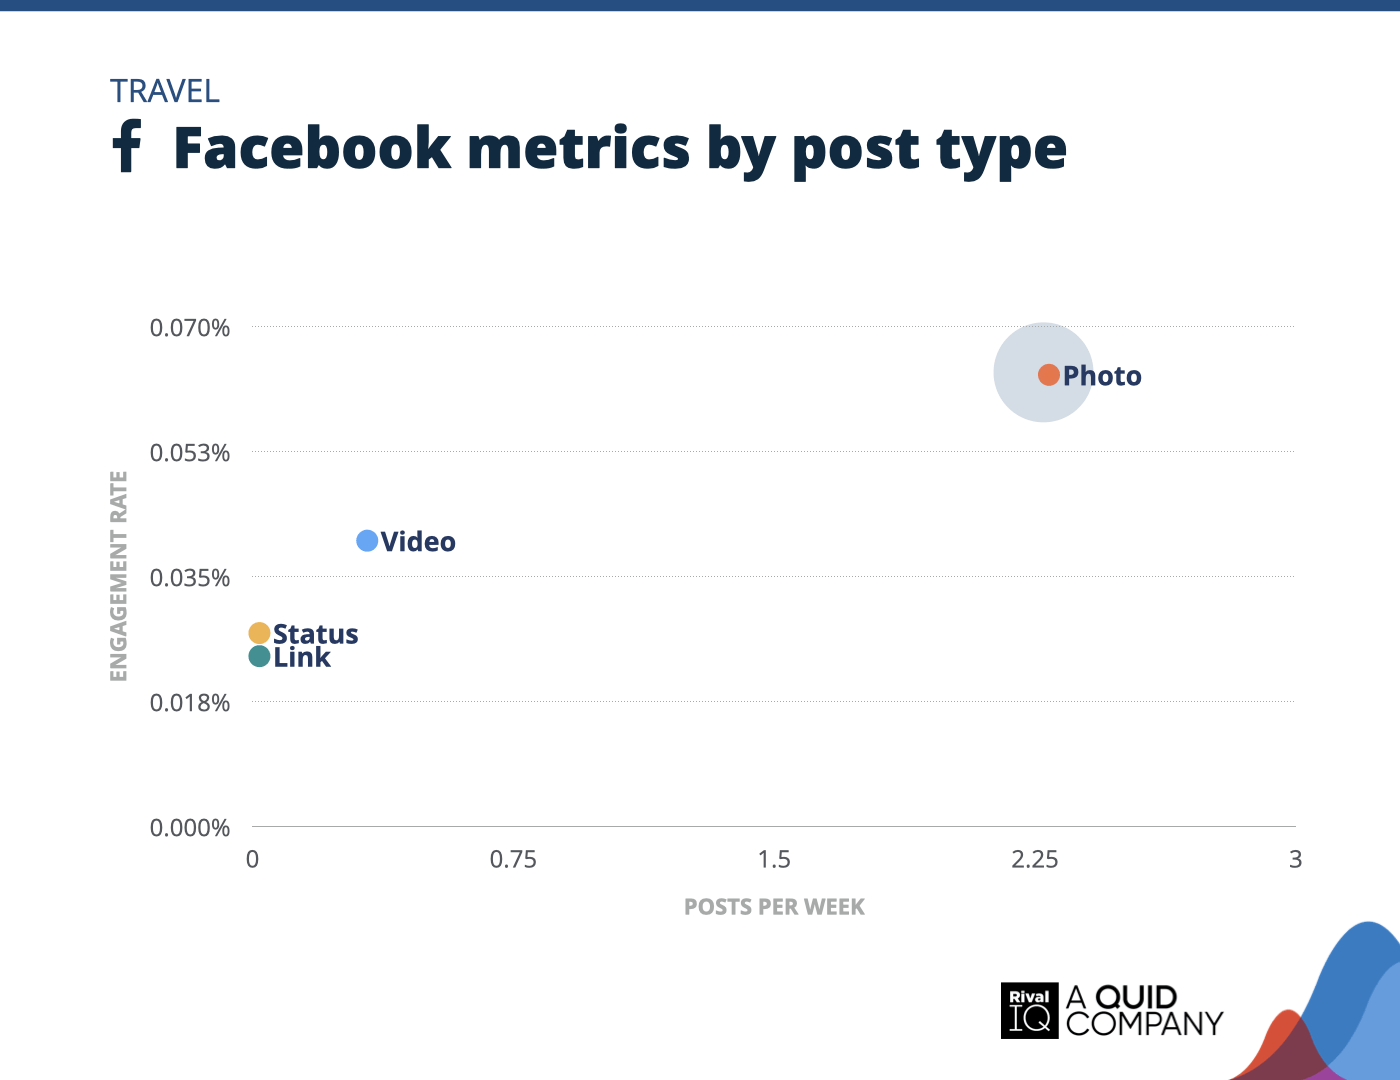
Facebook posts per week and engagement rate by post type, Travel
Photos led the way for Travel brands on Facebook this year, earning 1.5x the engagement of other post types and posted more frequently than videos, links, or status updates.
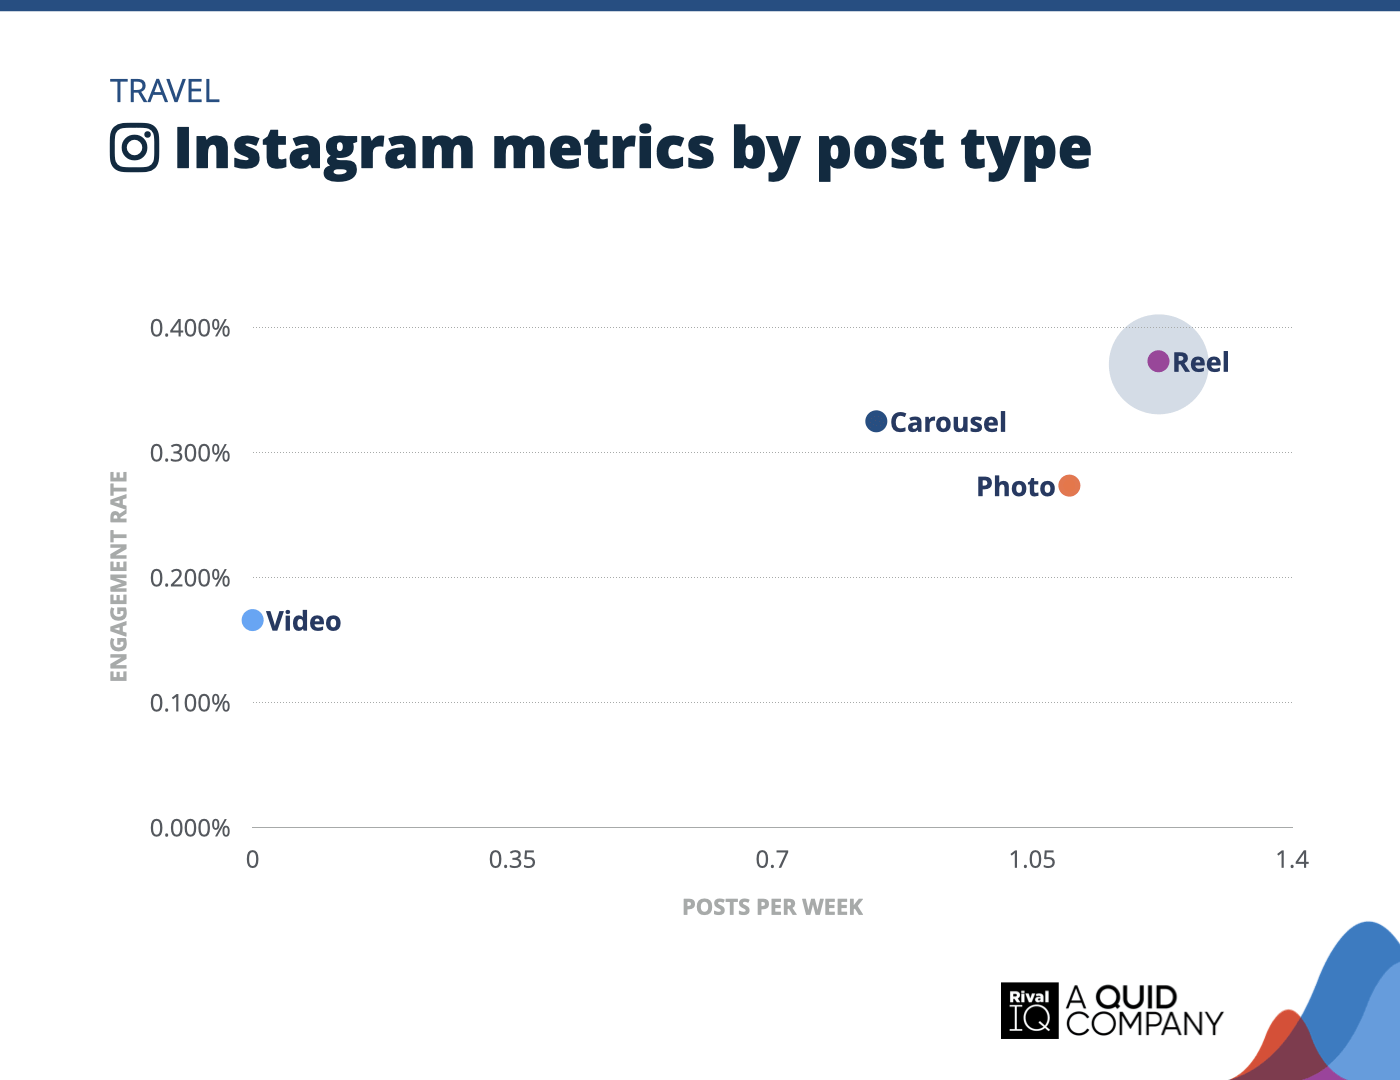
Instagram posts per week and engagement rate by post type, Travel
For the third year in a row, Reels outperformed other post types for Travel brands.
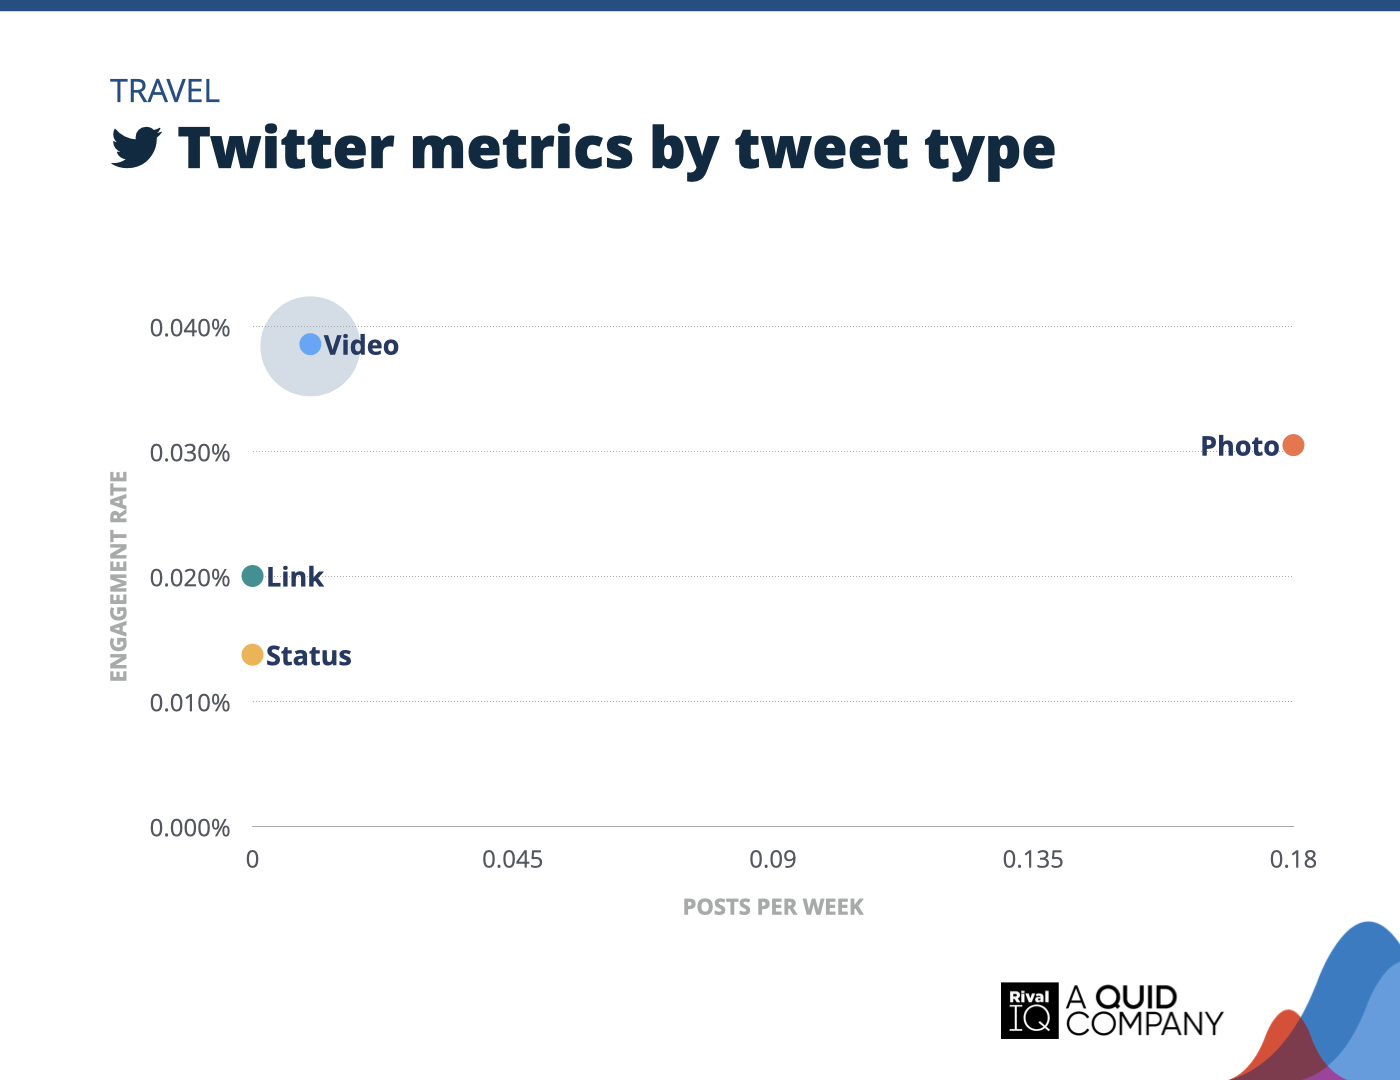
Twitter posts per week and engagement rate by tweet type, Travel
No surprise that it’s all about the visuals for Travel brands on Twitter, with video and photo tweets performing about twice as well as link and status tweets.
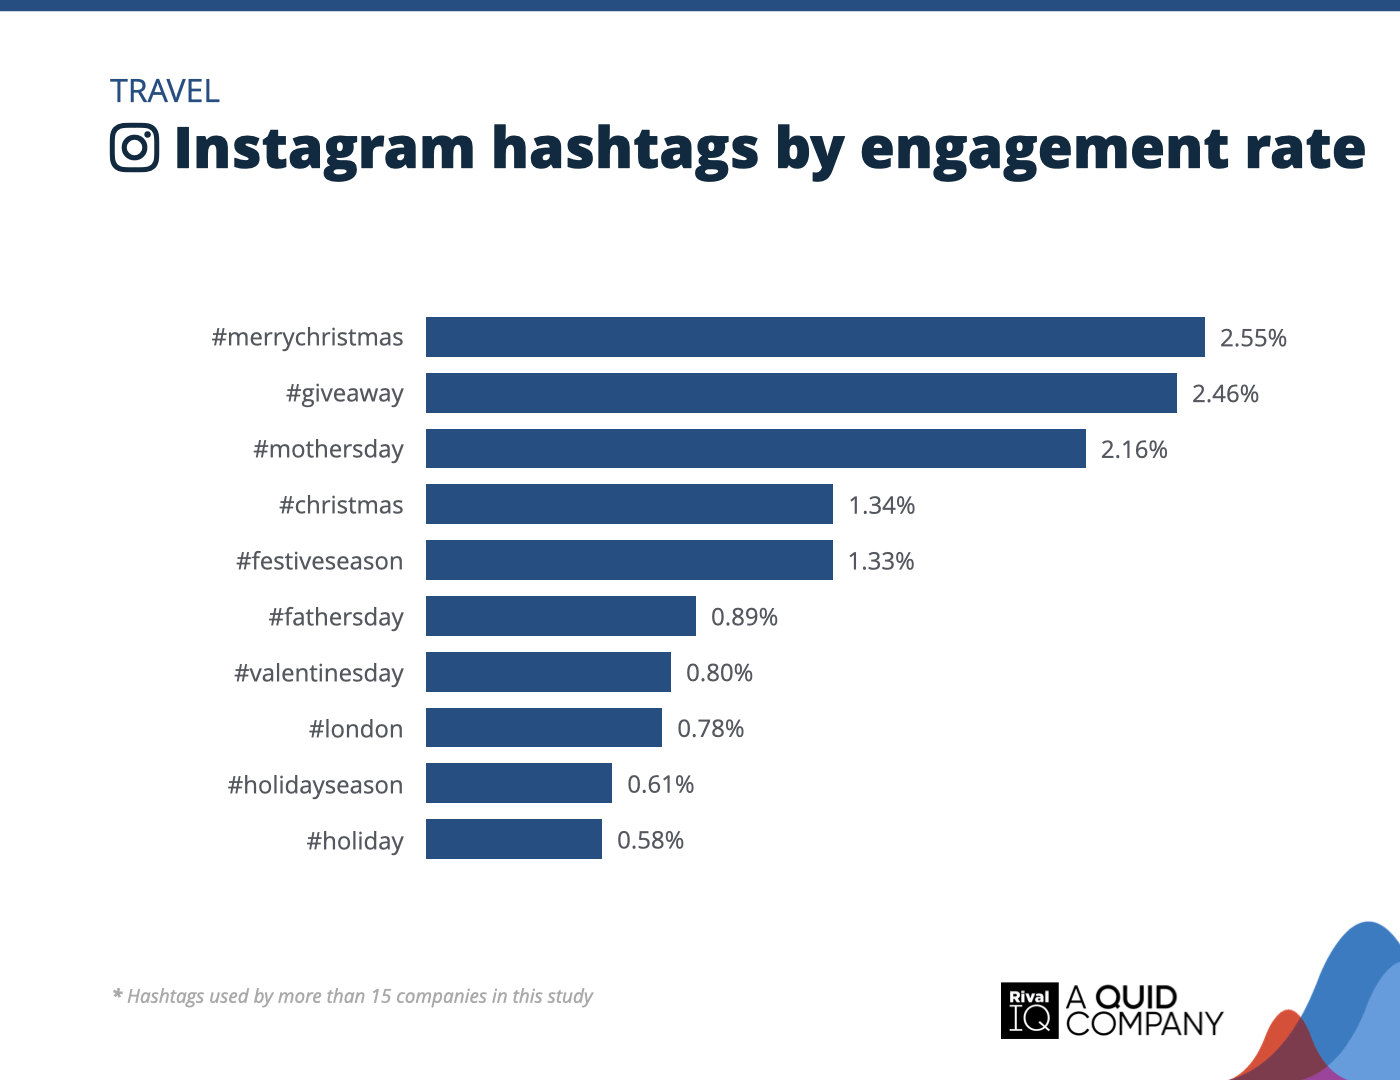
Top Instagram hashtags by engagement rate, Travel
Holiday cheer ruled Travel hashtags on Instagram this year, with #merrychristmas, #christmas, and #festiveseason topping the charts.
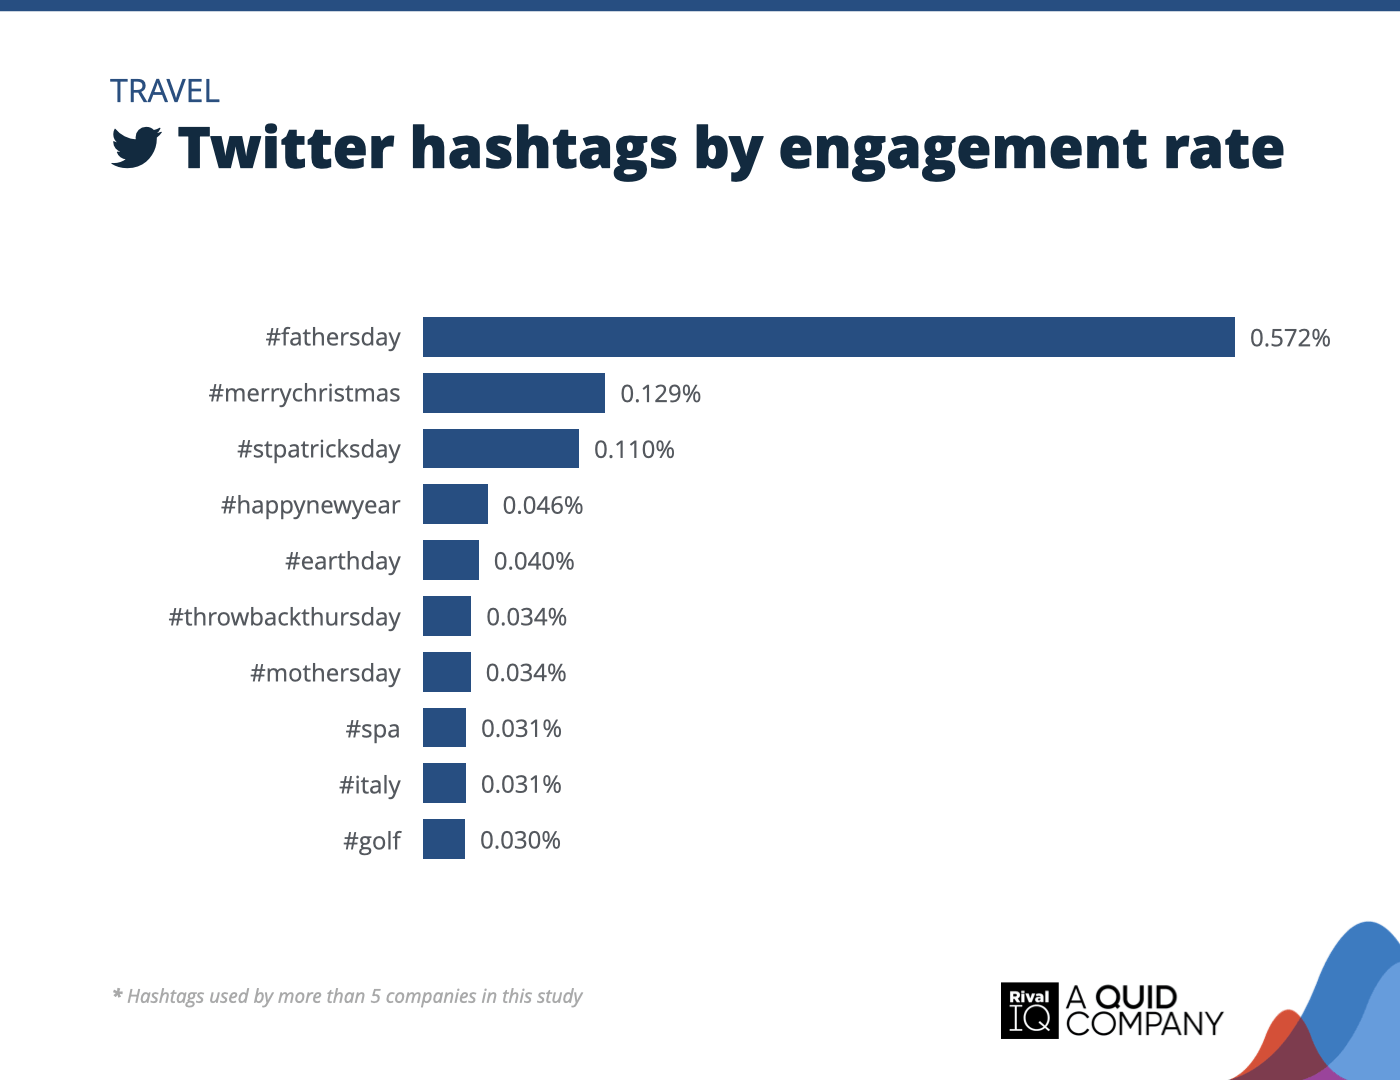
Top Twitter hashtags by engagement rate, Travel
Holiday hashtags took off for Travel brands on Twitter this year! #fathersday led the pack with over 4x the engagement of the next top hashtag, #merrychristmas.
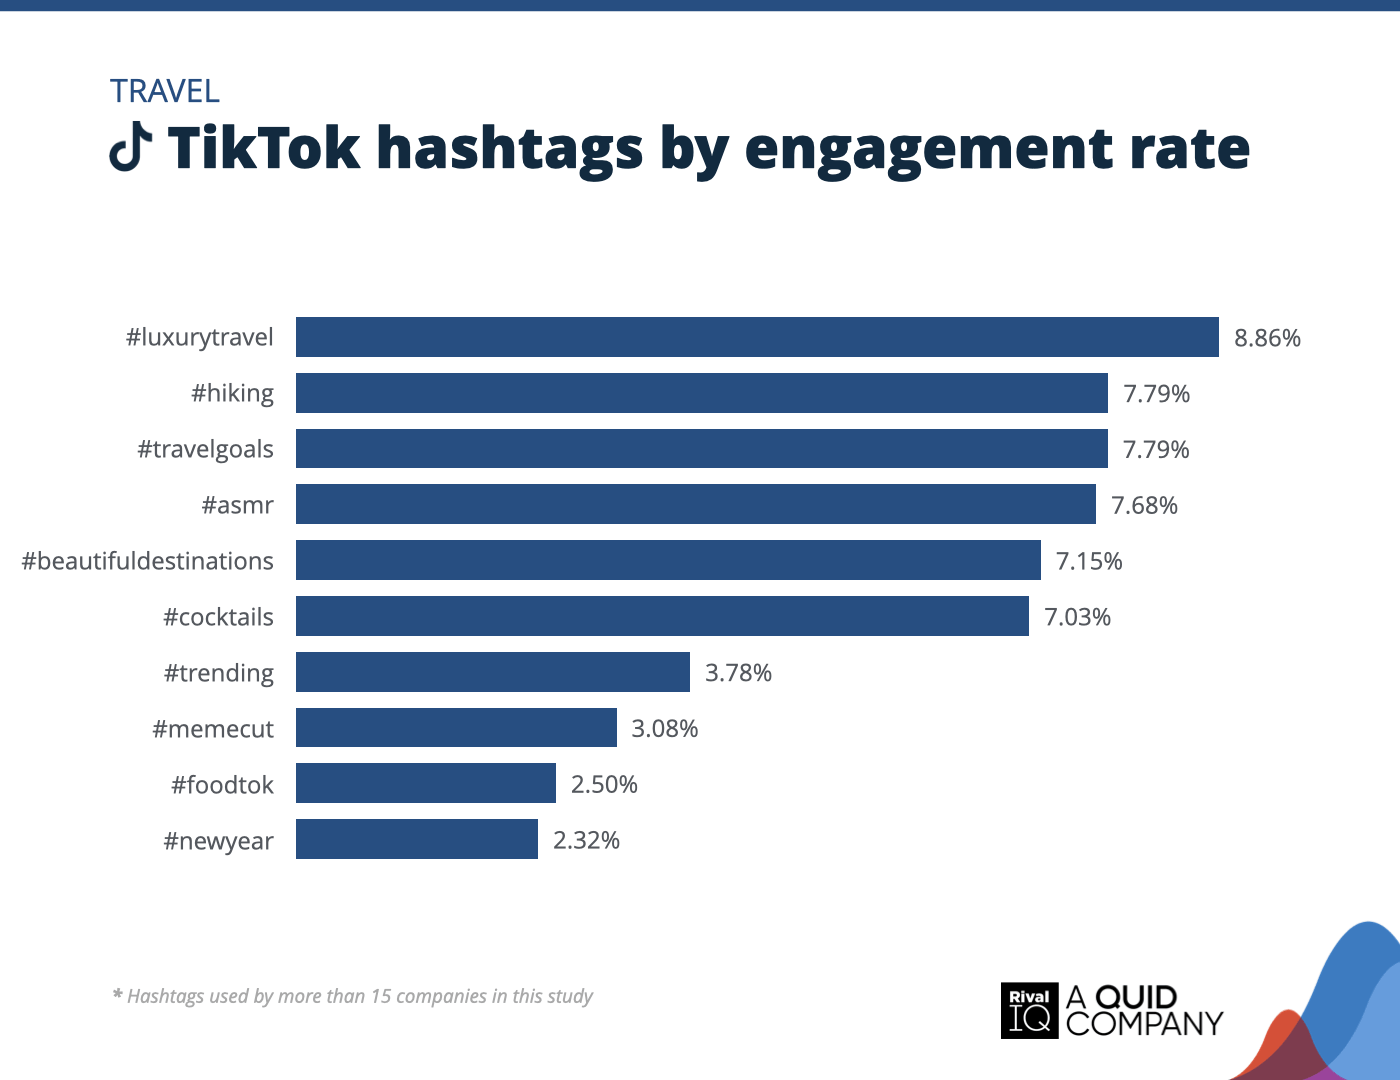
Top TikTok hashtags by engagement rate, Travel
Travel brands had TikTok followers dreaming big this year with hashtags like #luxurytravel and #travelgoals, which led the pack by more than 1% over the next top hashtag.
Methodology
To spot trends and identify benchmarks, we used Rival IQ to analyze engagement rates, posting frequency, post types, and hashtags on the top three social channels for brands: Facebook, Instagram, and Twitter.
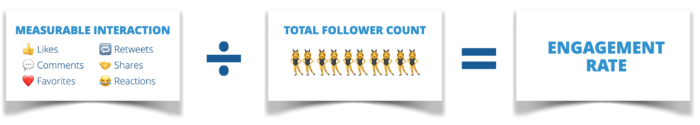
We define engagement as measurable interaction on social media posts, including likes, comments, favorites, retweets, shares, and reactions. Engagement rate is calculated based on all these interactions divided by total follower count.
 Within this report, we provide a representative sample of organic and paid posts from national and international companies in each industry by selecting 150 companies at random from each industry in our database of over 200,000 companies. Companies selected had active presences on Facebook, Instagram, and Twitter as of January 2023, and had Facebook fan counts between 25,000 and 1,000,000 and minimum Instagram and Twitter followers of 1,000 as of the same date.
We used median performance from the companies selected for each industry to compile the data for this report.
Why do we benchmark?
Social media success is about so much more than getting the most comments or likes: it’s about increasing engagement while also growing or maintaining the percentage of your audience that engages as you expand your audience.
To us, engagement rate per post is the metric because it controls for post volume and audience size and helps marketers understand how they’re doing in relation to their competitors.
Why can’t you gauge success on likes alone? Because audience size is hugely important: 1,000 likes makes a huge difference to a brand with 2,000 followers, but is a drop in the bucket to a brand with 100,000 followers.
Live Social Media Benchmarks
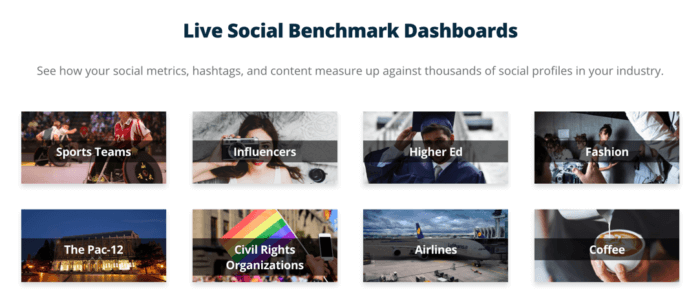
Ready to start benchmarking your social media performance? Check out our Live Benchmark landscapes, where we feature live social media metrics from a sample of companies from each industry represented in this study. These landscapes feature hashtag performance, top post types, and so much more on Facebook, Instagram, TikTok, and Twitter.
(Oh, and if you’re a Rival IQ customer or in a trial, you can add those stats directly into your Rival IQ account for even more comparisons.)
Or, run a free Head-to-Head report against your biggest rival to see how you measure up to both your competition and against industry benchmarks represented in this study.
Wrapping It Up
Another year, another wild ride in the world of social media. Engagement rates shifted, platforms evolved, and brands had to work harder than ever to keep their audiences interested.
TikTok is still the engagement powerhouse, Instagram continues to be a staple, and despite constant speculation, Facebook is still holding its own. Twitter (X) remains unpredictable, but the brands that stuck around found ways to spark conversations and make waves. Short-form video still reigns supreme, but carousels refuse to back down. And let’s be honest—organic reach isn’t getting any easier, making every like, comment, and share more valuable than ever.
So what’s next? Smart brands will double down on what works, experiment with what doesn’t (yet), and stay flexible as social media continues to keep us on our toes. What trends do you think will define 2025? We’re listening on Twitter (X) and Instagram!