Ever caught yourself wondering if your social media engagement rates are where they should be? You’re not alone. In today’s digital landscape, understanding and improving your engagement rates is essential to connect with your audience and stand out from the crowd.
Let’s dive into the world of engagement rates, explore what makes a good engagement rate, why they matter, and how you can improve them. Ready? Let’s get started!
Analyze your social media engagement rates with Rival IQ. 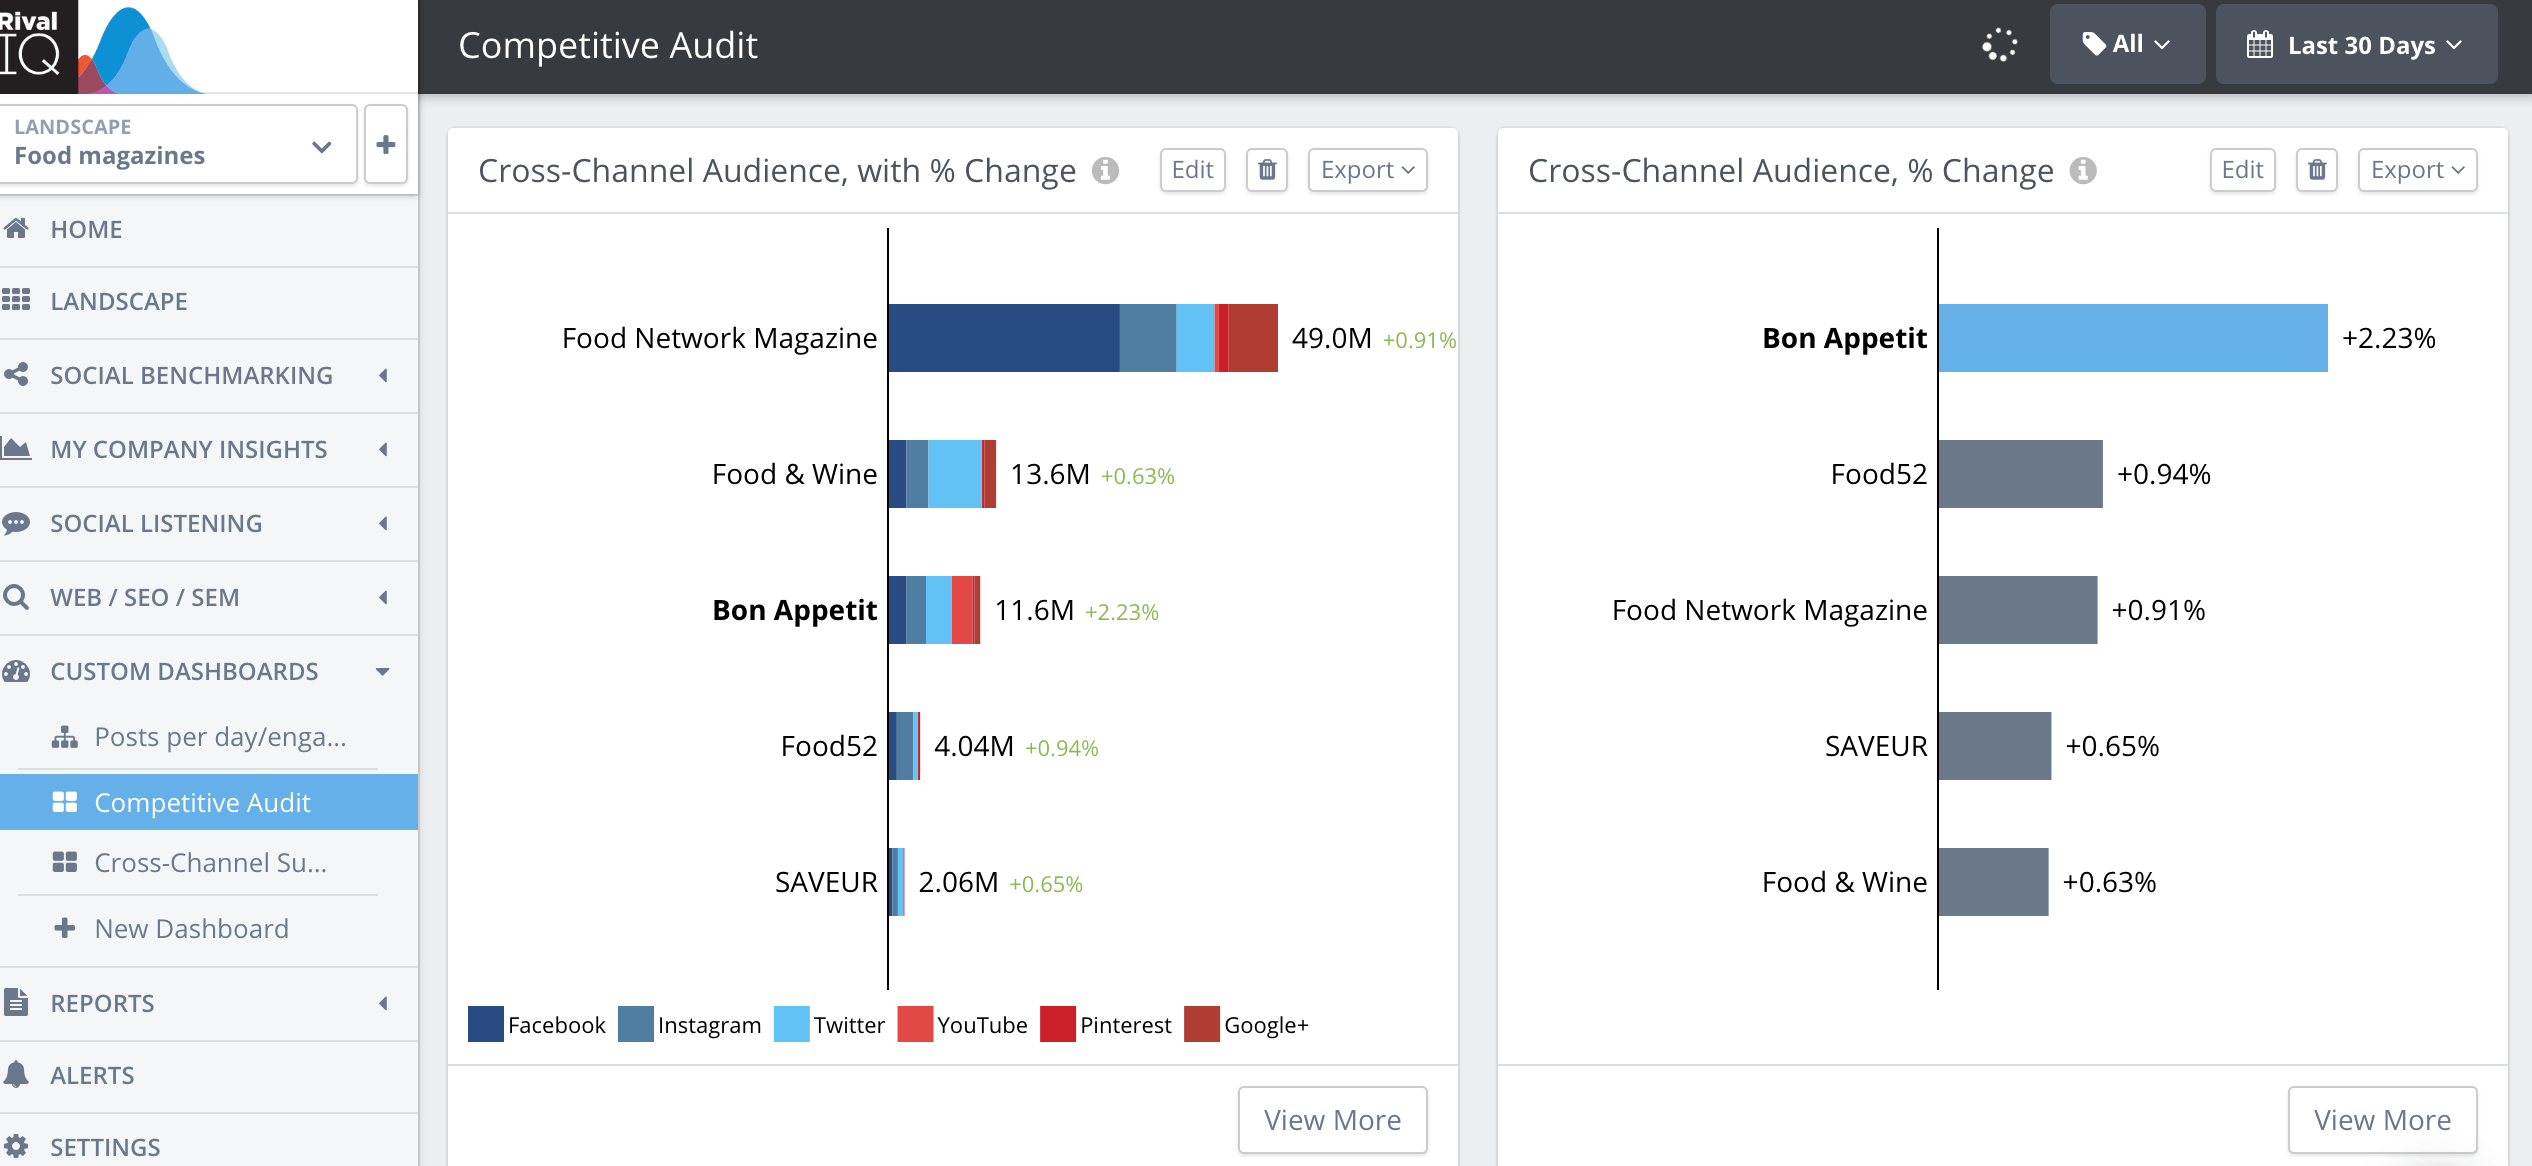
What is Engagement Rate?
First things first, what exactly is an engagement rate? It’s a crucial metric that shows how much your audience is interacting with your content. Think of it as a measure of the love your posts are getting.
At Rival IQ, we define engagement as measurable interaction on organic and boosted social media posts, including likes, comments, favorites, retweets, shares, and reactions. The engagement rate is calculated based on all these interactions divided by the total follower count. Here’s the formula to calculate your brand’s Instagram engagement rate:

While there are a few ways to calculate engagement rate, dividing by the number of followers gives a more accurate picture of how your brand’s engagement stacks up against similar brands in your industry—regardless of audience size.
Why Engagement Rate Matters
Engagement rate isn’t just a fancy term; it’s a critical metric that shows how well your content resonates with your audience. A high engagement rate means your audience loves your content, which can lead to better visibility on social platforms. Conversely, a low engagement rate might signal that it’s time to tweak your content strategy.
When tracked regularly and accurately, engagement rates provide valuable insights into your social media performance. Using these metrics to inform your social strategy—like where to spend your ad budget, what types of content to invest time in creating, and which areas to improve—leads to a more efficient and effective social media presence. Plus, you’ll debunk the “vanity metric” myth by moving those KPI needles.
What is a Good Engagement Rate on Social Media?
Now that we’ve covered how to calculate engagement rate and why it’s important, let’s dive into what constitutes a good engagement rate on social media. We’ll also spotlight a few industries excelling on each platform, providing actionable insights to boost your engagement rate.
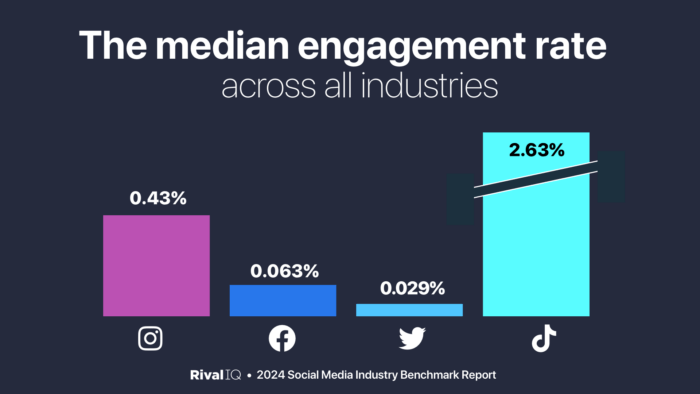
According to our 2024 Social Media Industry Benchmark Report, here are the engagement rate benchmarks for each platform:
Good Engagement rate on Instagram
- Median engagement rate on Instagram: 0.43%
- Median posting frequency on Instagram: 4.2 posts per week
Good Engagement rate on TikTok
- Median engagement rate on TikTok: 2.63%
- Median posting frequency on TikTok: 1.92 posts per week
Good Engagement rate on Twitter
- Median engagement rate on Twitter: 0.029%
- Median posting frequency on Twitter: 3.31 posts per week
Good Engagement rate on Facebook
- Median engagement rate on Facebook: 0.063%
- Median posting frequency on Facebook: 4.69 posts per week
Key Strategies to Improve Your Social Media Engagement Rates
Understanding and improving engagement rates is crucial for maximizing your social media interactions. Here are key factors and strategies to boost your engagement:
Content Quality
High-quality, engaging content is a must for sparking interactions. Focus on using stunning, high-resolution images, sleek graphics, and engaging videos to grab attention. Keep your content aligned with your audience’s interests and needs by staying updated on industry trends and hot topics.
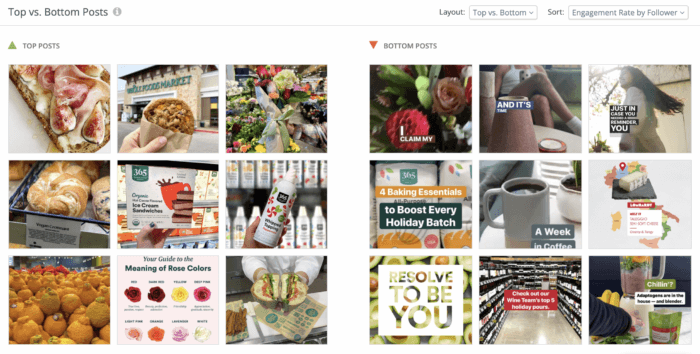
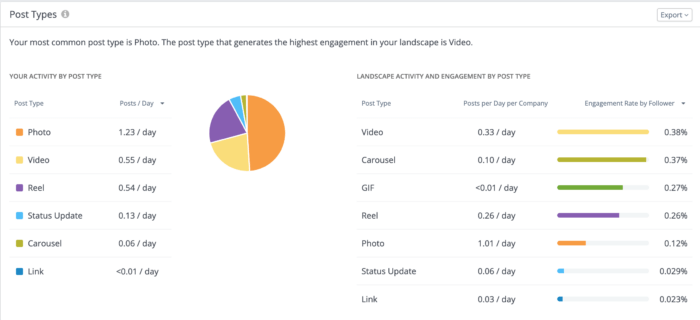
Deliver value with content that’s informative, educational, or entertaining. Content that solves problems or addresses pain points tends to resonate well. Mix up your post types between photos, videos, and status updates to see what your followers engage with most. For example, on Instagram, Reels have proven to be the most engaging post type for most industries, so incorporate those into your content strategy along with static images and carousels.
Audience Relevance
Tailor your content to match your audience’s preferences. Understand their demographics, interests, and behaviors through surveys, social listening, and analytics tools. Make your content relatable by speaking directly to your audience, using their language, and focusing on topics they care about. Don’t forget to monitor comments and shares to gauge what resonates with your audience.
Posting Frequency and Timing
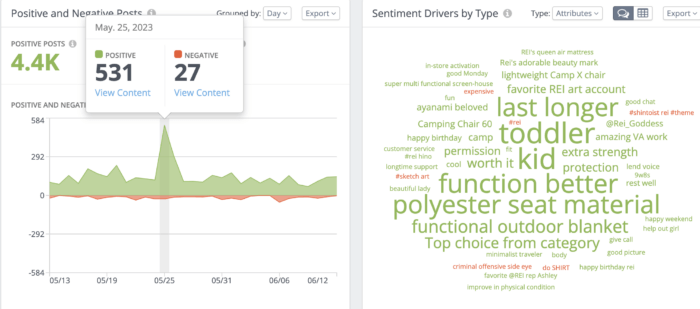
When and how often you post can make a big difference. Avoid overwhelming your audience by posting too often, but don’t let them forget you by posting too infrequently. Use analytics to find your brand’s sweet spot. Post when your audience is most active; this varies by platform and audience, so experiment with different times and track your results.
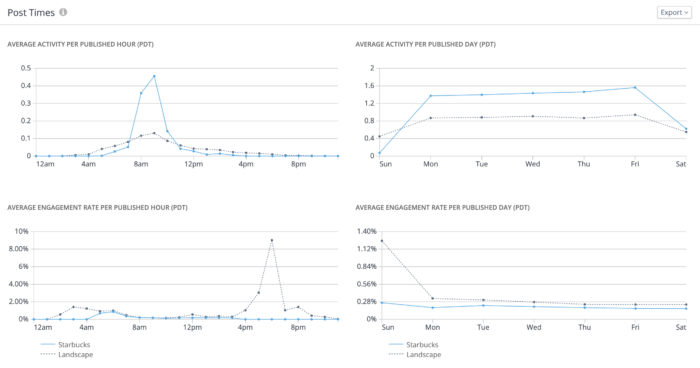
Track your analytics to determine the optimal posting frequency. Compare your metrics to the average all-industry rates or the engagement rates in your specific industry, whether that’s Healthy Foods, Beauty, or Higher Ed.
Leveraging Trends and Competition
Lean into popular hashtags, holidays, and trends to capture engagement. If you’re feeling stuck for fresh content ideas, turn to trending hashtags and holidays to capture engagement. Tap into live benchmarks for your industry to get real-time insights into top-performing posts and trending conversations.
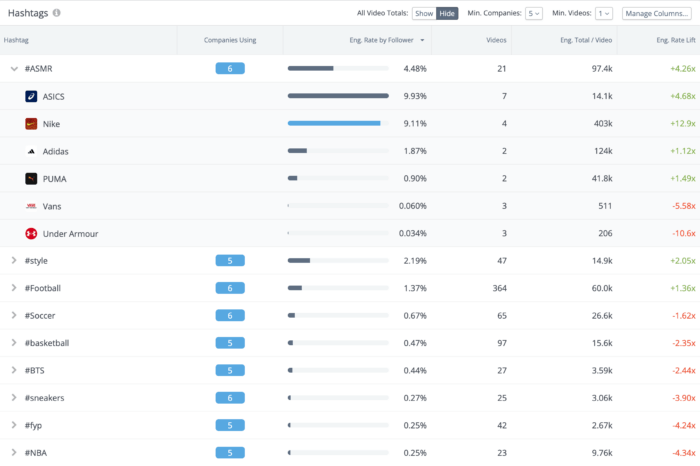
Benchmark your engagement rate by comparing it with similar brands in your industry. This helps put your content and engagement rates into more context. Use resources like Rival IQ’s benchmarking tools to create a landscape of competitors in your industry, see which videos generate the most engagement by view or follower, and identify trending topics and hashtags.
Analyzing and Adjusting
Regularly review your analytics to see what types of content perform best. Use these insights to refine your strategy and improve future posts. Consistency and timing are crucial for maintaining high engagement. For more detailed strategies, read our article on social media engagement strategies.
Platform-Specific Strategies
Each social media platform has its own vibe and user behavior. Tailor your strategy to fit each one. For a channel-by-channel read, check out these guides and get into peak engagement-boosting mode:
- How to increase engagement on Instagram
- How to increase engagement on Instagram Stories
- How to increase engagement on Facebook
- How to increase engagement on Twitter
- How to increase engagement on TikTok
See how you're doing on social media with a free Rival IQ trial. 
Brand Spotlights: Real-World Examples of Social Media Engagement Success
Duolingo on TikTok: Duolingo stands out on TikTok with its humorous and culturally relevant content. By embracing trending topics and adding a playful twist, Duolingo’s TikTok marketing strategy has led to impressive engagement rates. For instance, their engagement rate of 21.5% on certain videos is significantly higher than the average for language-learning apps.
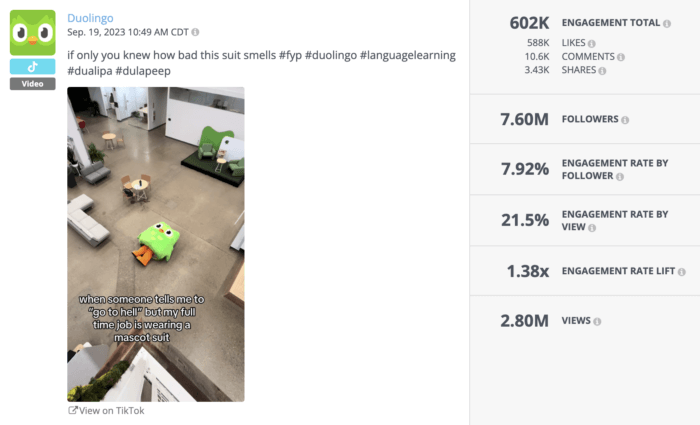 In 2023, Duolingo had a TikTok engagement rate of 15.61%, placing them among the top performers in their category. Their ability to stay connected with pop culture and interact authentically with fans makes Duolingo a prime example of effective engagement.
Inter Miami on Twitter: Inter Miami has made waves on Twitter with its strategic use of engaging content and timely updates. The sports brand has achieved impressive engagement rates by leveraging the popularity of star player signings and providing behind-the-scenes looks. Their approach of mixing highlights, player interactions, and fan-centric content has resonated well with their audience. According to our top sports teams on social media,
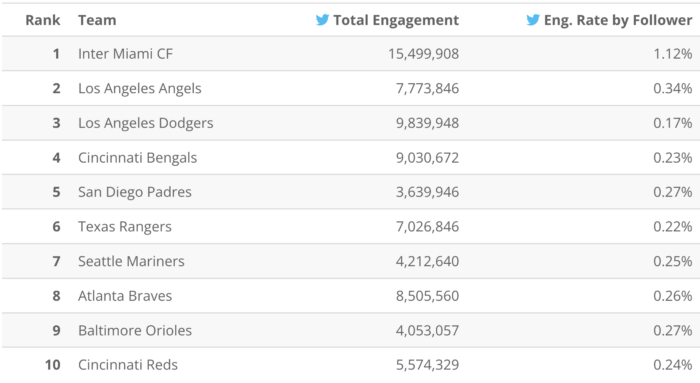
Inter Miami boasts an engagement rate of 1.5% on Twitter, which is nearly 4 times higher than the average sports team on the platform.
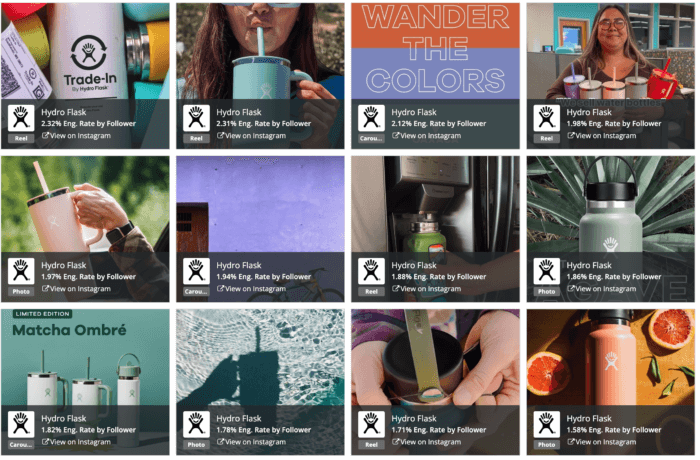
Stanley on Instagram: Stanley leveraged social listening and influencer partnerships to pivot their target market successfully. By engaging with influencers and adapting their product lineup to match new audience preferences, Stanley’s marketing strategy turned its Quencher Tumbler into a viral sensation. This strategic pivot helped them expand their market reach and significantly increase their engagement rates on social media. In 2023, Stanley achieved a 1.49% engagement rate on Instagram, showcasing the effectiveness of their strategy.
Rare Beauty on Facebook: Rare Beauty dominated on Facebook with impressive engagement rates by focusing on authentic, relatable content and leveraging the influence of its founder, Selena Gomez. Their most engaging posts include behind-the-scenes looks, user-generated content, and announcements of new product launches. This strategy has helped them build a strong, engaged community.

According to our top beauty brands on social media, Rare Beauty achieved a 0.92% engagement rate on Facebook, which is more than 3 times higher than the average beauty brand on the platform.
Why Benchmark Your Engagement Rate?
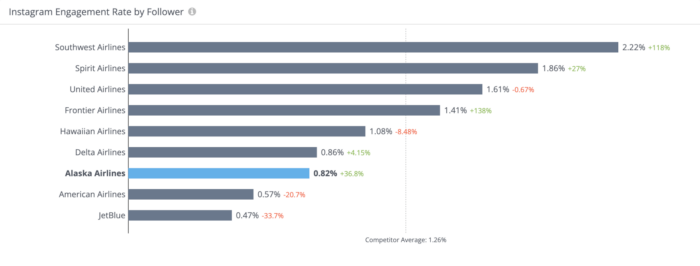
Benchmarking engagement rates against your industry standard is vital for understanding your performance on social media. Knowing the baseline of what engagement rates look like in your industry on each platform lets you set a bar to strive for. Plus, the competitive insights of industry tracking give your brand a leg up over the competition.
Wrapping it up
Understanding and optimizing your social media engagement rates is key to a successful social media strategy. Regularly measure and analyze your engagement rates to refine your approach and achieve better results. Remember, a little tweak here and there can make a big difference!
