For years, Twitter, now called X, has been the go-to platform for brands to connect with their audience one-on-one.
However, in July 2023, the platform experienced significant changes under new ownership and, as a result, brand activity has been impacted. According to our 2024 Social Media Industry Benchmark Report, posting frequency has declined by 20% across all industries. What does this mean for Twitter engagement rate? The median engagement rate has declined compared to last year, from 0.035% to 0.029%.
Despite the ups and downs the platform has gone through over the past year or so, data-driven marketers know that there’s still value in the channel. But in order to measure your performance, figure out what your audience interacts with, and see how you stack up against the competition, you have to know what a good engagement rate on Twitter is.
Below, let’s dive into how you can measure your brand’s Twitter engagement rate as well as get some inspiration from brands across all industries that are performing well in 2024.
How to Calculate Twitter Engagement Rate
There are several ways to calculate your Twitter engagement rate. It all depends on which metrics you measure. At Rival IQ, we define engagement as measurable interaction on social media posts. This includes likes, comments, favorites, retweets, shares, and reactions.
Twitter engagement rate is calculated based on all these interactions divided by the total follower count. Here’s what that formula looks like in practice:
Twitter engagement rate = [Likes + retweets + replies] / [total number of followers]
Engagement rate per post is a slightly different metric than engagement total alone, but we find that it’s more accurate. Why? Engagement rate per follower takes into account your follower count and posting frequency which can help brands of all sizes see how their content is performing in relation to the competition — even if competitors have larger audience sizes.
What is a Good Engagement Rate on Twitter?
Now that we’ve gone over how to calculate engagement rate, let’s dive into what a good engagement rate on Twitter really is these days.
According to our 2024 Social Media Industry Benchmark Report, the overall median engagement rate on Twitter is 0.029%. This is the rate for brands across all industries, from sports teams to nonprofits. On average, these brands are also posting about 3.31 times per week.
For those who want to aim for an engagement rate beyond the average, take note of how the overall top 25% of brands are performing. The top brands, regardless of industry, have an average engagement rate of 0.08% and post about 4.2 times per week. Here’s the breakdown:
Overall rate across industries:
- Median engagement rate: 0.029%
- Median posting frequency: 3.31x per week
Overall rate for brands in the top 25%:
- Median engagement rate: 0.08%
- Median posting frequency: 4.2x per week
See how you're doing on Twitter with a free Rival IQ trial. 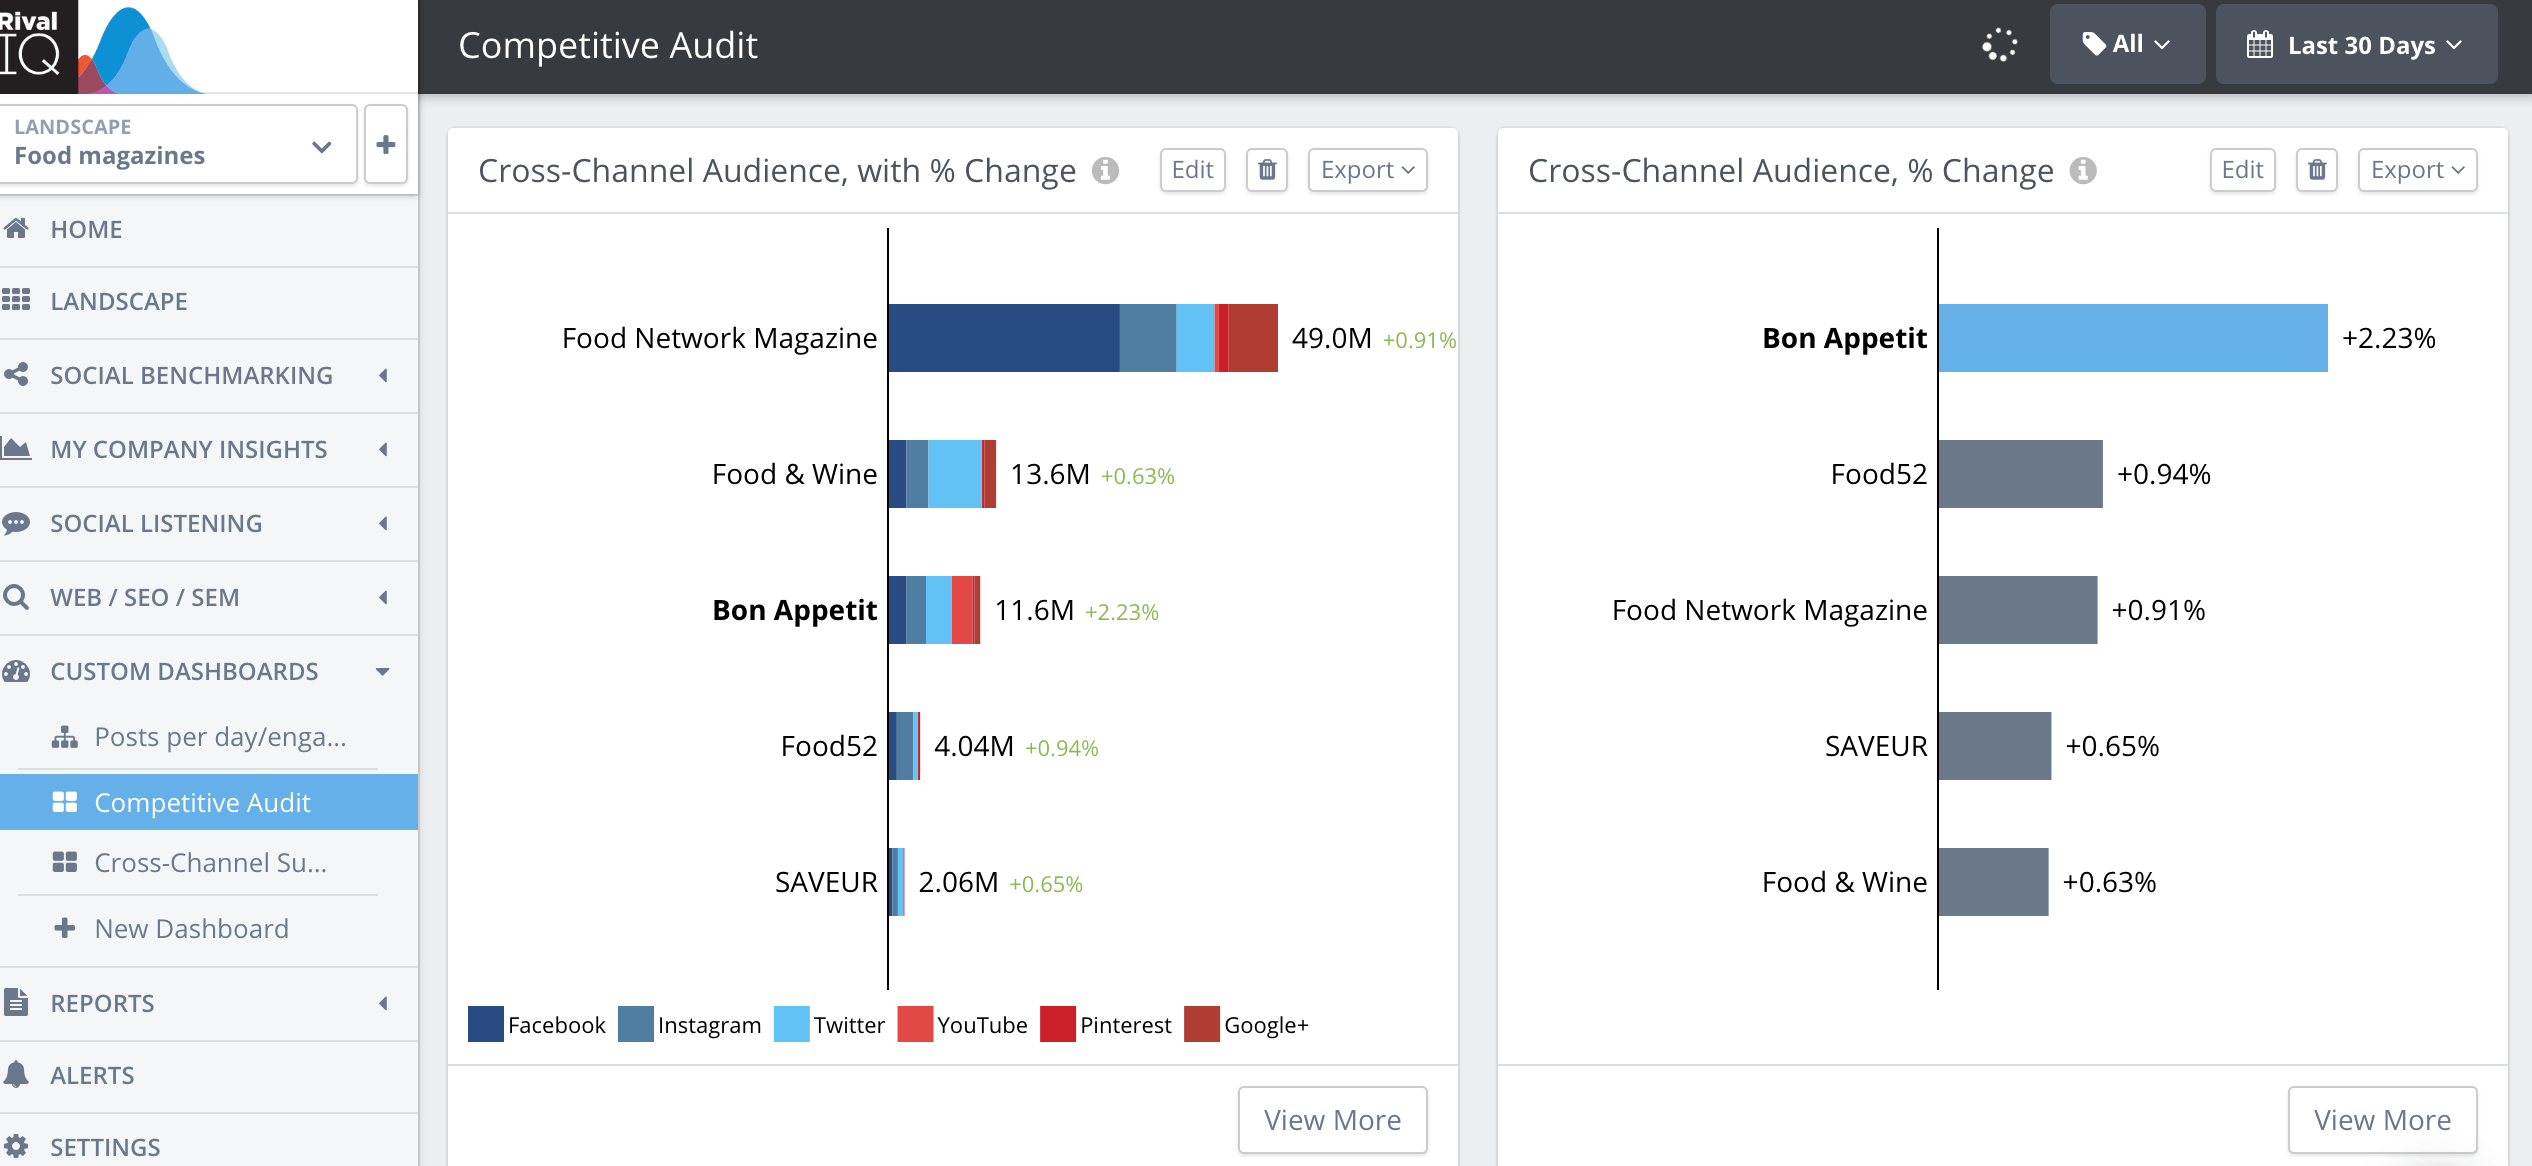
Twitter Engagement Rate by Industry
The overall median engagement rate for Twitter is a great benchmark to use, but every industry performs differently on the platform. If you want to get a more accurate perspective on how similar brands are performing on Twitter, compare your engagement rate to your industry average.
Let’s take a look at a few different industries to see what the best-performing brands are doing well and which Twitter best practices are worth following.
Sports Teams
- Sports Teams Median Engagement Rate: 0.07%
- Sports Teams Median Posting Frequency: 41.46 posts per week
Behind only media brands, Sports Teams are the second most active industry on Twitter at over 41 posts per week. And while frequent posting doesn’t always equate to higher engagement, it works for this industry. The Twitter engagement rate for Sports Teams is 2.4 times greater than the overall median across industries.
One reason Sports Teams post more often than other brands is that the essence of the industry revolves around real-time game updates and announcements during the playing season. These updates are necessary as they keep fans engaged and in the loop even if they aren’t able to watch the action live.
In an industry that puts its fans at the center, Sports Teams’ tweets are clearly community-driven. This is evident in the tweet below by Seattle Reign FC, which covered soccer icon Megan Rapinoe’s retirement. Featuring a celebratory graphic, the tweet quickly became a beacon for fans to show their support, love, and gratitude for the beloved player.
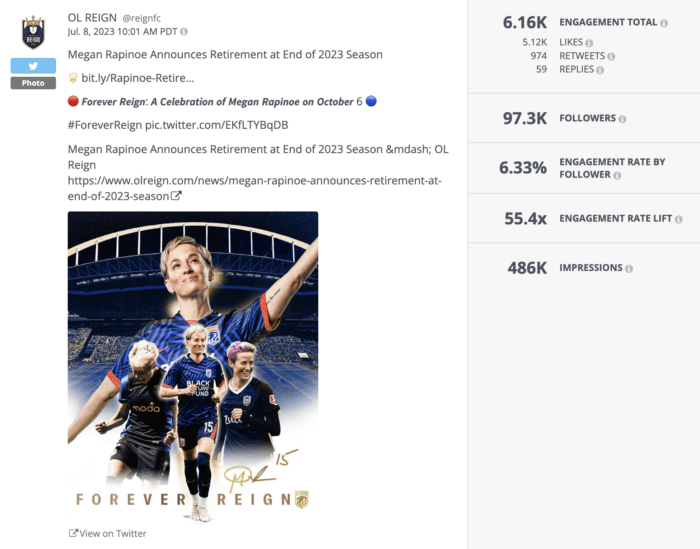
With more than 6K engagements in the form of likes, retweets, and replies, this tweet earned an engagement rate of 6.33% — a whopping 90 times higher than the industry median and more than 218 times greater than the median engagement for all industries.
While this level of engagement may be specific to the scenario, there are still takeaways for any Sports Team to make note of. Sports Teams can keep their Twitter active and their fans engaged all year round by regularly sharing player updates, highlights from the previous season, or teasers for the forthcoming season — anything that fans want to see more of.
Higher Education
- Higher Education Median Engagement Rate: 0.05%
- Higher Education Median Posting Frequency: 6.7 posts per week
The Higher Education industry continues to show up on Twitter and outperform most industries. It makes sense that schools and universities are so active on the platform since that’s where a lot of their audience — college-aged users — spends their time. In fact, Gen Z users are the slowest to leave the platform (given all of the changes under new leadership) compared to other generations due to the fact that they continue to see Twitter as a source of entertainment.
Similar to Sports Teams, schools post more frequently and earn a higher engagement rate than the average industry. Top-performing schools and universities use Twitter to share exciting student achievements, celebrate sports wins, and tap into “Twitter humor” by participating in relevant memes and trends.
One example of a top-performing Higher Education post is from The University of Iowa. The tweet below earned an engagement rate of 4.3% which is 86 times greater than the average rate for schools and universities and more than 148 times higher than the median Twitter engagement rate across industries.
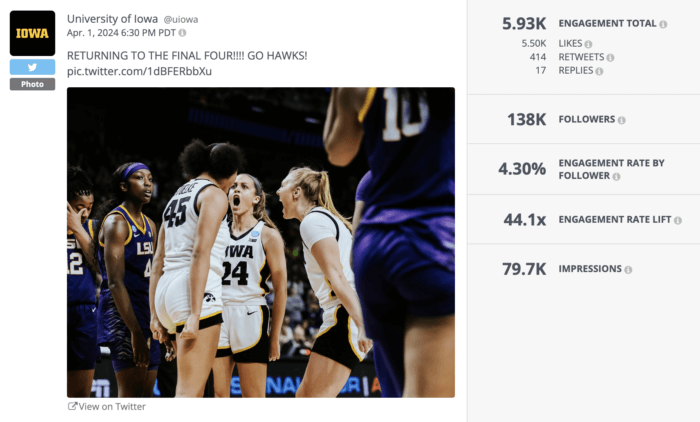
The tweet is a perfect example of how timely posts that are part of a larger conversation (this one was shared right after Iowa won the women’s NCAA Elite Eight game) are great at inspiring engagement. Sports wins and achievements, in particular, are always worth celebrating as they evoke pride from students and alumni alike.
Another top-performing tweet from the University of Iowa brought at-home fans into the mix. Celebrating WNBA player Caitlin Clark’s legacy, the tweet featured a wholesome compilation of fans — young and old — who were inspired by Clark.
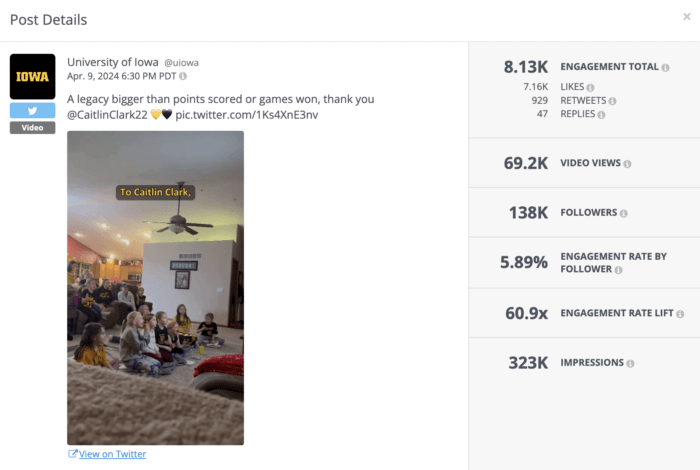
This tweet earned a 5.39% engagement rate, which is an impressive 107 times higher than the average rate for schools and universities. One reason for this tweet’s success could be due to the fact that it was a video. According to Rival IQ’s post type analysis, Video was the most engaging post type on Twitter for schools in our Higher Ed landscape.
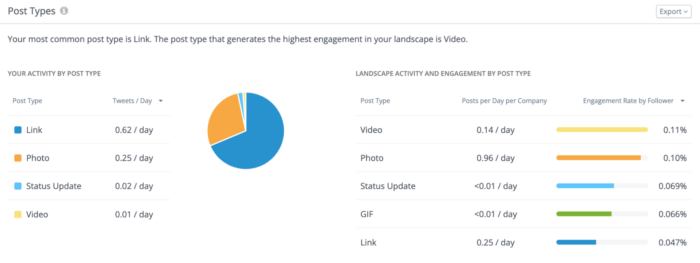
If you’re aiming to achieve impressive engagement rates on Twitter like Higher Ed does, take advantage of timely events and experiment with different post types. You can use Rival IQ to see what the most engaging types of posts are for brands like yours, as shown above, to lean into what works for your competitors.
Nonprofits
- Nonprofits Median Engagement Rate: 0.04%
- Nonprofits Median Posting Frequency: 6.97 posts per week
Nonprofits earn an above-average engagement rate of 0.04% and post more frequently than most other industries, sharing nearly seven tweets per week.
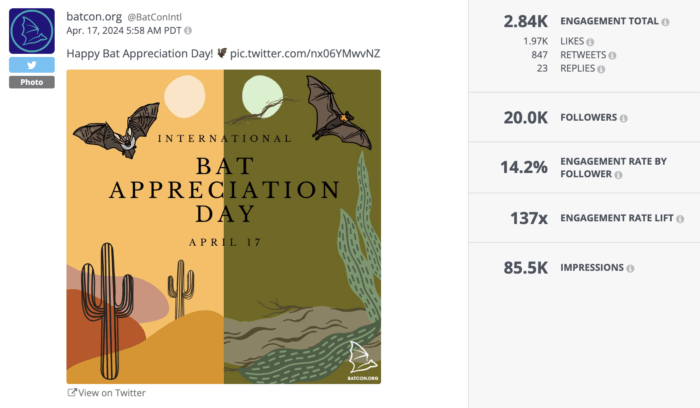
A nonprofit that stands out on Twitter (and is the top-performing nonprofit across social media channels) is Bat Conservation International. The organization is on a mission to end bat extinction worldwide and regularly shares bat facts and memes on Twitter as a way to communicate that message.
Because social media is a community-driven space, one popular way to bring attention to causes is by connecting it to a holiday that people can rally around and celebrate. Bat Conservation International did this with its “Bat Appreciation Day” tweet, which earned the organization an engagement rate of 14.2%, which is a mindblowing 355 times higher than the median rate for nonprofits on Twitter.
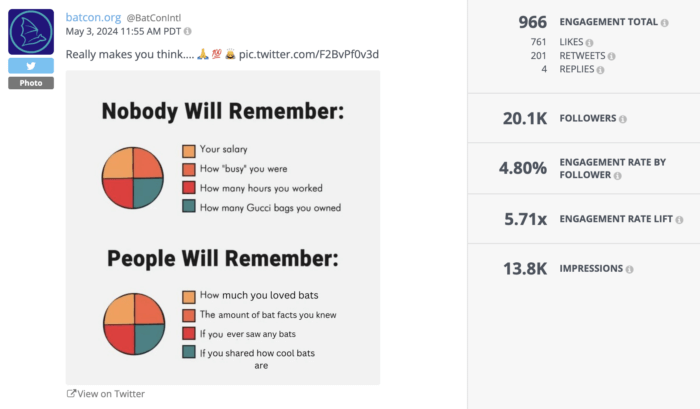
BCI also takes a playful approach to Twitter content. Take the tweet below, for instance. The tweet featured a light-hearted meme that reflected the nonprofit’s love for bats, making for a fun and entertaining post that captured the attention of hundreds of users and earned an impressive engagement rate of 4.8%, 120 times greater than the median engagement rate for nonprofits.
No matter how broad or niche your nonprofit’s mission is, there’s always an opportunity to connect with people about your cause. Twitter can be a great platform to reach a wide audience, so experiment with different post types and styles when spreading your message.
Alcohol
- Alcohol Median Engagement Rate: 0.04%
- Alcohol Median Posting Frequency: 1.02 posts per week
Though they tend to post less than the average brand in other industries, Alcohol is another industry that earns a good engagement rate on Twitter. The median engagement rate for Alcohol brands is 0.04% and these brands post about once per week.
Given the nature of the industry, alcohol brands have a lot of leeway to be fun, celebratory, and entertaining on social media, and especially on Twitter. One way brands do this is by sharing witty jokes and entertaining images. According to our 2024 Social Media Benchmark Report, status updates (text-only tweets) and photos were the most engaging post types for Alcohol brands on Twitter.
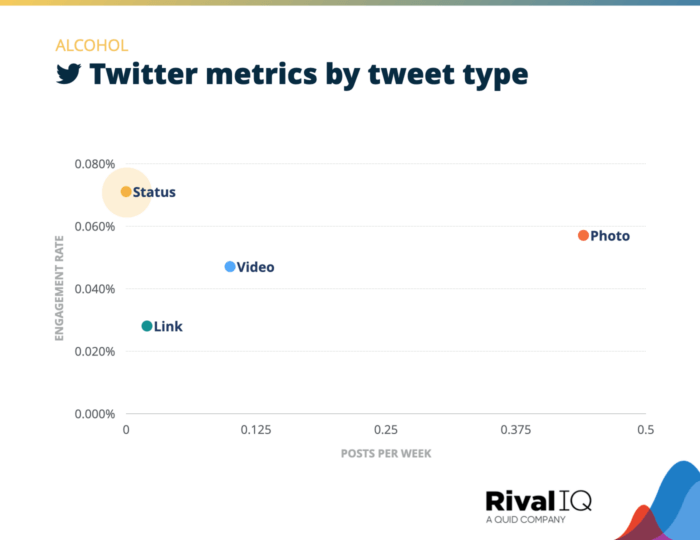
One brand example of a successful Status Update comes from White Claw. Considering the fact that Twitter is a conversation-driven platform, tweets that encourage users to reply perform particularly well. The one below, which earned 15x the median engagement rate for alcohol brands, is a prime example of how witty humor and a strategic prompt can get followers to engage — no video or photo needed.
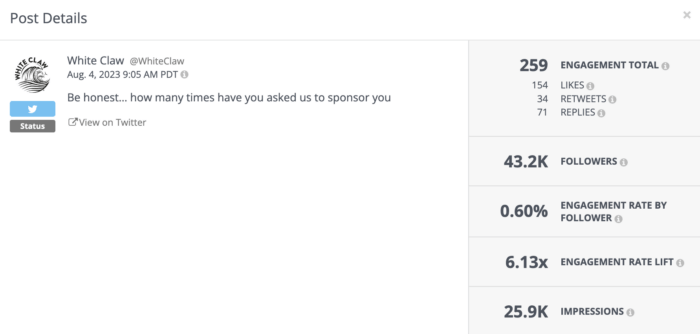
In some cases, simply asking for engagement pays off. Prompting your followers to reply to a tweet can be a simple yet effective way to generate engagement.
In other cases, visuals are a much-welcomed addition. Night Shift Brewery’s tweet about the release of its Captain 37: The Patrice Pilsner featured a crisp image of the beer that complemented its announcement and sparked excitement about the new product. Replies were filled with curious questions and, with Twitter being the ideal platform for efficient interactions, the brand quickly responded with answers.
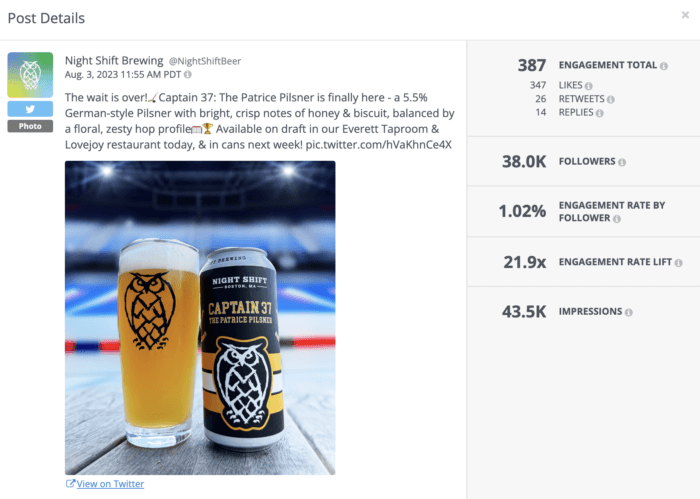
All in all, the tweet earned a 1.02% engagement rate which is 25 times better than the median rate for Alcohol brands and 35 times higher than the all-industry rate. Clearly, Twitter is still a great space for making major announcements and engaging with your brand’s community.
Key Takeaways for Twitter Engagement
If you want to accurately measure and improve your brand’s Twitter performance, marketers must know how to calculate Twitter engagement rate and have a benchmark to compare it with.
To sum it up, the overall median engagement rate on Twitter is 0.029% and the median posting frequency is 3.31 times per week. These are the numbers to aim for if you want to compete with the majority of brands.
If you want to boost your Twitter engagement rate, here are a few best practices to follow as demonstrated by some of the top-performing brands we covered:
- Be timely and participate in relevant conversations by tapping into trending topics and hashtags.
- Mix up your post types between Photos and Status Updates to see what your followers engage with most.
- Entertain and educate your followers using memes and threads.
- Twitter is a place for two-way conversations — reply back to your followers to keep the comments active.
As the Twitter (X) landscape continues to evolve, so will the average engagement rate for brands. As long as you continue to measure your performance, compare it with the competition, and adjust accordingly, your brand has an opportunity to break through the noise and create content that keeps your audience engaged for the long run.
This post was originally published in March 2022 and has since been updated.
