It’s here! The 2022 edition of the Social Media Industry Benchmark Report is hot off the presses for all your competitive context needs.
For the sixth (!) year in a row, we’ve got the most important social media benchmarks from the 14 top industries: Alcohol, Fashion, Financial Services, Food & Beverage, Health & Beauty, Higher Education, Home Decor, Hotels & Resorts, Influencers, Media, Nonprofits, Retail, Sports Teams, and Tech & Software.
This report is for you if you’ve ever asked yourself (or been asked) “How am I really doing on social?” From posting frequency to post types to hashtag use and beyond, we surveyed millions of posts and billions of engagements on Facebook, Instagram, and Twitter from top brands in every major industry to bring you the freshest social media benchmark data.
Now, let’s get benchmarking!
Social Media Benchmark Key Takeaways
| Brands saw less organic engagement this year. Declining engagement rates on Facebook, Instagram, and Twitter reflect that social media is increasingly becoming a pay-to-play space. | |
| Posting frequency on the rise. Brands have increased their posting frequency on all three channels to increase bites at the engagement apple. |
|
| Contest and holidays topped the hashtag charts. Nearly every industry found success with giveaways and hashtag holidays ranging from #Halloween to #MayThe4thBeWithYou. |
|
| Every brand should post carousels on Instagram. What’s the secret behind this ultra-engaging post type? Instagram carousels often get re-served to users who don’t engage the first time, earning them more impressions. |
|
| Keep an eye on video. Brands are already struggling to keep up with enough video to compete with the popularity of TikTok and YouTube. |
All-Industry Social Media Benchmarks
All-Industry: Facebook
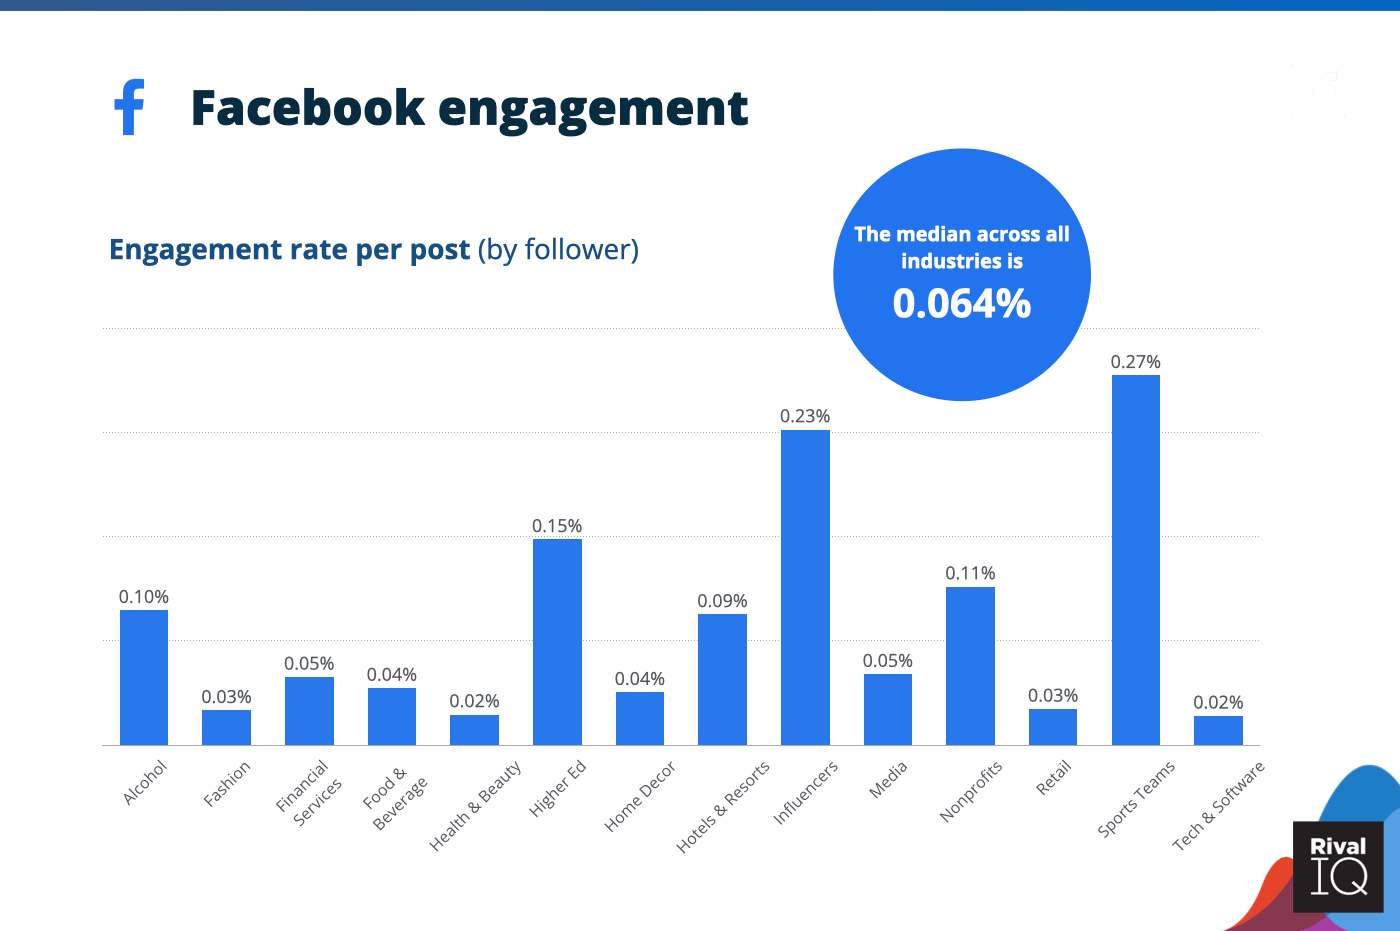
Average Facebook engagement rate per post, all industries
The all-industry Facebook median stayed declined a little this year, though Higher Ed and Sports Teams were able to boost their engagement rates.
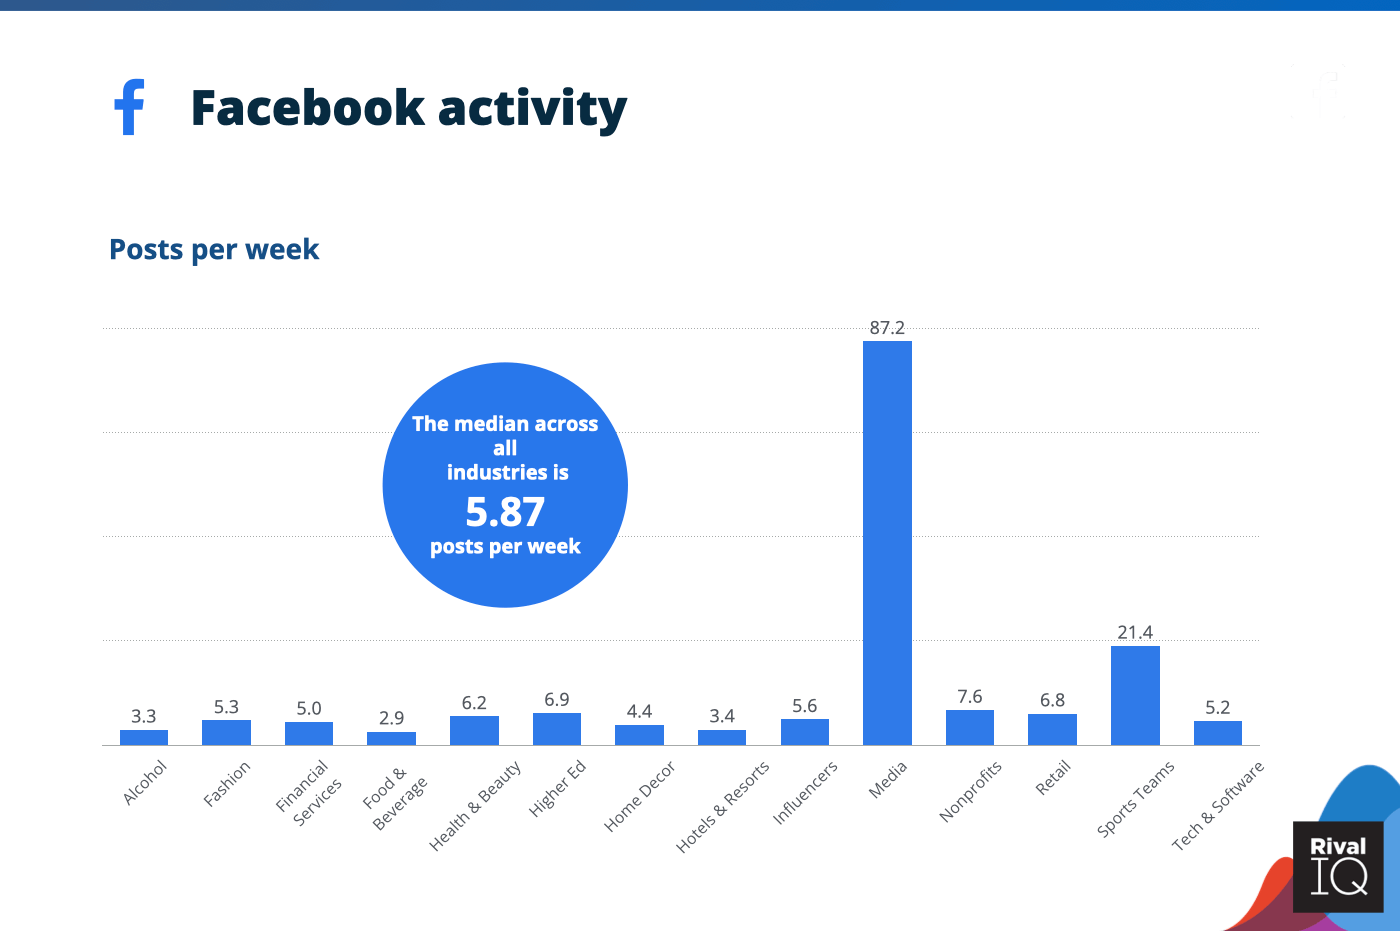
Average Facebook posts per week, all industries
Median posting frequency on Facebook ticked up by a few points this year.
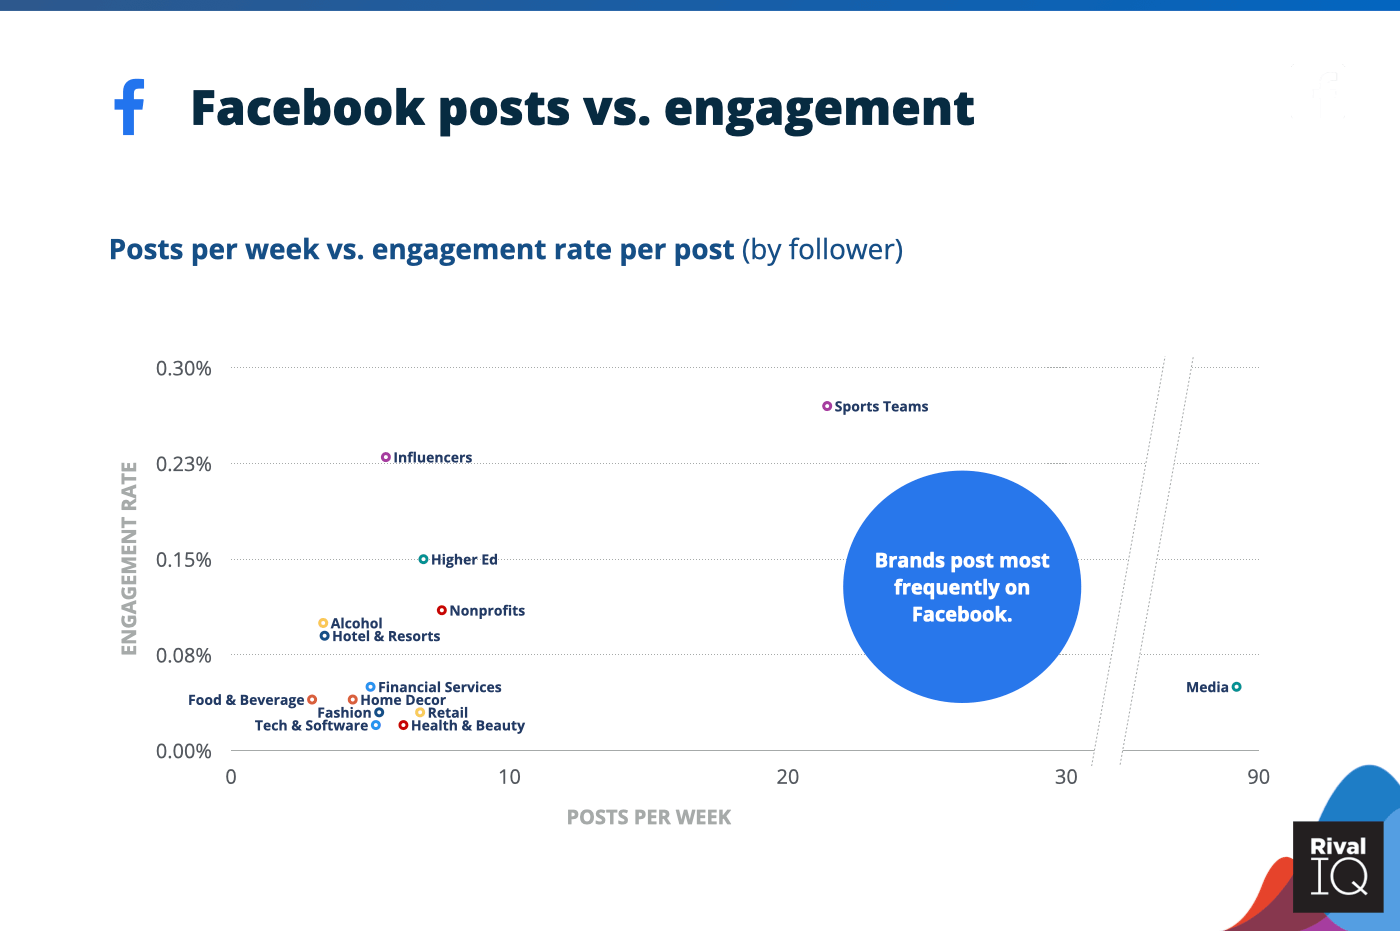
Facebook posts per week vs. engagement rate per posts, all industries
Influencers (infrequent posters) and Sports Teams (frequent posters) earn consistently high marks on Facebook despite a big delta in posting frequency.
All-Industry: Instagram
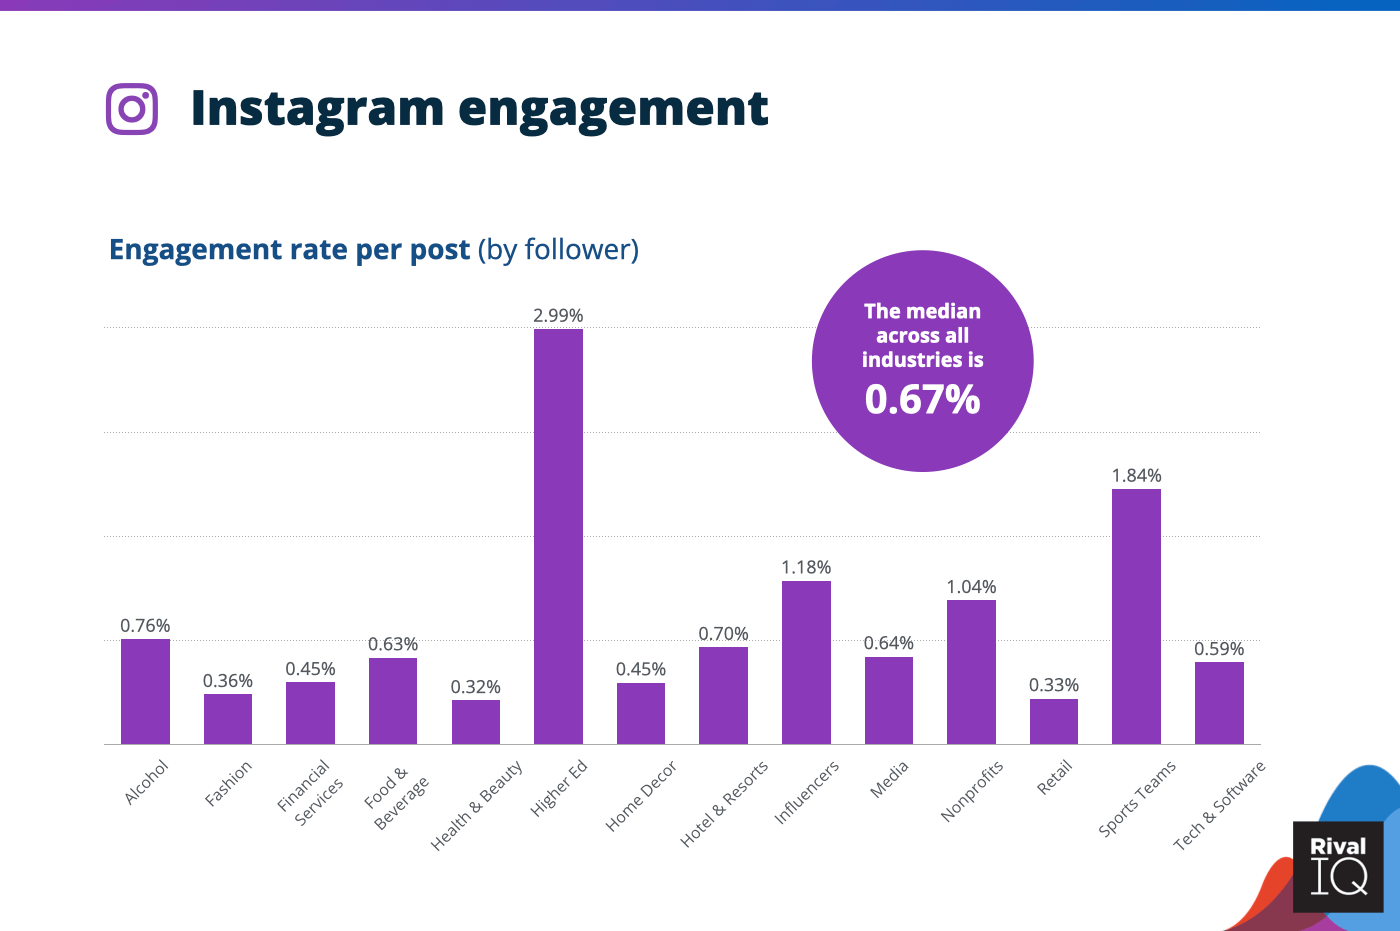
Average Instagram engagement rate per post, all industries
Instagram engagement rates fell by about 30% this year, which is sobering news for any social media professional. The good news? Instagram engagement rates are still way higher than Facebook or Twitter.
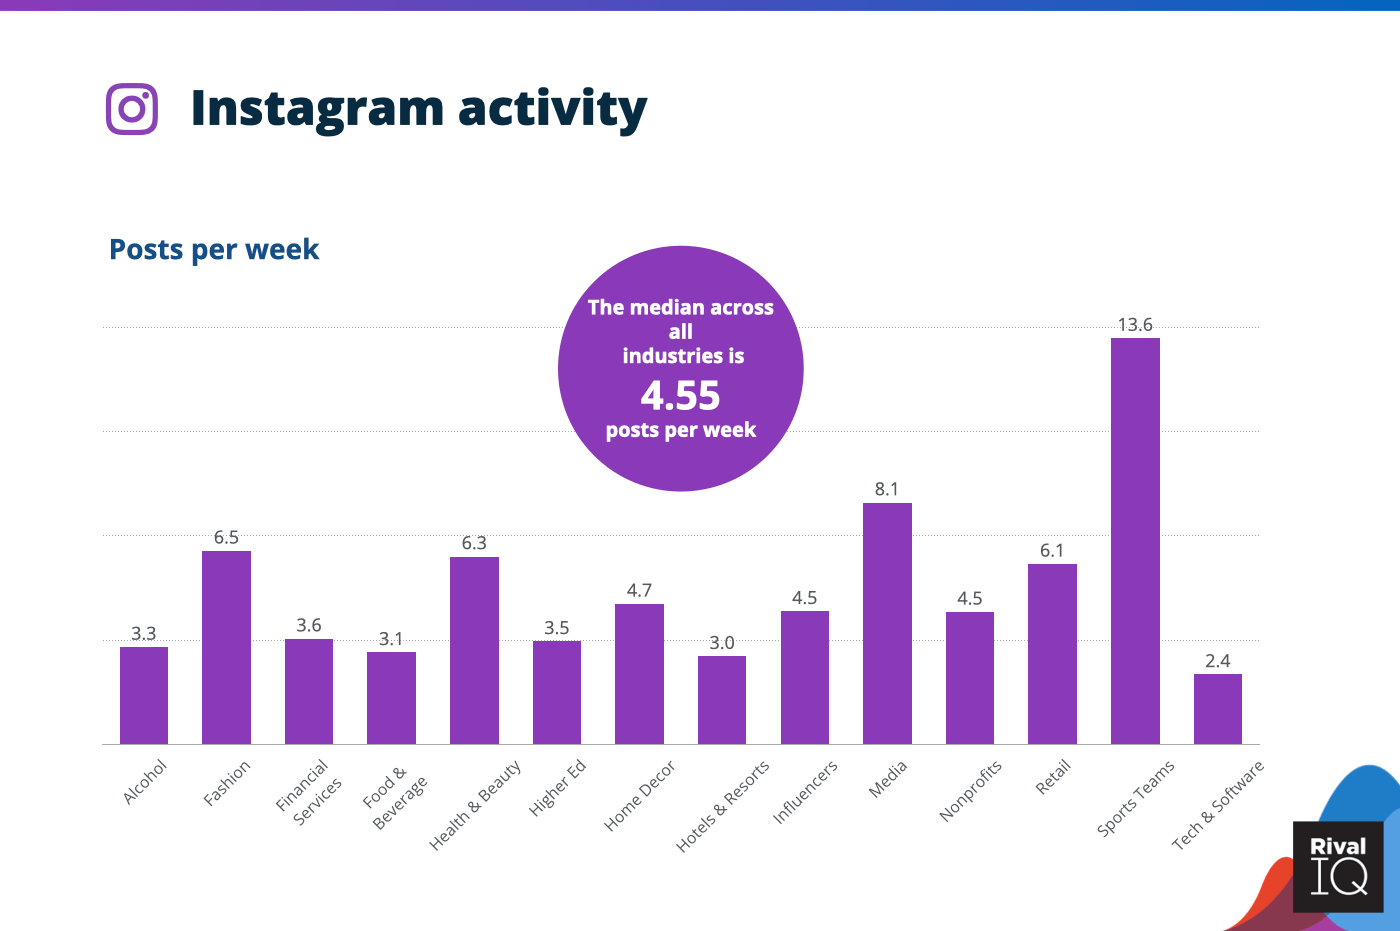
Average Instagram posts per week, all industries
The median posting frequency across all industries increased about 25% this year on Instagram.
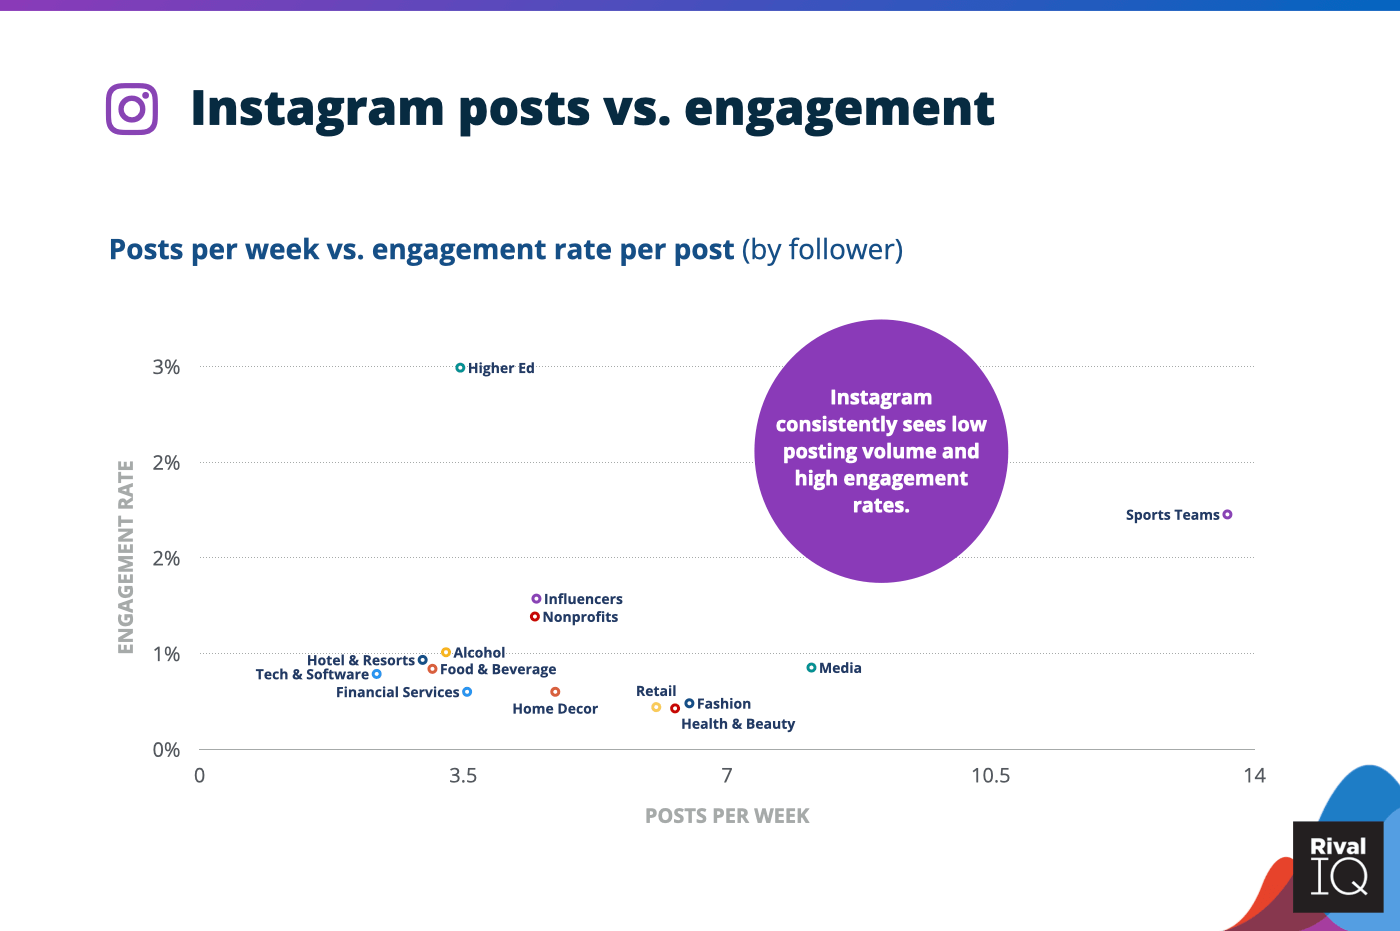
Instagram posts per week vs. engagement rate per posts, all industries
Higher Ed was the clear engagement winner on Instagram despite below-median posting frequency, suggesting more isn’t always better on Instagram (though second-place Sports Teams might beg to differ).
All-Industry: Twitter
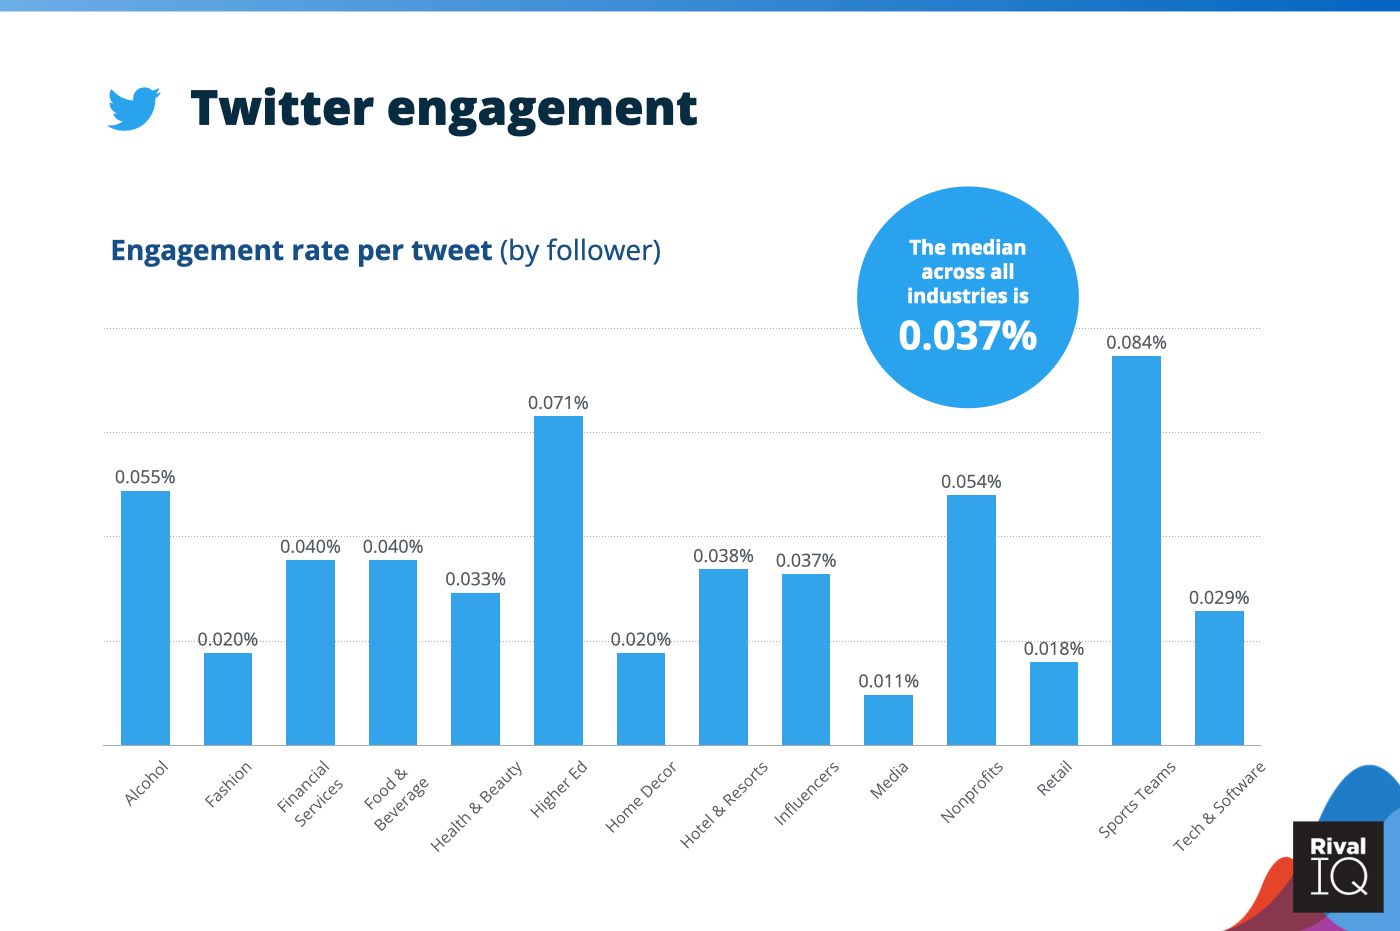
Average Twitter engagement rate per tweet, all industries
Health & Beauty, Influencers, Nonprofits, and Sports Teams were able to increase their Twitter engagement rates.
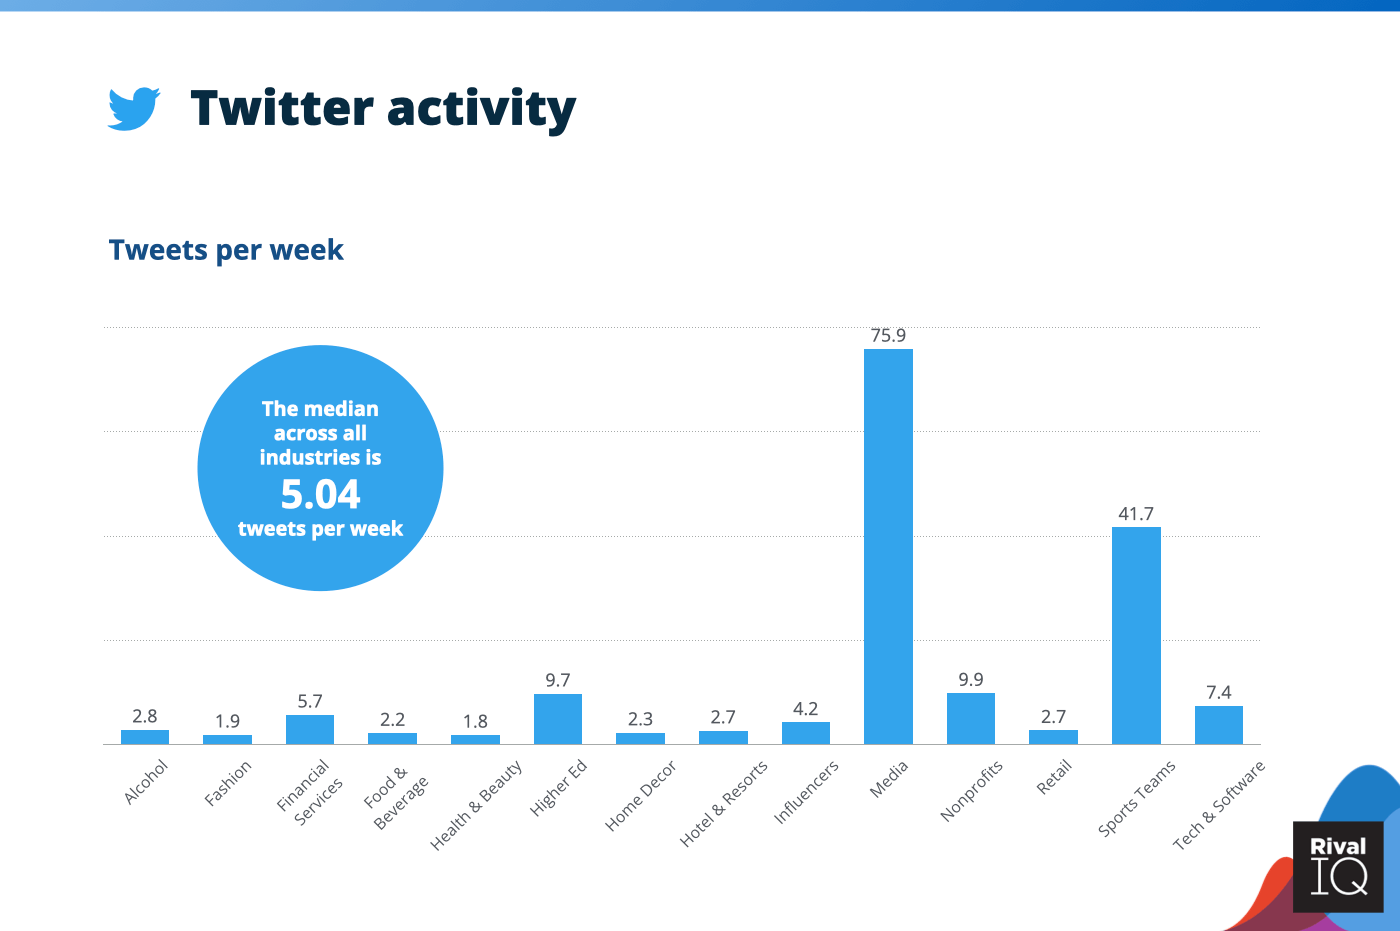
Average Twitter tweets per week, all industries
Tweeting frequency rose about 13% this year, and Media and Sports Teams tweeted more than all the rest of the industries combined on Twitter (as usual).
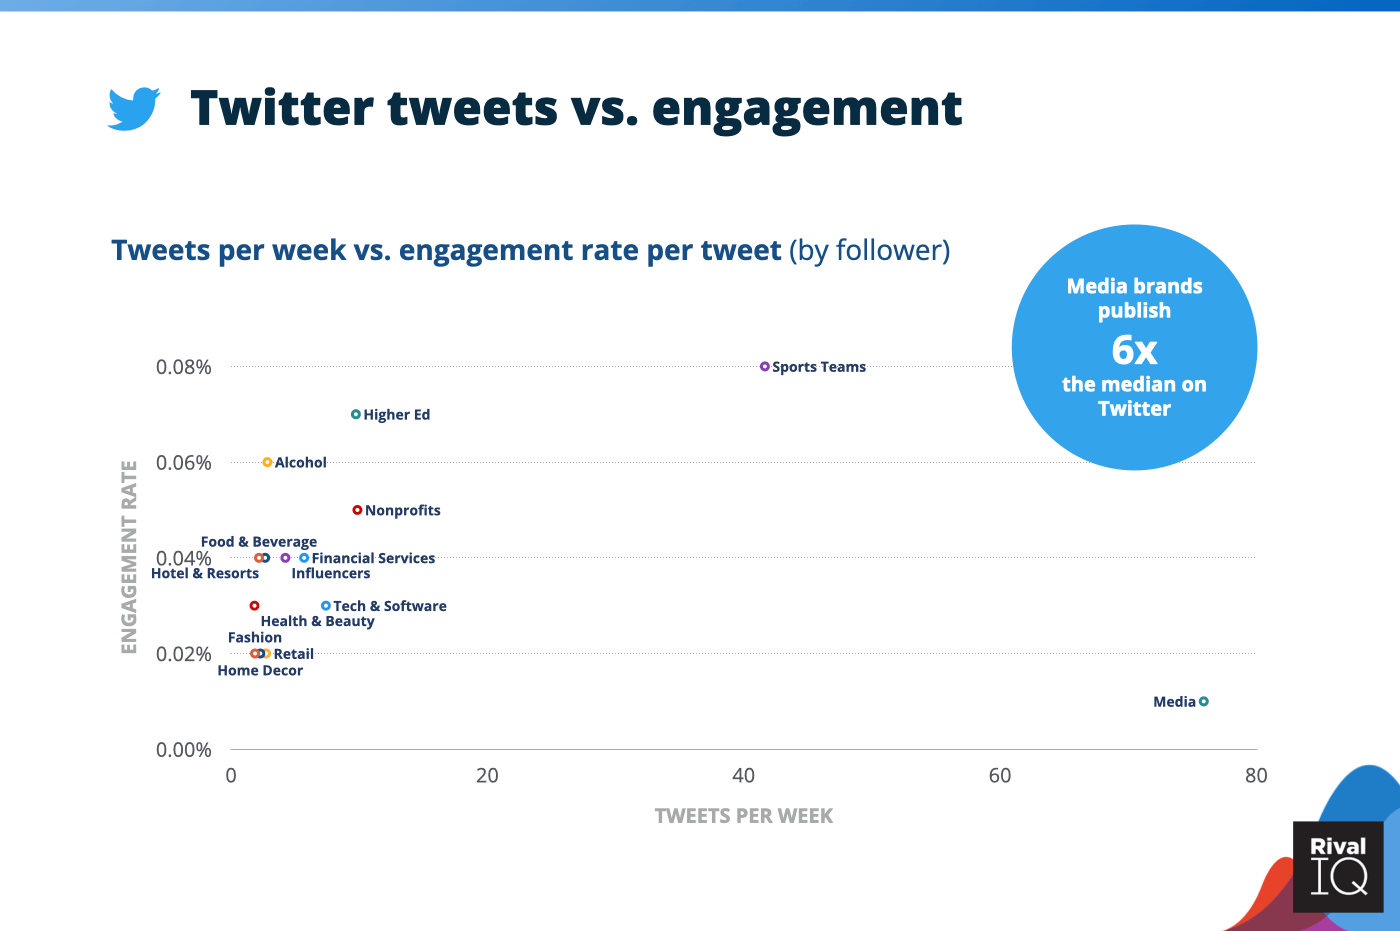
Twitter tweets per week vs. engagement rate per tweets, all industries
Frequent tweeters Higher Ed and Sports Teams came out ahead on Twitter this year, but last-place Media showed other industries that higher tweet frequency isn’t always better.
Alcohol Social Media Benchmarks
Alcohol brands won the bronze on Twitter again and performed above the median on Facebook and Instagram.
A few ways Alcohol brands can keep up the pace:
- Photos outperformed videos on every channel, and were especially successful on Twitter.
- Holiday hashtags topped the charts for Alcohol brands this year, so be sure to lean into the festivities in 2022.
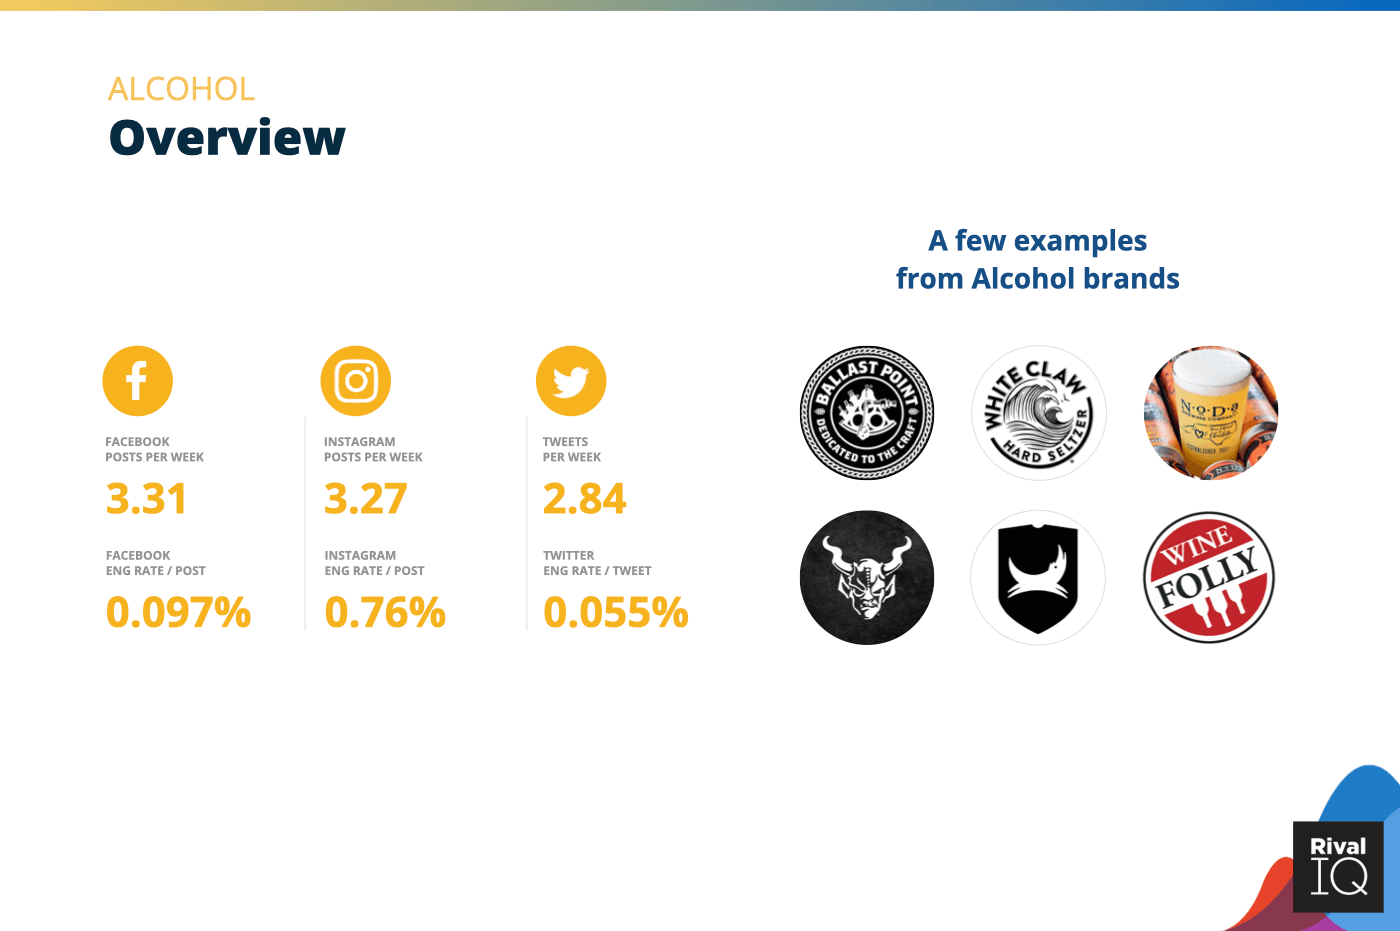
Overview of all benchmarks, Alcohol
Notable brands in this year’s report include Ballast Point Brewing Company, NoDa Brewing Company, Brew Dog, White Claw Hard Seltzer, Stone Brewing, and Wine Folly.

Posts per week and engagement rate per post across all channels, Alcohol
Alcohol was the third-most engaging industry on Twitter by rate but put the least posting energy to that channel. Beer, wine, and liquor brands might want to focus more time there.

Facebook posts per week and engagement rate by post type, Alcohol
Alcohol brands were much likelier to post a photo on Facebook than any other post type, which is handy, since photo posts outperformed all other post types by a long shot.
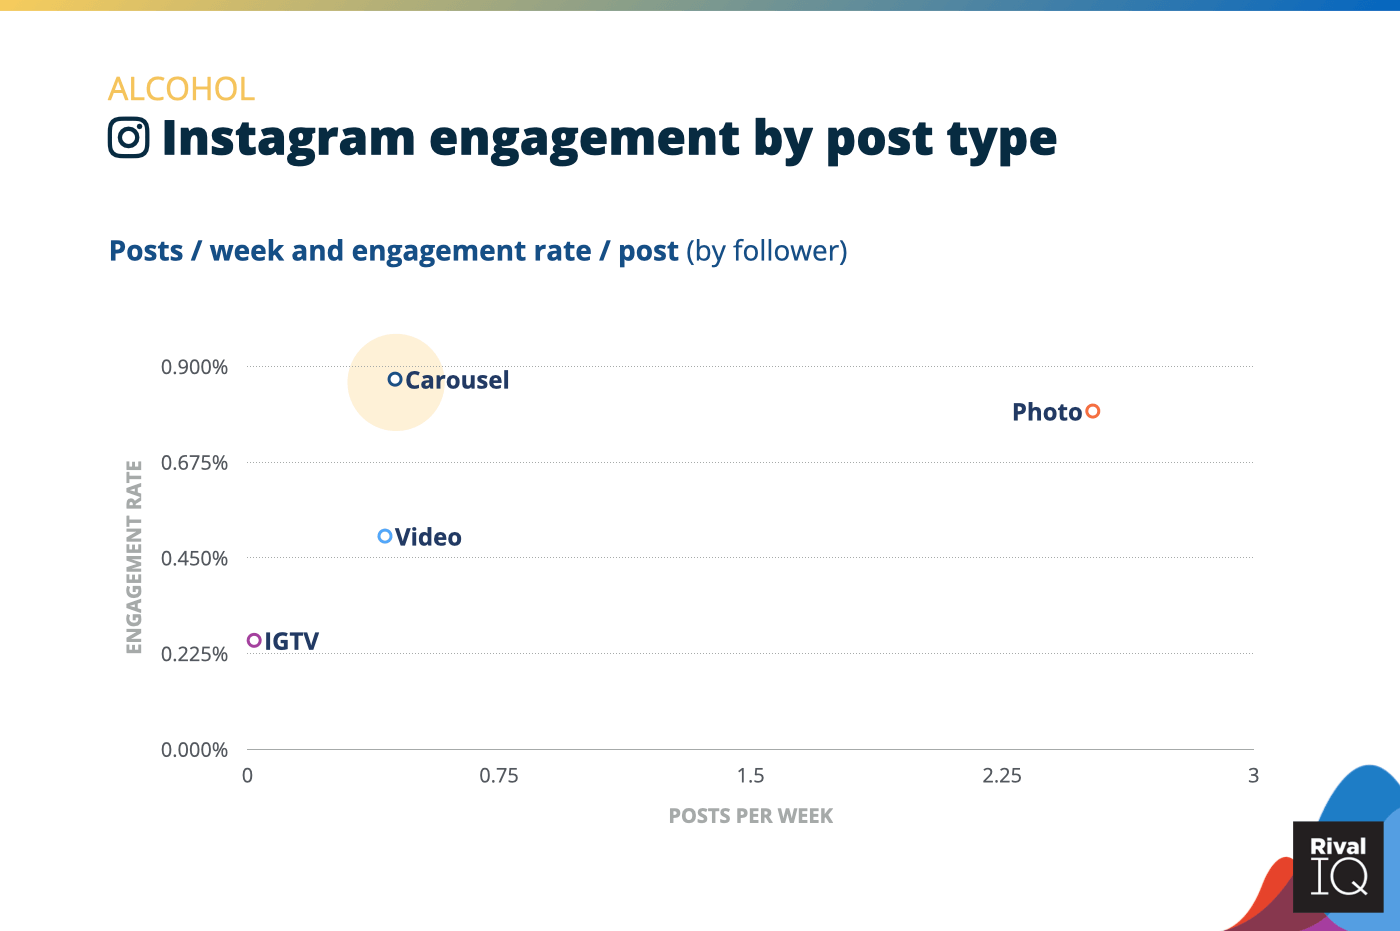
Instagram posts per week and engagement rate by post type, Alcohol
Carousels grabbed the highest engagement rates for Alcohol brands, who were much likelier to post photos on Instagram. Consider combining a few of those single-photo posts into high-performing carousels.
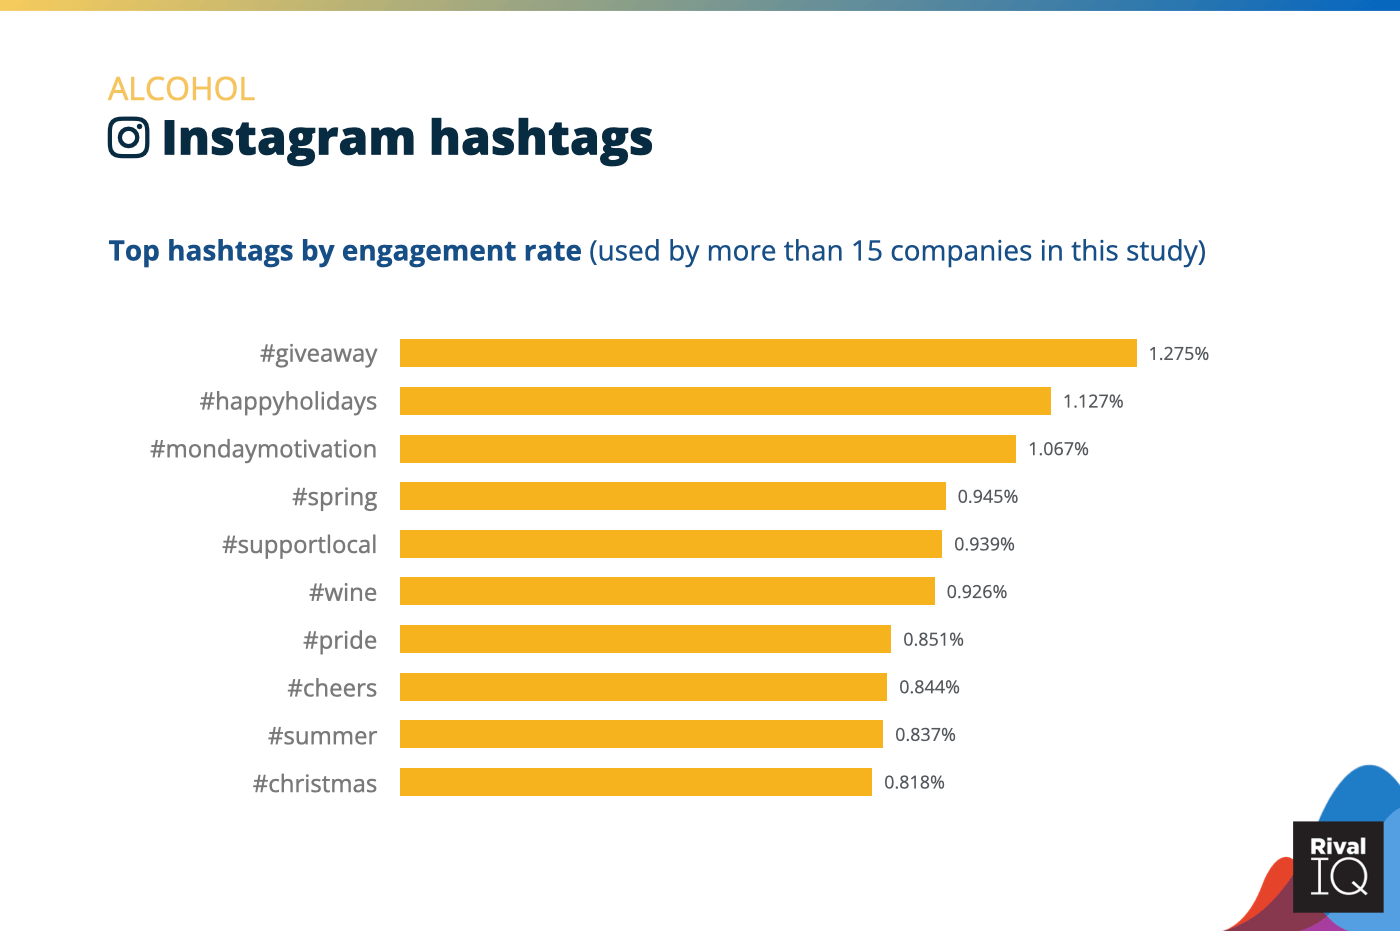
Top Instagram hashtags by engagement rate, Alcohol
Holidays and seasons topped the charts for Alcohol brand hashtags on Instagram this year.
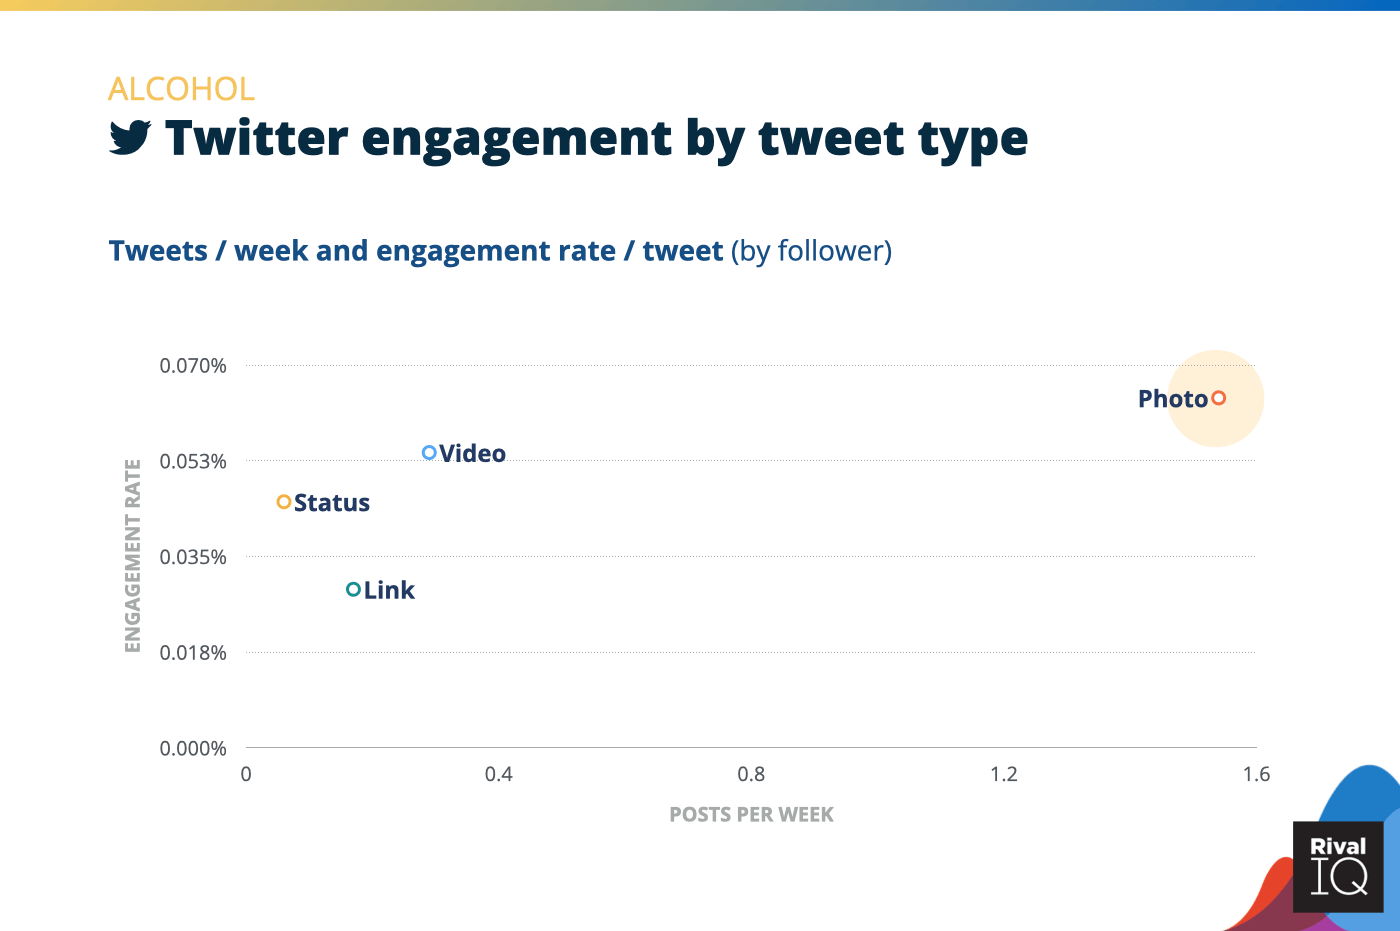
Twitter posts per week and engagement rate by tweet type, Alcohol
Alcohol brands outperformed many other industries on Twitter this year thanks in part to focusing on high-performing photo tweets.
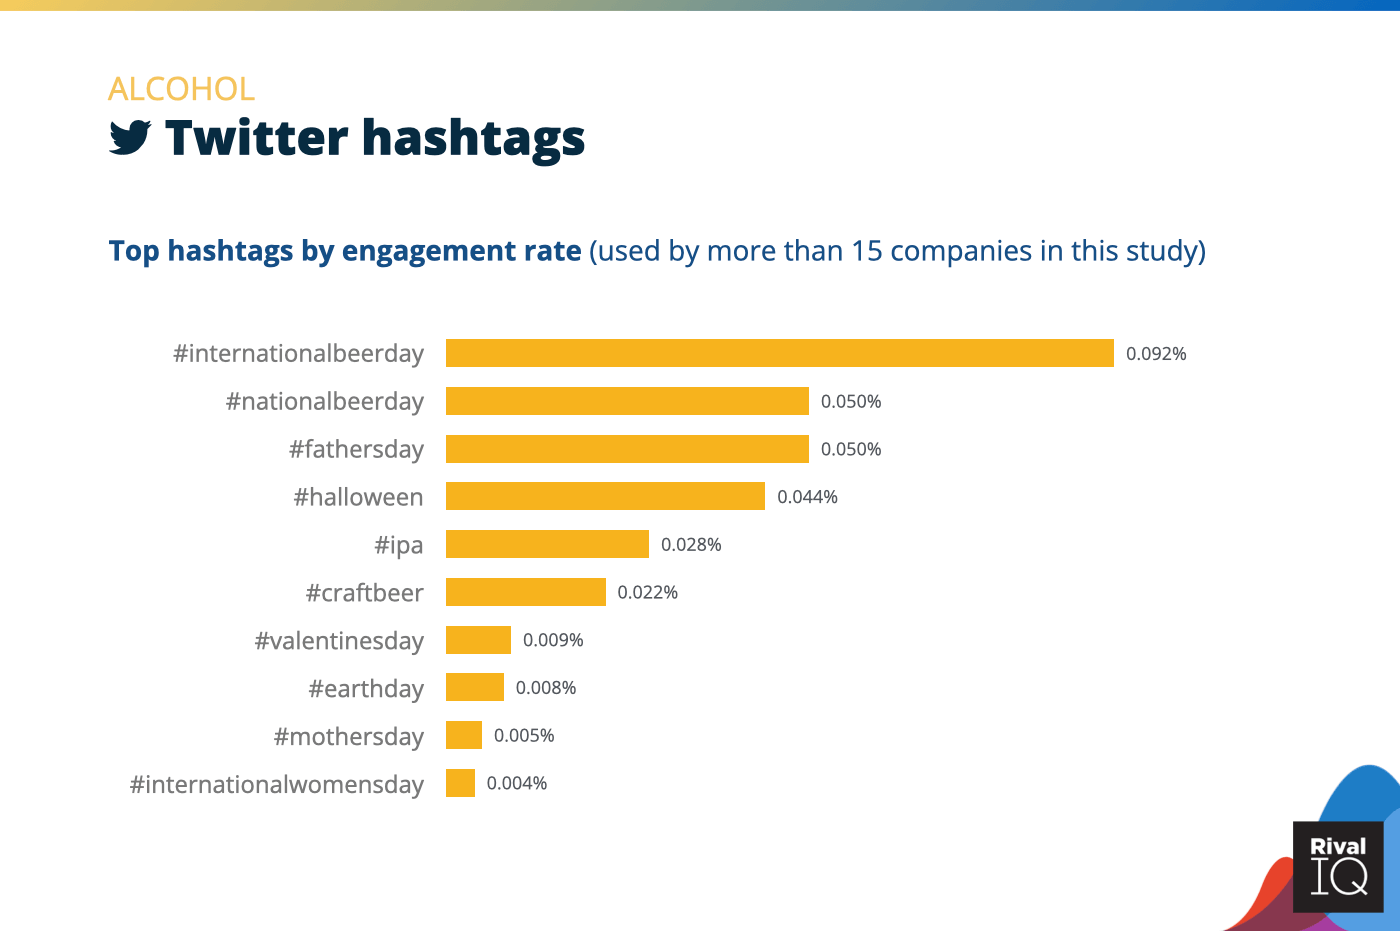
Top Twitter hashtags by engagement rate, Alcohol
Alcohol followers clearly raised a glass to all things #NationalBeerDay this year.
Fashion Social Media Benchmarks
Fashion brands struggled to keep engagement rates up on Facebook, Instagram, and Twitter despite regular posting.
Some suggestions for Fashion brands:
- Carousels are key to any brand’s Insta success: they outperform photos and videos because Instagram often re-serves them to folks who didn’t engage with the post the first time around.
- #ValentinesDay and #competition hashtags were top performers, so be sure to measure performance and replicate what works.
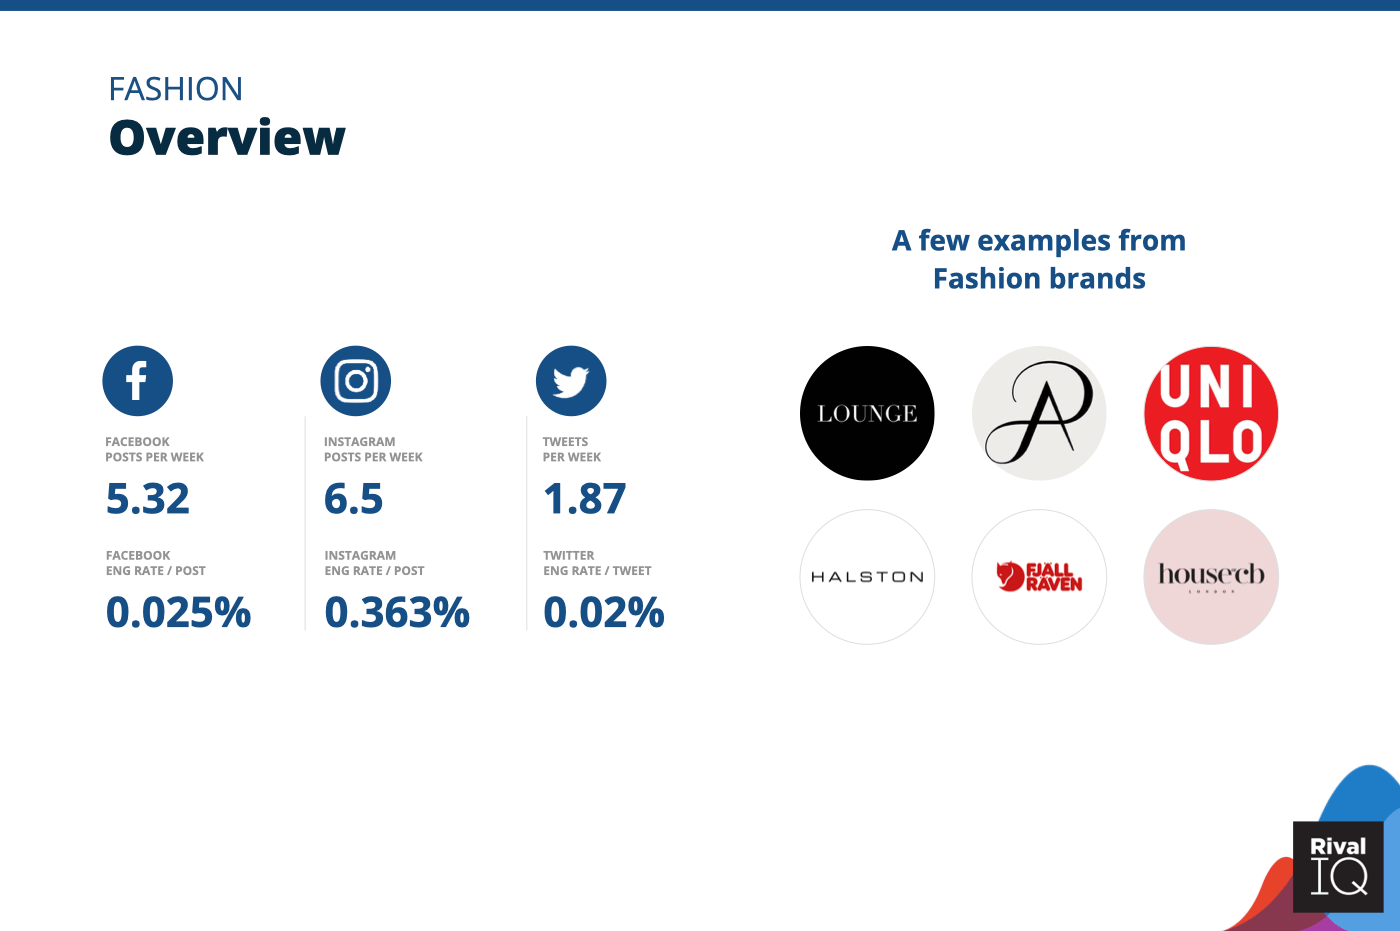
Overview of all benchmarks, Fashion
Notable brands in this year’s report include Lounge Underwear, Uniqlo, Fjallraven, Adrianna Papell, Halston, and House of CB.
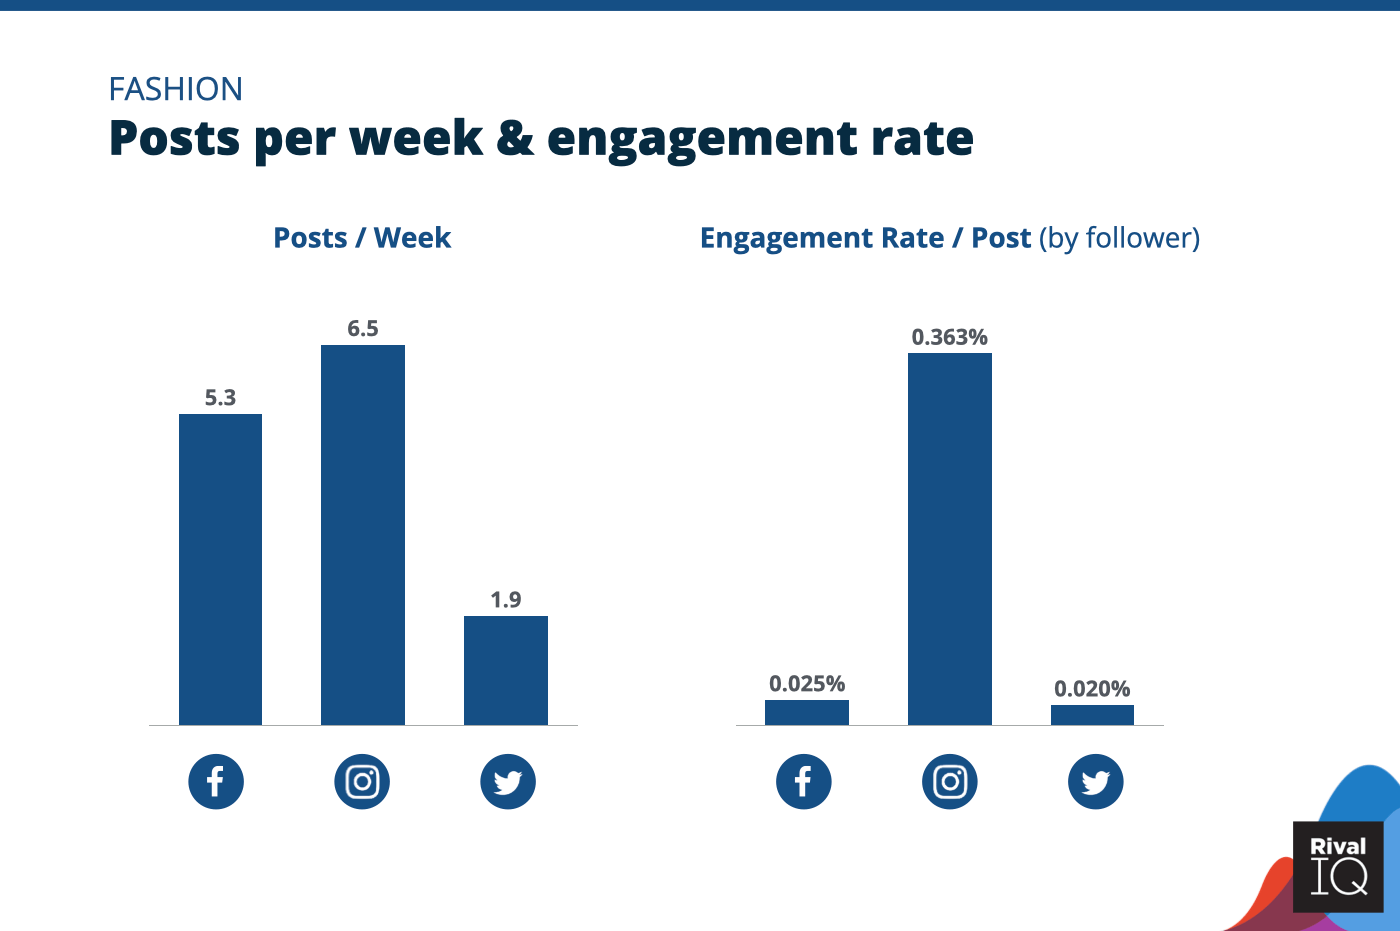
Posts per week and engagement rate per post across all channels, Fashion
Fashion brands saw low engagement rates on both Facebook and Twitter, but were more than twice as likely to post on Facebook.

Facebook posts per week and engagement rate by post type, Fashion
Photos were twice as engaging as the next best post type for Fashion brands on Facebook.
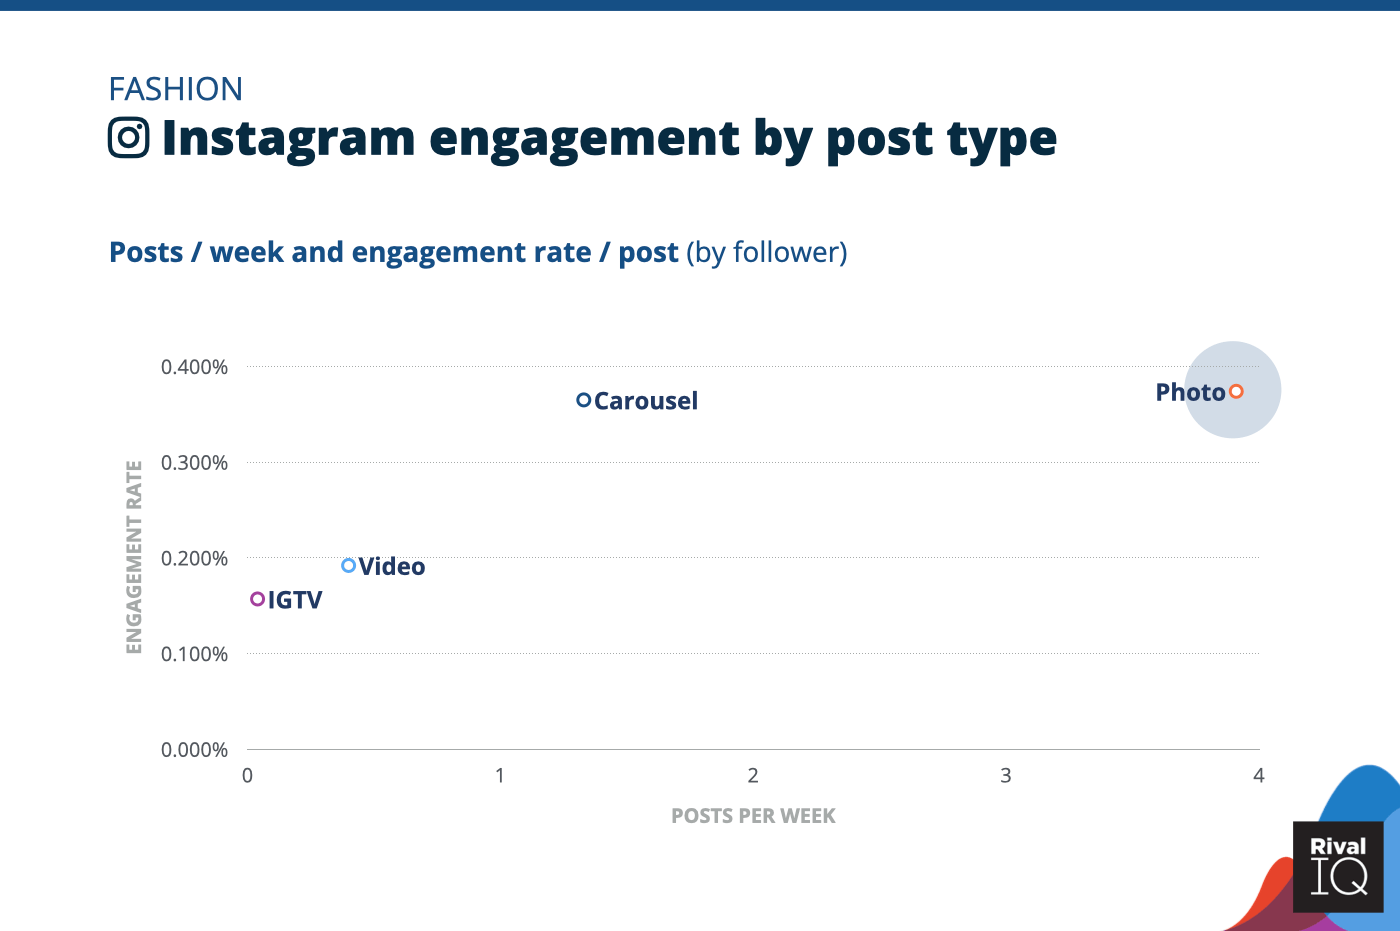
Instagram posts per week and engagement rate by post type, Fashion
Photos and carousels garner near-identical engagement rates for Fashion brands, who are twice as likely to post a photo on Instagram. Try combining photos into carousels by theme to supercharge engagement rates.
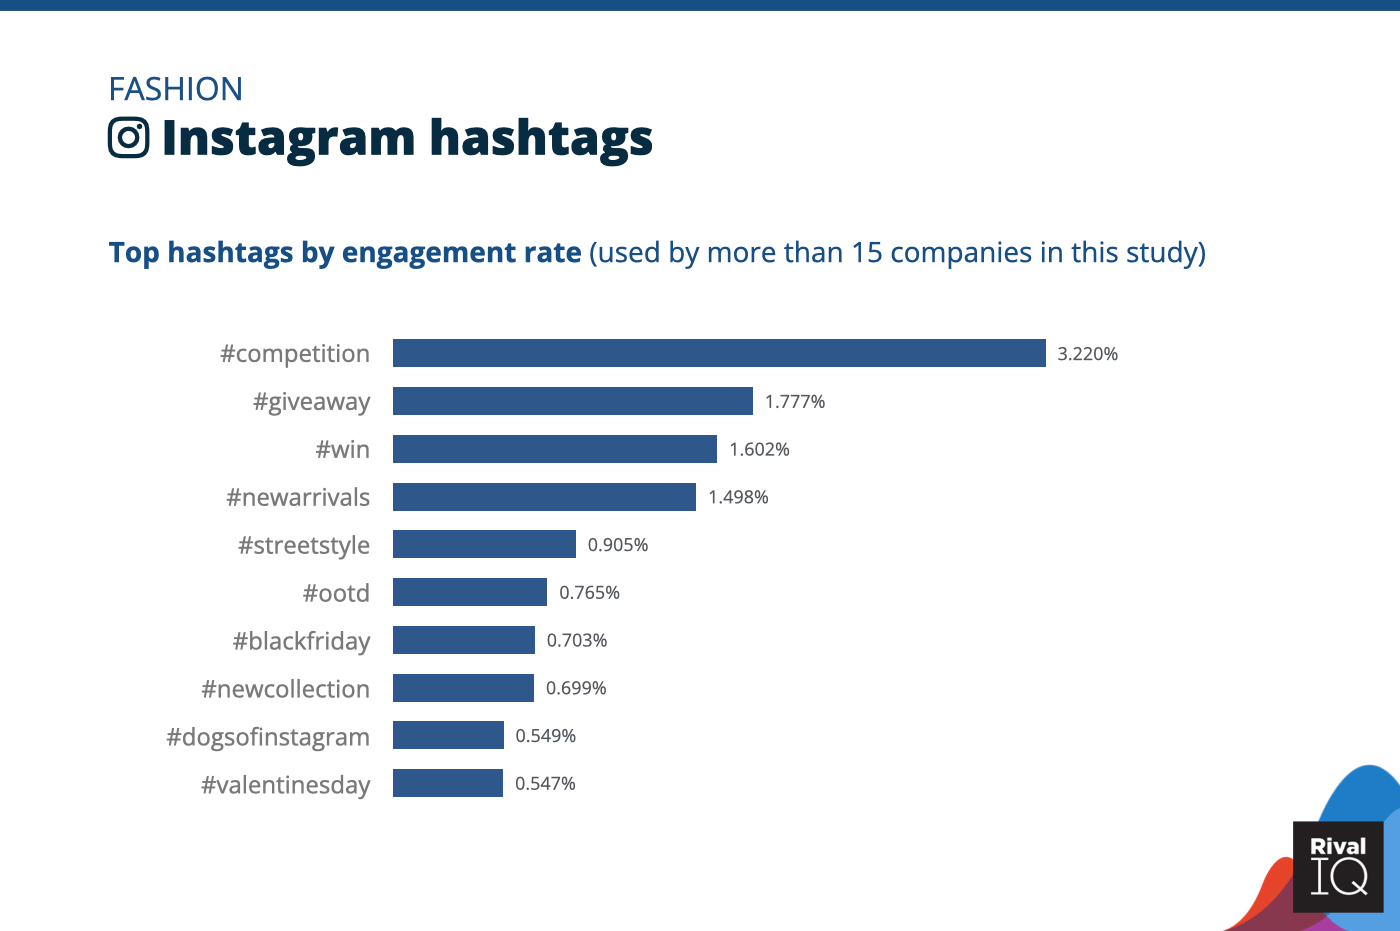
Top Instagram hashtags by engagement rate, Fashion
Fashion brands used #competition to grab nearly twice the engagement rates of the next most engaging hashtag. Giveaways and wins rounded out the winner’s podium for these brands.

Twitter posts per week and engagement rate by tweet type, Fashion
Many Fashion brands emphasized photo tweets on Twitter this year, but could up their engagement rates by focusing more on video.
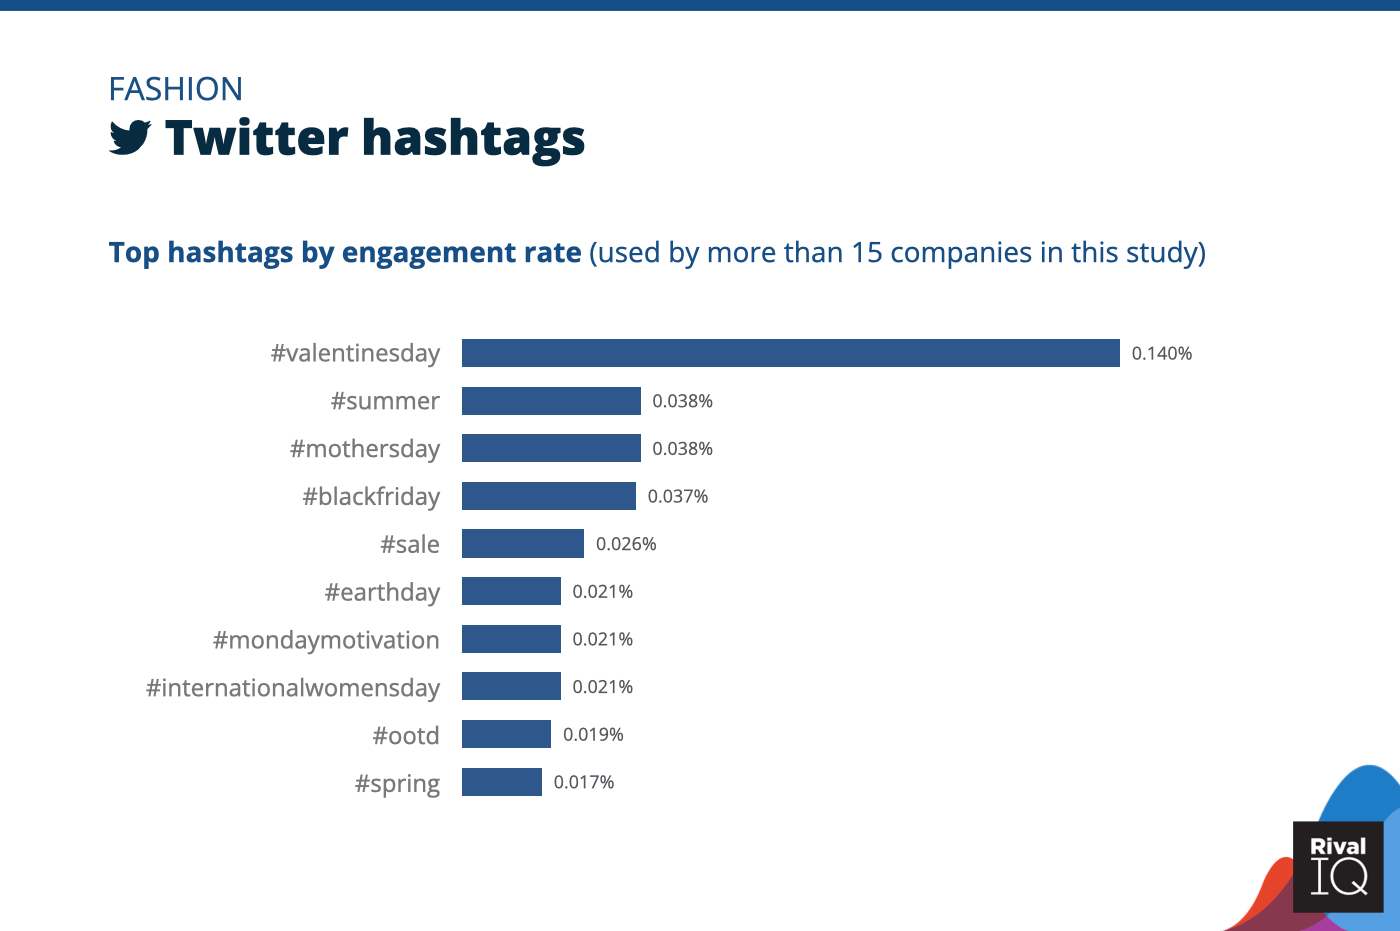
Top Twitter hashtags by engagement rate, Fashion
Fashion brands won big this year with engagement on posts featuring the #ValentinesDay hashtag, which is definitely a strategy to repeat.
Financial Services Social Media Benchmarks
Financial Services brands saw above-median engagement rates on Twitter and was middle of the pack on Facebook.
A few ideas for Financial Services brands:
- More high-engagement videos could help Financial Services brands pull ahead of the pack.
- Diversity, holiday, and finance-themed hashtags dominated on Instagram and Twitter this year.
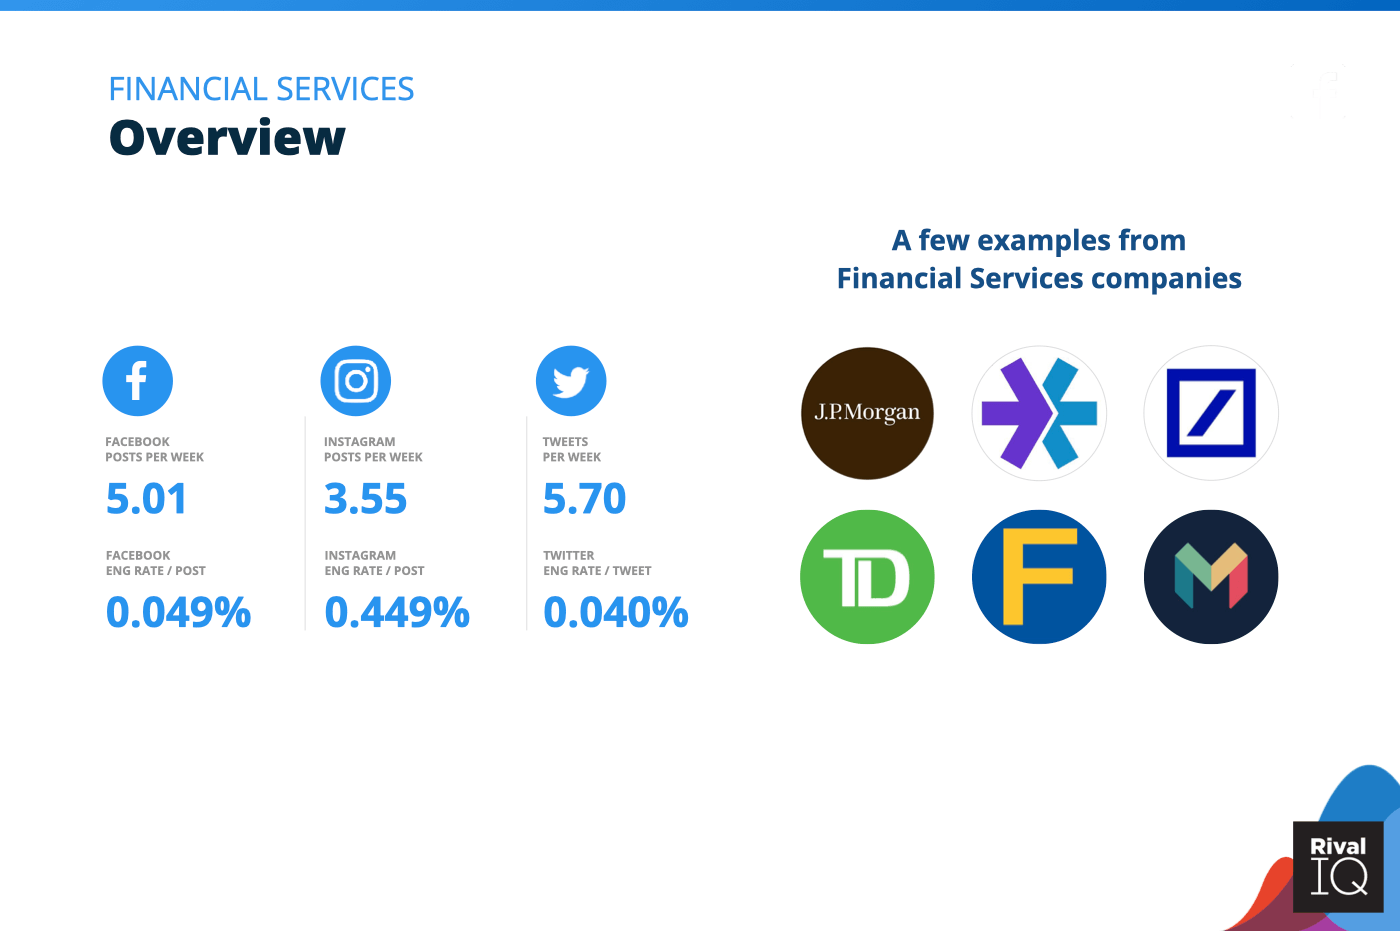
Overview of all benchmarks, Financial Services
Notable brands in this year’s report include JP Morgan, Deutsche Bank, Fineco Bank, E*Trade, TD Auto Finance, and Monzo.
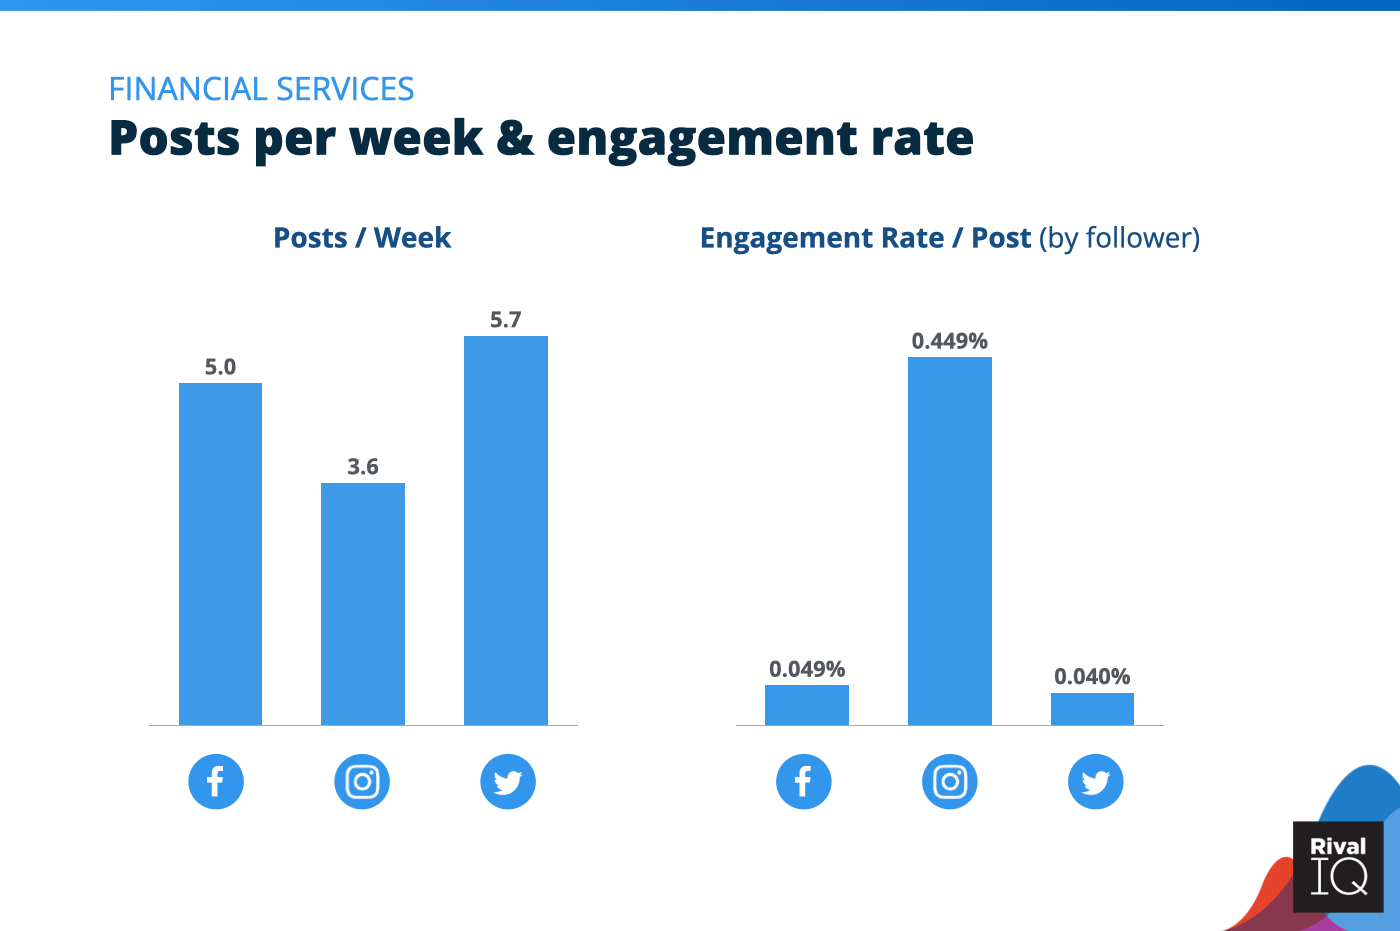
Posts per week and engagement rate per post across all channels, Financial Services
Financial Services sees engagement rates slightly above the median on Twitter, which helps explain the reason the industry has a high tweet per week count.
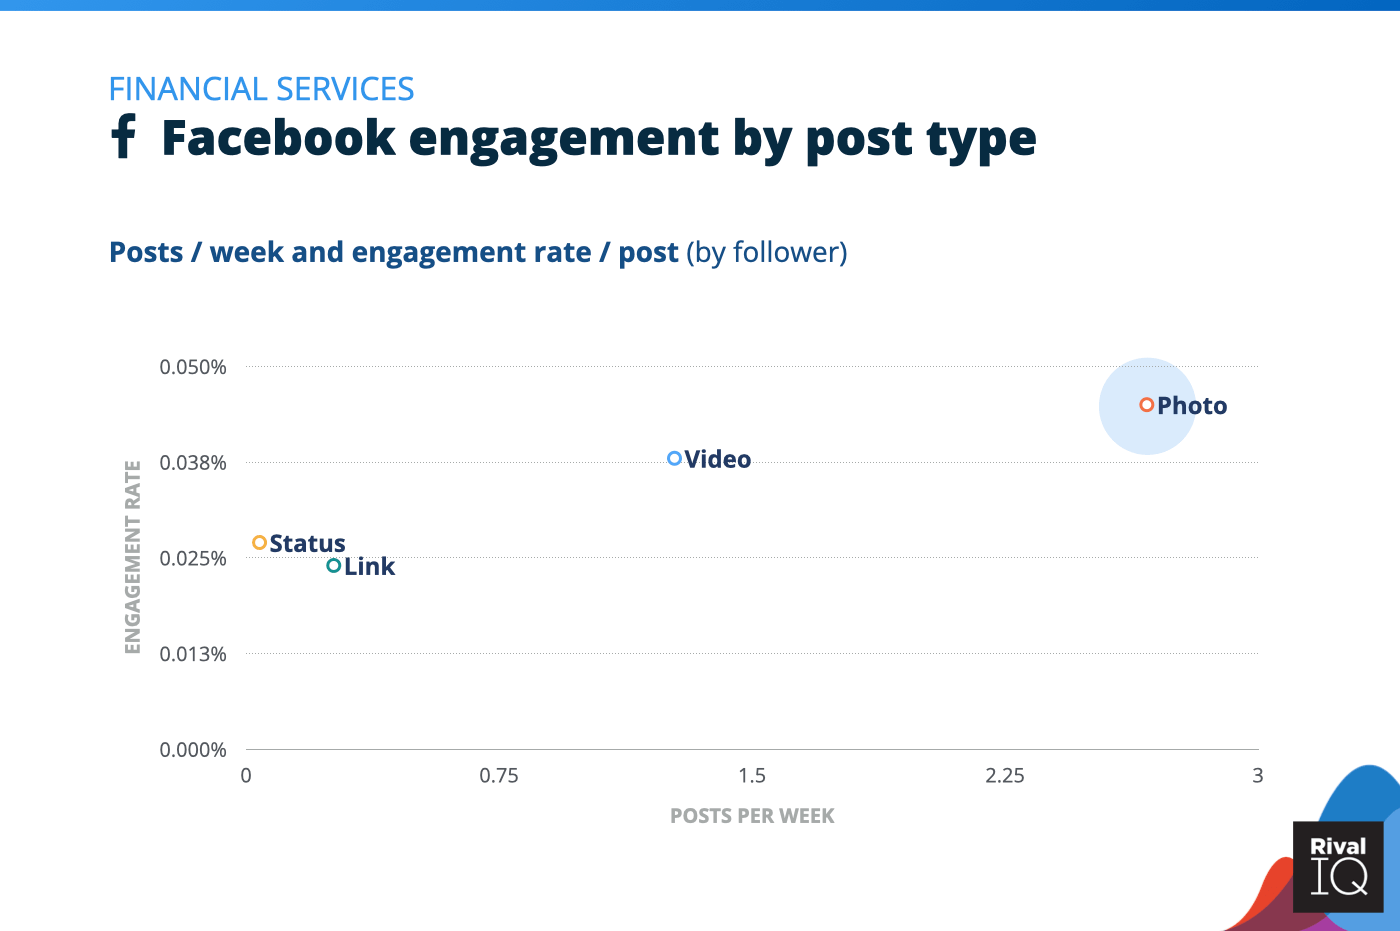
Facebook posts per week and engagement rate by post type, Financial Services
Photo and video posts are top performers on Facebook for Financial Services brands, so it’s good that #FinServ brands are making the most of these post types.
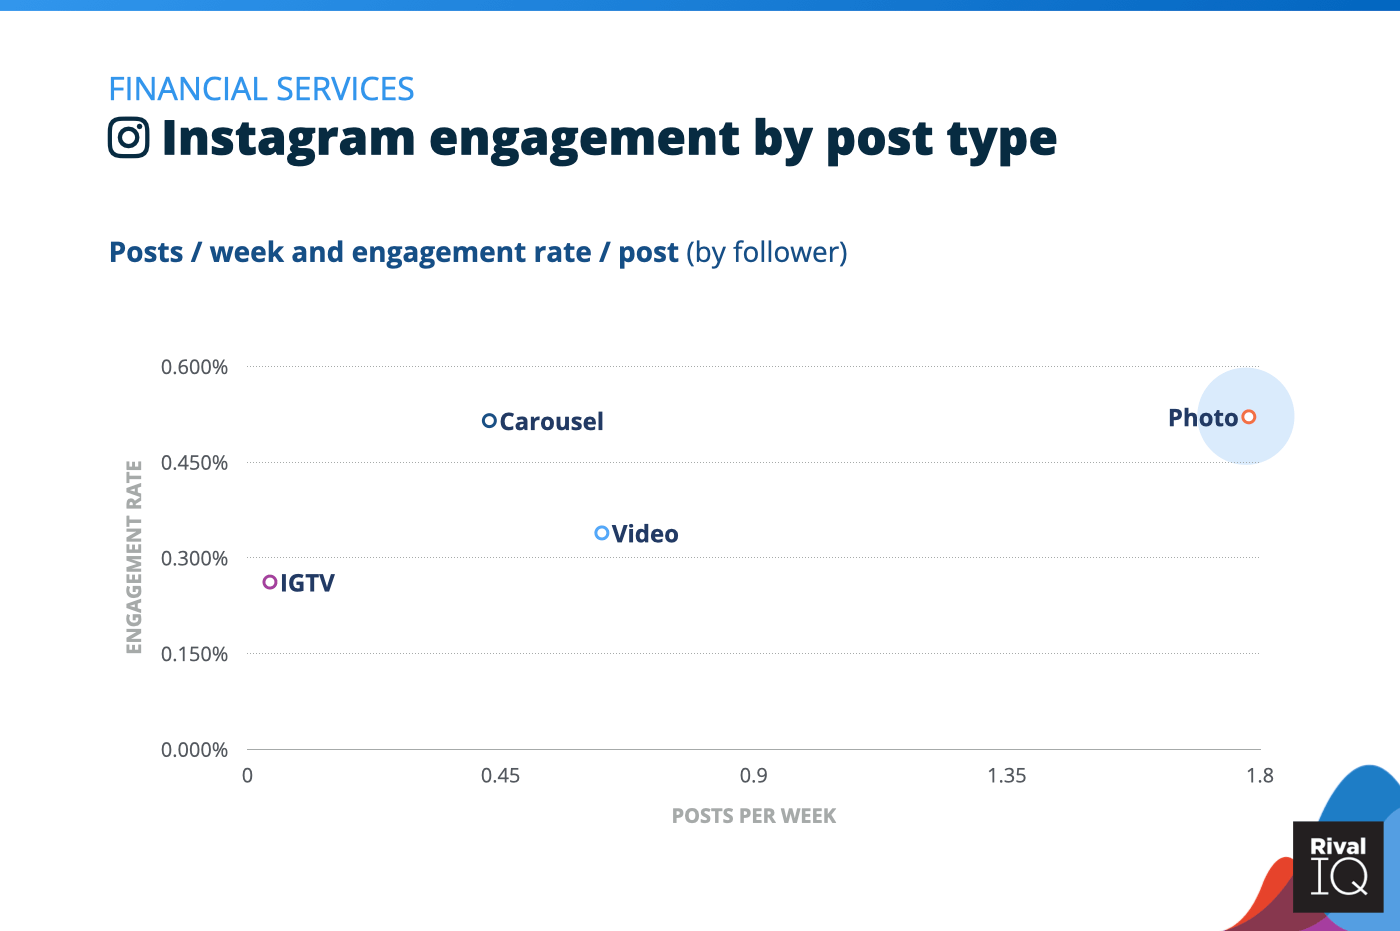
Instagram posts per week and engagement rate by post type, Financial Services
Photo and carousel posts performed almost equally well for Financial Services brands, who were much likely to post photos.
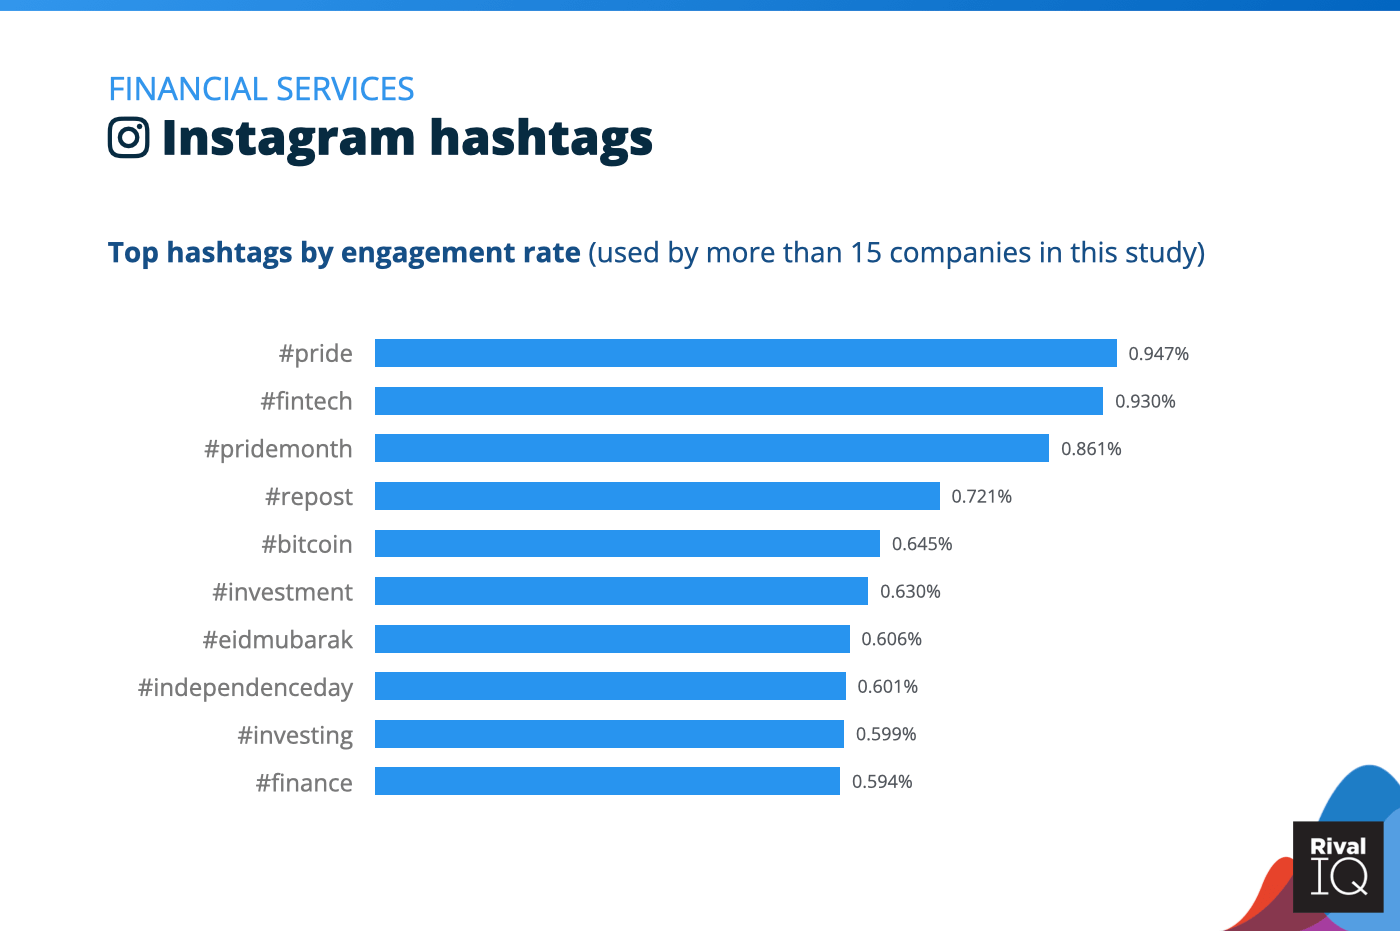
Top Instagram hashtags by engagement rate, Financial Services
We love seeing #Pride and #PrideMonth as trending hashtags for Financial Services brands on Instagram.
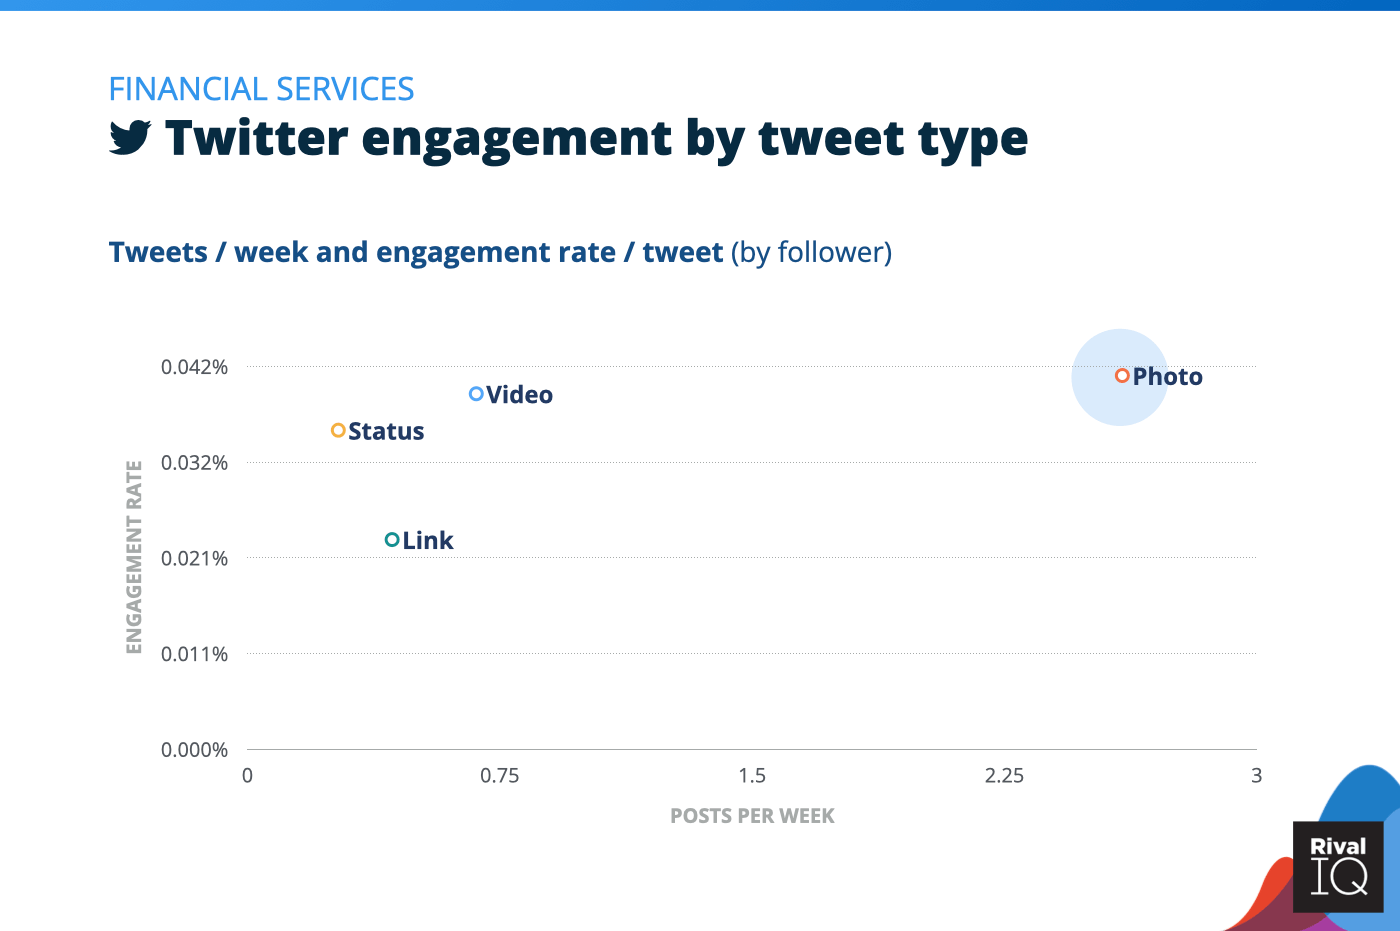
Twitter posts per week and engagement rate by tweet type, Financial Services
Financial Services brands saw great returns from tweeting photos, but might want to try more videos on Twitter to boost engagement rates further.
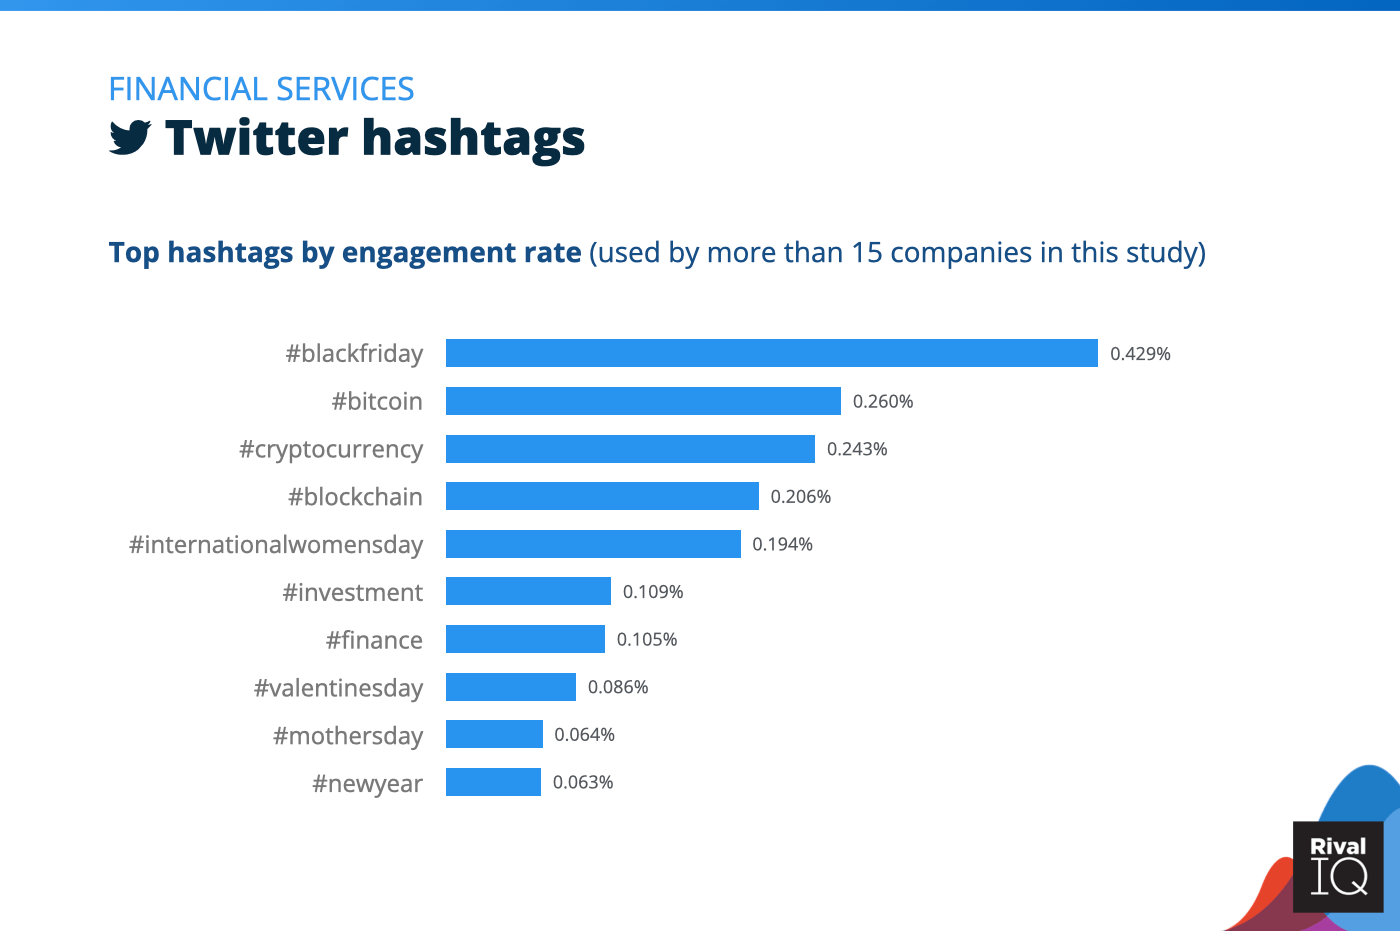
Top Twitter hashtags by engagement rate, Financial Services
#BlackFriday trended hard for Financial Services brands on Twitter this year alongside other holiday-themed hashtags like #ValentinesDay and #MothersDay.
Food & Beverage Social Media Benchmarks
Food & Beverage brands posted below the median frequency on every channel, but managed to beat out many other industries on Twitter.
Some ideas for improvement:
- Contests and giveaways are the hashtag secret sauce for Food & Beverage brands.
- Photos outperformed video on every channel for Food & Beverage brands, so don’t be afraid to invest more in static visuals.
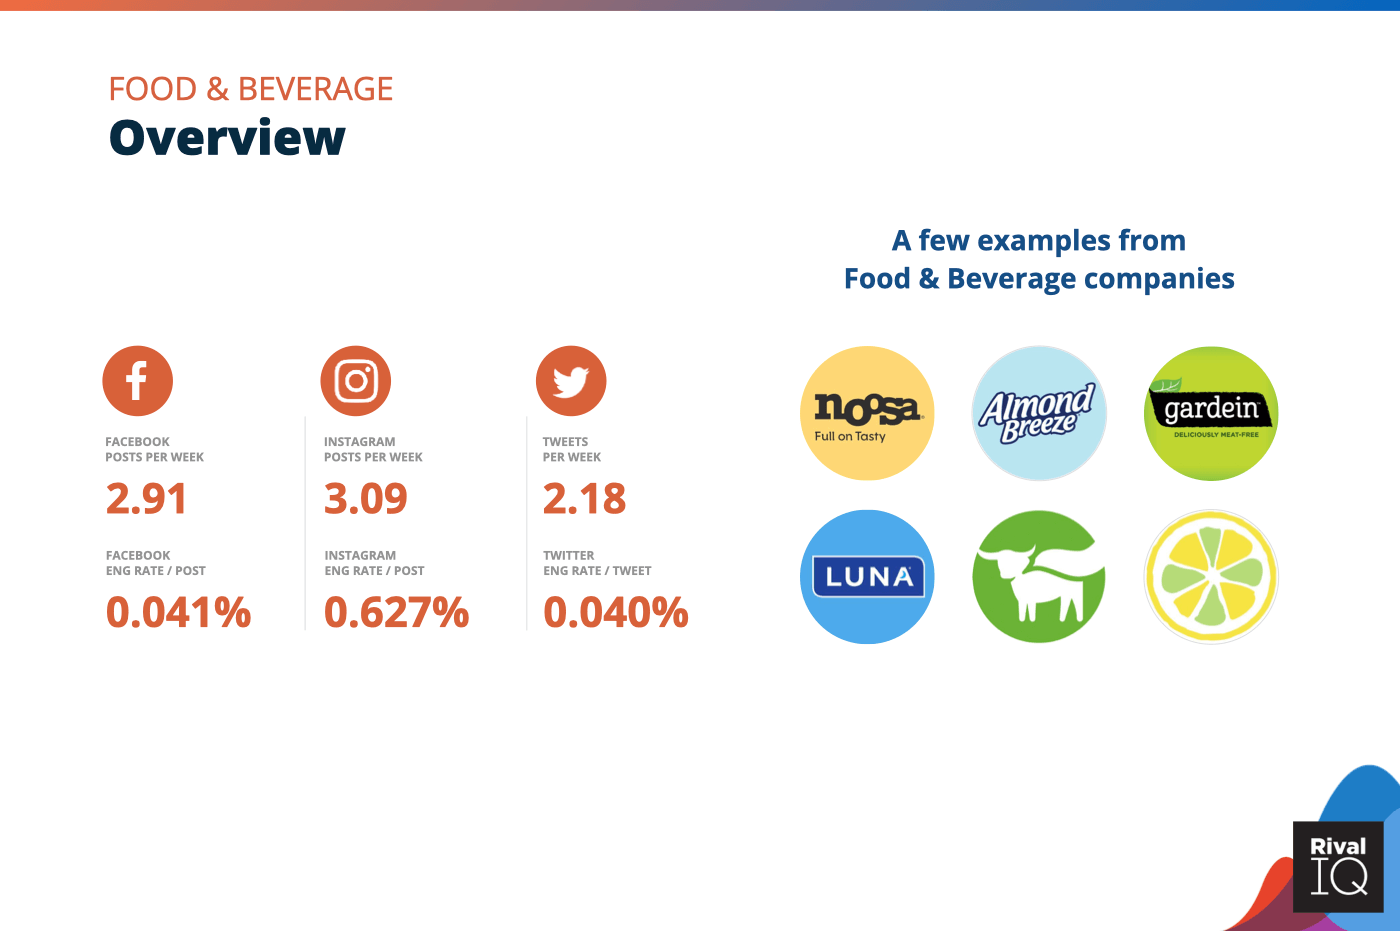
Overview of all benchmarks, Food & Beverage
Notable brands in this year’s report include Noosa Yoghurt, Gardein, Beyond Meat, Almond Breeze, Luna Bars, and Spindrift.
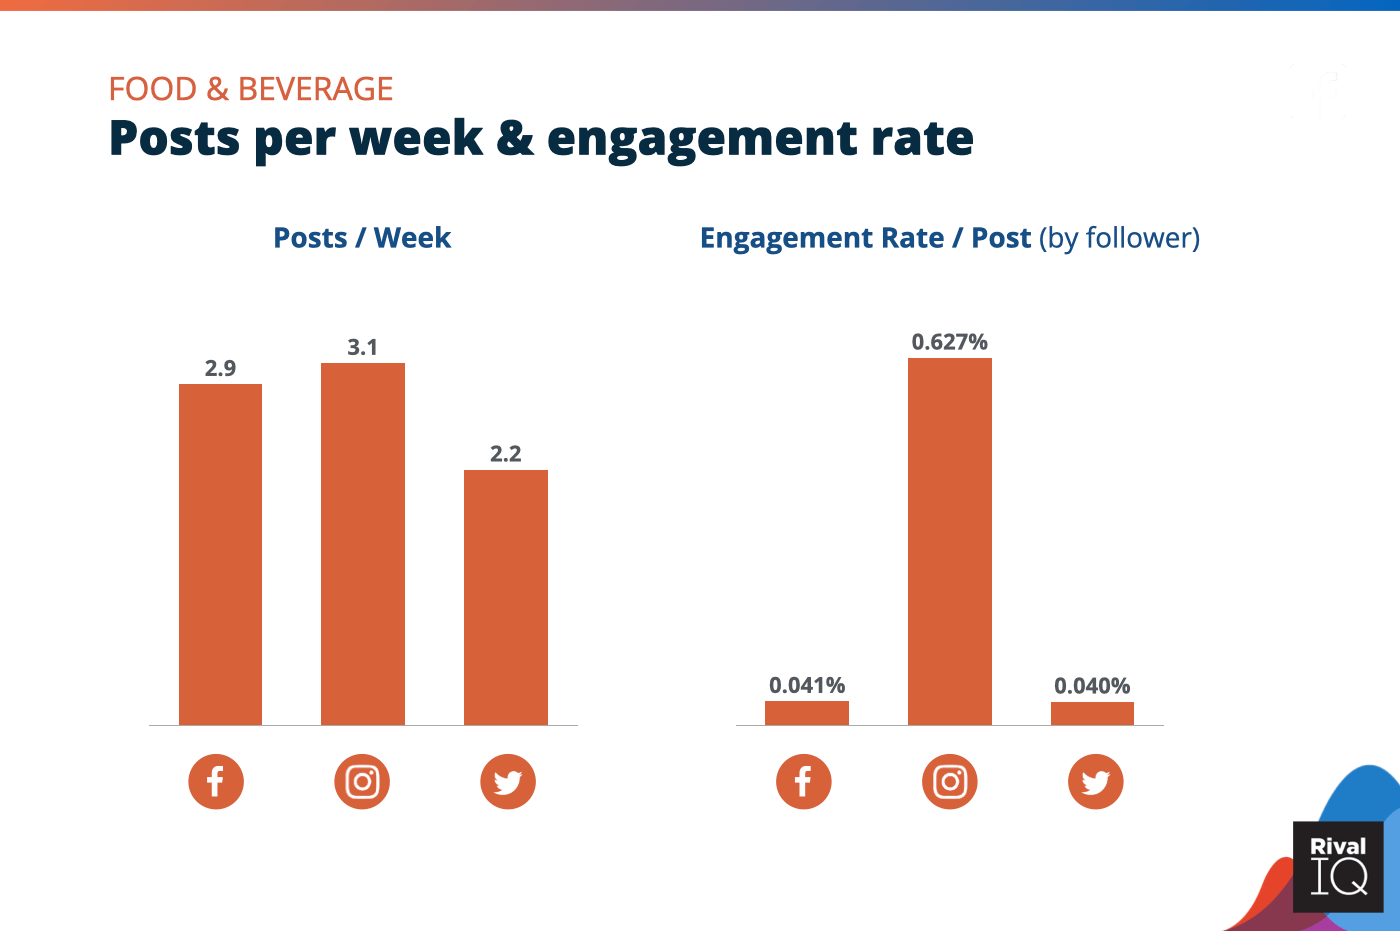
Posts per week and engagement rate per post across all channels, Food & Beverage
Food & Beverage brands lagged behind other industries with Facebook engagement rates, and might want to double down on investments in Twitter.
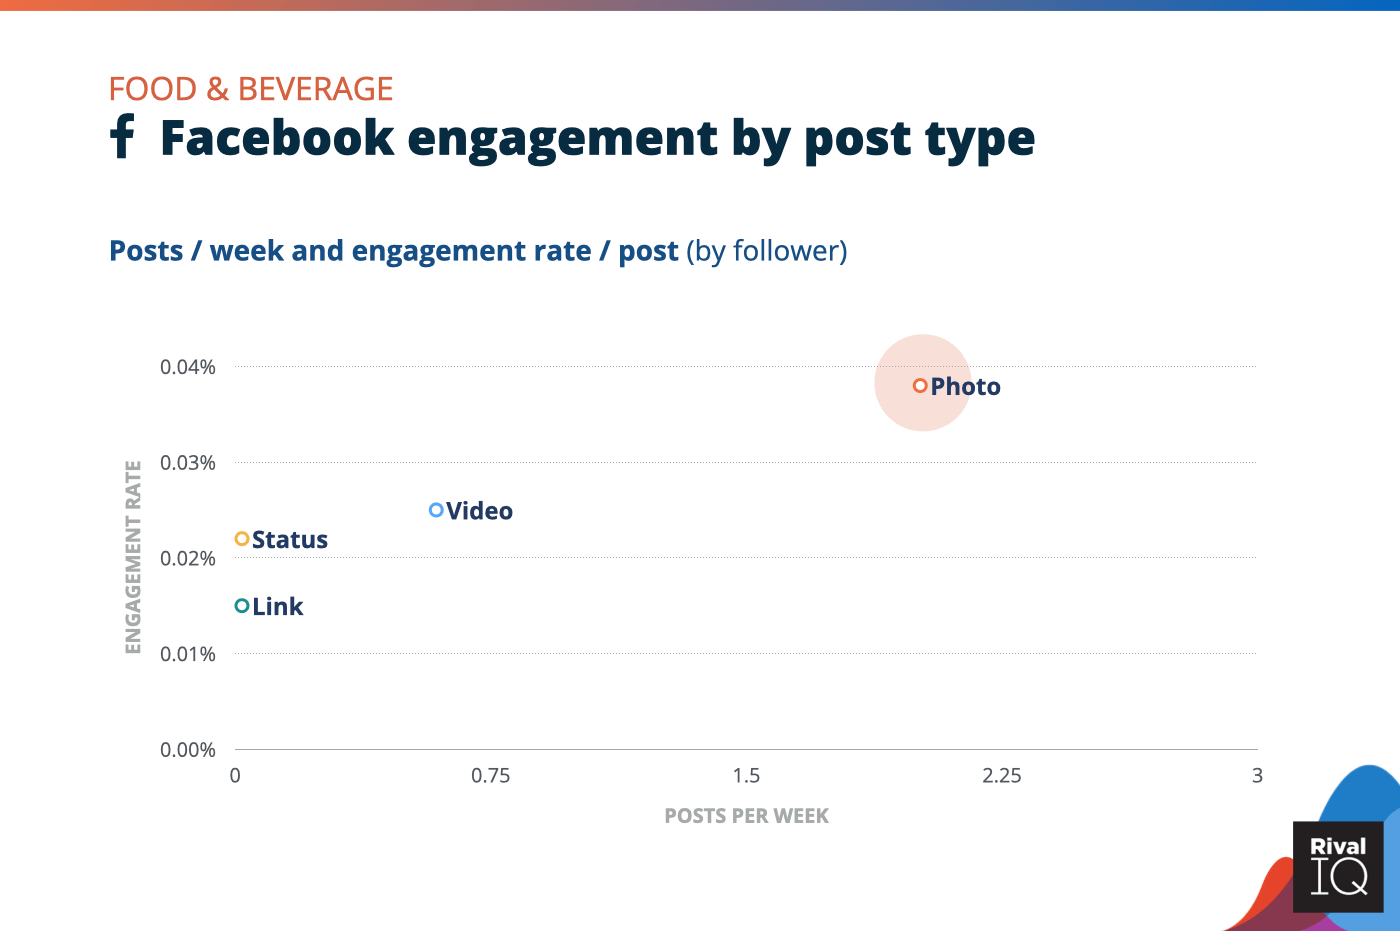
Facebook posts per week and engagement rate by post type, Food & Beverage
No surprise here that mouthwatering photos of tasty snacks and drinks performed well for Food & Beverage brands on Facebook, but investing more in video could help these brands shine on this channel.
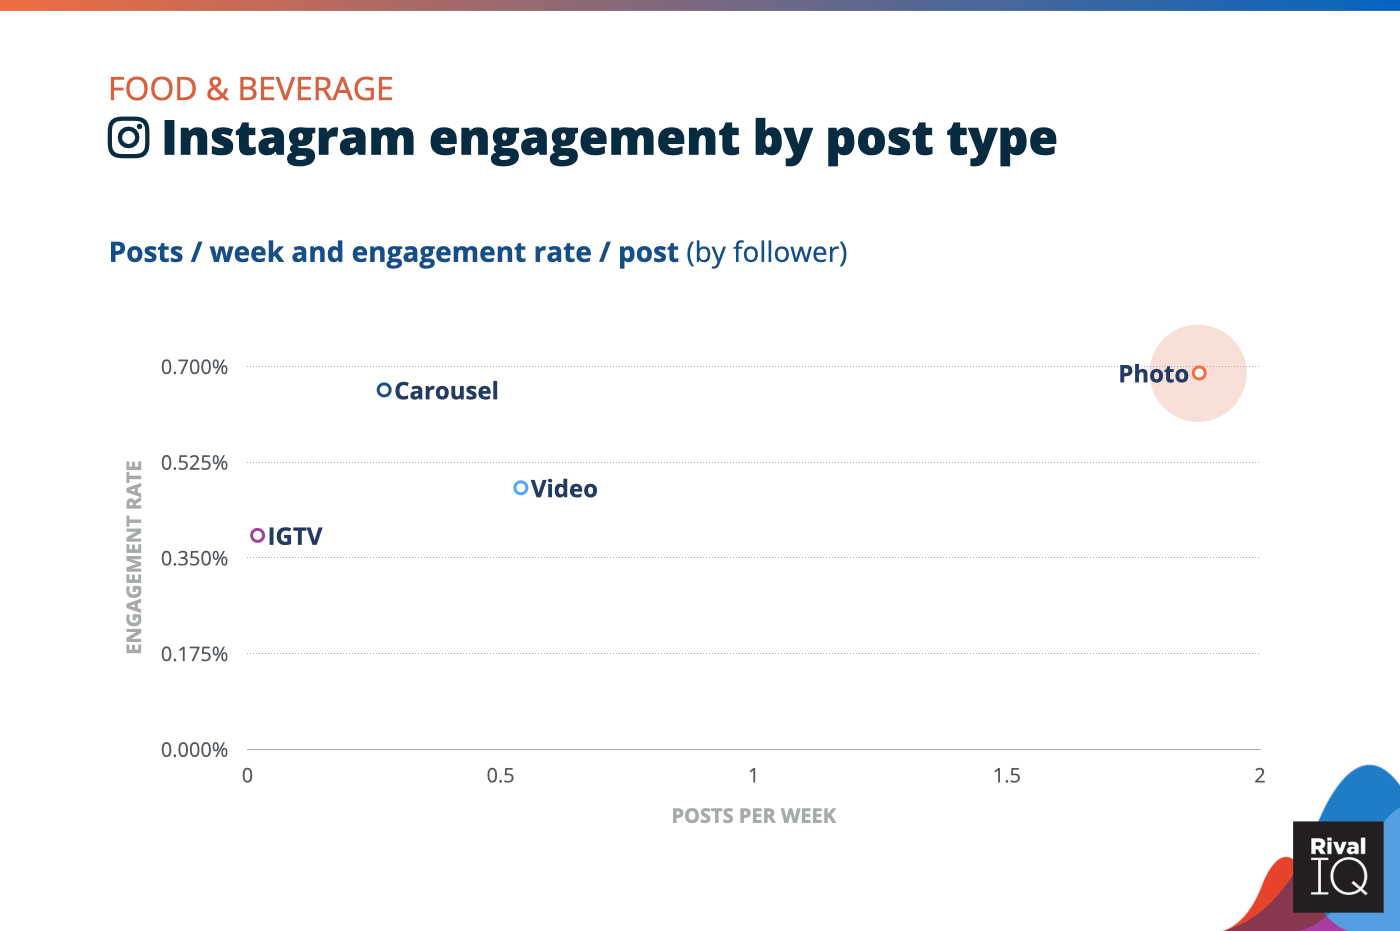
Instagram posts per week and engagement rate by post type, Food & Beverage
Static photo and carousel posts grabbed higher engagement rates for Food & Beverage brands than more dynamic video and IGTV posts.
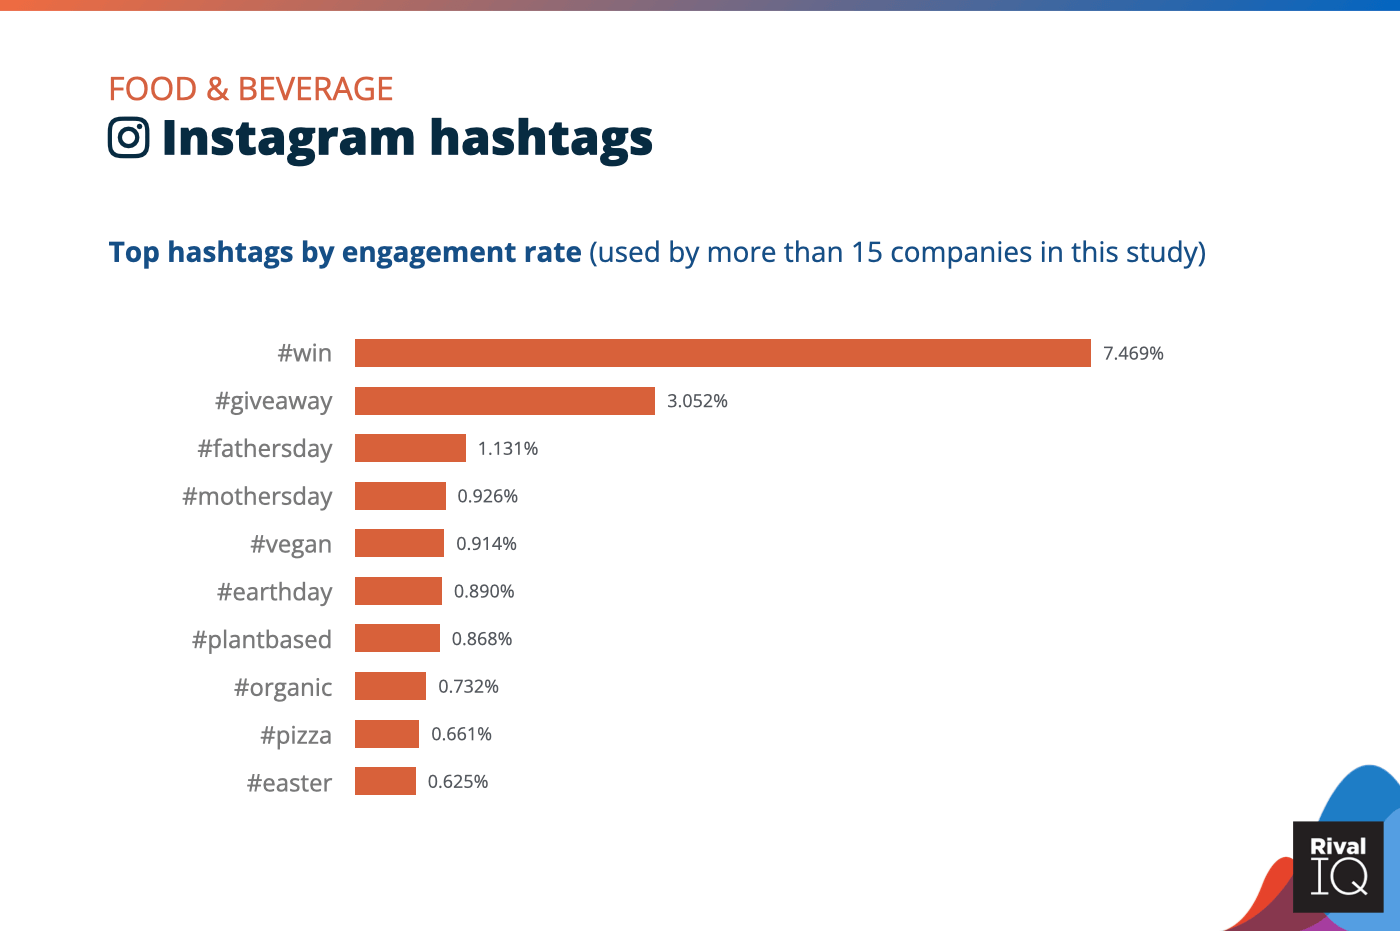
Top Instagram hashtags by engagement rate, Food & Beverage
Food & Beverage brands saw killer engagement rates on Instagram when posting about contests and giveaways.
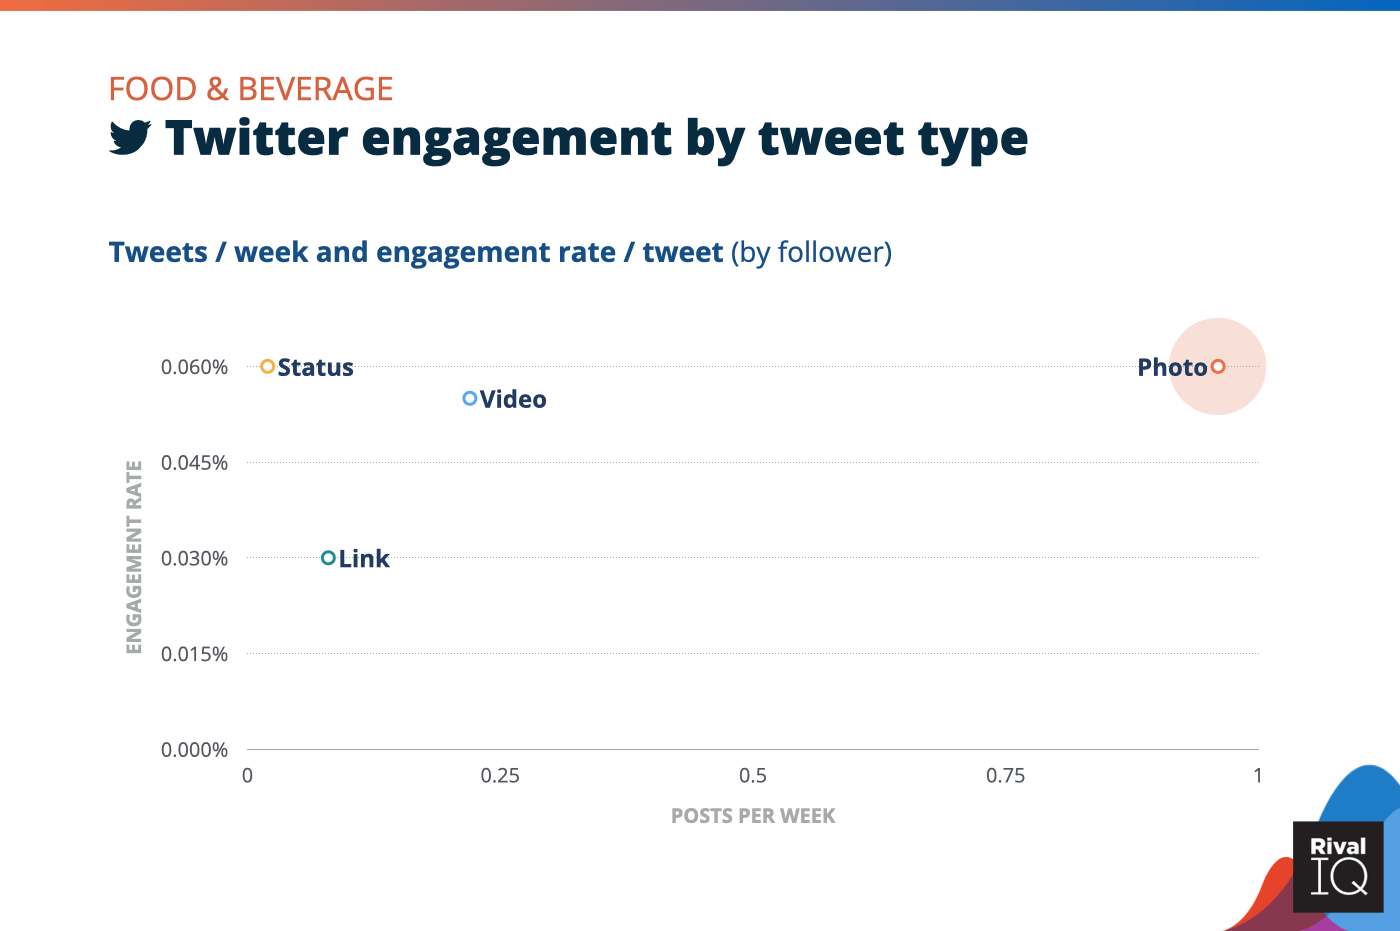
Twitter posts per week and engagement rate by tweet type, Food & Beverage
Photo tweets grabbed top engagement rates for Food & Beverage brands, who might want to also focus their tweeting on a sassy status update every once in a while.
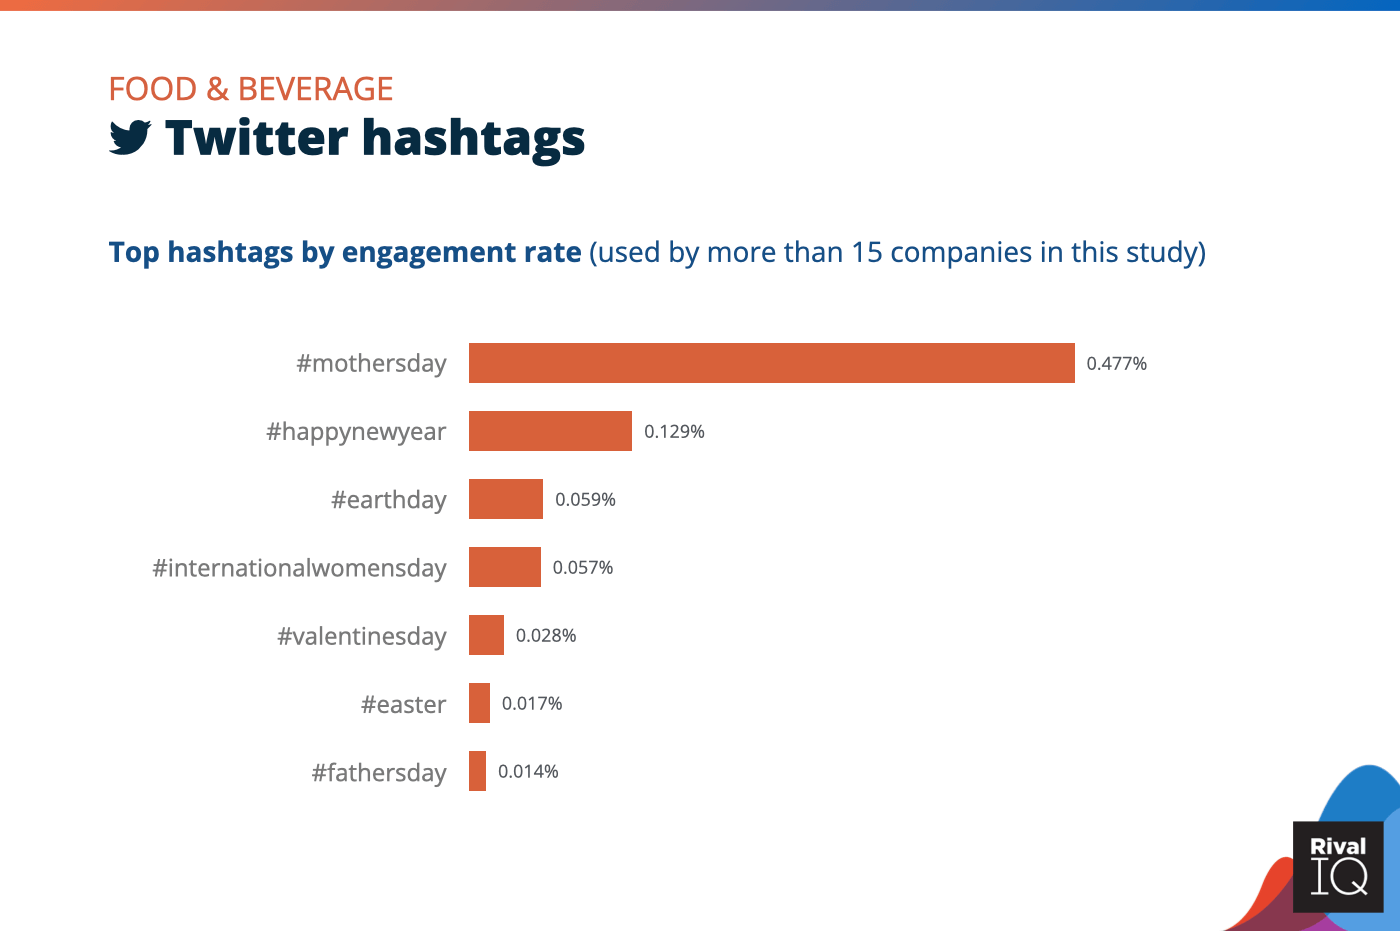
Top Twitter hashtags by engagement rate, Food & Beverage
#MothersDay dominated for Food & Beverage brands on Twitter this year as followers posted pics from their brunches and meals celebrating Mom.
Health & Beauty Social Media Benchmarks
Health & Beauty brands struggled to stay above the median on all three channels, but were most successful on Twitter thanks to extra investment there.
A few growth ideas:
- Don’t be afraid to shake up a long feed of photo posts with high-engagement videos.
- Contests and giveaways were top-performing hashtags on both Instagram and Twitter, so keep giving things away.
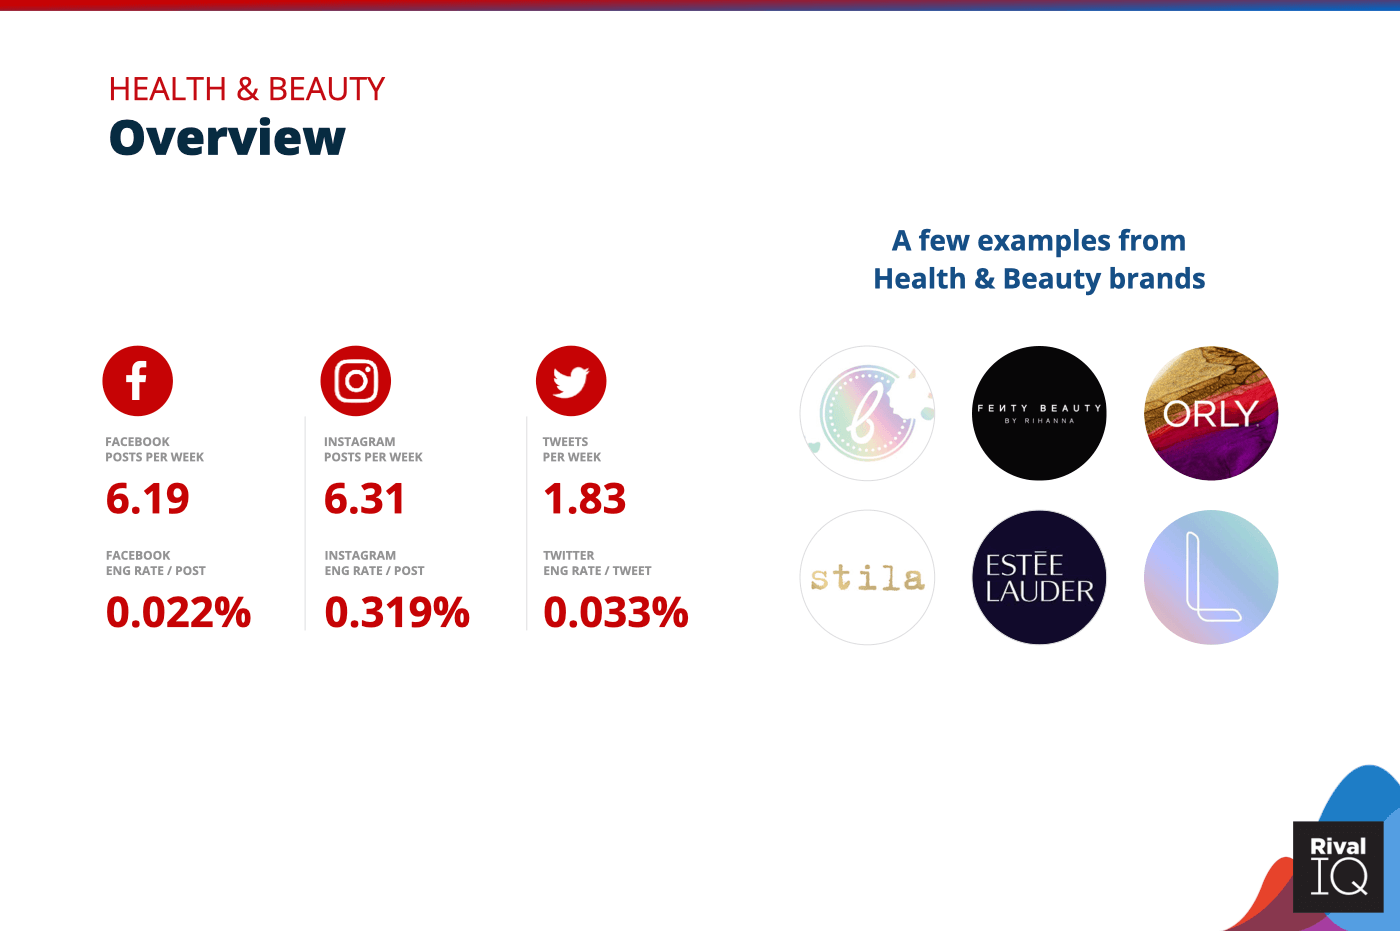
Overview of all benchmarks, Health & Beauty
Notable brands in this year’s report include Beauty Bakerie, Orly Beauty, Estée Lauder, Fenty Beauty, Stila Cosmetics, and Laneige.
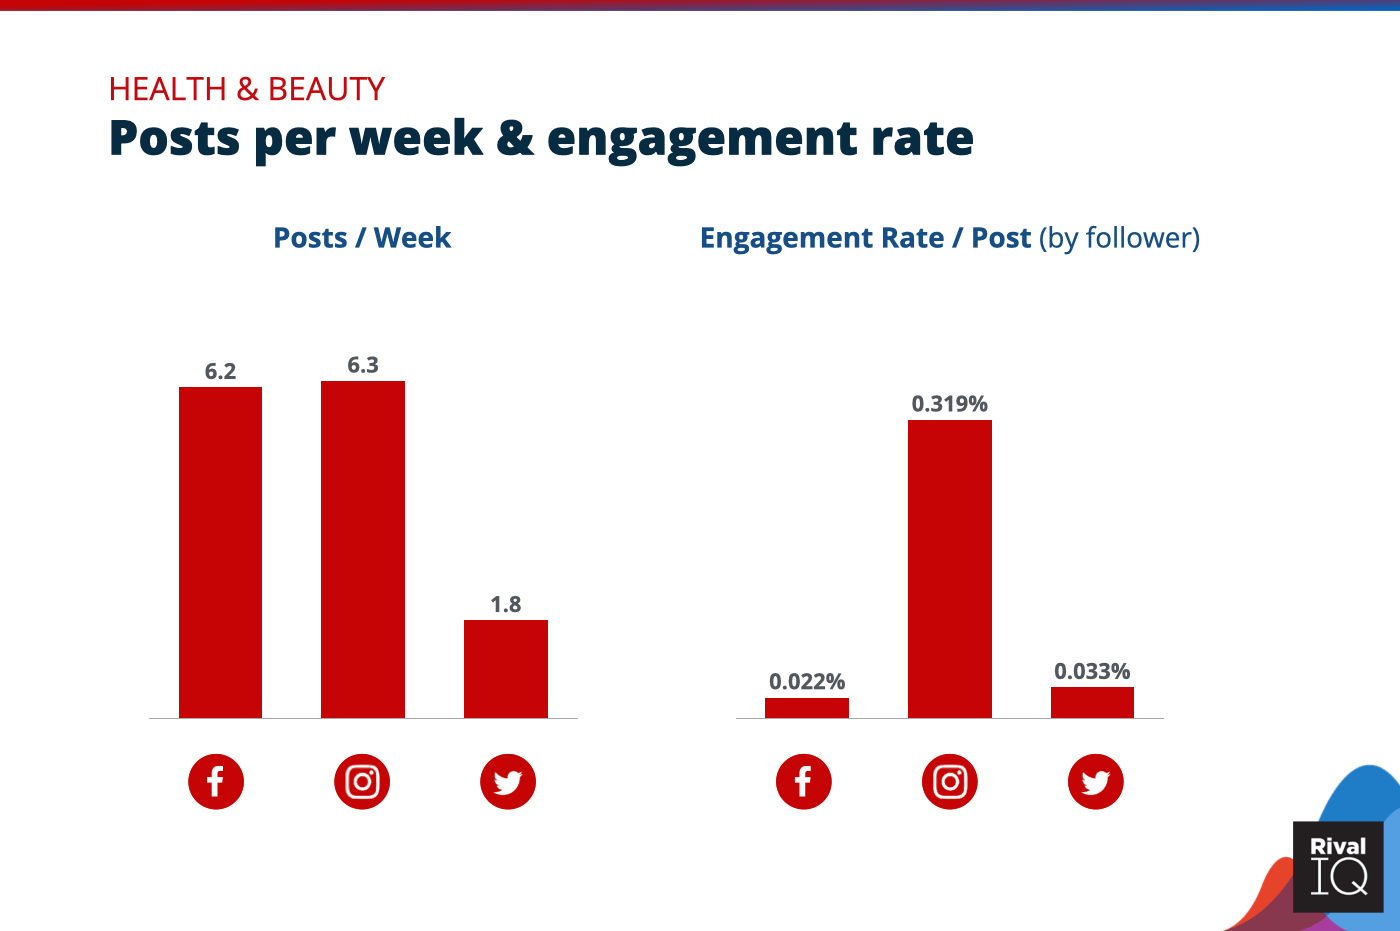
Posts per week and engagement rate per post across all channels, Health & Beauty
Health & Beauty had some of the lowest engagement rates on Facebook of any industry. Might want to redirect some of that energy to Twitter where these brands are more competitive.
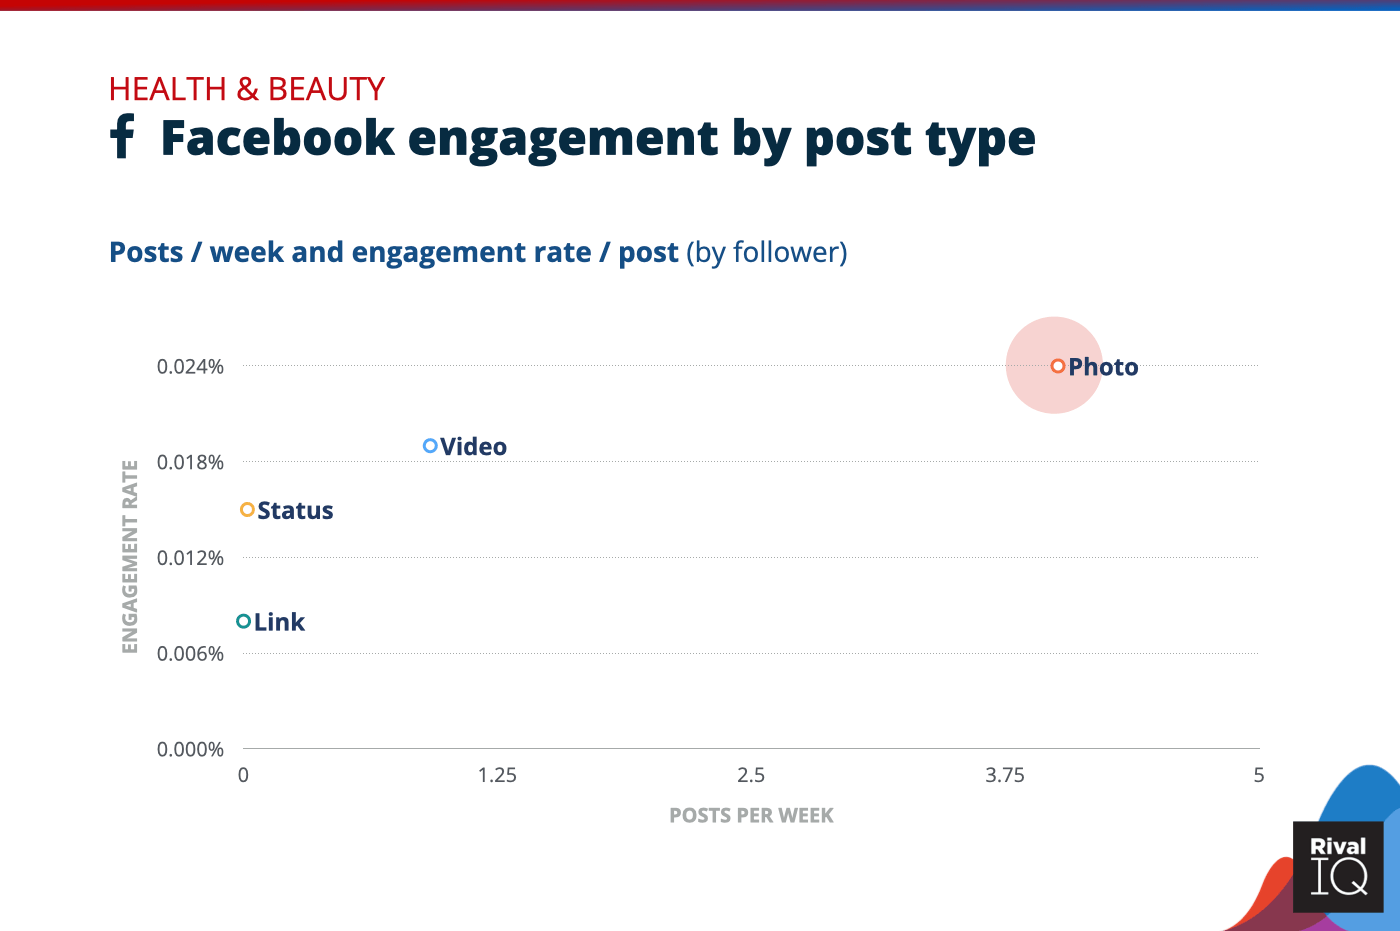
Facebook posts per week and engagement rate by post type, Health & Beauty
Health & Beauty brands might want to invest more in video on Facebook to try to bring up engagement rates on this channel.
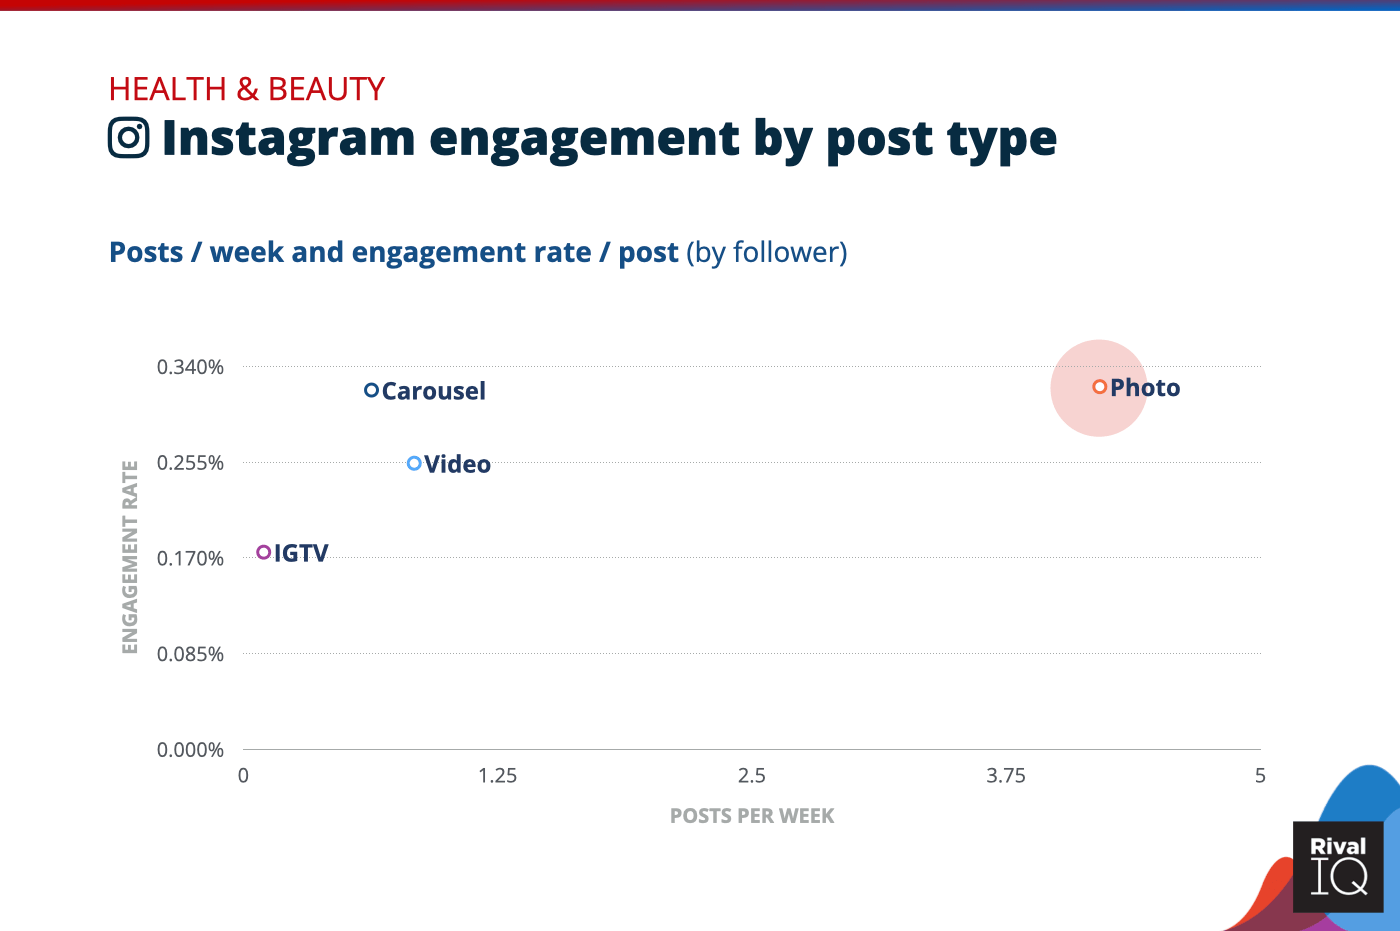
Instagram posts per week and engagement rate by post type, Health & Beauty
Photo and carousel posts were neck-and-neck for Health & Beauty brands this year, who were 6x as likely to post a photo on Instagram.
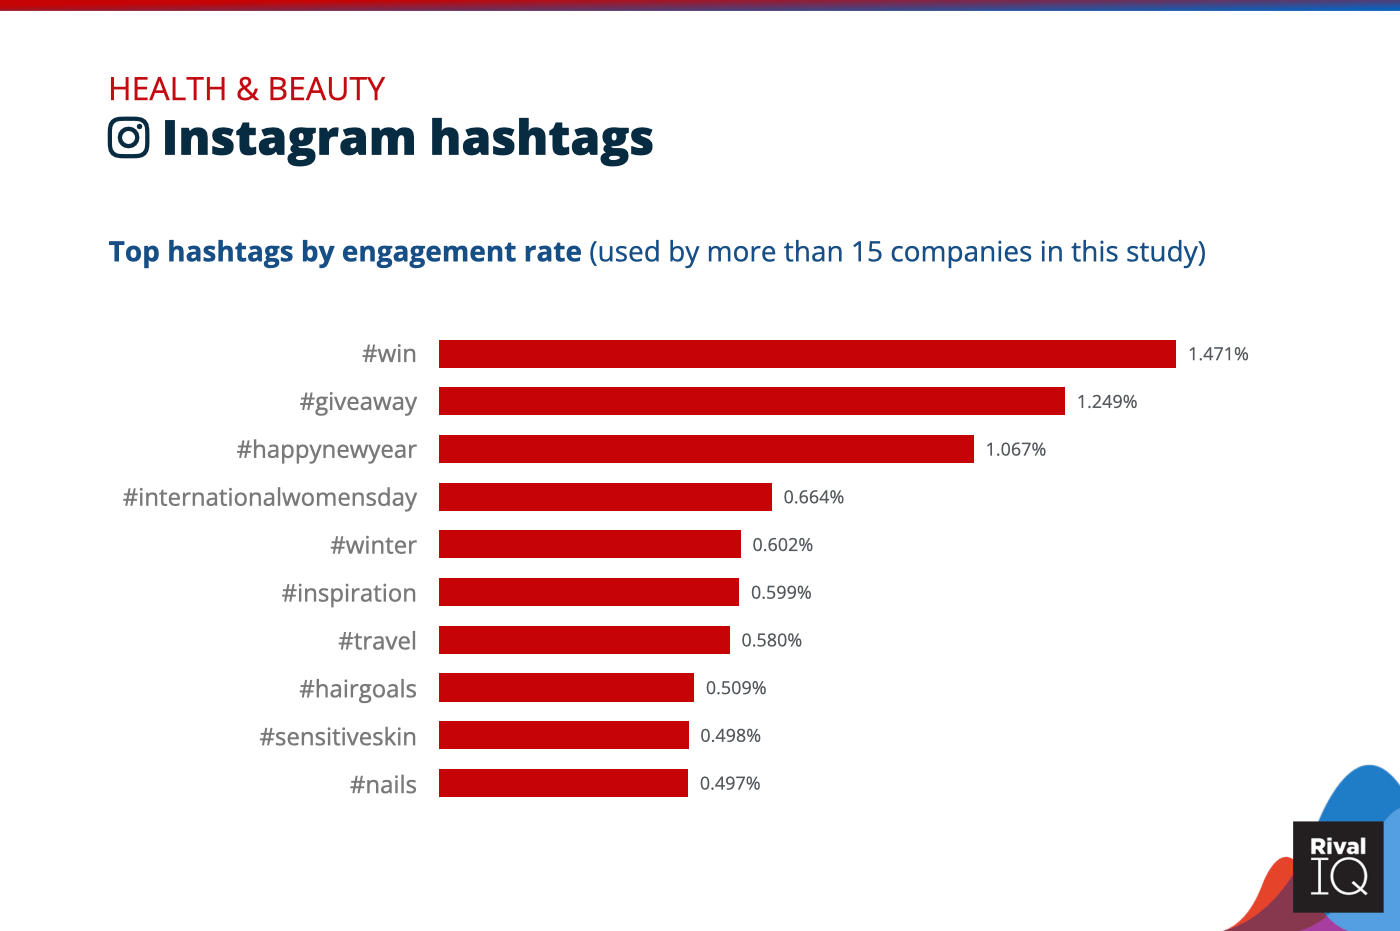
Top Instagram hashtags by engagement rate, Health & Beauty
Contests and giveaways topped the Instagram hashtag charts for Health & Beauty brands again this year, while nail- and hair-themed hashtags also performed well.
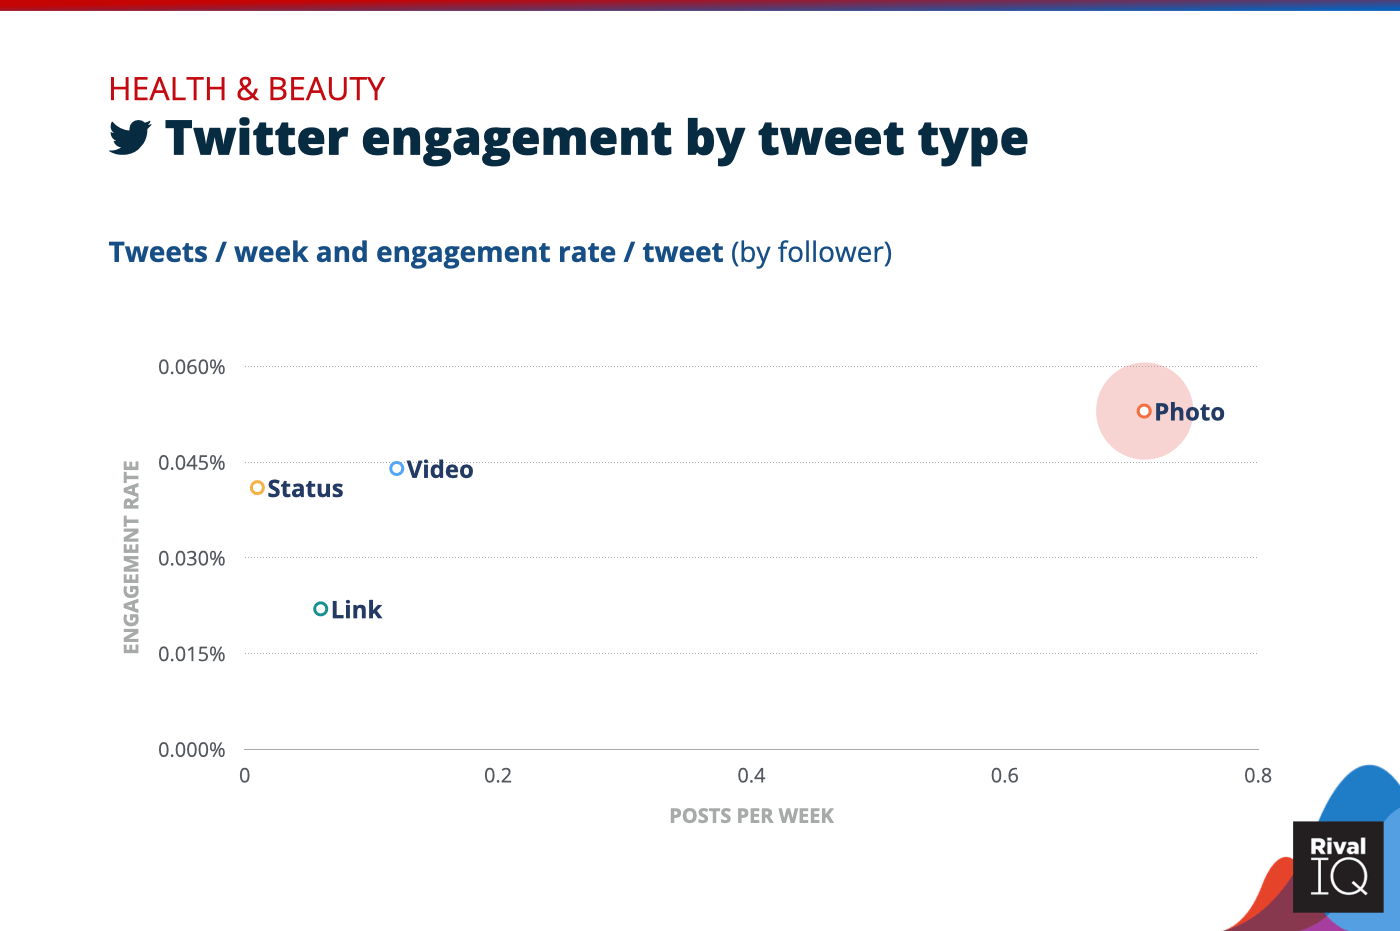
Twitter posts per week and engagement rate by tweet type, Health & Beauty
Health & Beauty brands increased their video tweets this year, but top-performing photo tweets still won the day on Twitter.
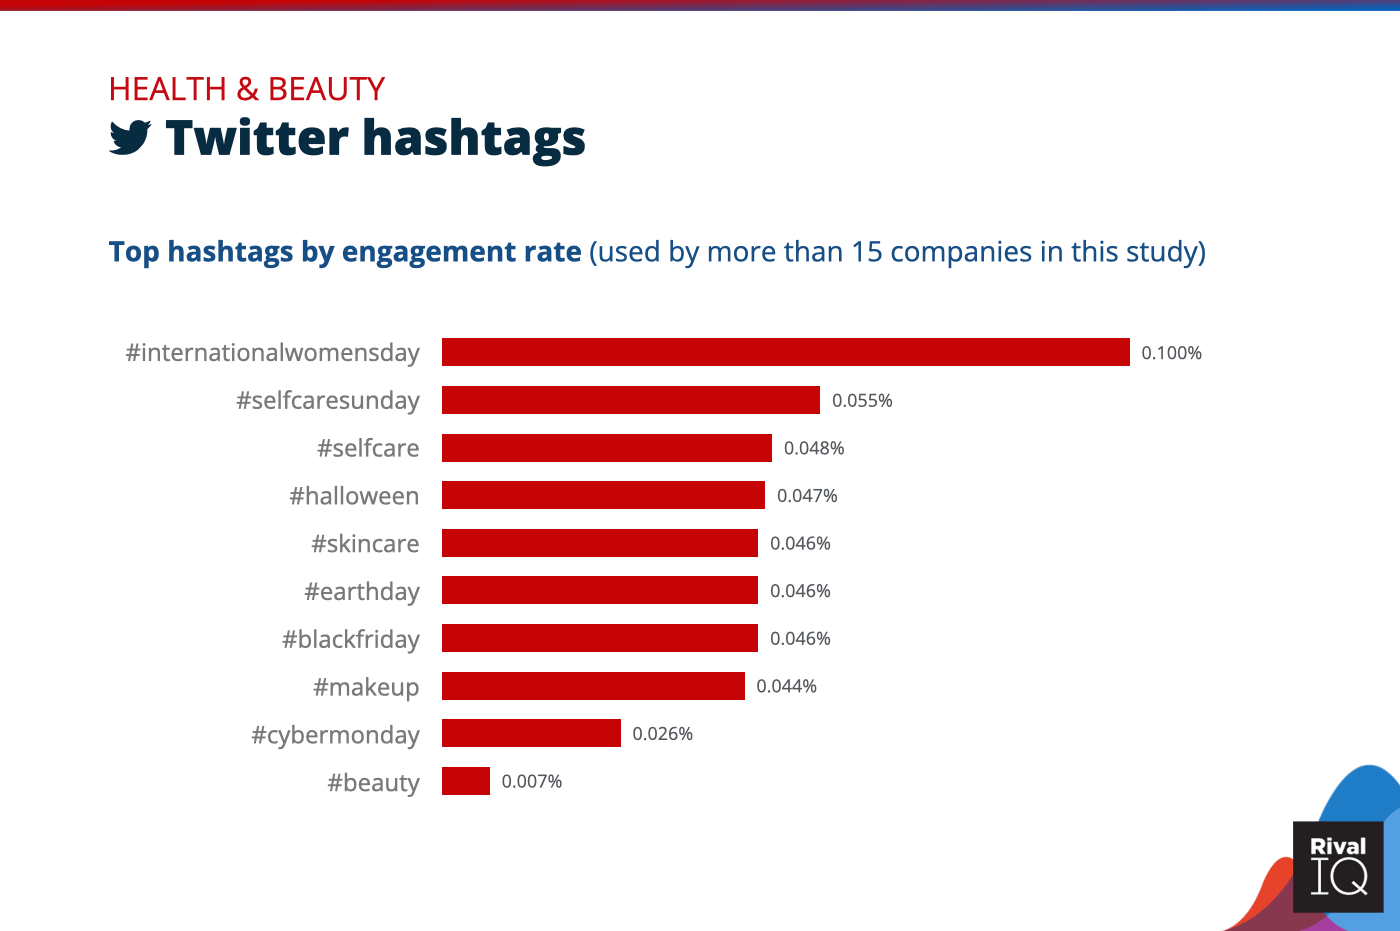
Top Twitter hashtags by engagement rate, Health & Beauty
Tweets featuring the #InternationalWomensDay hashtag saw twice the engagement of the next most engaging hashtag on Twitter for Health & Beauty brands.
Hungry for more benchmarking? We’ve got the definitive guide to all things Instagram Stories.
Grab the guideHigher Ed Social Media Benchmarks
Higher Ed rocked it with killer engagement rates on Instagram and got on the podium for Facebook and Twitter too thanks to hyper-engaged fans.
For even higher Higher Ed engagement rates:
- Followers love a chance to chime in, so keep asking what they’re up to on social media holidays like #NationalDogDay.
- Try to post more of what works for you: more carousels on Instagram, and more statuses and videos on Twitter.
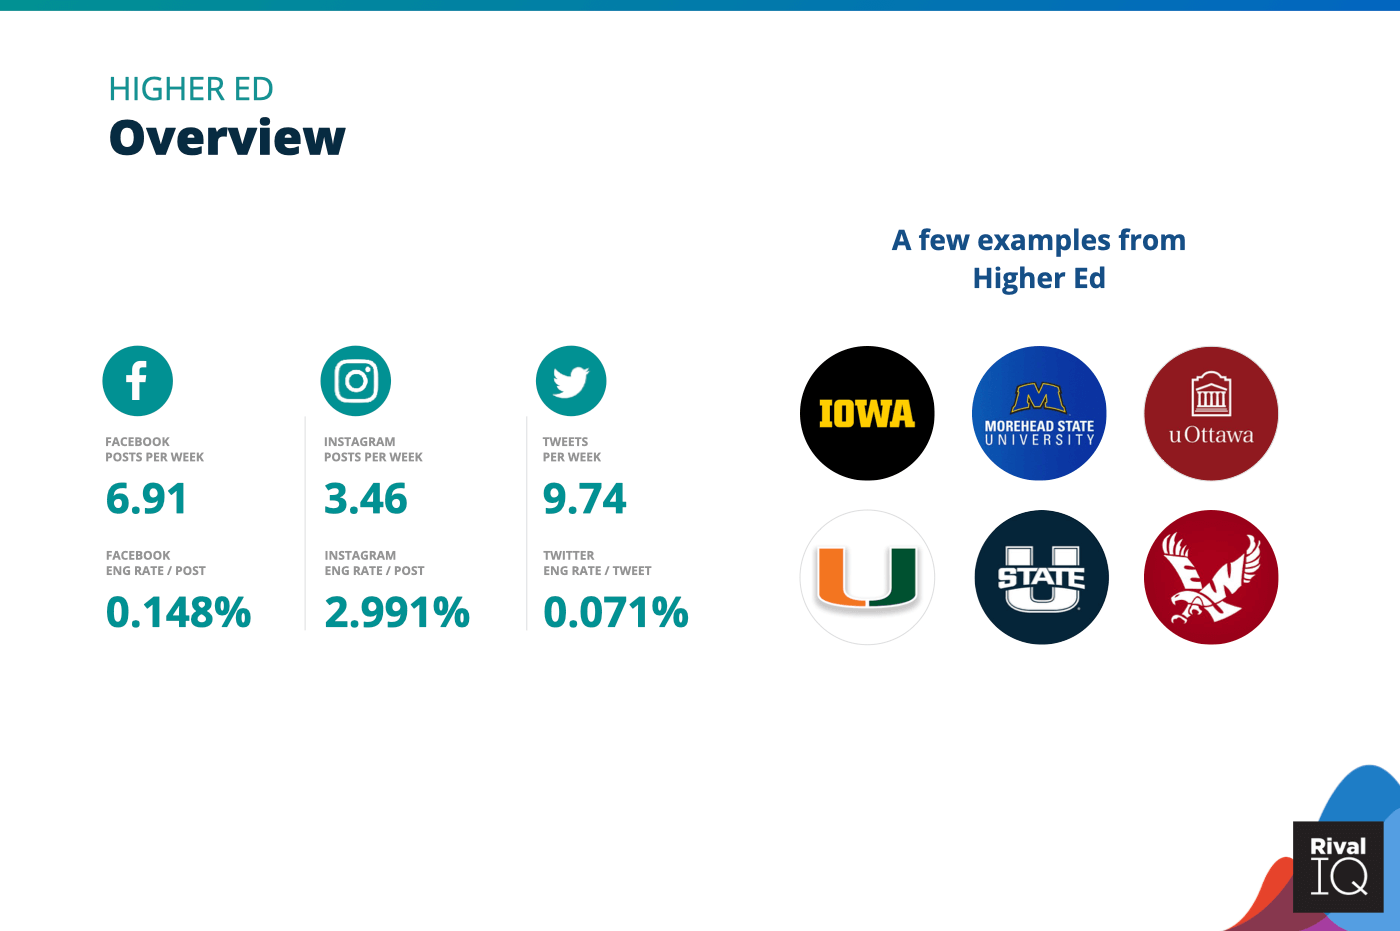
Overview of all benchmarks, Higher Ed
Notable brands in this year’s report include University of Iowa, University of Ottowa, Utah State University, Morehead State University, University of Miami, and Eastern Washington University.
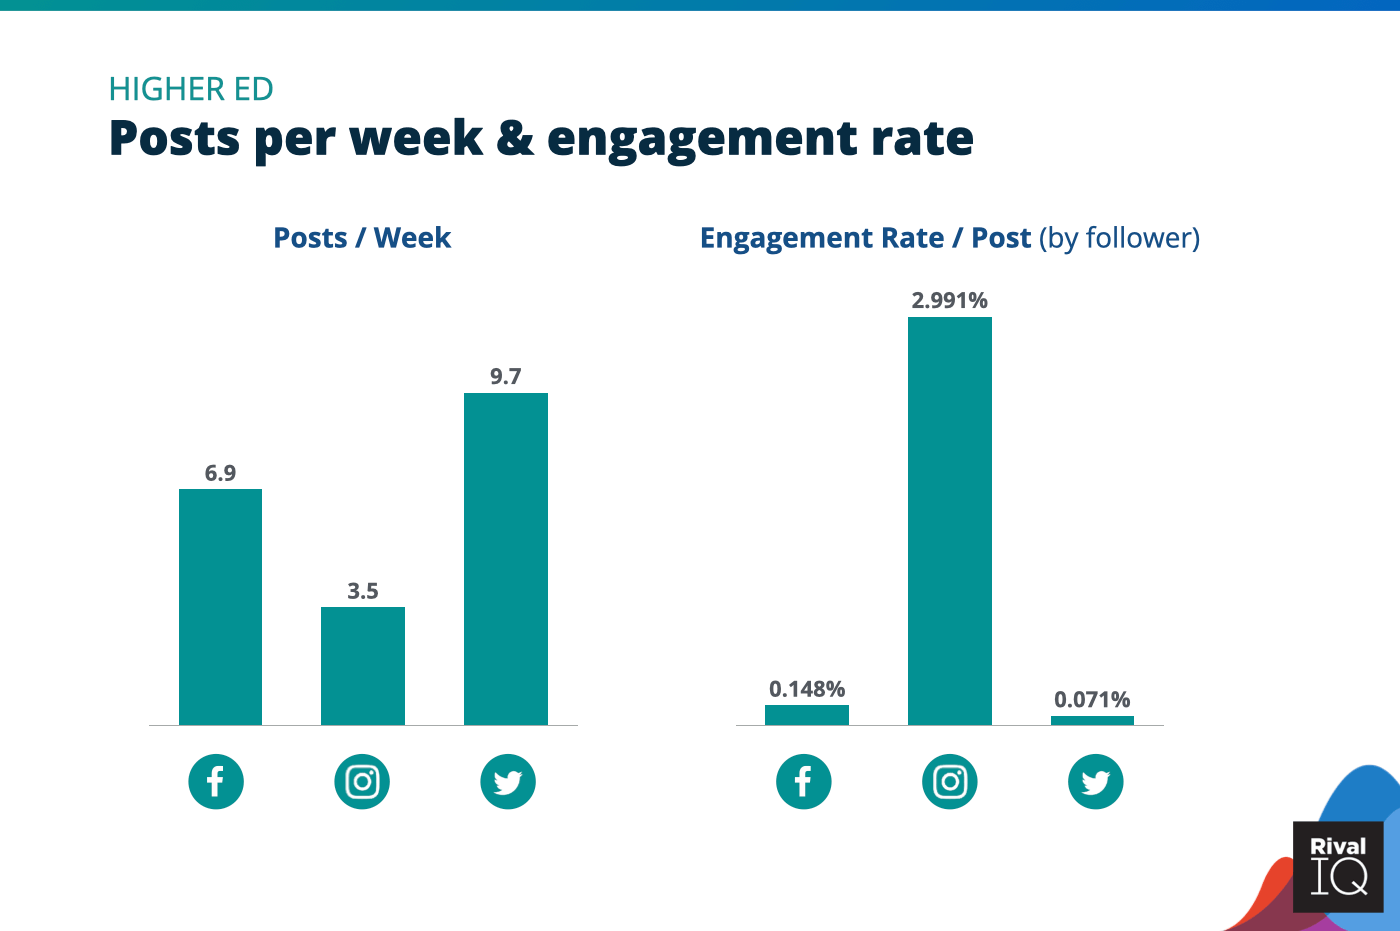
Posts per week and engagement rate per post across all channels, Higher Ed
Higher Ed had killer engagement rates on Instagram but posted less frequently than the median industry. Try stealing some of that Twitter energy for Insta.
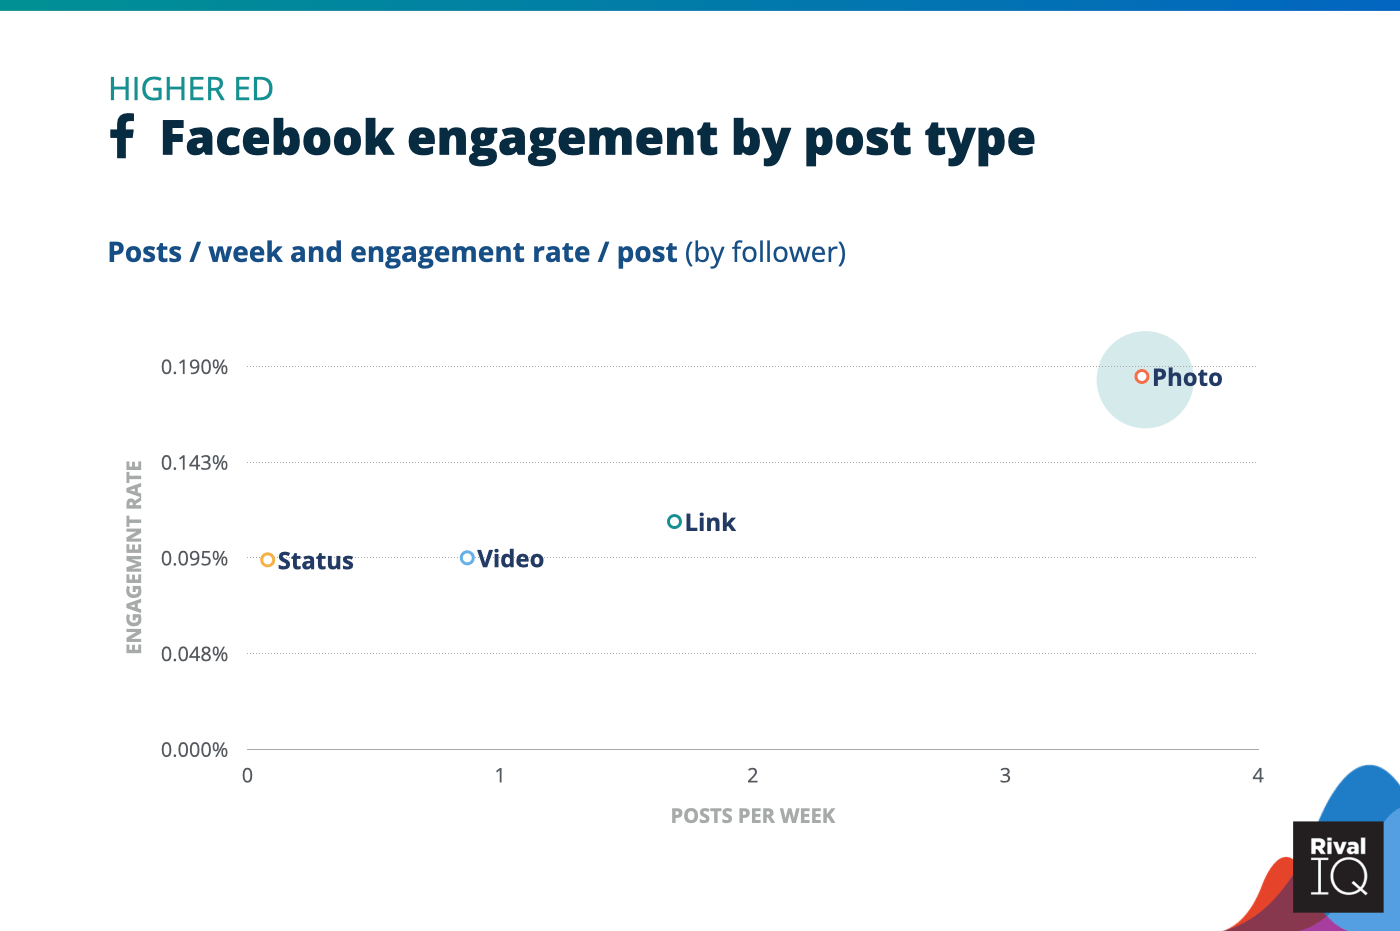
Facebook posts per week and engagement rate by post type, Higher Ed
Higher Ed scored the bronze on Facebook this year thanks to lots of engaging photo posts.
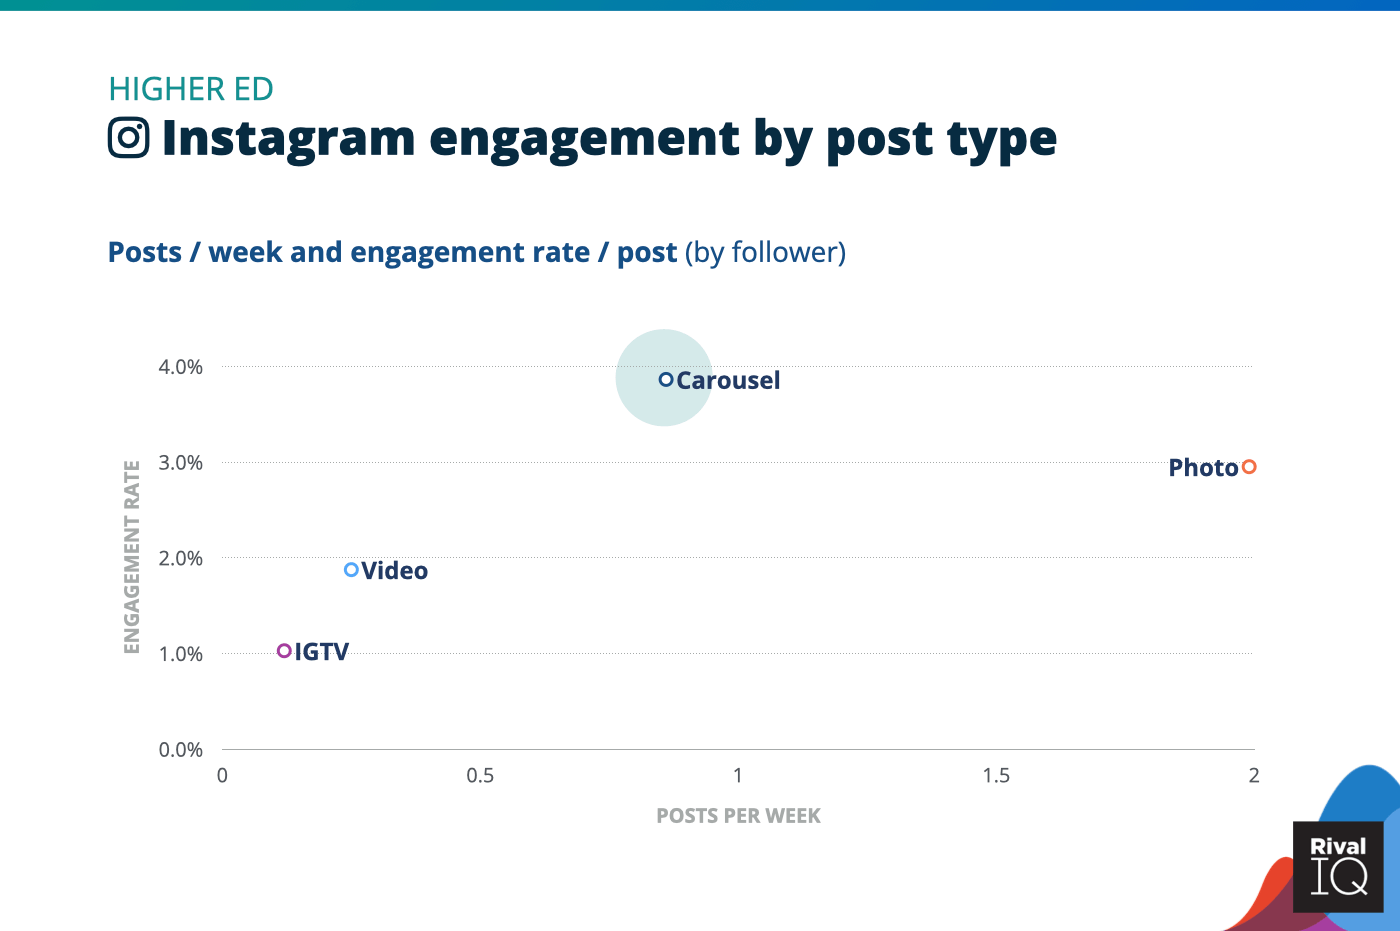
Instagram posts per week and engagement rate by post type, Higher Ed
Higher Ed earned 4x the median engagement rate on Instagram this year thanks especially to carousel posts. Just look at James Madison University for some carousel inspo: their most engaging post of the year was a series of celebratory softball snaps.
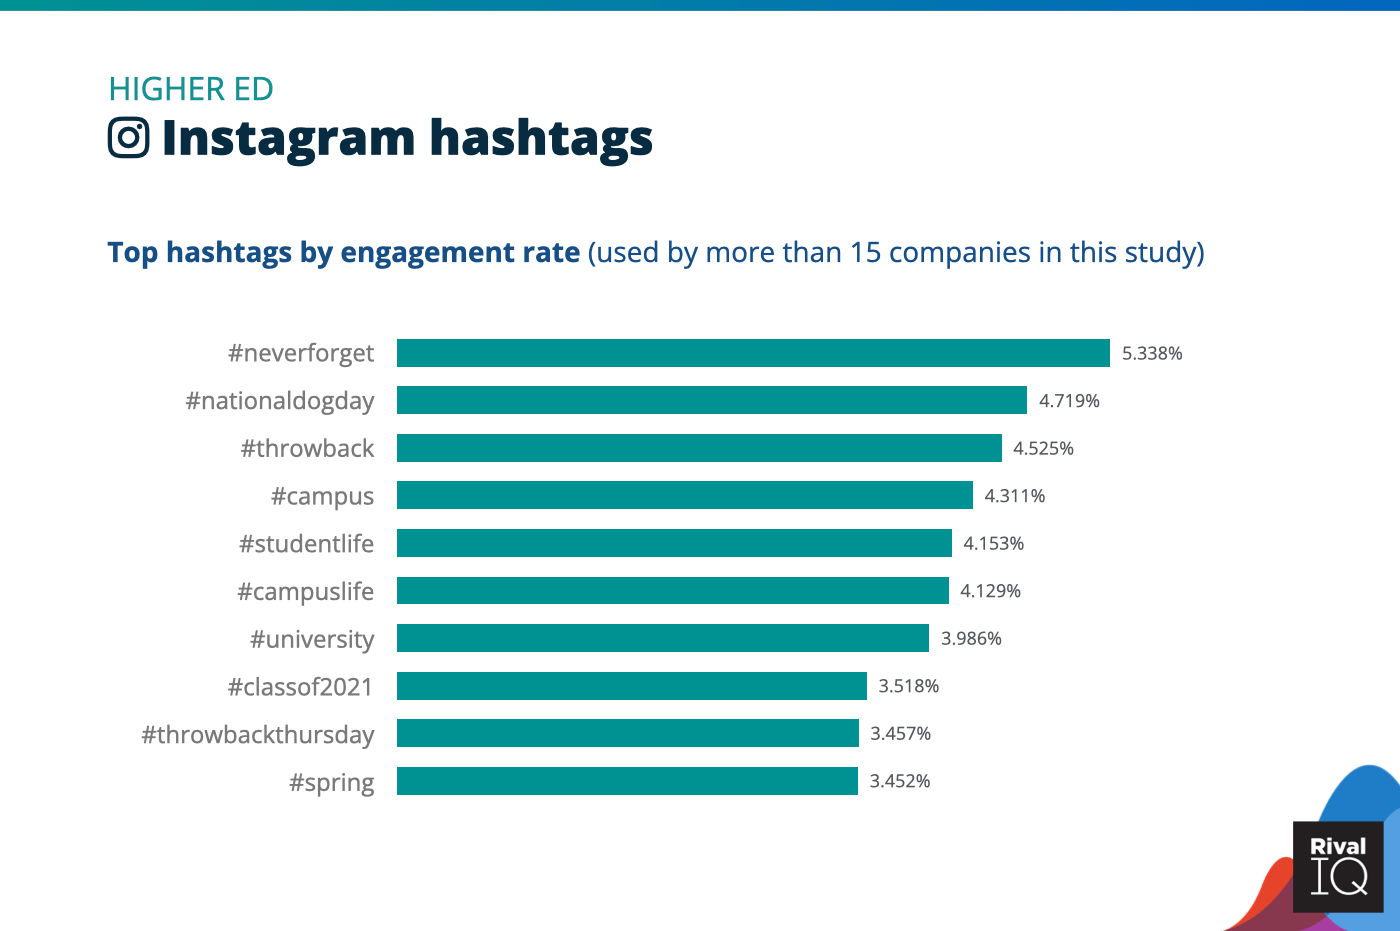
Top Instagram hashtags by engagement rate, Higher Ed
Higher Ed consistently sees the highest Instagram hashtag engagement rates of any industry we survey. No surprise that hashtags about campus life were top performers.
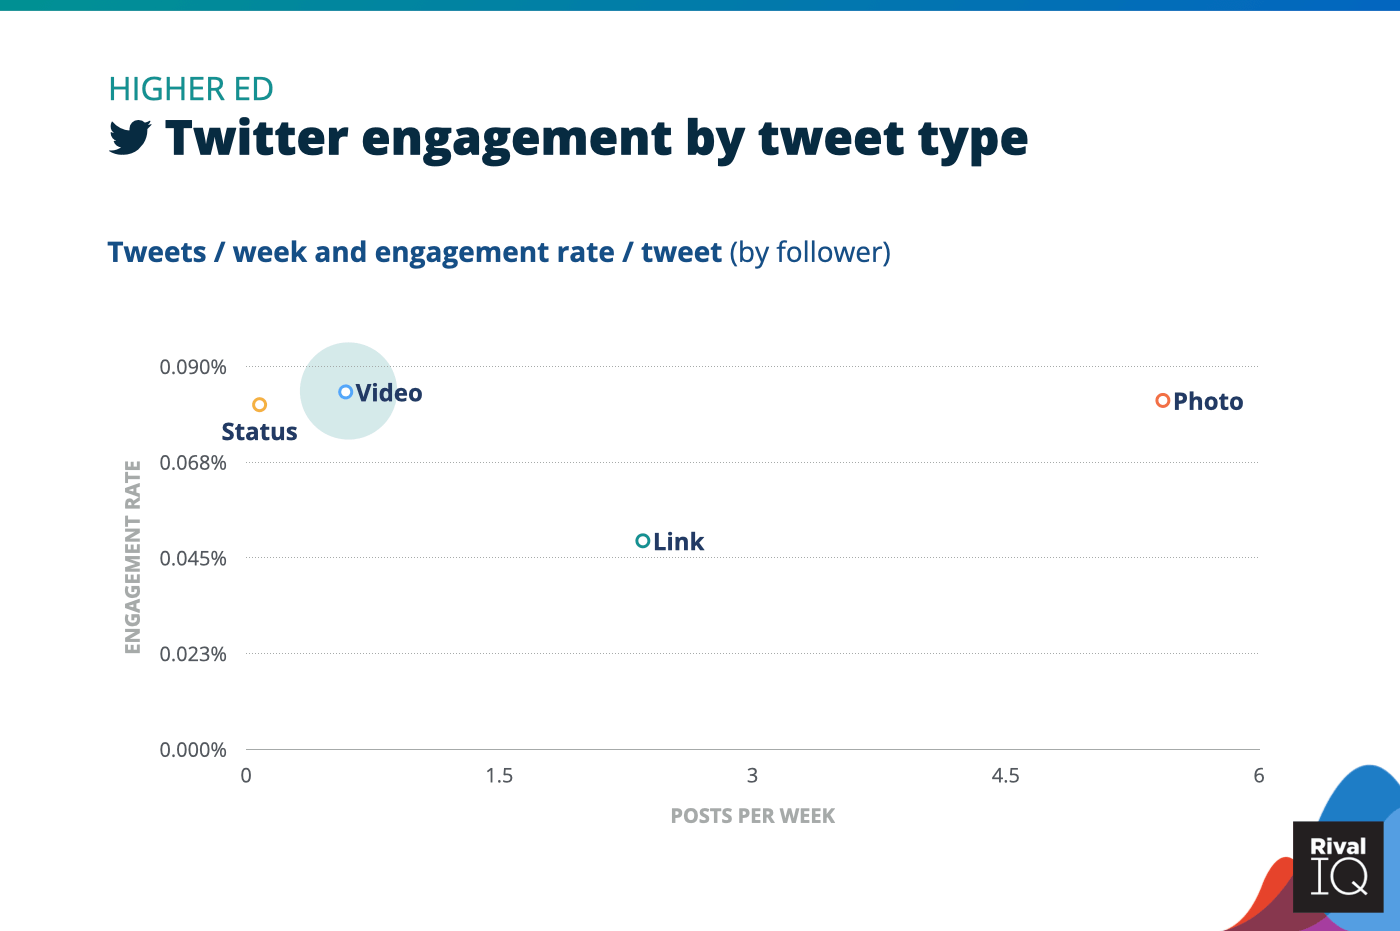
Twitter posts per week and engagement rate by tweet type, Higher Ed
Status updates are a top performer for colleges and universities on Twitter but are rarely tweeted. Consider bulking up this tweet type to further dominate this channel.
Top Twitter hashtags by engagement rate, Higher Ed
Colleges and universities were all in on holiday-themed hashtags on Twitter this year.
Home Decor Social Media Benchmarks
Home Decor brands came in below the median engagement rates on Facebook, Instagram, and Twitter. These brands were most competitive on Instagram, and focused efforts there.
Some ideas for increasing engagement:
- Combine photos on Instagram into carousels.
- Try shaking up your Twitter routine with more videos and status updates.
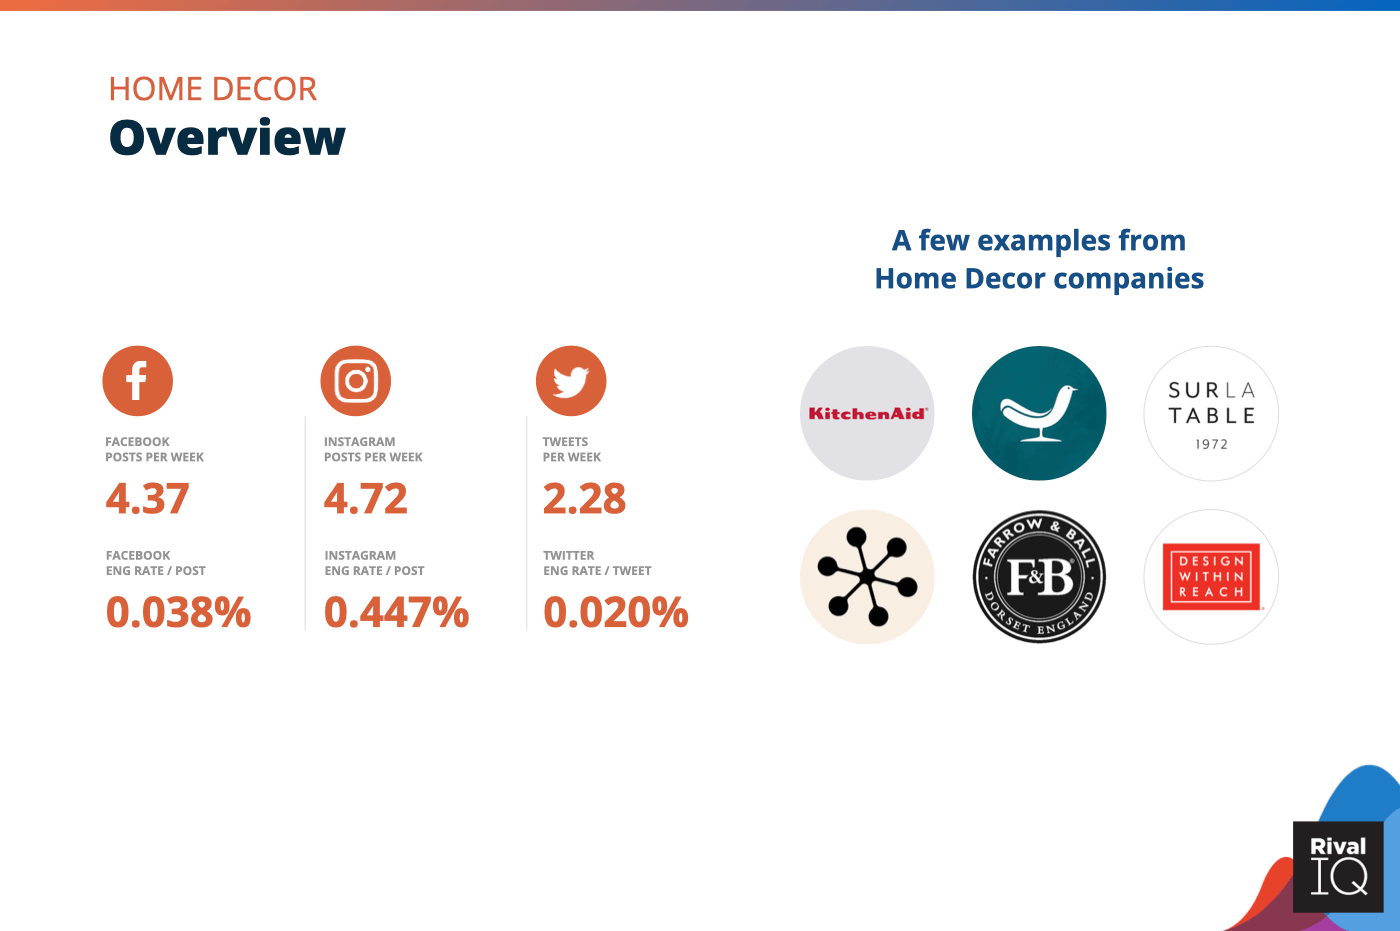
Overview of all benchmarks, Home Decor
Notable brands in this year’s report include KitchenAid, Sur La Table, Farrow & Ball, Joybird, 2Modern, and Design Within Reach.
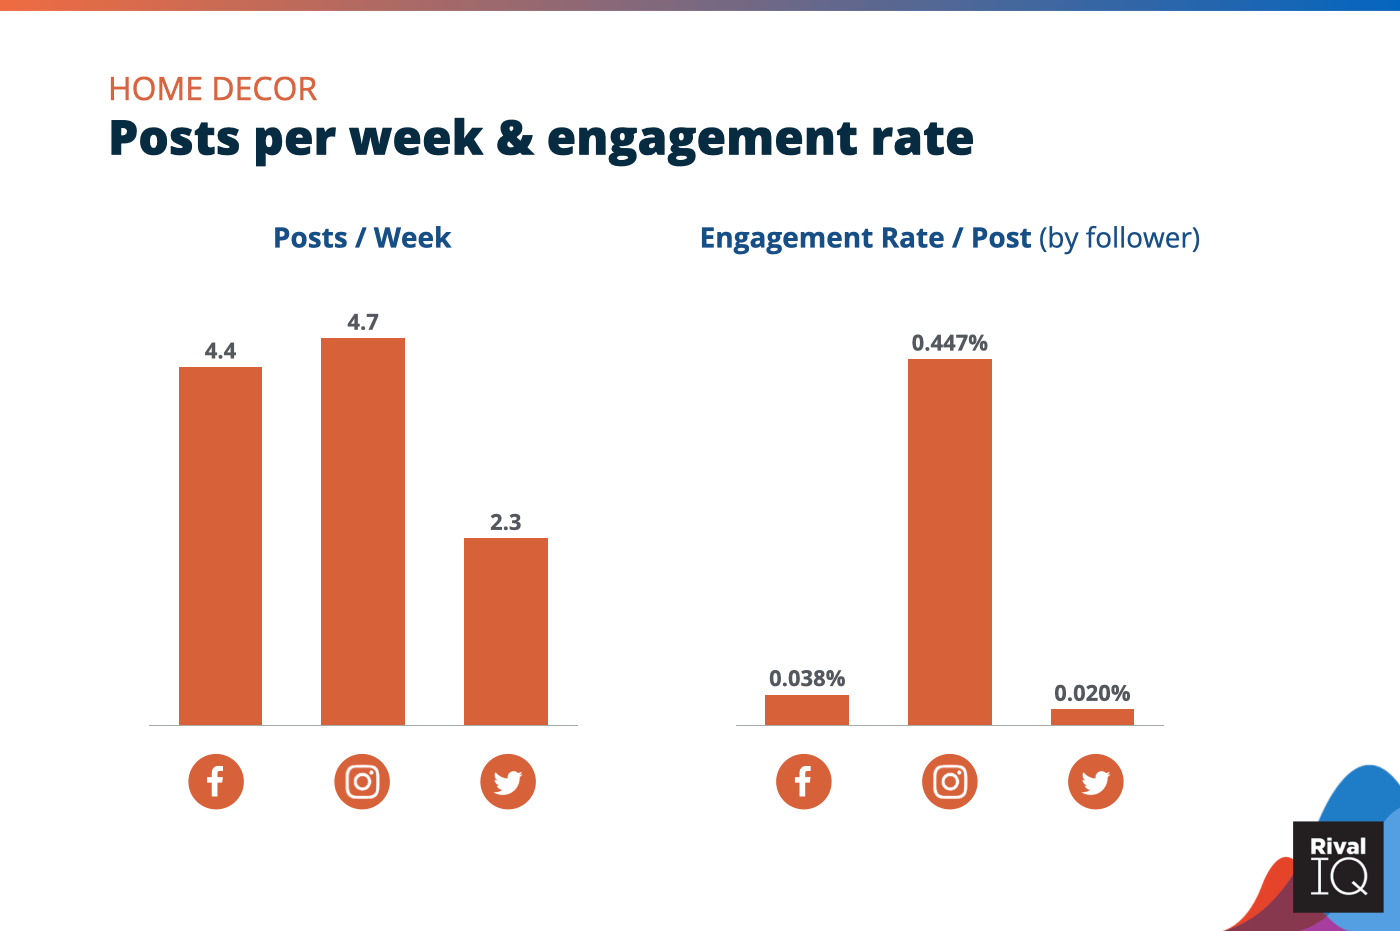
Posts per week and engagement rate per post across all channels, Home Decor
Home Decor brands saw below-median engagement rates on Facebook and Twitter and focused less posting here. Try experimenting more with post type and frequency on these channels.
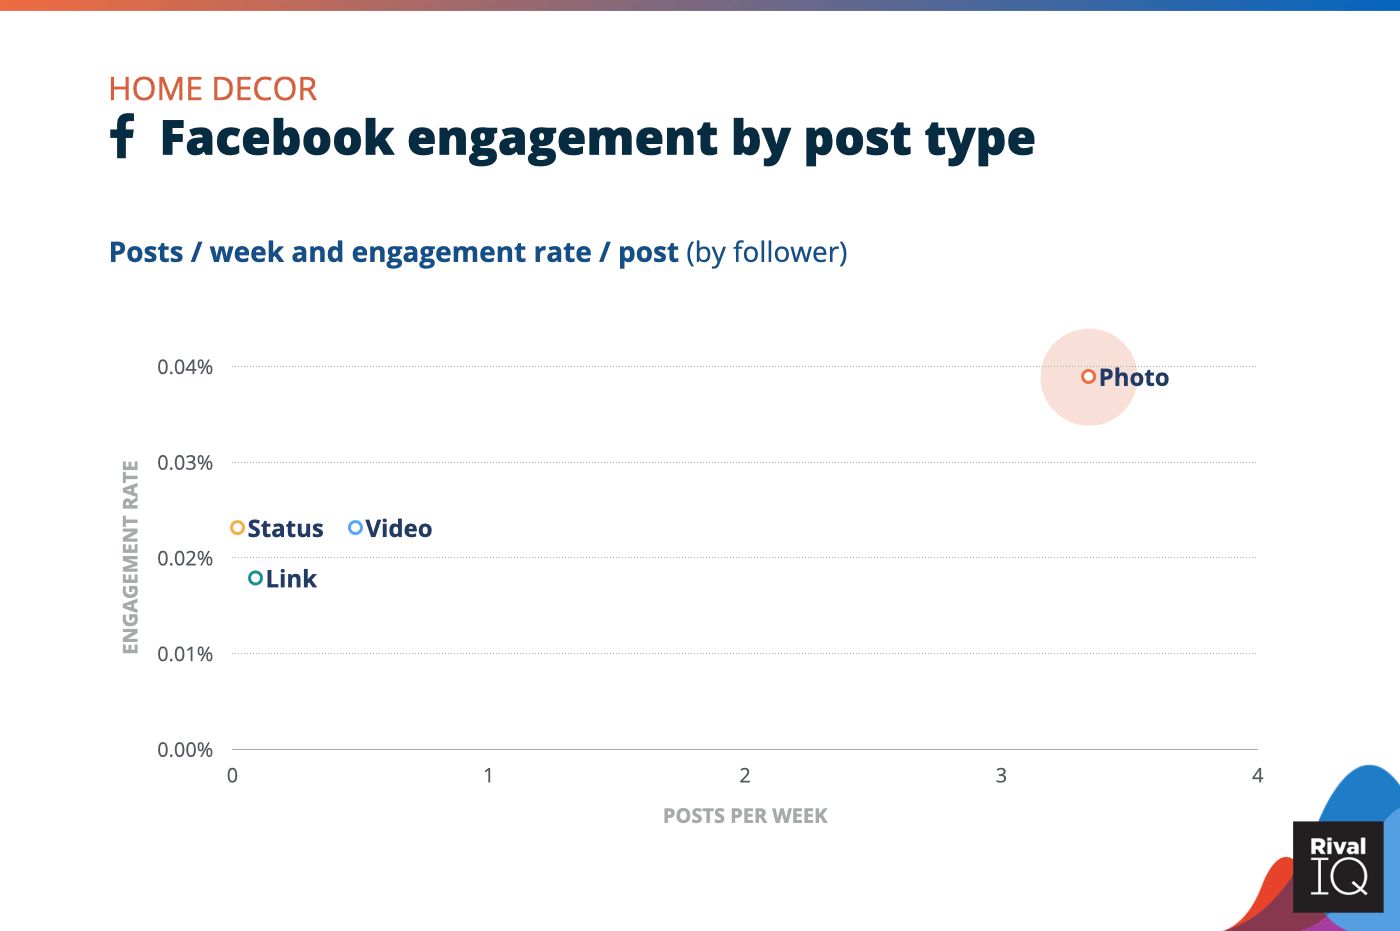
Facebook posts per week and engagement rate by post type, Home Decor
Home Decor brands were way likelier to post a photo on Facebook than any other post type, which is a smart move, since photos grabbed much higher engagement rates.
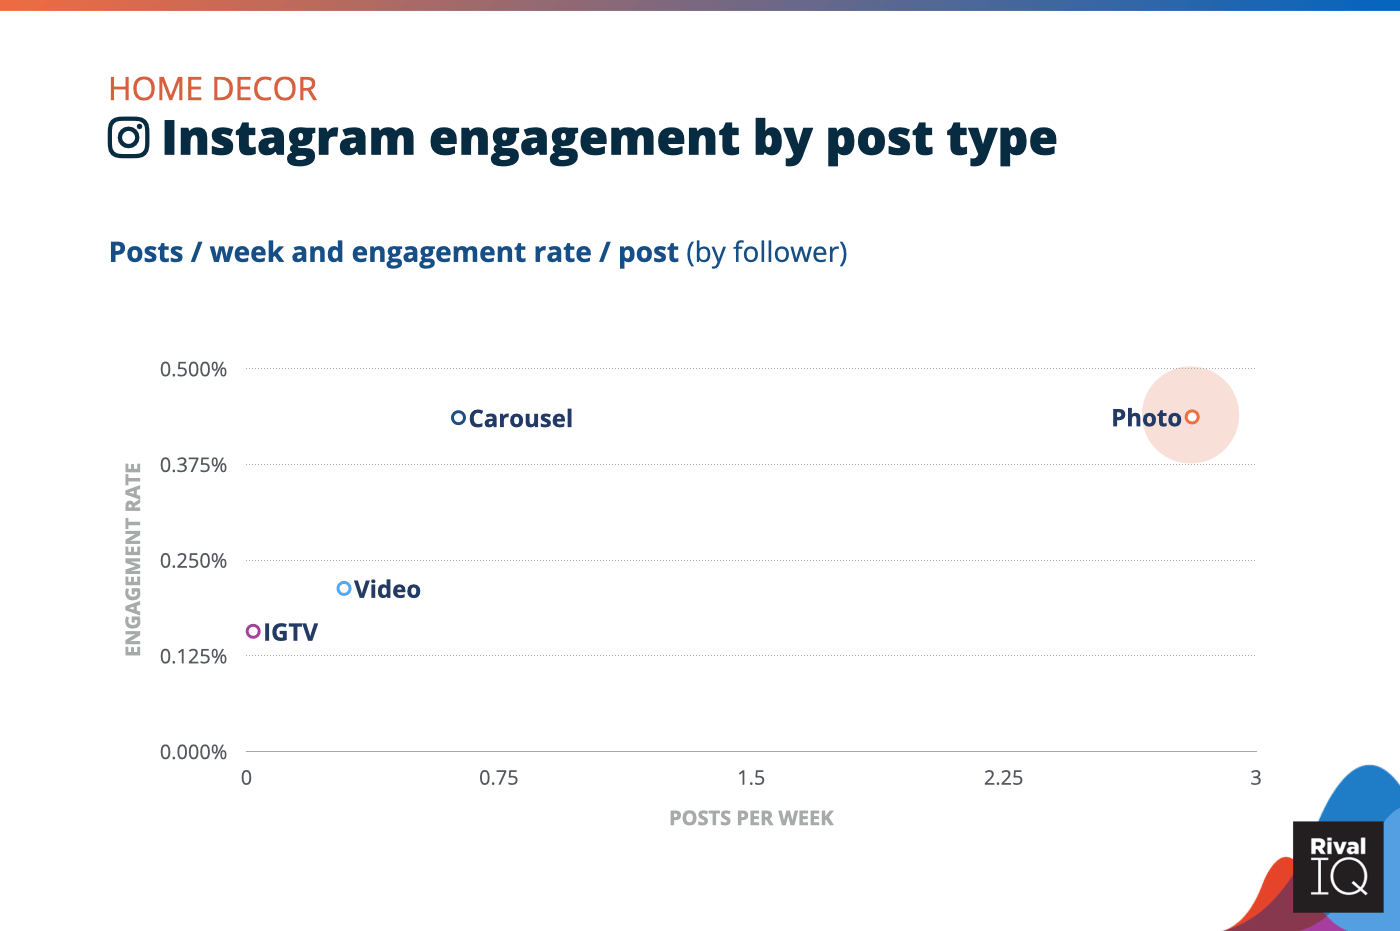
Instagram posts per week and engagement rate by post type, Home Decor
Photos and carousel posts were neck and neck for Home Decor brands on Instagram this year, so try combining a few photos into a carousel post for more engagement oomph.
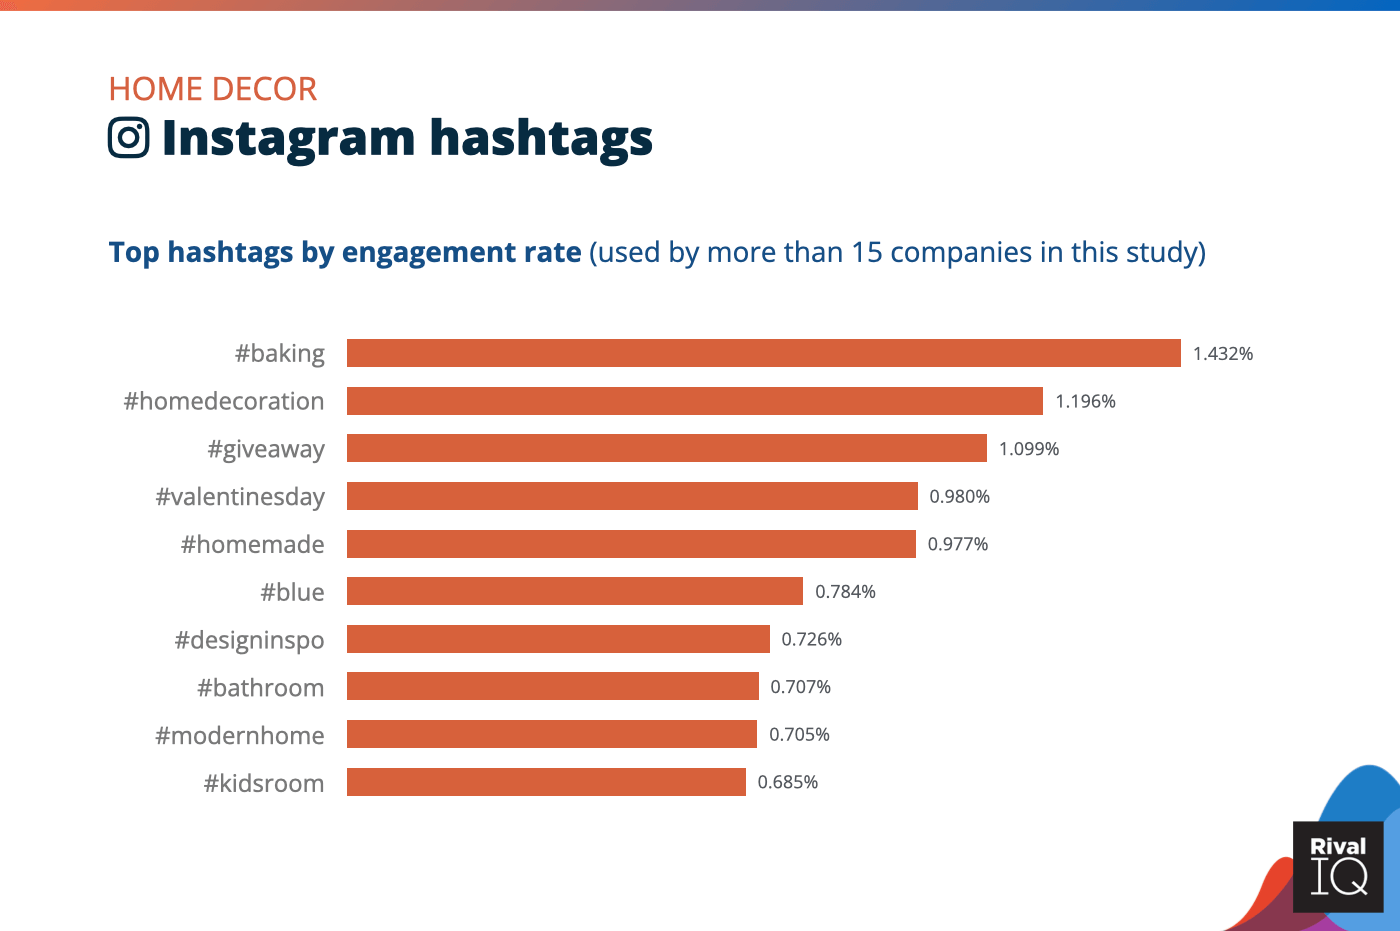
Top Instagram hashtags by engagement rate, Home Decor
Giveaways topped the Insta hashtag charts for Home Decor brands, as did room-specific tags like #bathroom and #kidsroom. Breville UK killed it with super-engaging #giveaway posts.
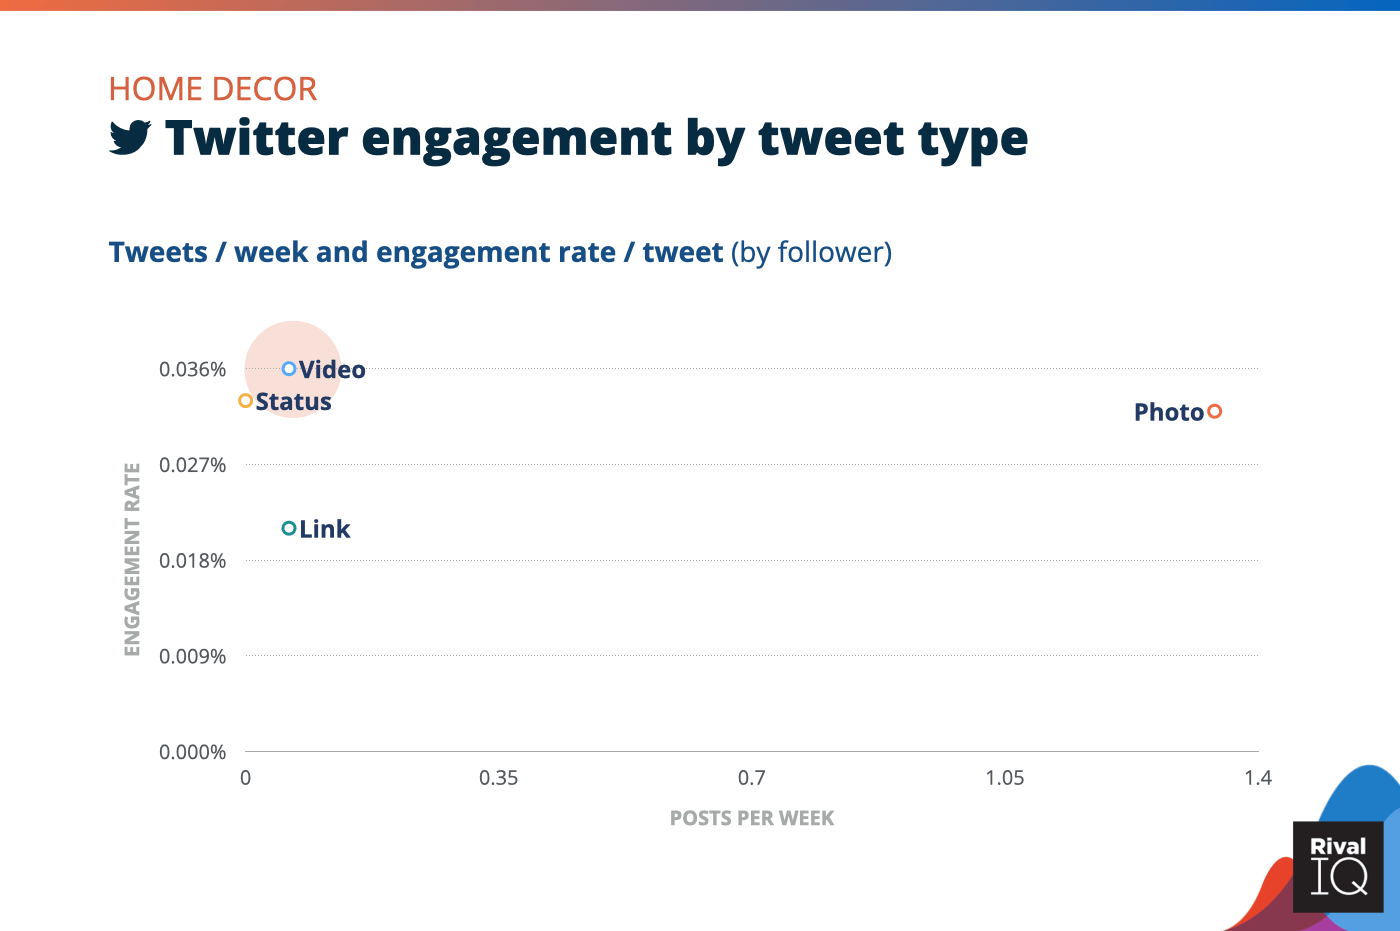
Twitter posts per week and engagement rate by tweet type, Home Decor
Engagement was almost the same for photos, videos, and status updates on Twitter for Home Decor brands, who might want to shake up their photo tweeting a little.
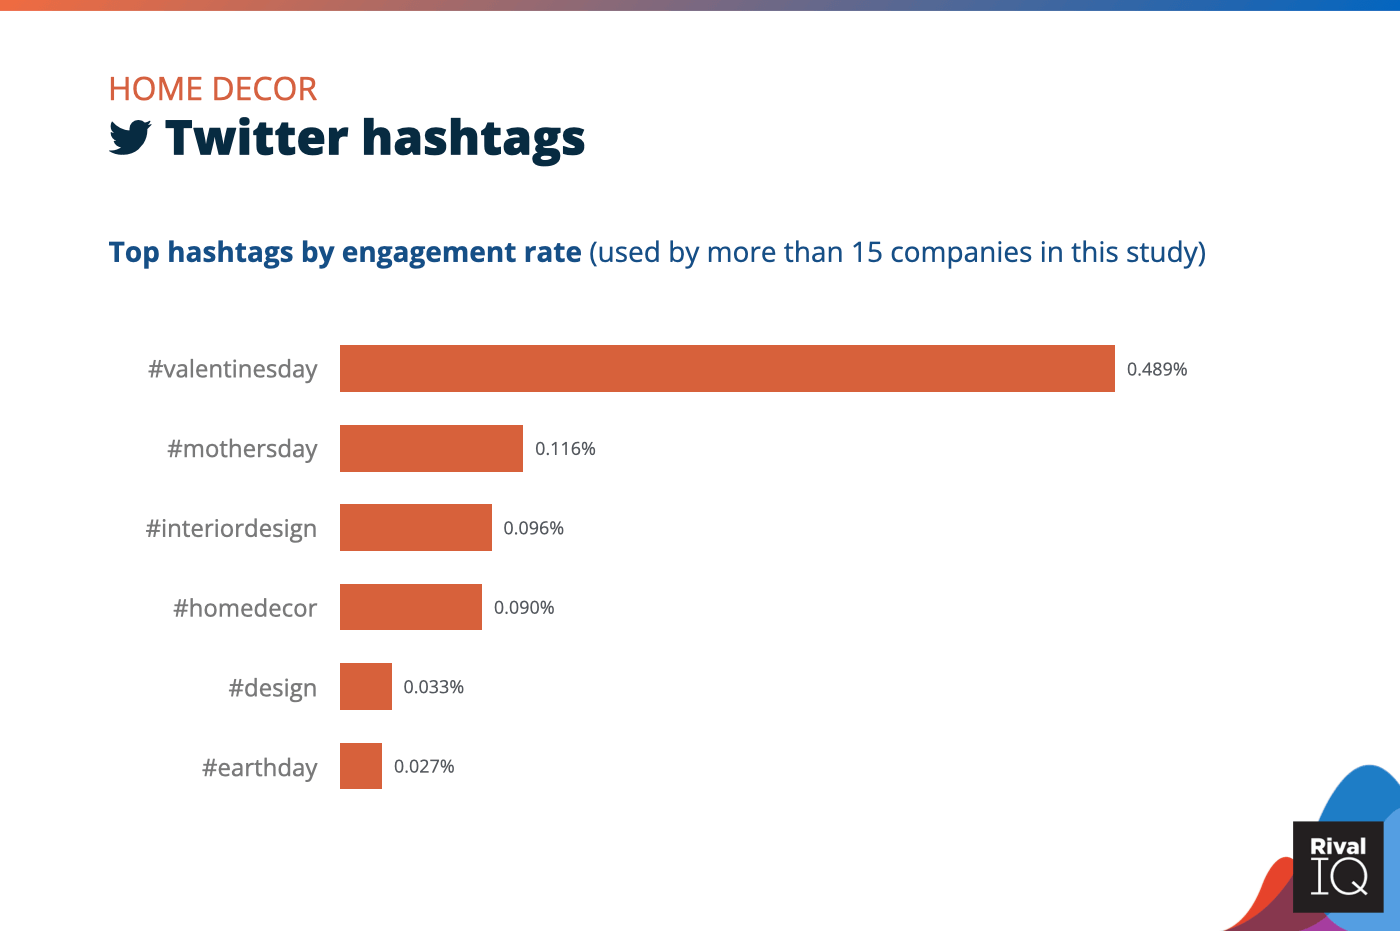
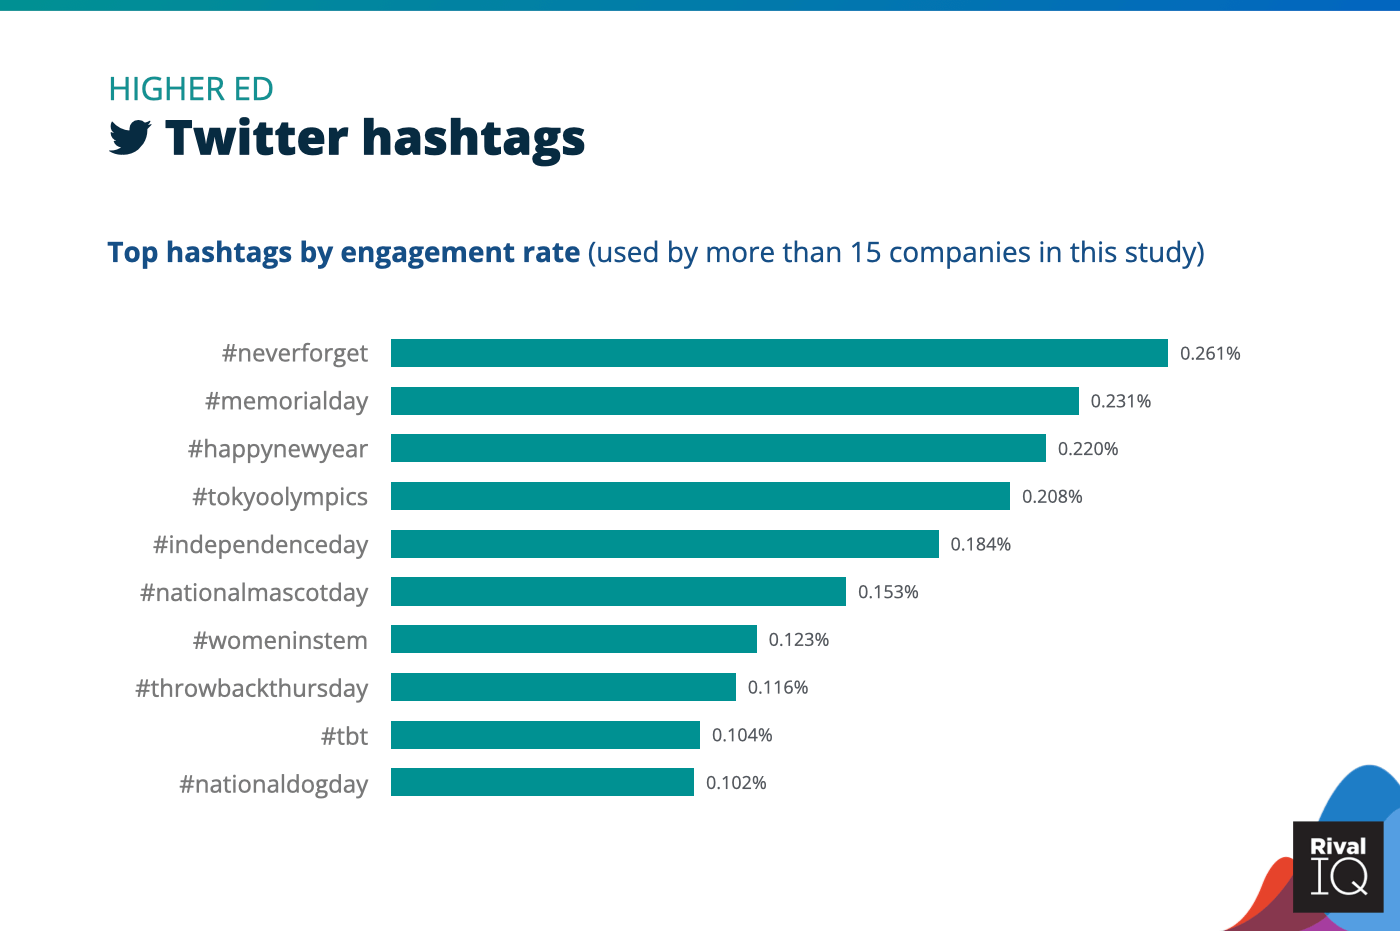
Top Twitter hashtags by engagement rate, Home Decor
Valentine’s Day was clearly a winner for Home Decor brands on Twitter this year. These brands were all over the map with Twitter hashtags this year, which is why there are just a few on this list used by 15 or more companies in the study.
Hotels & Resorts Social Media Benchmarks
Hotels & Resorts saw twice the median engagement on Facebook this year and hovered right around the median on Instagram and Twitter, which is impressive.
A few suggestions to grow engagement:
- Pay attention to the success of giveaways on Instagram, and consider replicating this strategy on other channels.
- Posting frequency was below-median across the board, so experiment with an uptick here to see if you can increase your current engagement rates.
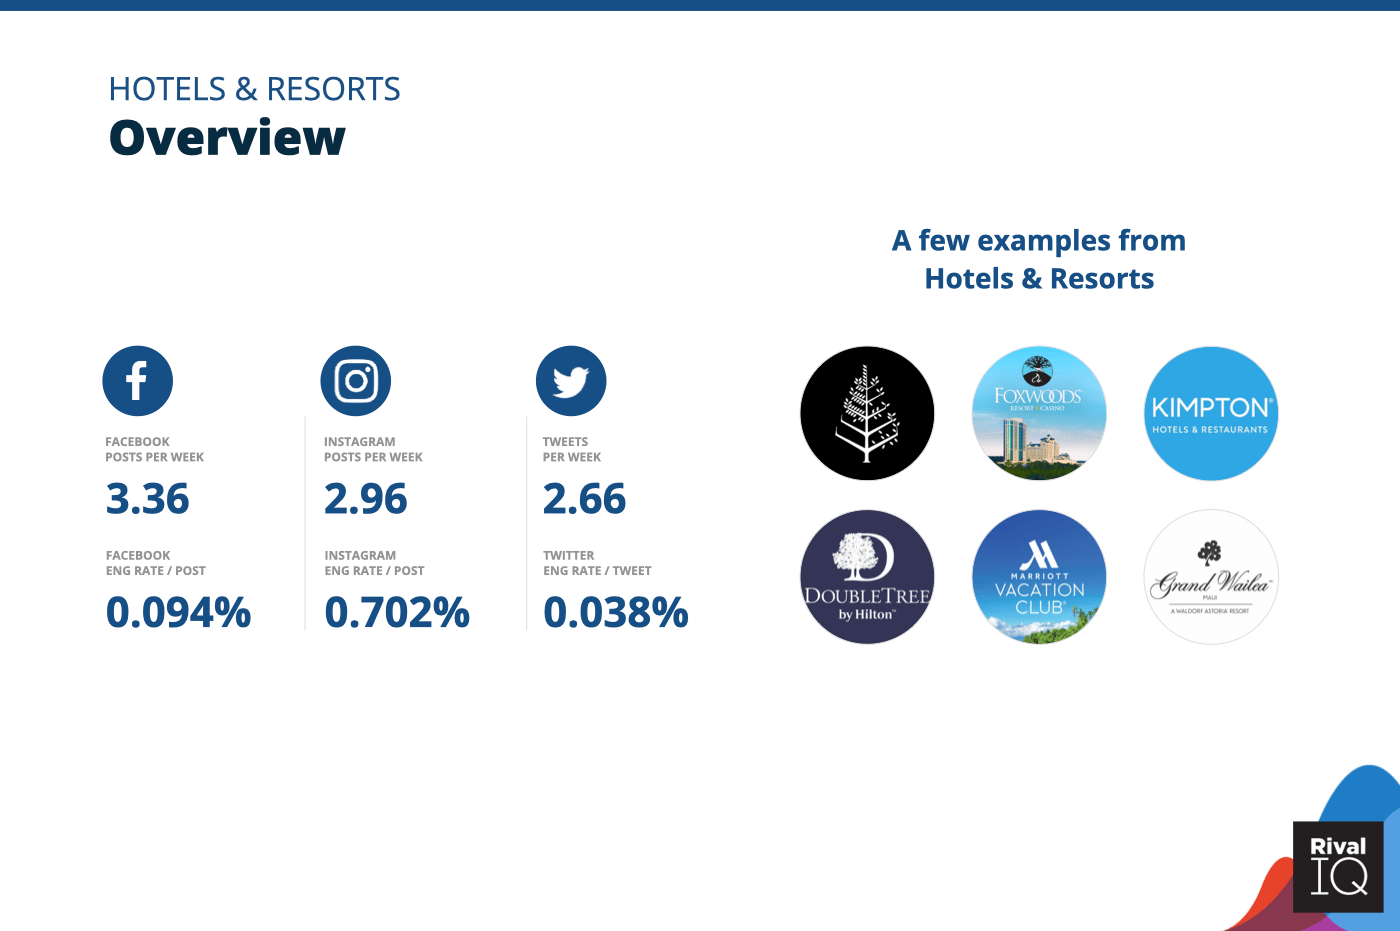
Overview of all benchmarks, Hotels & Resorts
Notable brands in this year’s report include Four Seasons Hotels and Resorts, Kimpton Hotels & Restaurants, Marriott, Foxwoods Resort and Casino, Doubletree, and Grand Wailea.
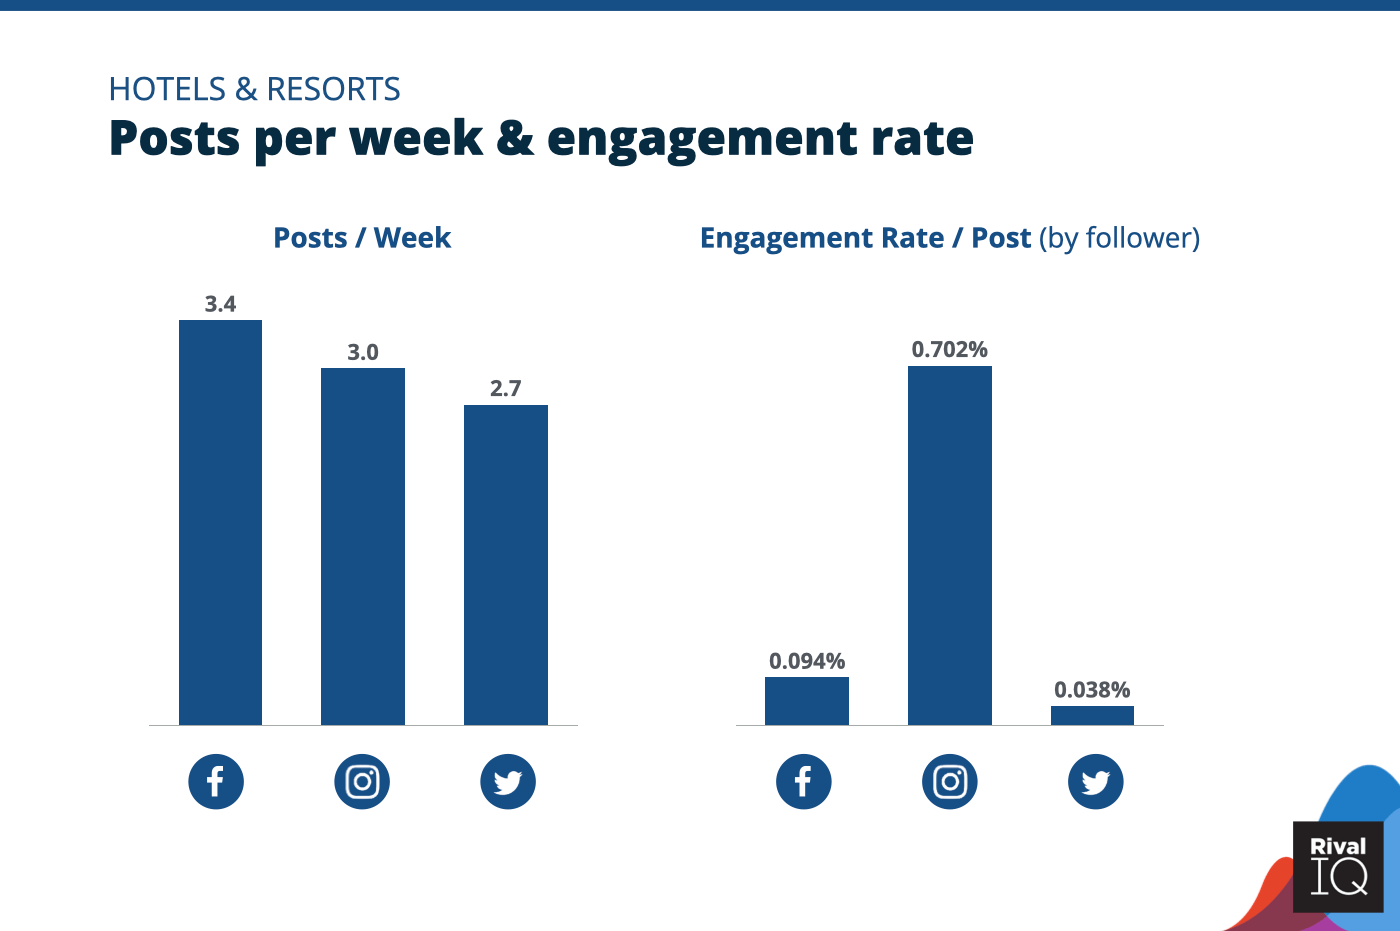
Posts per week and engagement rate per post across all channels, Hotels & Resorts
Hotels & Resorts came in at or above median for engagement rates across all three channels, but really succeeded on Facebook, so it’s good to focus posting energy there.
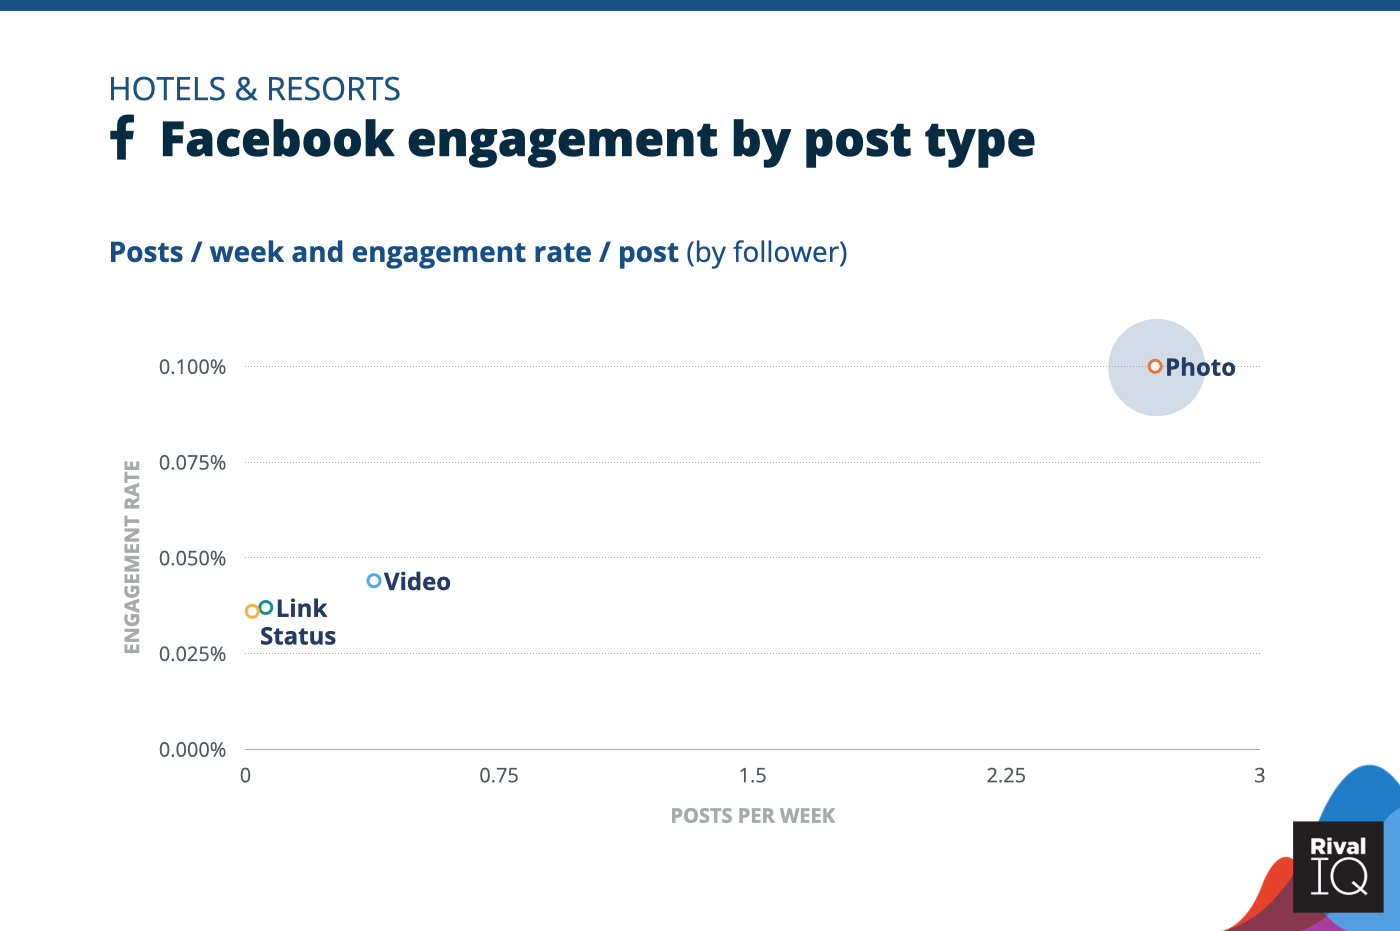
Facebook posts per week and engagement rate by post type, Hotels & Resorts
Photos were more than twice as engaging as the next best post type on Facebook for Hotels & Resorts.
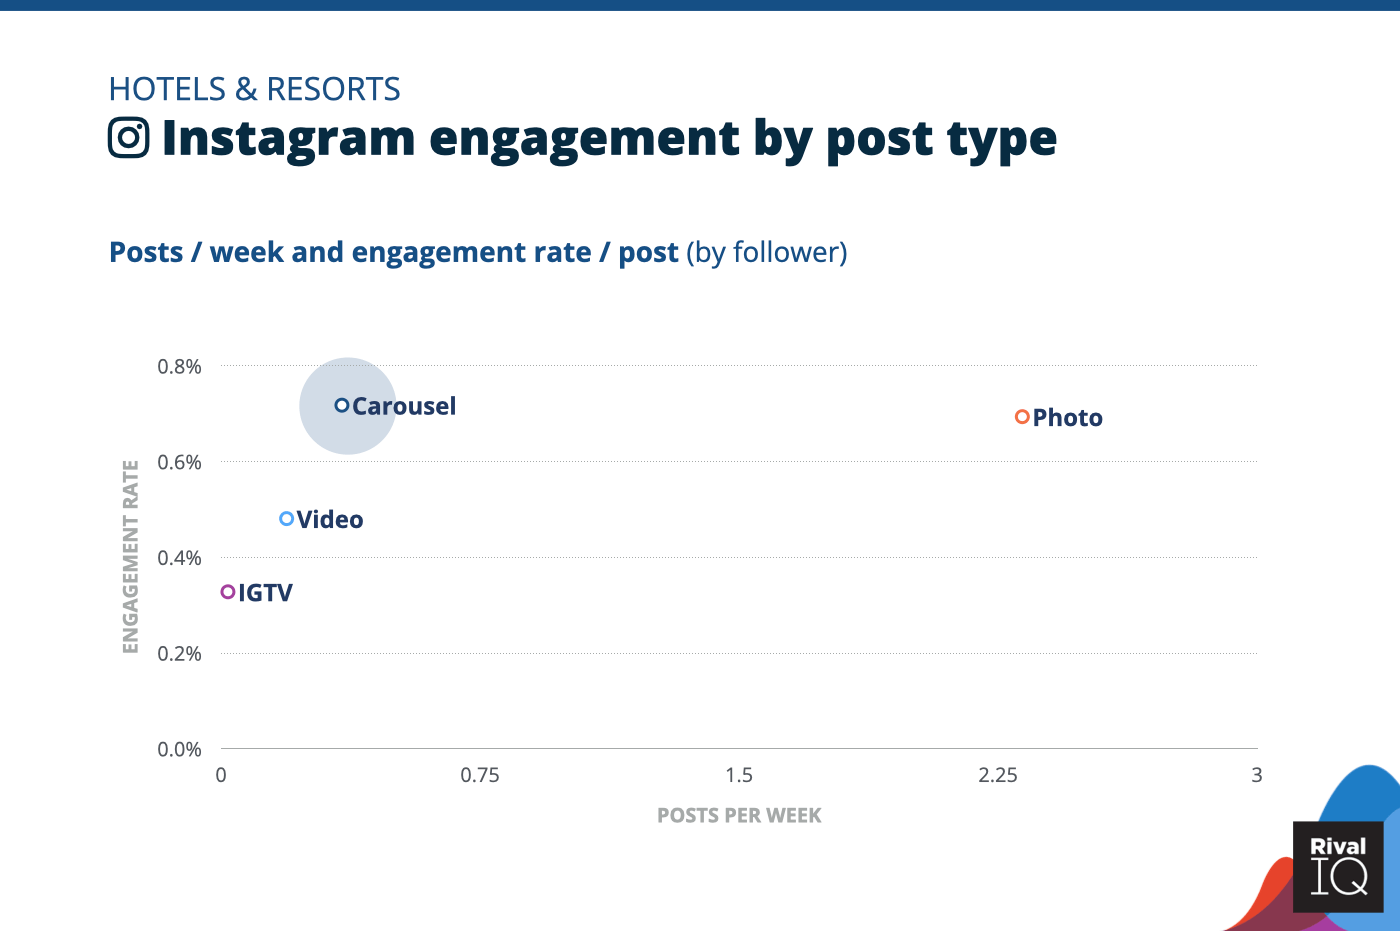
Instagram posts per week and engagement rate by post type, Hotels & Resorts
Carousels edged out photo posts for Hotels & Resorts this year, so consider combining a few photo faves into one carousel post.
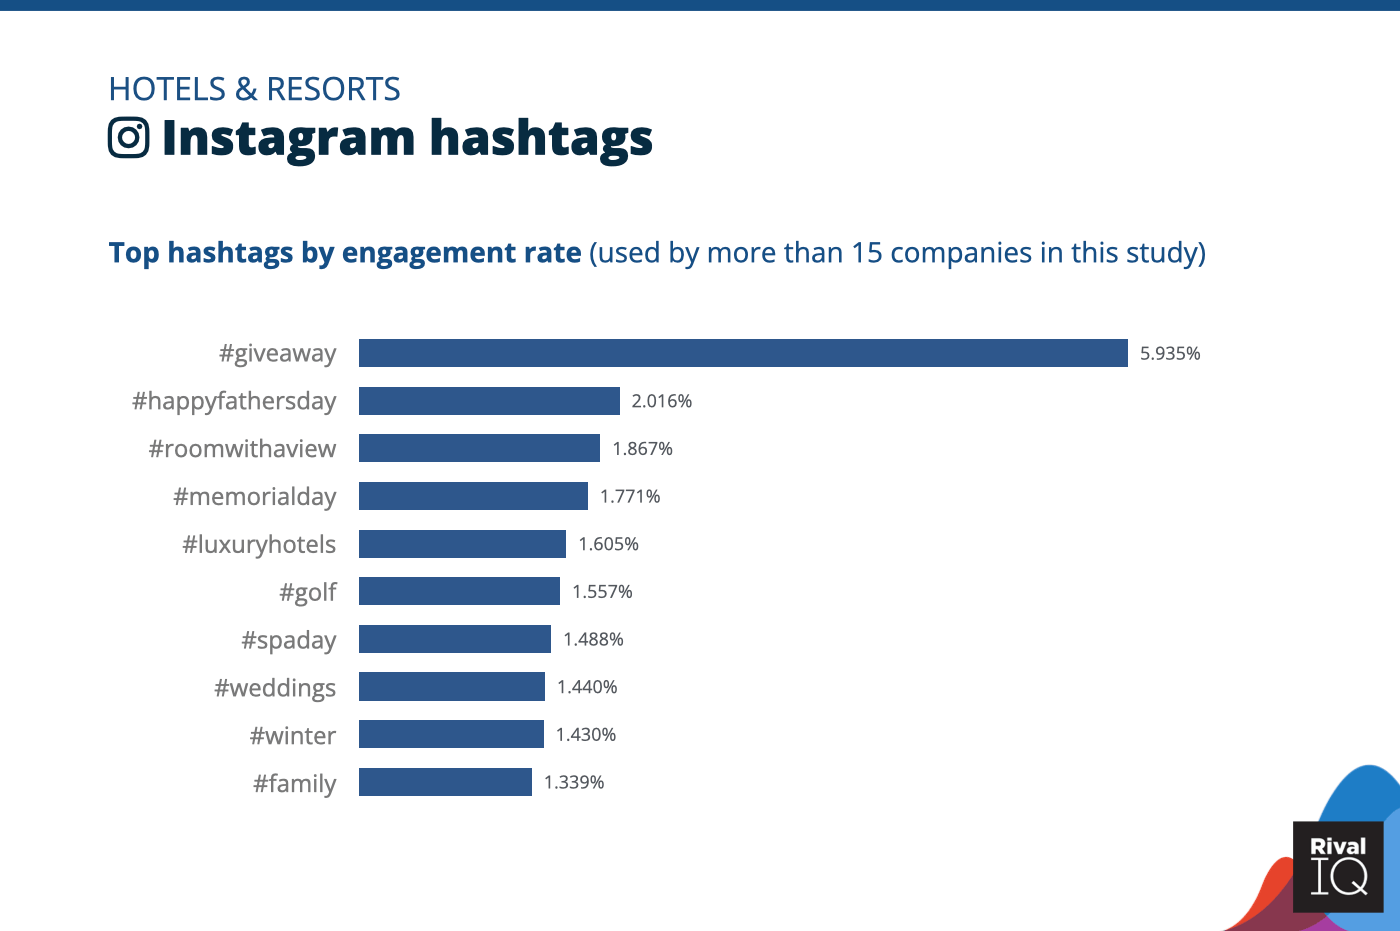
Top Instagram hashtags by engagement rate, Hotels & Resorts
Contest and #giveaway posts outperformed other hashtags by about 3x on Instagram this year for Hotels & Resorts, proving this strategy is definitely one to replicate.
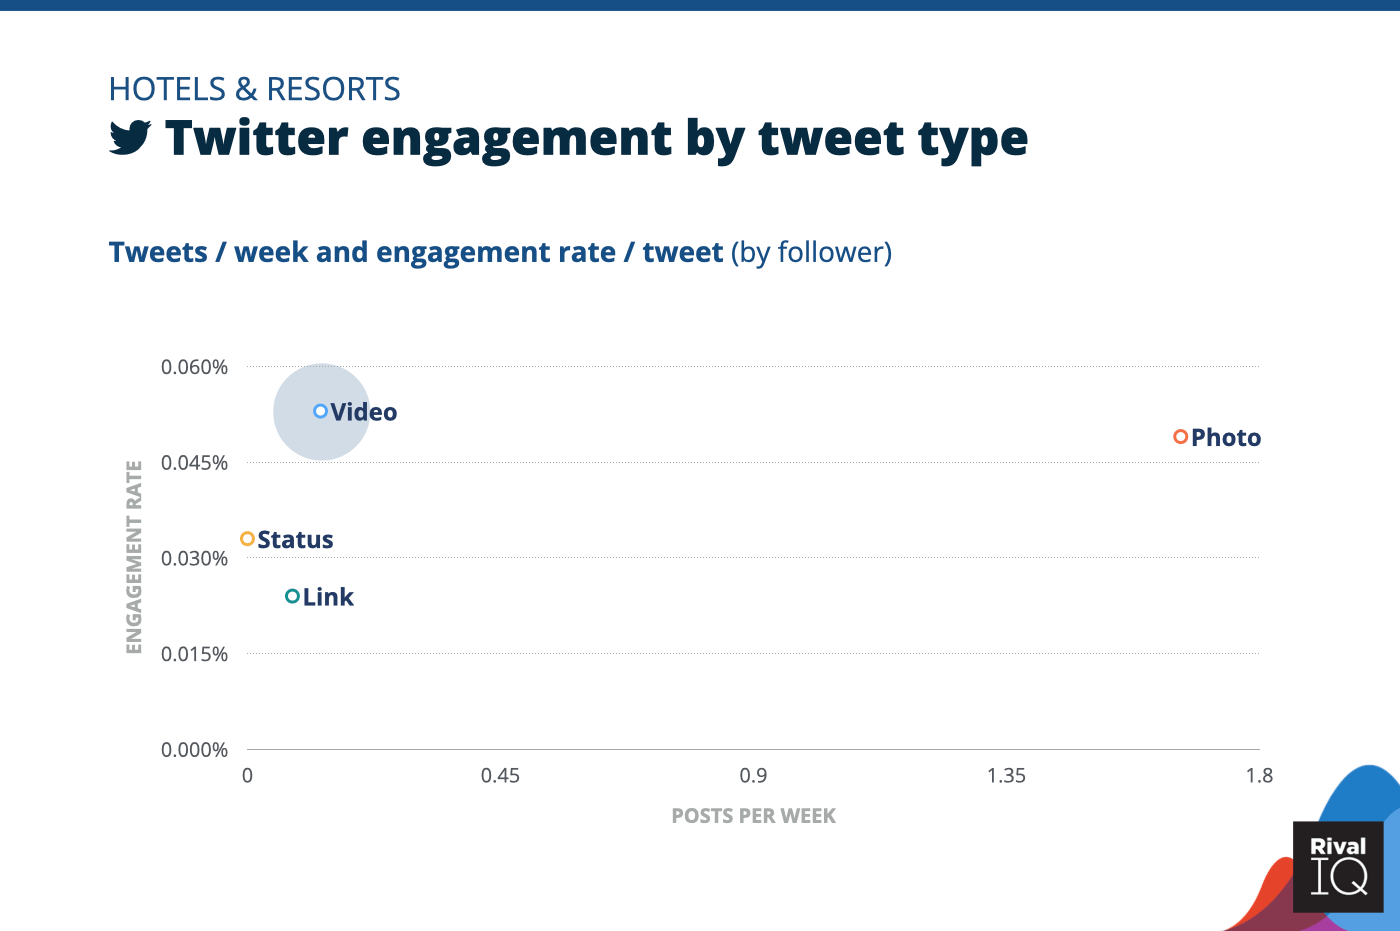
Twitter posts per week and engagement rate by tweet type, Hotels & Resorts
No surprise that it’s all about the visuals for Hotels & Resorts on Twitter, with video and photo tweets topping their charts by engagement rate.
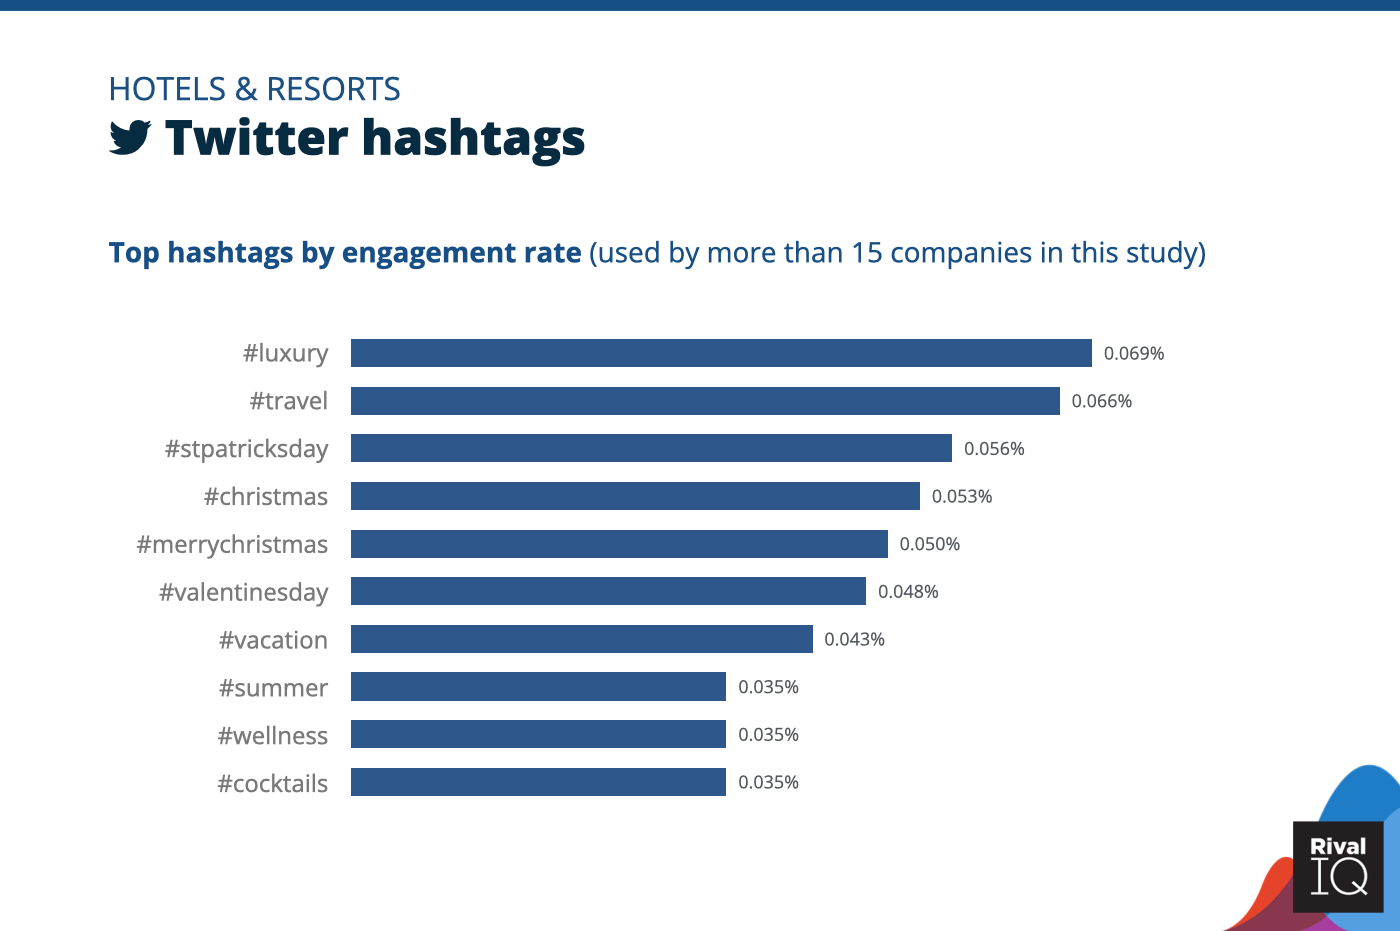
Top Twitter hashtags by engagement rate, Hotels & Resorts
Hotels & Resorts might want to experiment with giveaways on Twitter this year since they performed so well on Instagram but aren’t represented in the industry’s top Twitter hashtags.
Influencers Social Media Benchmarks
Influencers earned 3x the median engagement rate on Facebook for a silver medal, and also killed it on Instagram. Influencers posted right around the median frequency on all three channels, suggesting they’ve dialed in how often to post on social.
Ideas to boost that engagement even more:
- Photos continue to be a great place to focus efforts on Facebook.
- The top-performing hashtag on Instagram and Twitter was #tbt, so don’t be afraid to lean into nostalgia on those channels.
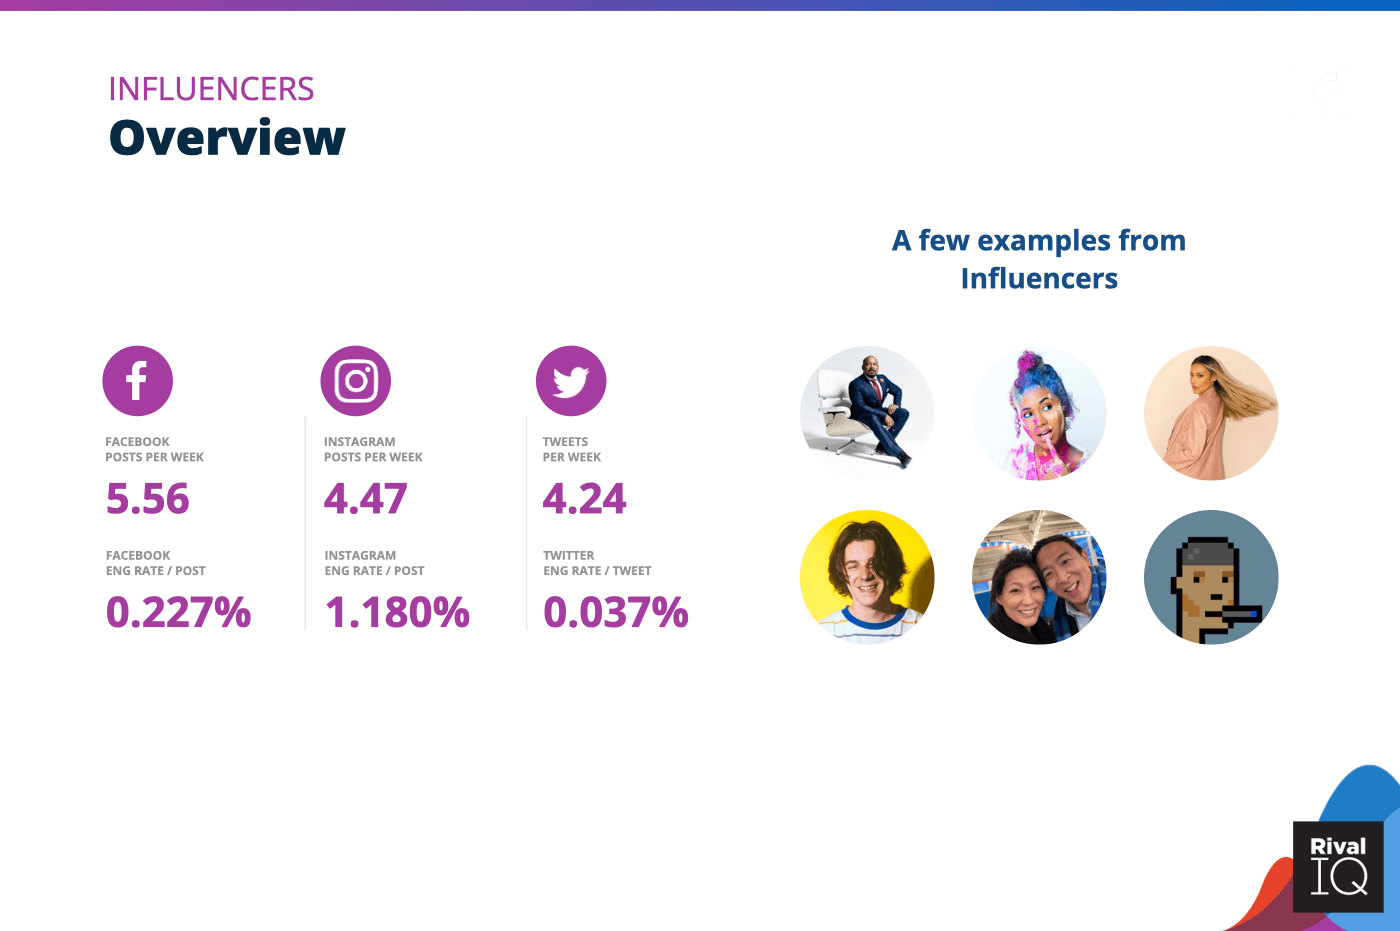
Overview of all benchmarks, Influencers
Notable brands in this year’s report include Daymond John, Desi Perkins, Andrew Yang, Shameless Maya, CrankGameplays, and Jordan Belfort.
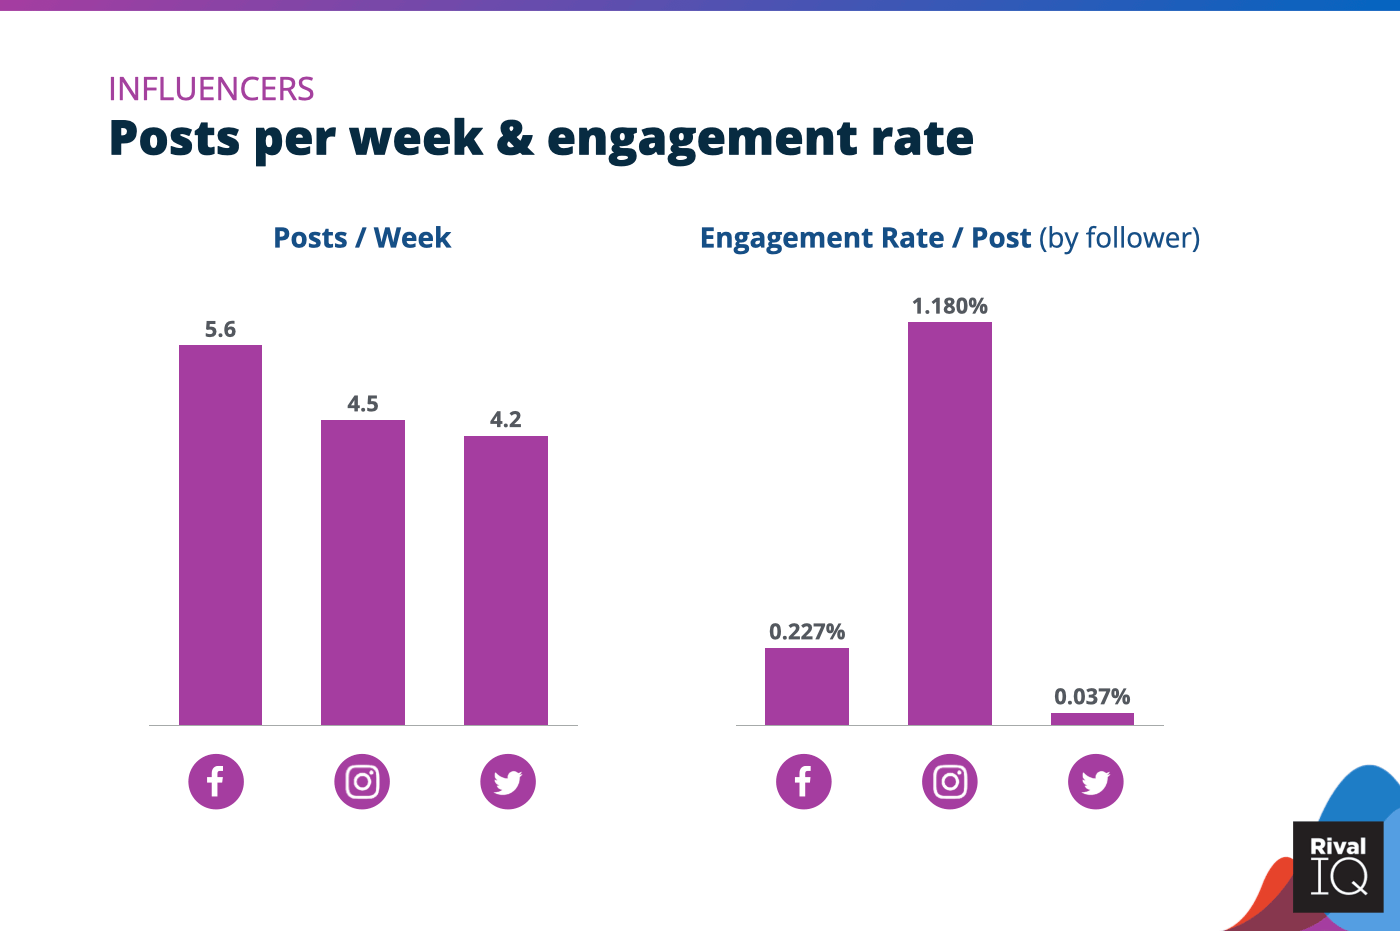
Posts per week and engagement rate per post across all channels, Influencers
Influencers earned 3.5x the median engagement rate on Facebook and 2x on Instagram this year, so no surprise that they’re heavy posters on those channels.

Facebook posts per week and engagement rate by post type, Influencers
Photos perform twice as well as the next most engaging post type for Influencers, so concentrating efforts here is a smart move.
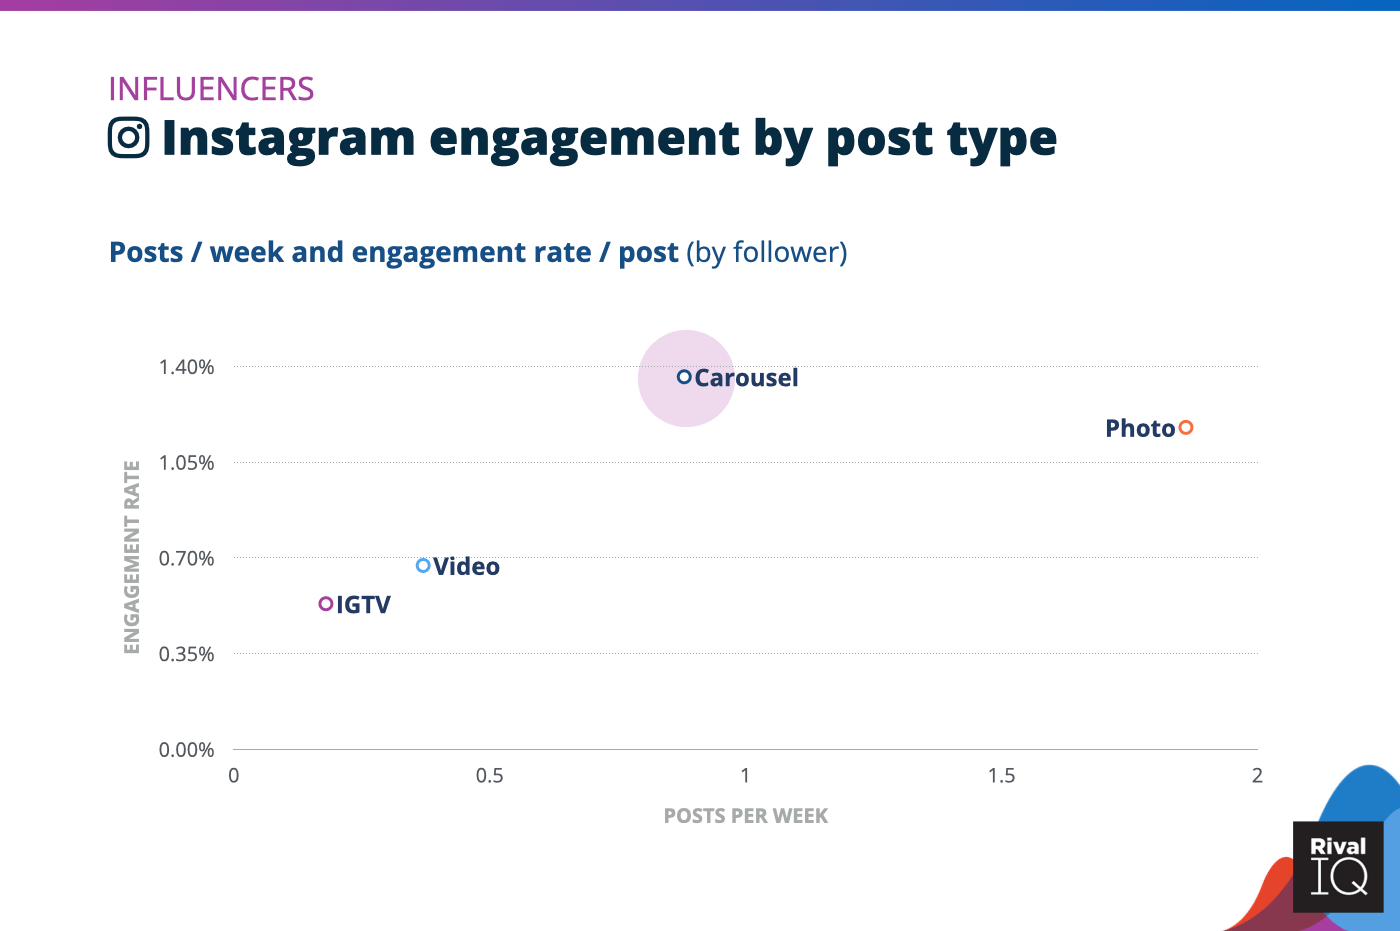
Instagram posts per week and engagement rate by post type, Influencers
Influencers saw top scores on Instagram, but could further widen that lead by posting more carousels.
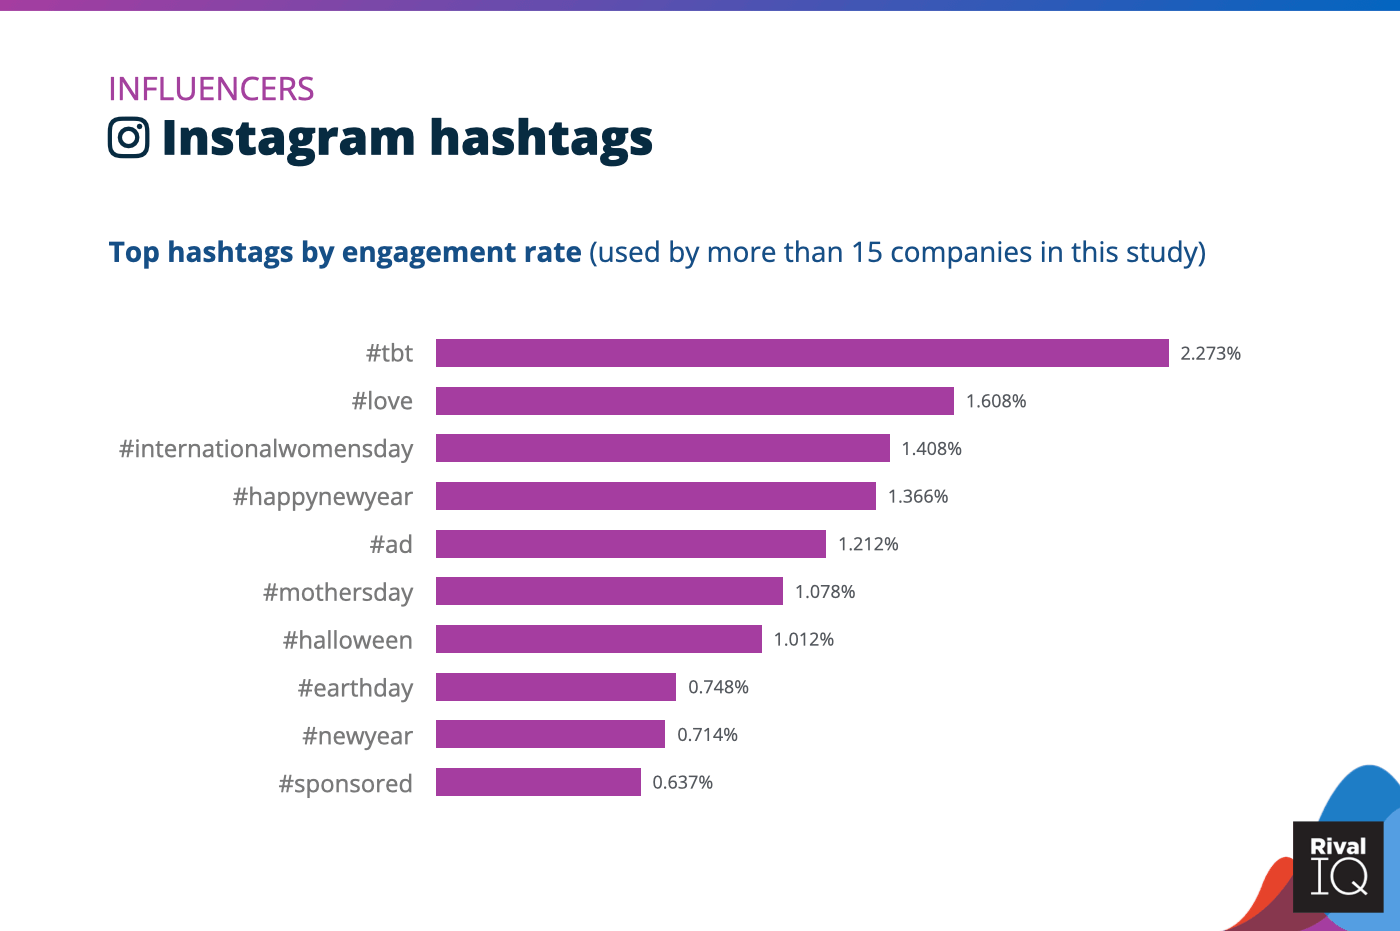
Top Instagram hashtags by engagement rate, Influencers
No surprise that sponsored content indicators like #ad and #sponsored trended for Influencers this year, but it’s also nice to see more personal content like #tbt and holidays performed well too.
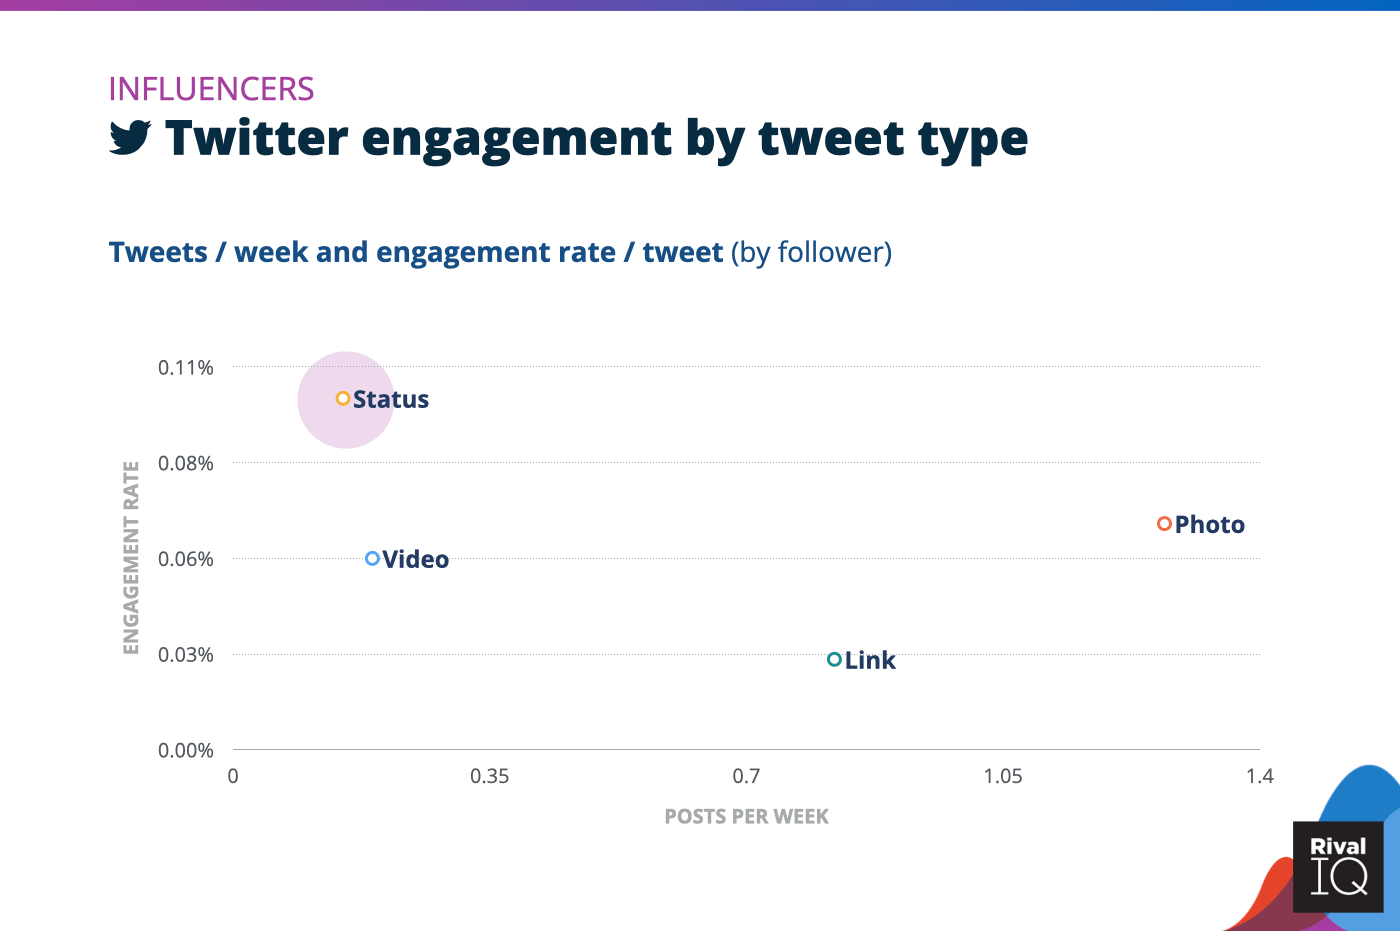
Twitter posts per week and engagement rate by tweet type, Influencers
Status updates were the most engaging tweet type for Influencers this year but were tweeted the least often of any tweet type.
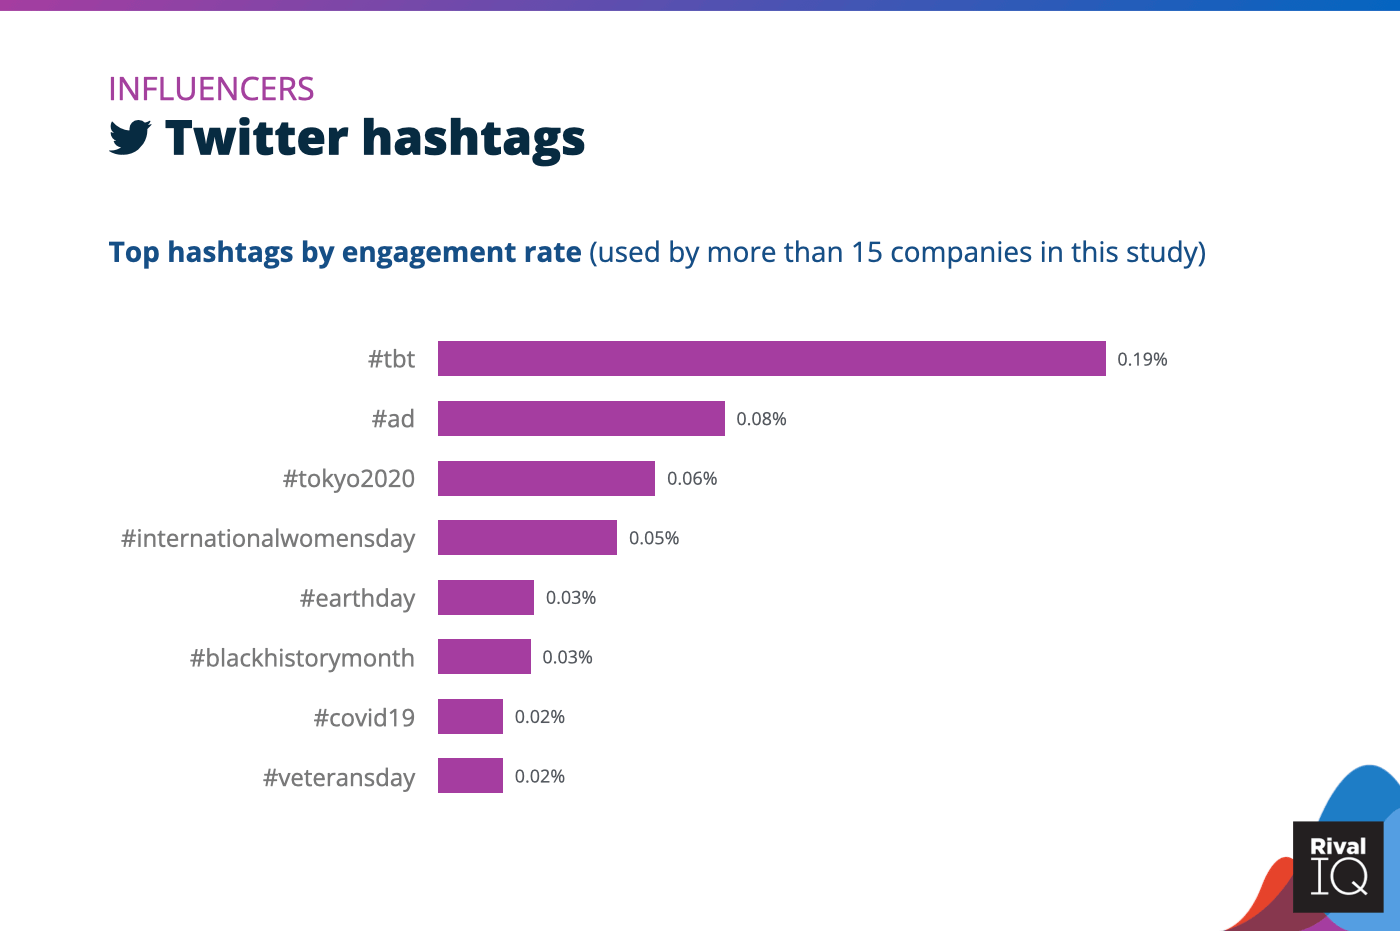
Top Twitter hashtags by engagement rate, Influencers
Just like on Instagram, #tbt was the top-performing hashtag by a mile, suggesting followers relish the chance to get to know content creators.
Media Social Media Benchmarks
Media increased its posting frequency on Facebook and Twitter dramatically but were largely able to hold onto the same engagement rates as last year as the uncertainty of 2021 sent people hunting for news and updates. A few ideas to improve engagement rates:
- Followers loved the chance to enter a #giveaway, so put that swag to work.
- Links are the easiest and most frequently queued post type for media brands, but visual posts like photos and videos performed way better.
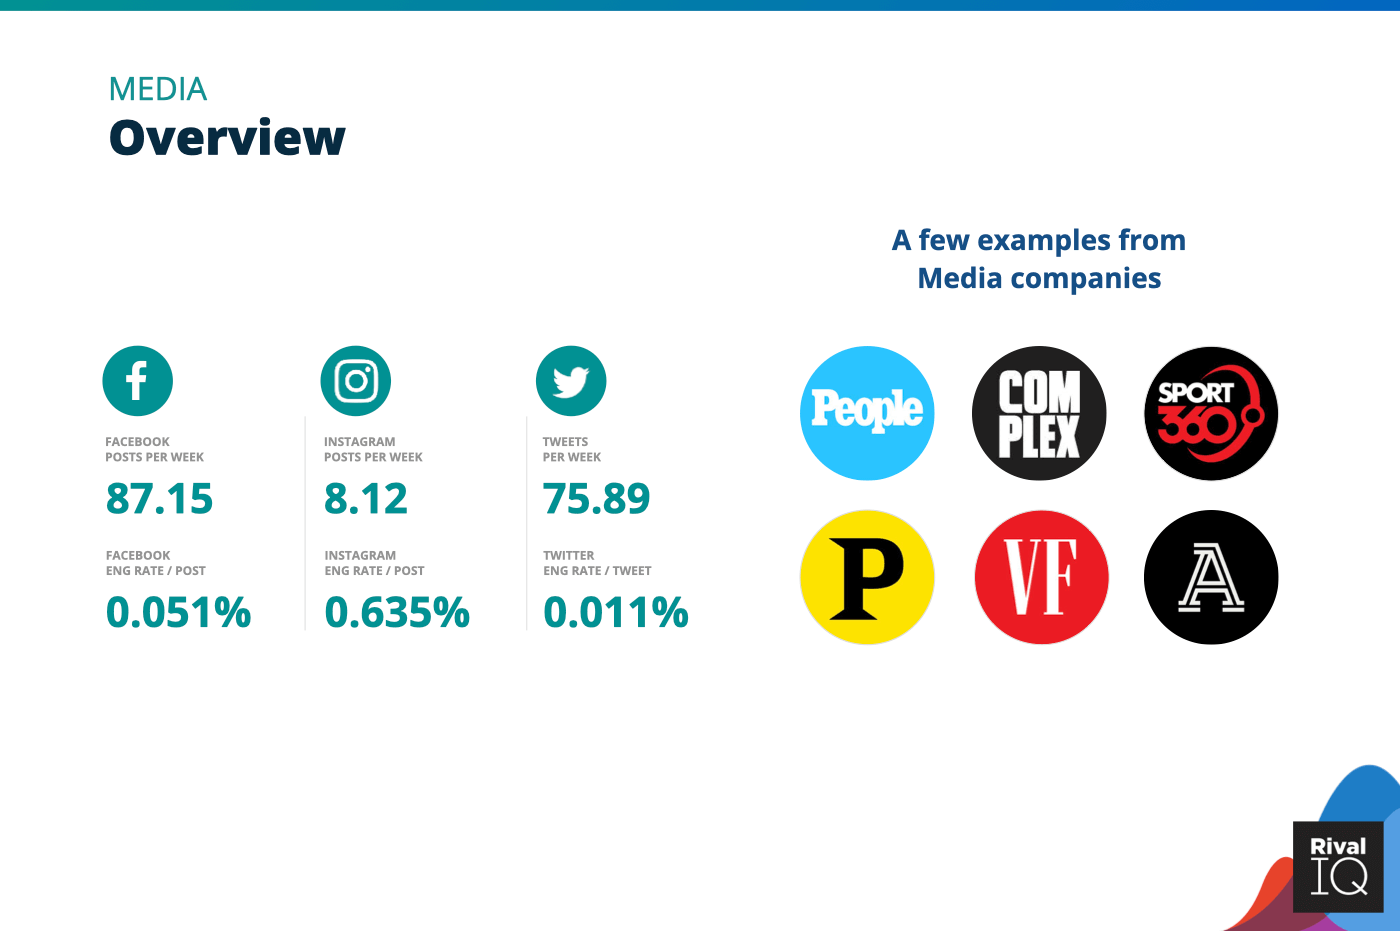
Overview of all benchmarks, Media
Notable brands in this year’s report include People, Sport360, Vanity Fair, Complex Networks, Playbill, and The Athletic.
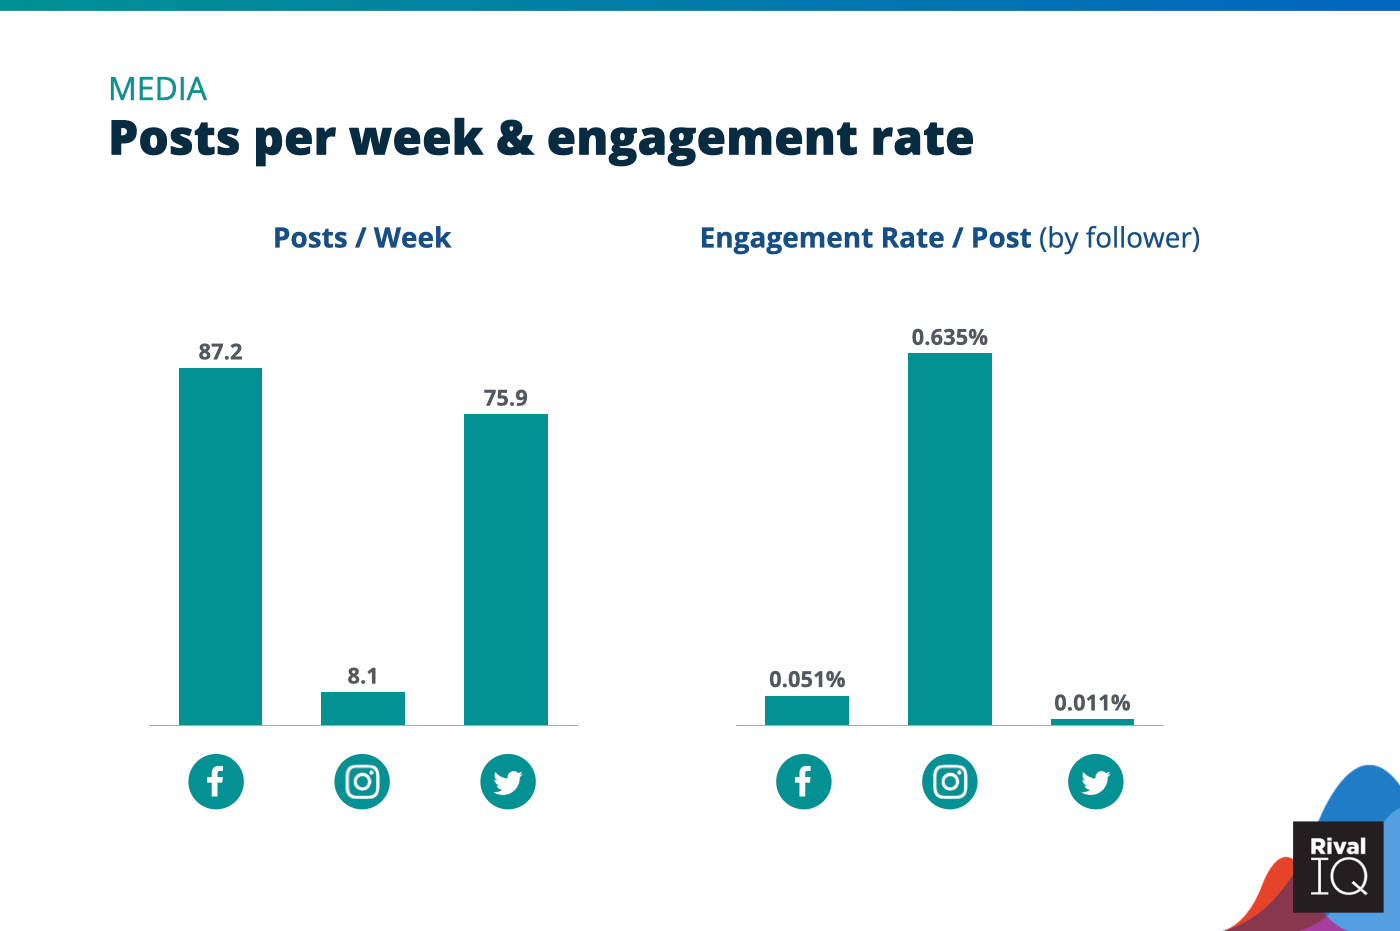
Posts per week and engagement rate per post across all channels, Media
As usual, Media brands dominated the conversation on social this year, especially on Facebook and Twitter.

Facebook posts per week and engagement rate by post type, Media
Videos and photos rock top engagement rates for Media brands on Facebook, though these brands were more than 15x as likely to post a link.
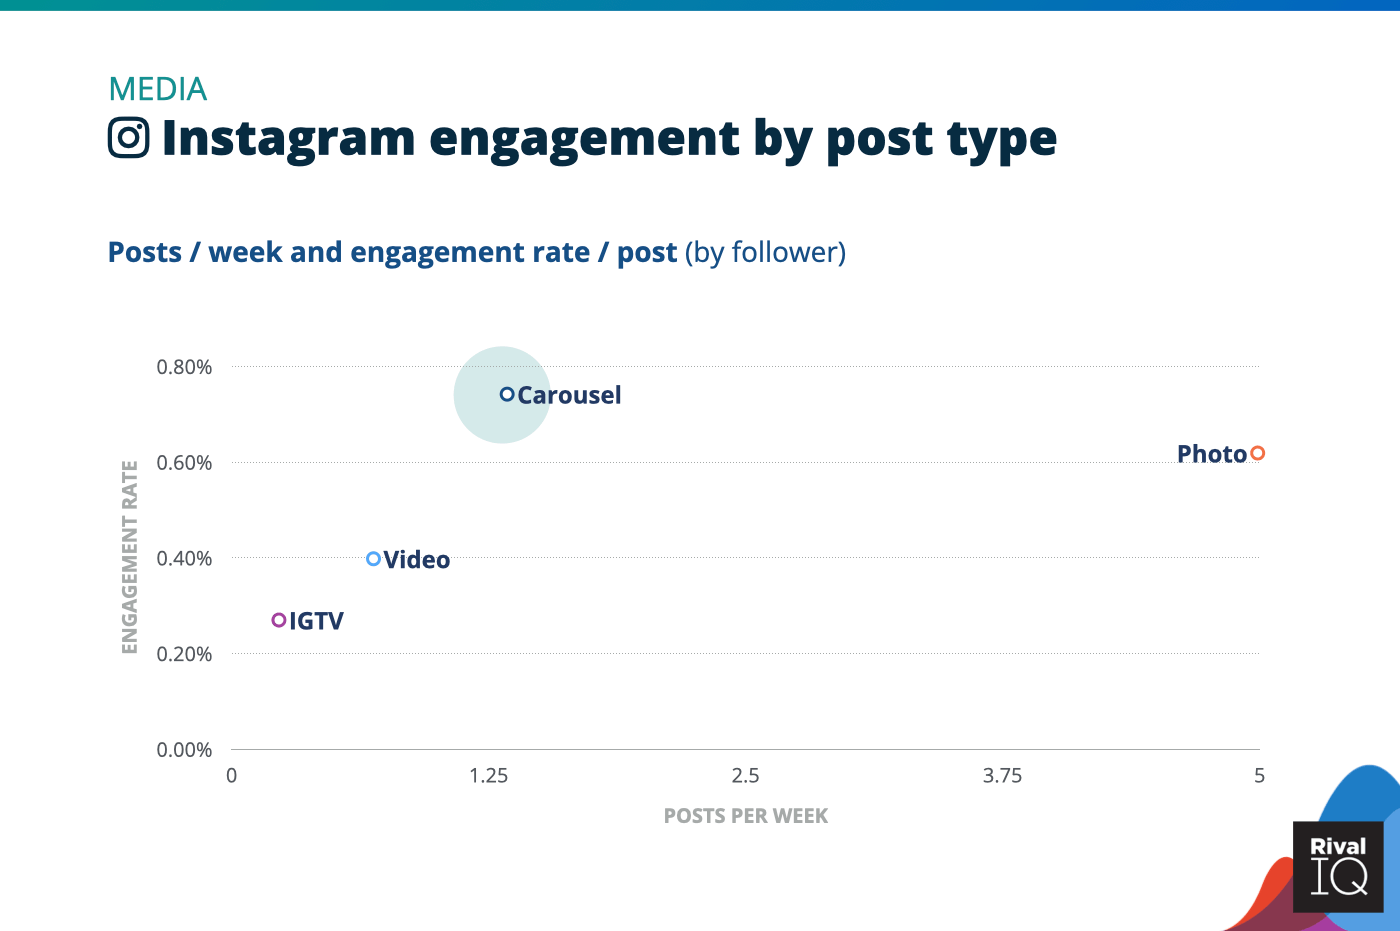
Instagram posts per week and engagement rate by post type, Media
Media ranked right around the median engagement rate on Instagram this year despite posting twice as often as the median industry. Try increasing carousel posting to get ahead on this ultra-visual channel.
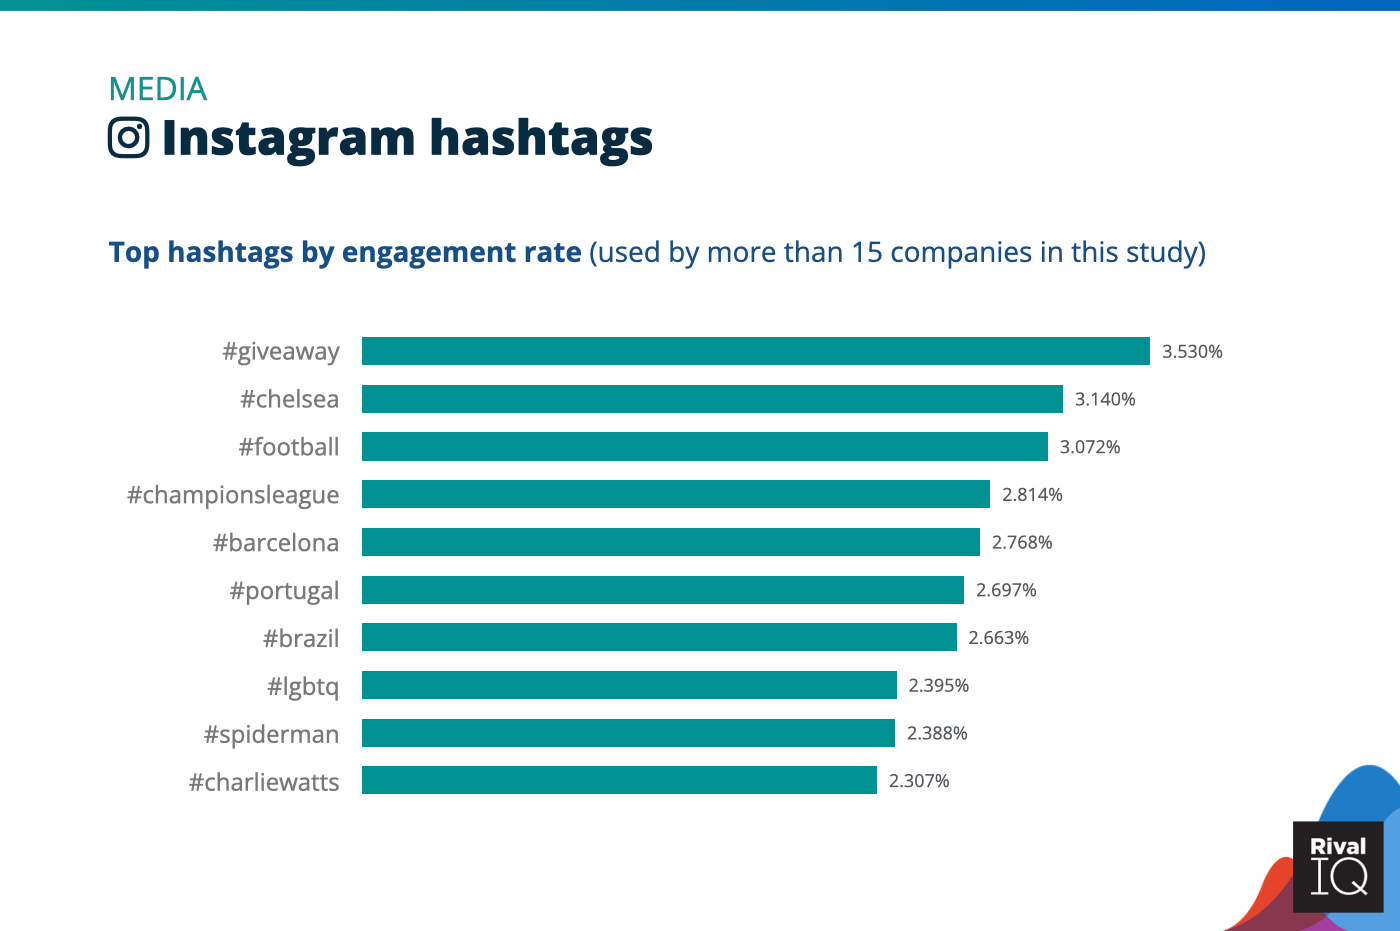
Top Instagram hashtags by engagement rate, Media
#Giveaway posts were a hit for Media brands this year, as was anything having to do with sports.
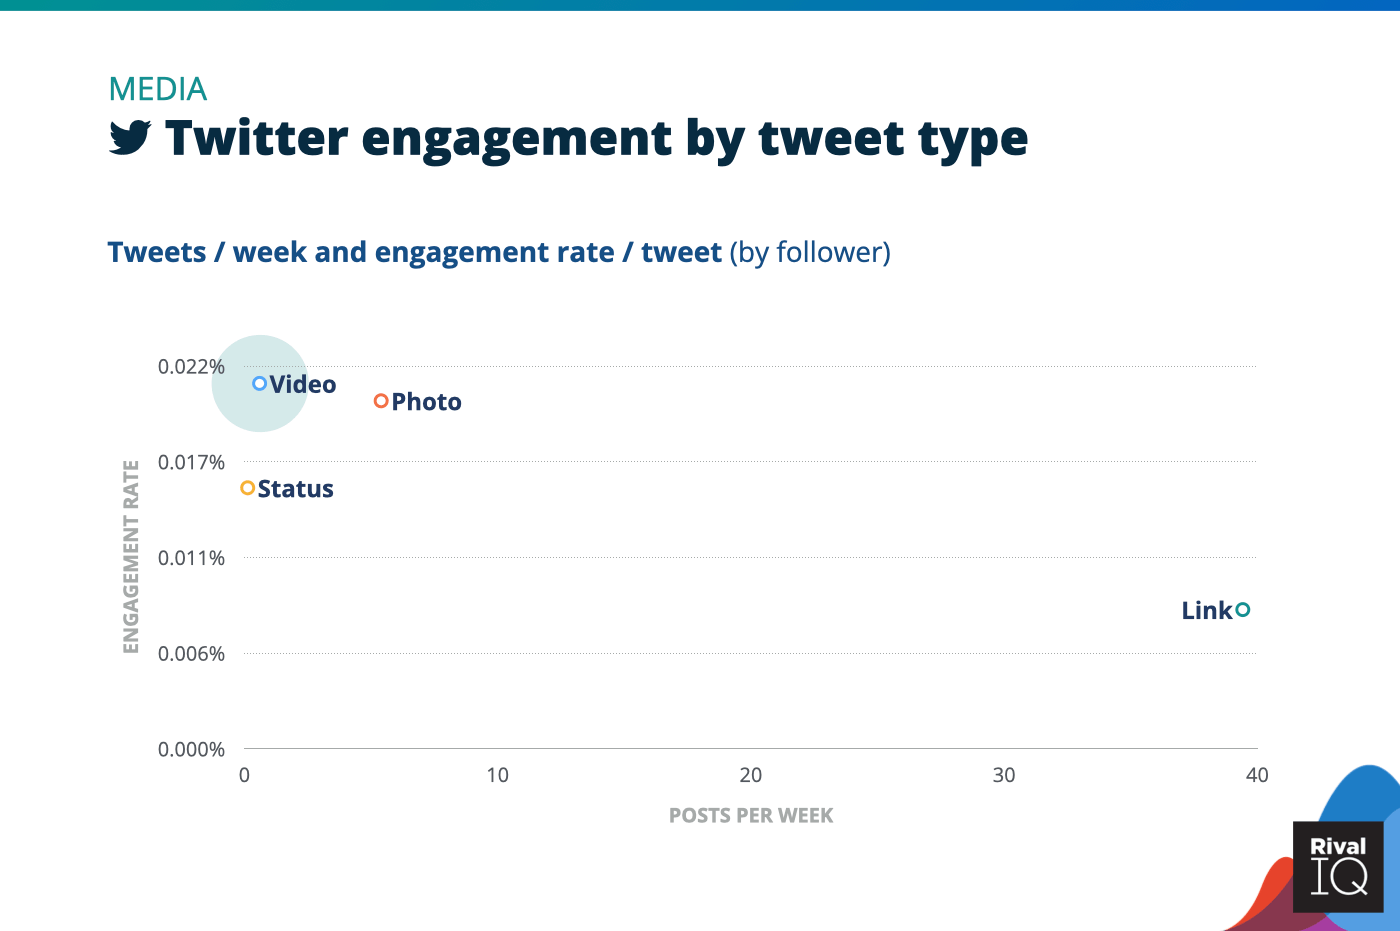
Twitter posts per week and engagement rate by tweet type, Media
Once again, Media brands heavily favored link tweets, but might want to invest more energy in video tweets, which grabbed more than twice the engagement rates.

Top Twitter hashtags by engagement rate, Media
You might be thinking #bts meant “behind the scenes” of making the news, but the hashtag that dominated Twitter for Media brands was all about Korean boy band BTS.
Nonprofits Social Media Benchmarks
Nonprofits saw above-median engagement rates across all social channels this year and posted about twice the median frequency on Facebook and Twitter.
Suggestions for Nonprofits:
- Don’t be afraid to play with posting frequency to try to replicate these stellar engagement rates with fewer posts.
- Photos really helped Nonprofits tell their stories this year, so this is a good post type to focus on in the year ahead (along with its cousin, carousels).
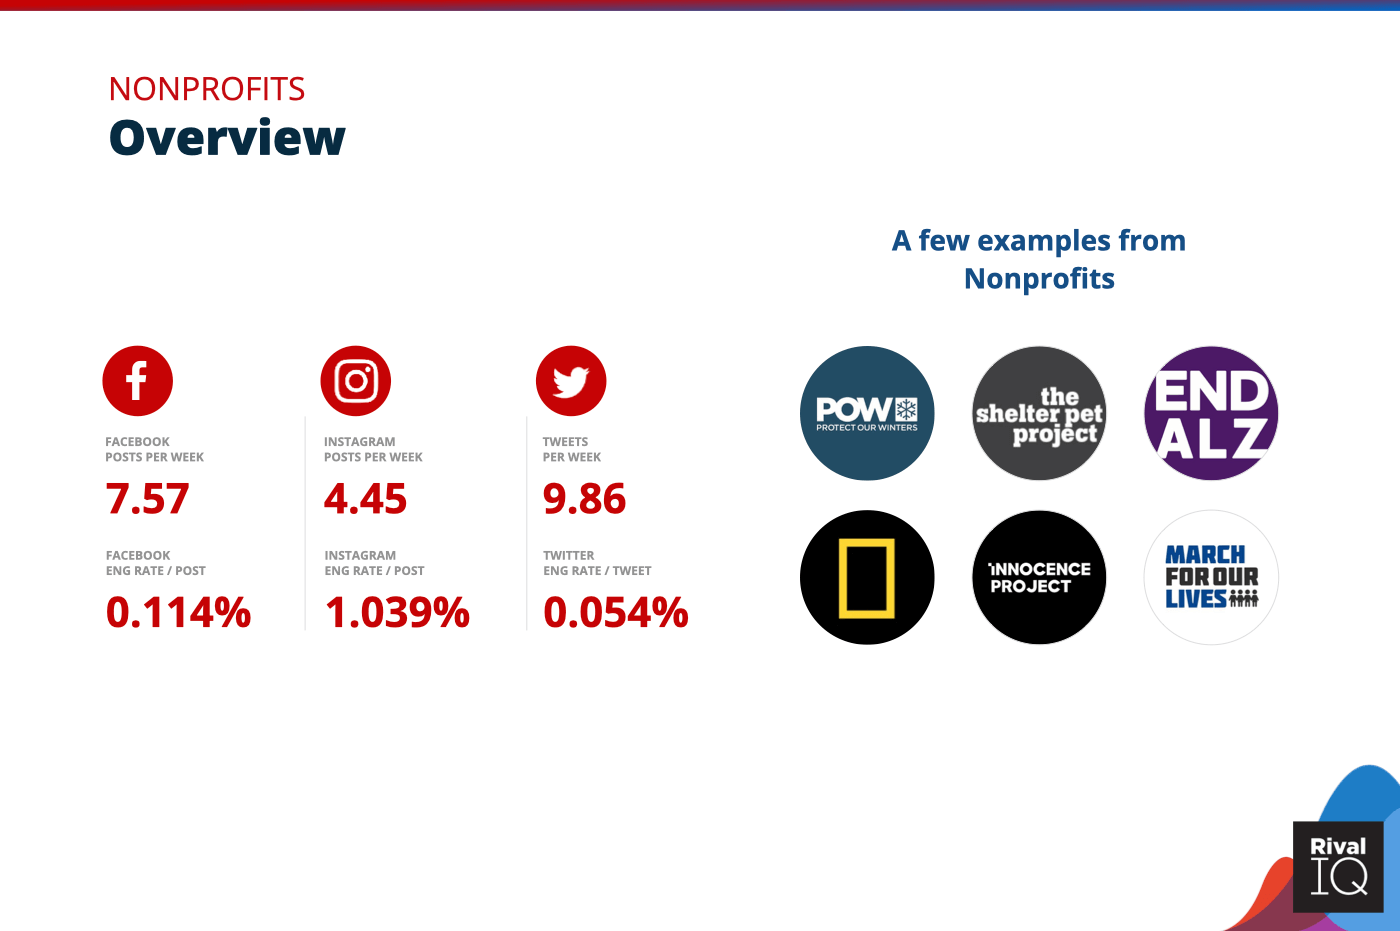
Overview of all benchmarks, Nonprofits
Notable brands in this year’s report include Protect Our Winters, EndAlz, Innocence Project, The Shelter Pet Project, National Geographic, and March for Our Lives.
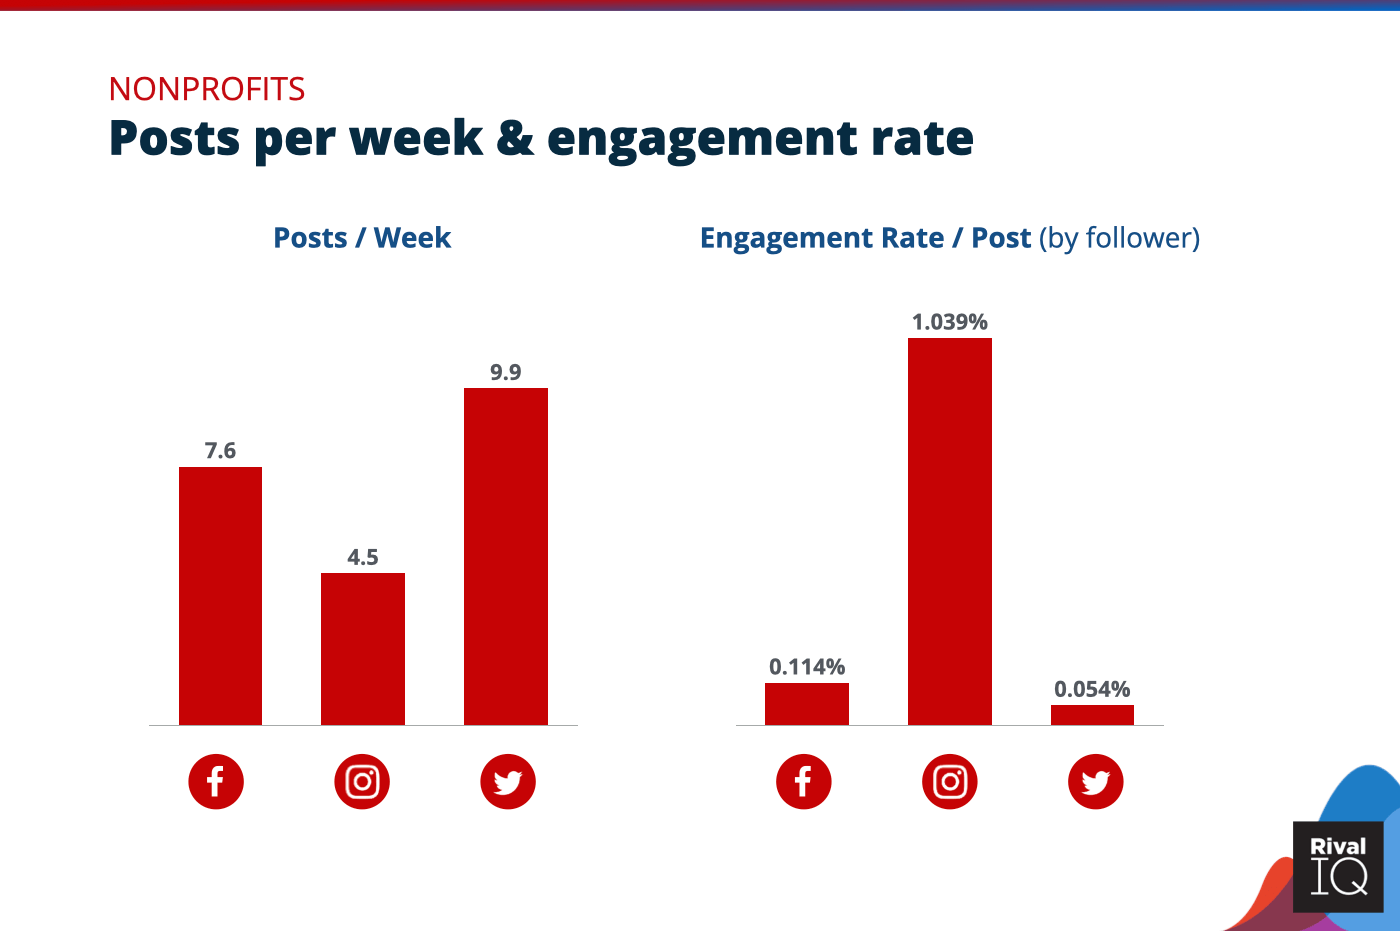
Posts per week and engagement rate per post across all channels, Nonprofits
Nonprofits earned nearly twice the median engagement on every channel this year, and were especially prolific on Facebook and Twitter.
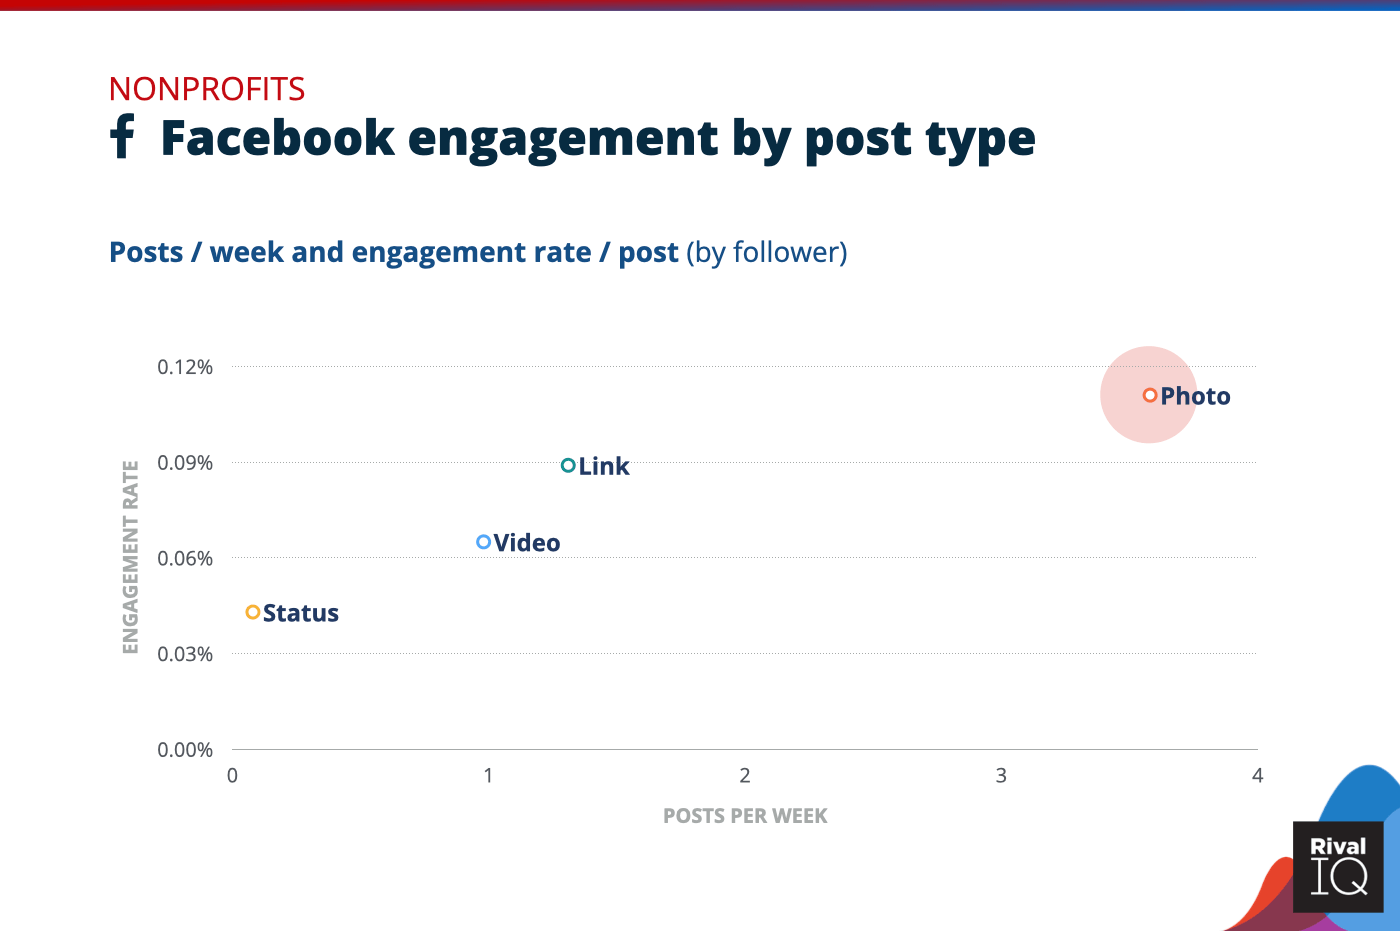
Facebook posts per week and engagement rate by post type, Nonprofits
Photos helped Nonprofits soar on Facebook this year and were posted about twice as frequently as the next most engaging post type.
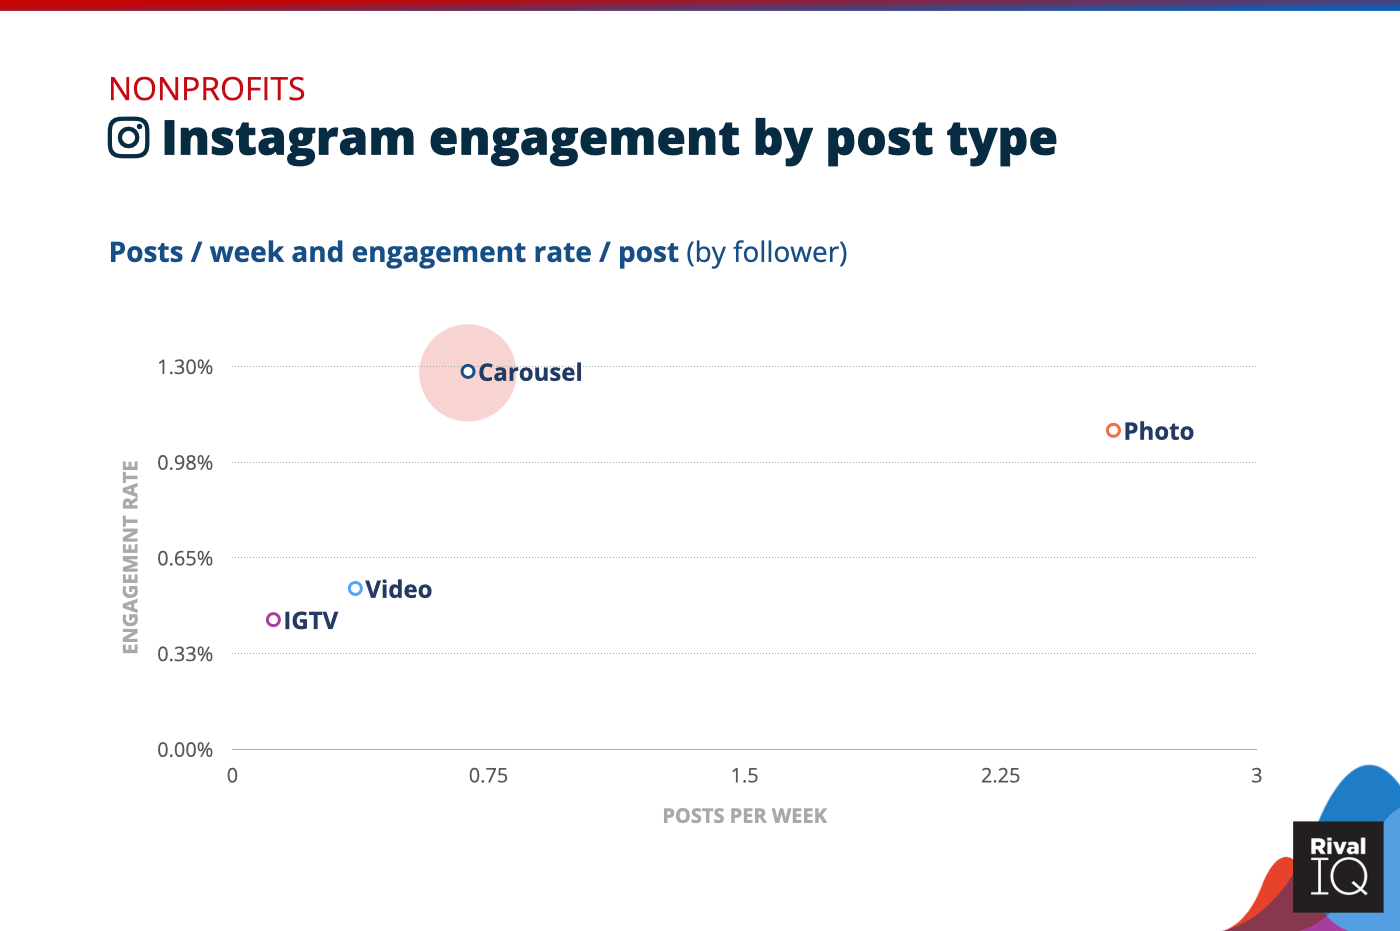
Instagram posts per week and engagement rate by post type, Nonprofits
Carousels and photos performed much better for Nonprofits on Instagram than videos. Nonprofits like Immigration Equality made great use of carousels to educate followers using the extra real estate from multiple views.
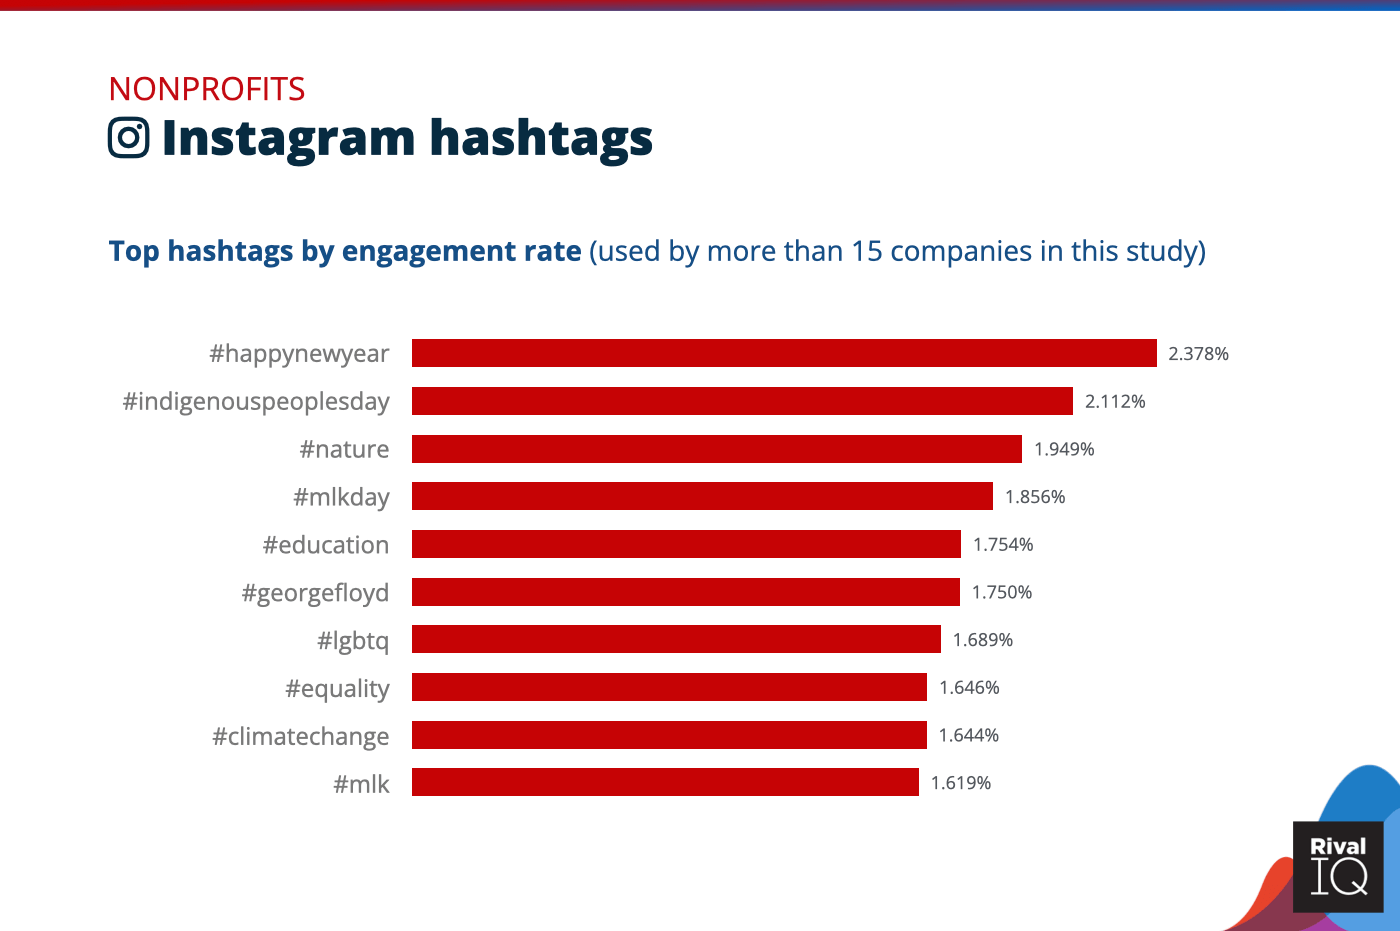
Top Instagram hashtags by engagement rate, Nonprofits
Nonprofits seized the opportunity to discuss issues that matter on Instagram with hashtags like #IndigenousPeoplesDay and #ClimateChange.
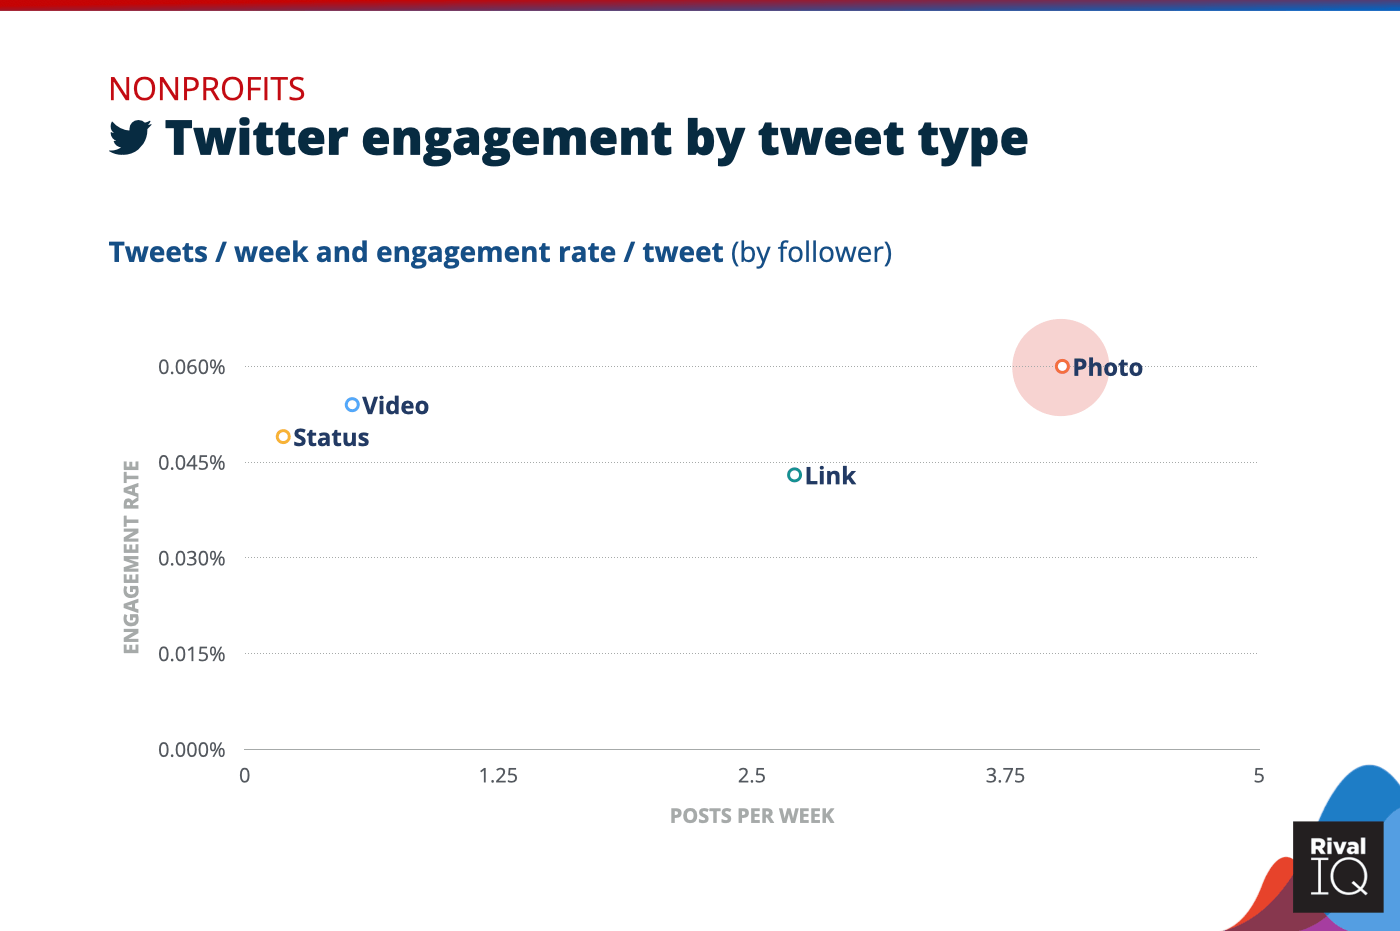
Twitter posts per week and engagement rate by tweet type, Nonprofits
Photos earned top marks for Nonprofits on Twitter this year, but every tweet type scored above average engagement rates on this channel, so don’t be afraid to shake it up.
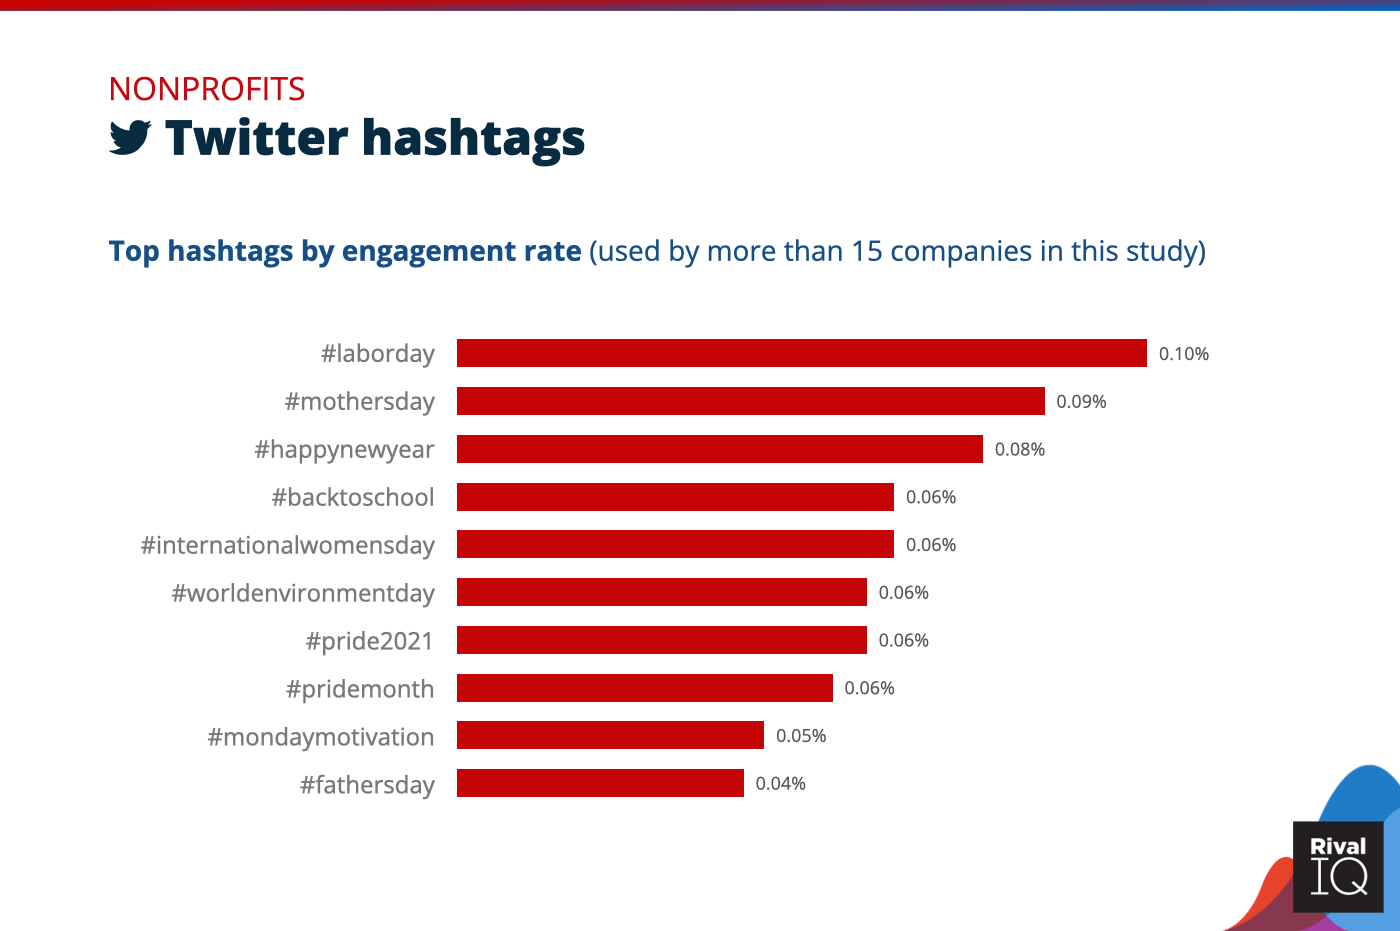
Top Twitter hashtags by engagement rate, Nonprofits
These top hashtags prove Nonprofits weren’t afraid of a holiday-themed tweet on Twitter this year.
Retail Social Media Benchmarks
Retail brands earned about 50% the engagement of the median brand on all three channels this year.
Some ideas for improving social performance this year:
- Experiment with tweet type on Twitter to drive to drive up engagement.
- Stick with what works for hashtags, like contest-themed hashtags on Insta and holidays on Twitter.
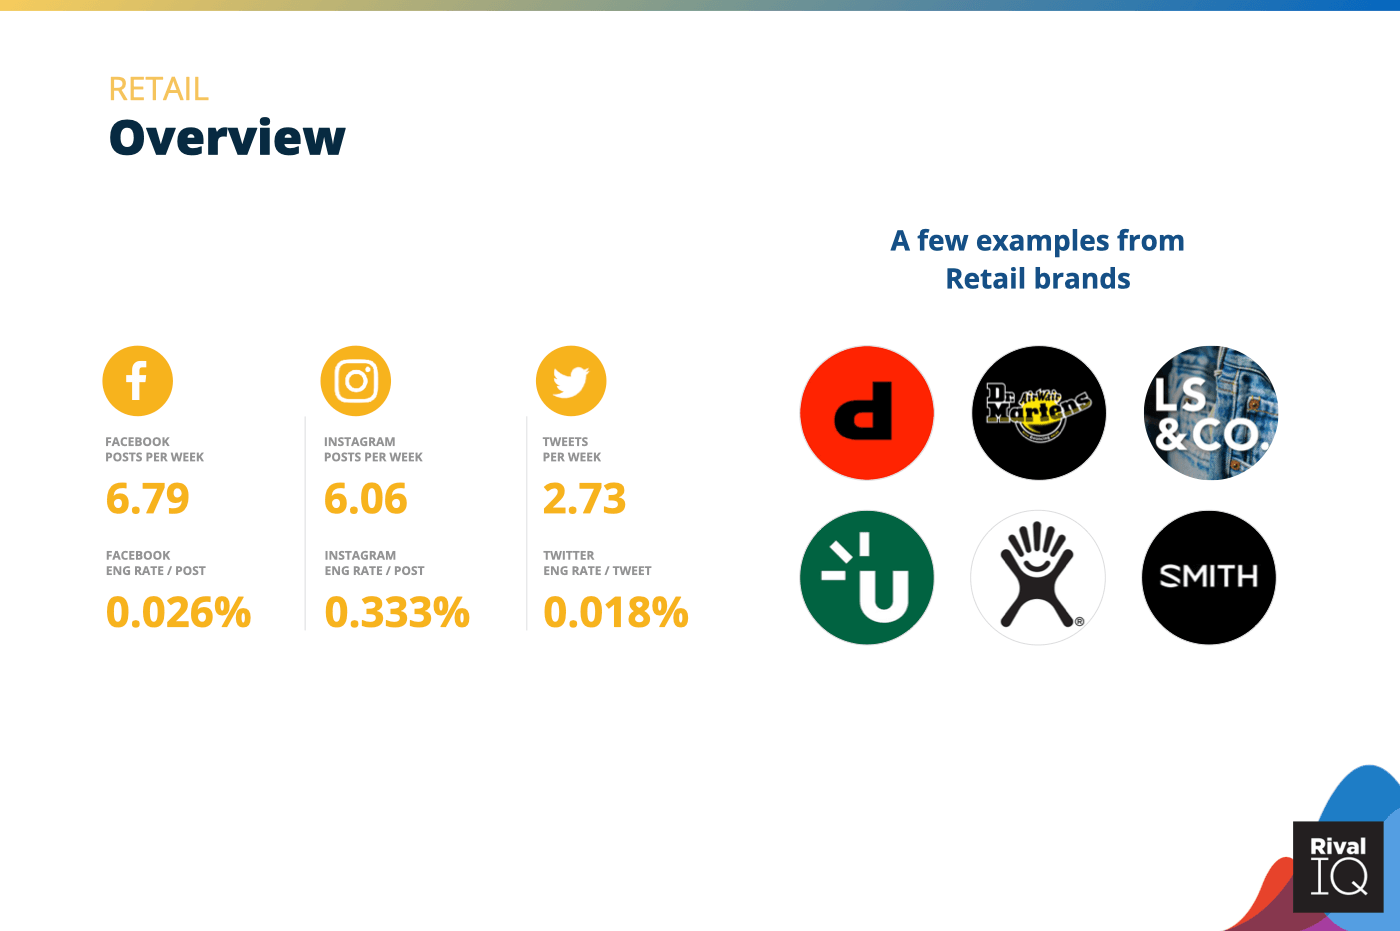
Overview of all benchmarks, Retail
Notable brands in this year’s report include Depop, Levi’s, Hydro Flask, Dr. Martens, Uncommon Goods, and Smith Optics.
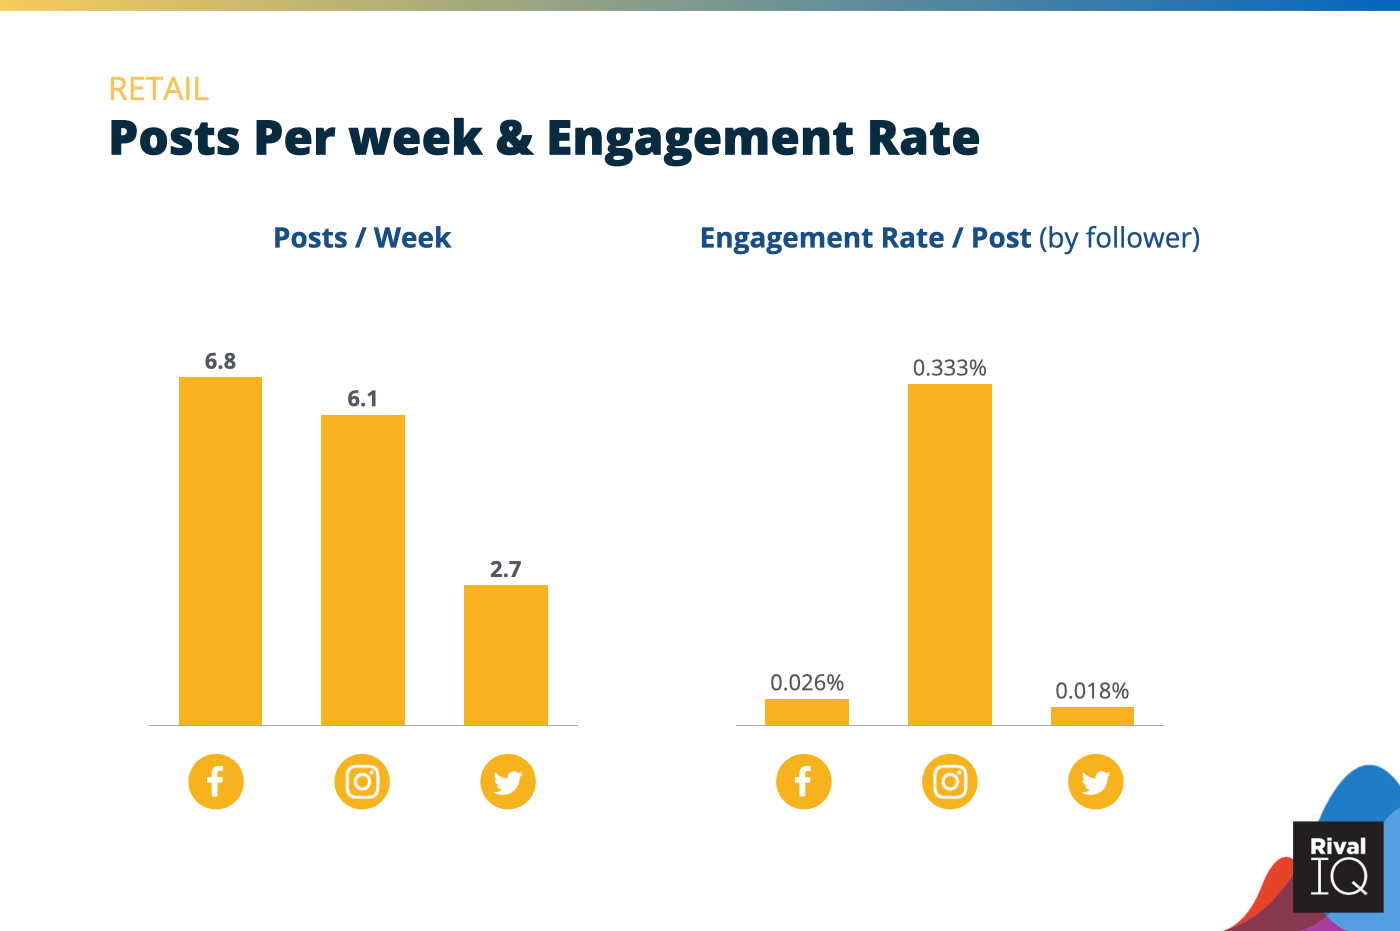
Posts per week and engagement rate per post across all channels, Retail
Retail brands were more than twice as likely to post on Facebook and Instagram as they were on Twitter.
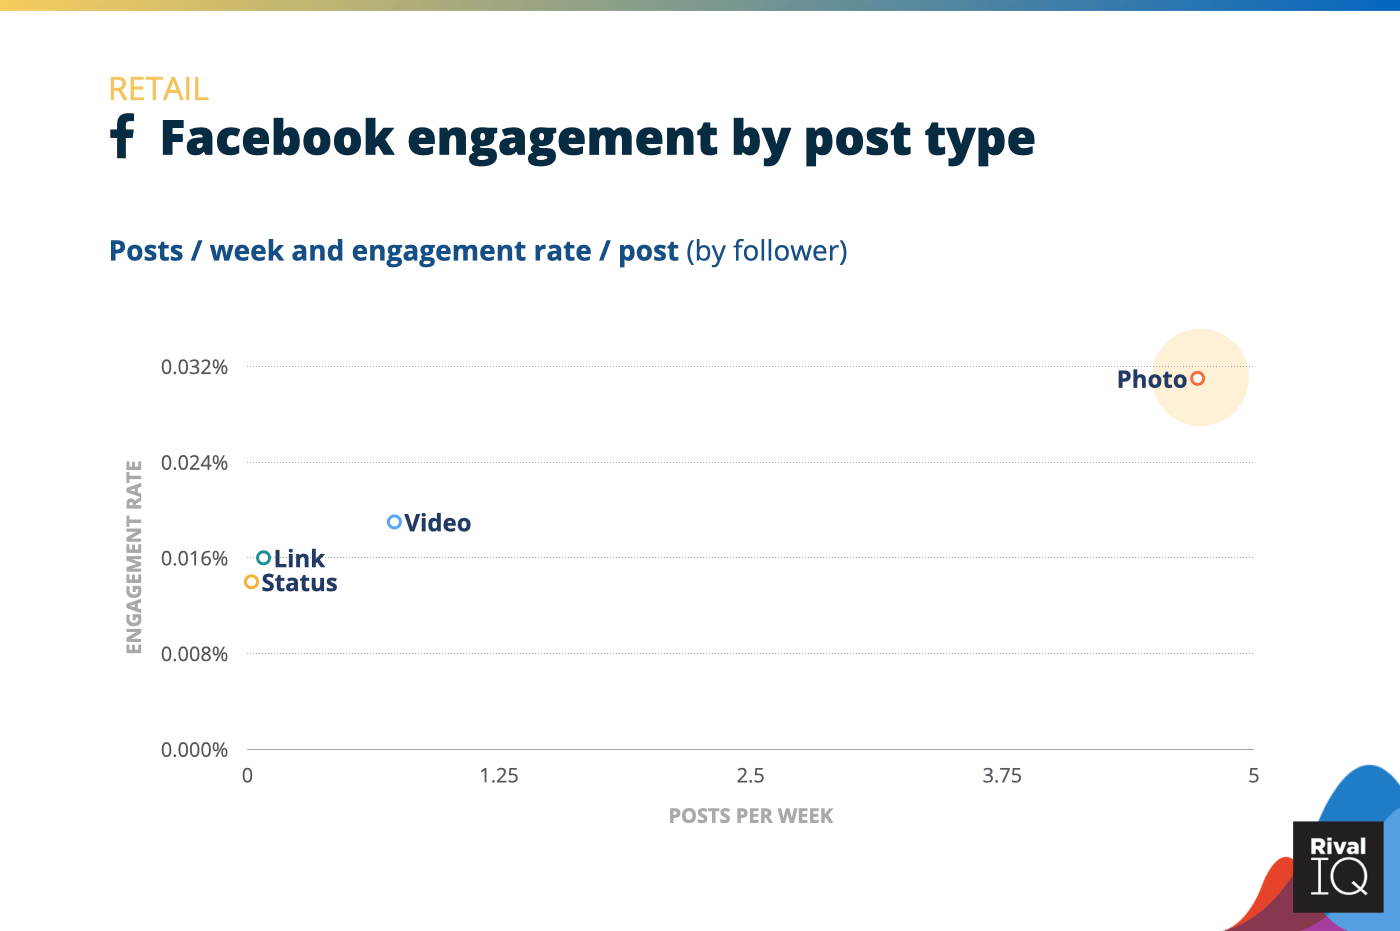
Facebook posts per week and engagement rate by post type, Retail
Photos earned twice the engagement rates of any other post type for Retail brands on Facebook, so this was a smart place to concentrate efforts.
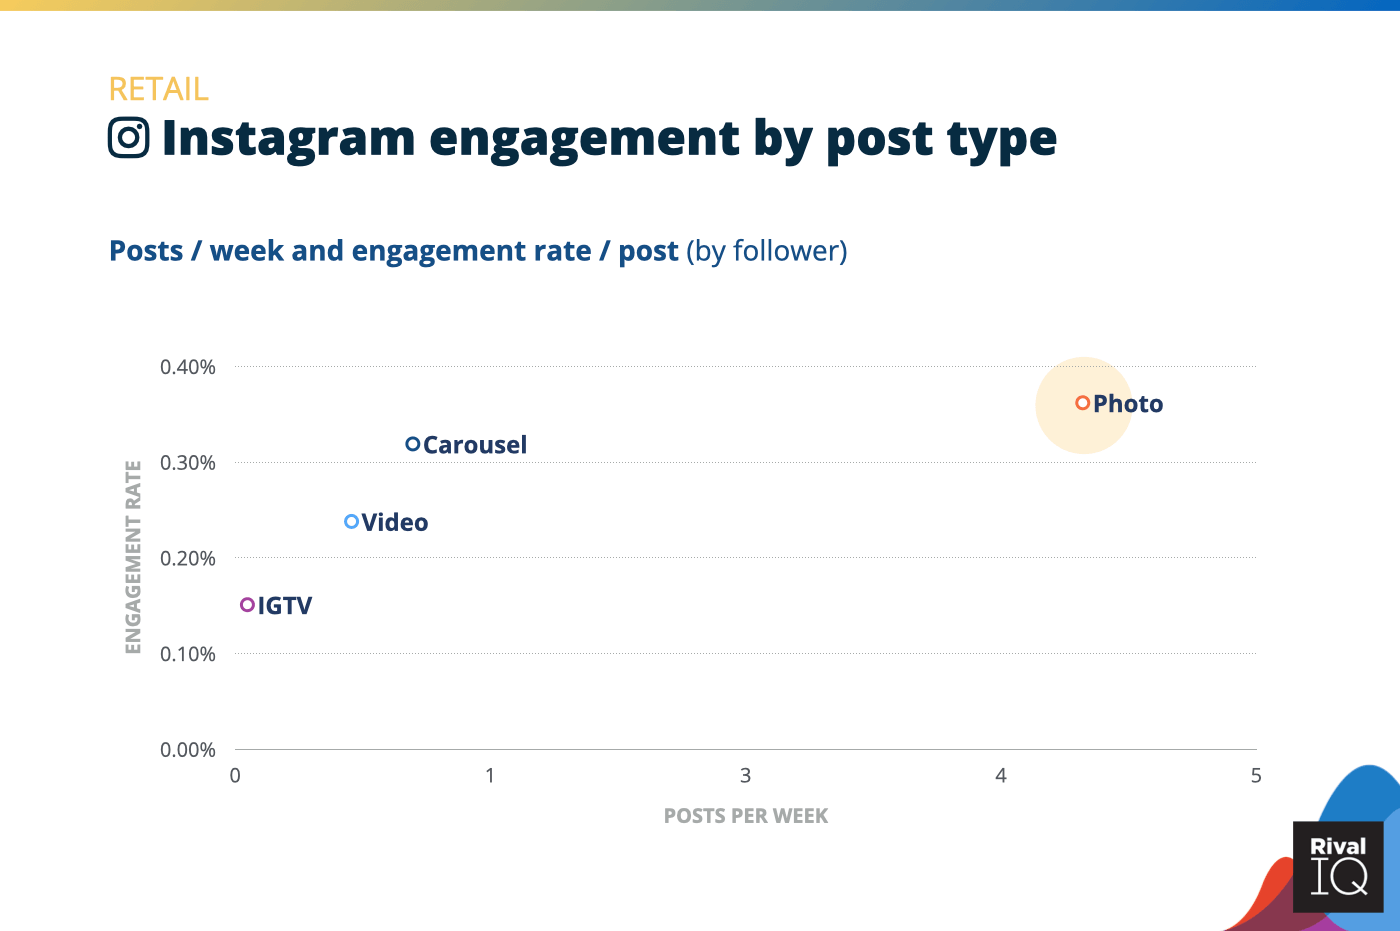
Instagram posts per week and engagement rate by post type, Retail
Photo posts edged out carousels for Retail brands this year on Instagram. Cowboy gear brand Snuggle Bugz grabbed the Retail Instagram engagement rate gold this year with giveaway-themed photo posts.
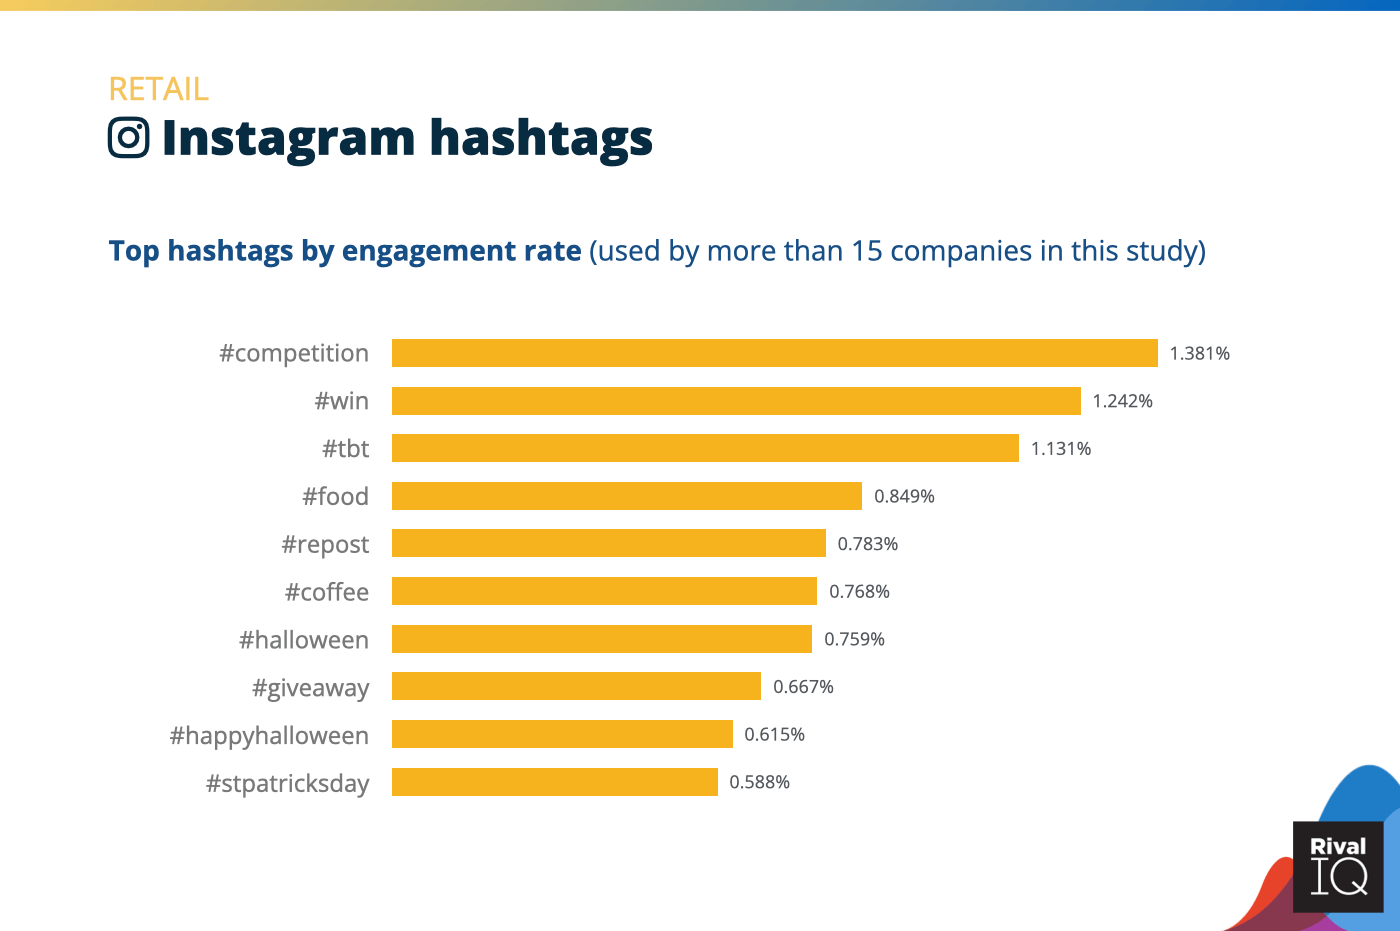
Top Instagram hashtags by engagement rate, Retail
Contest and #giveaway hashtags did great for Retail brands on Instagram, as did #food and #coffee hashtags.
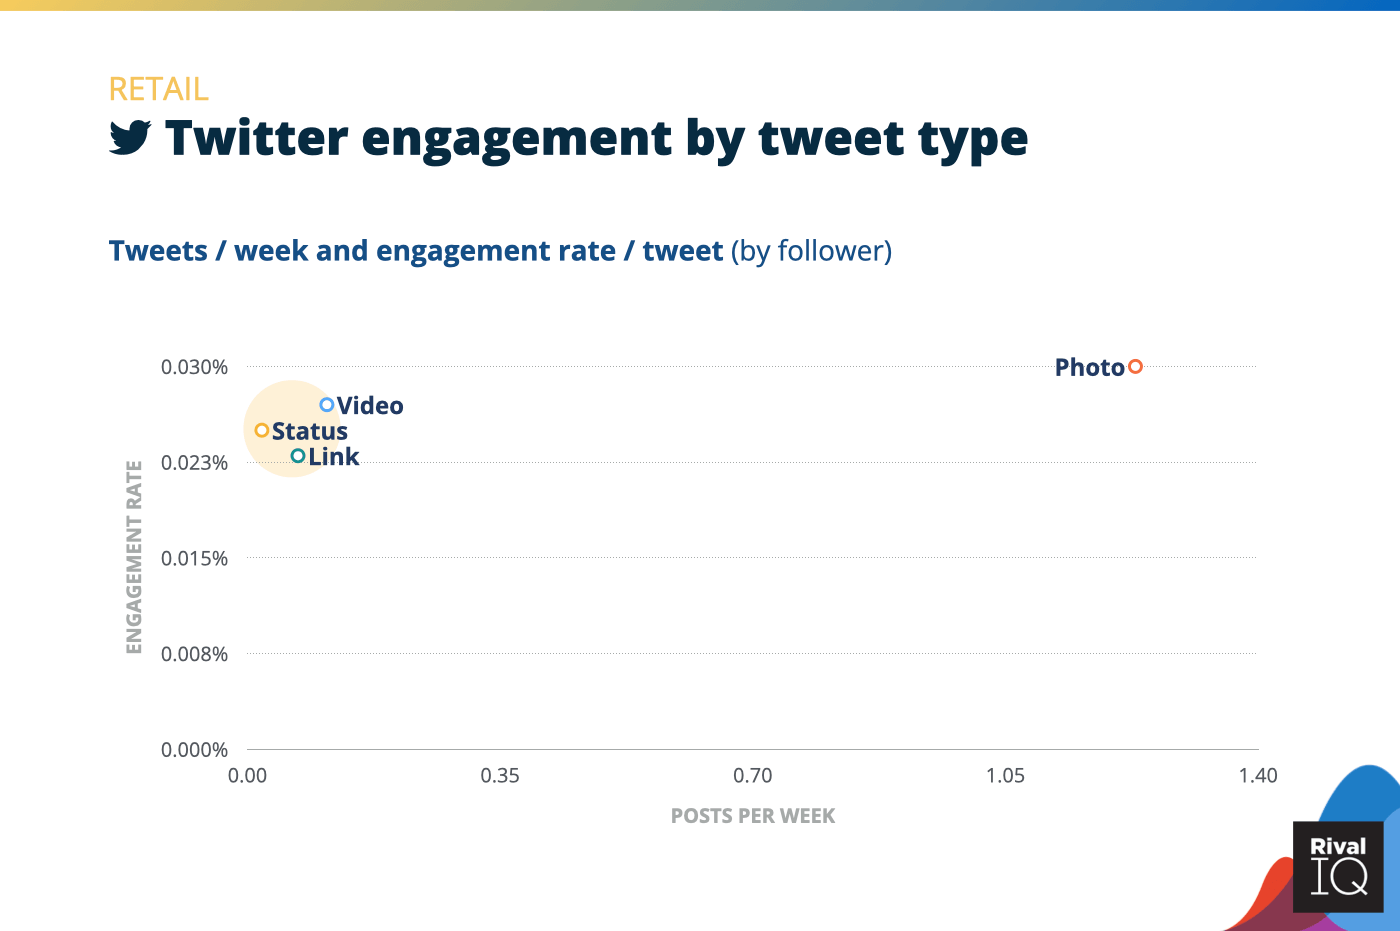
Twitter posts per week and engagement rate by tweet type, Retail
Retail brands saw success with every tweet type this year, so don’t be afraid to shake up those photo tweets.
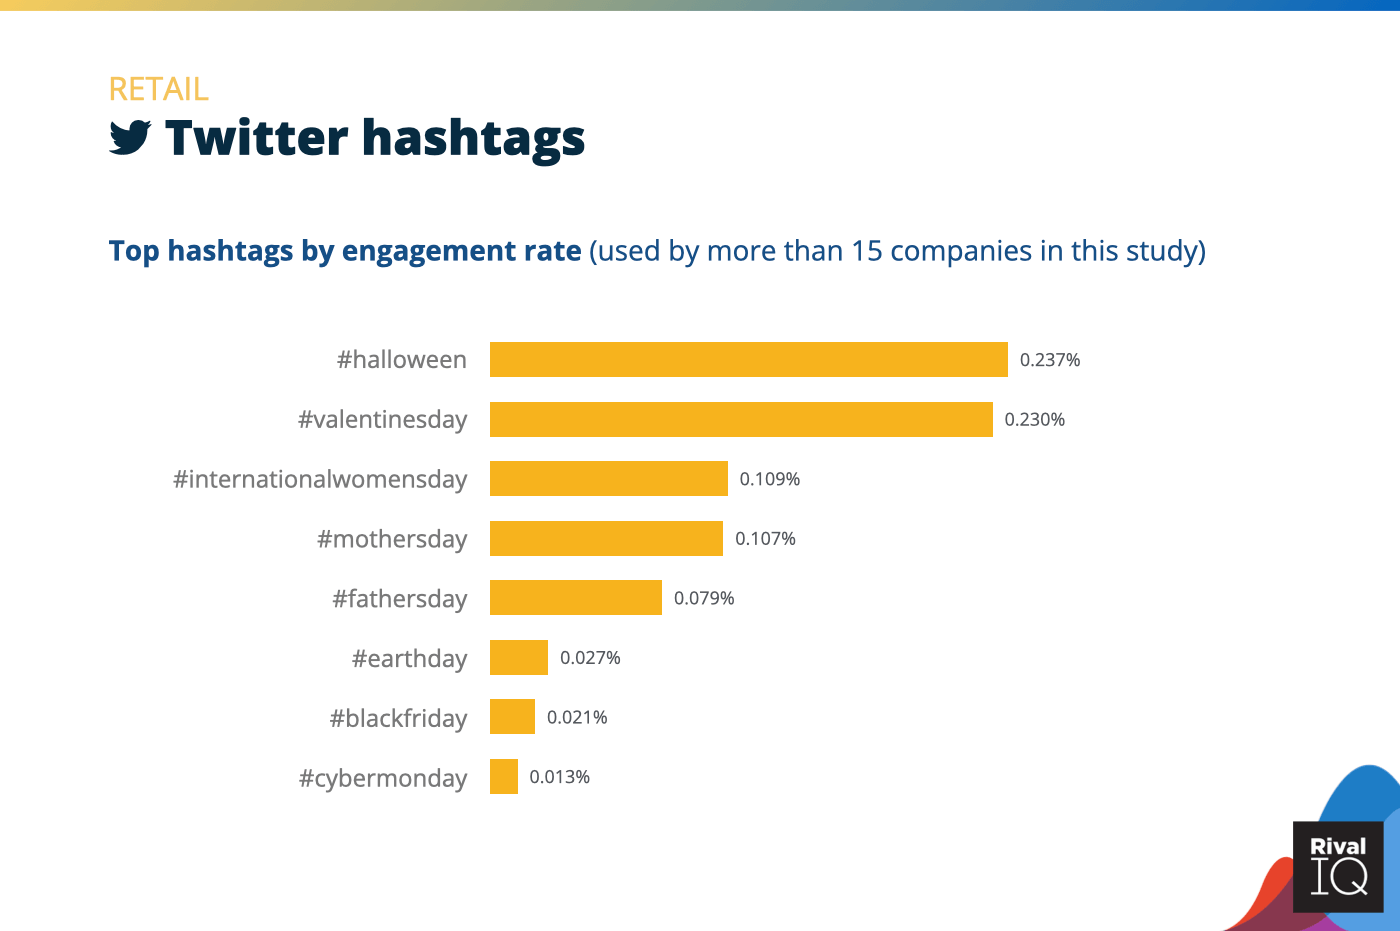
Top Twitter hashtags by engagement rate, Retail
Like so many other industries, Retail was all about the holidays on Twitter this year.
Sports Teams Social Media Benchmarks
Sports Teams saw top engagement rates on Facebook and Twitter and were runners-up on Instagram. Pretty impressive, especially since high posting frequency meant lots of chances to engage followers.
Some ways to improve engagement rates even more:
- Posting early and often is working, so keep it up.
- Hashtags about sports events like #Euro2020 and #Tokyo2020 helped fans find what they were looking for.
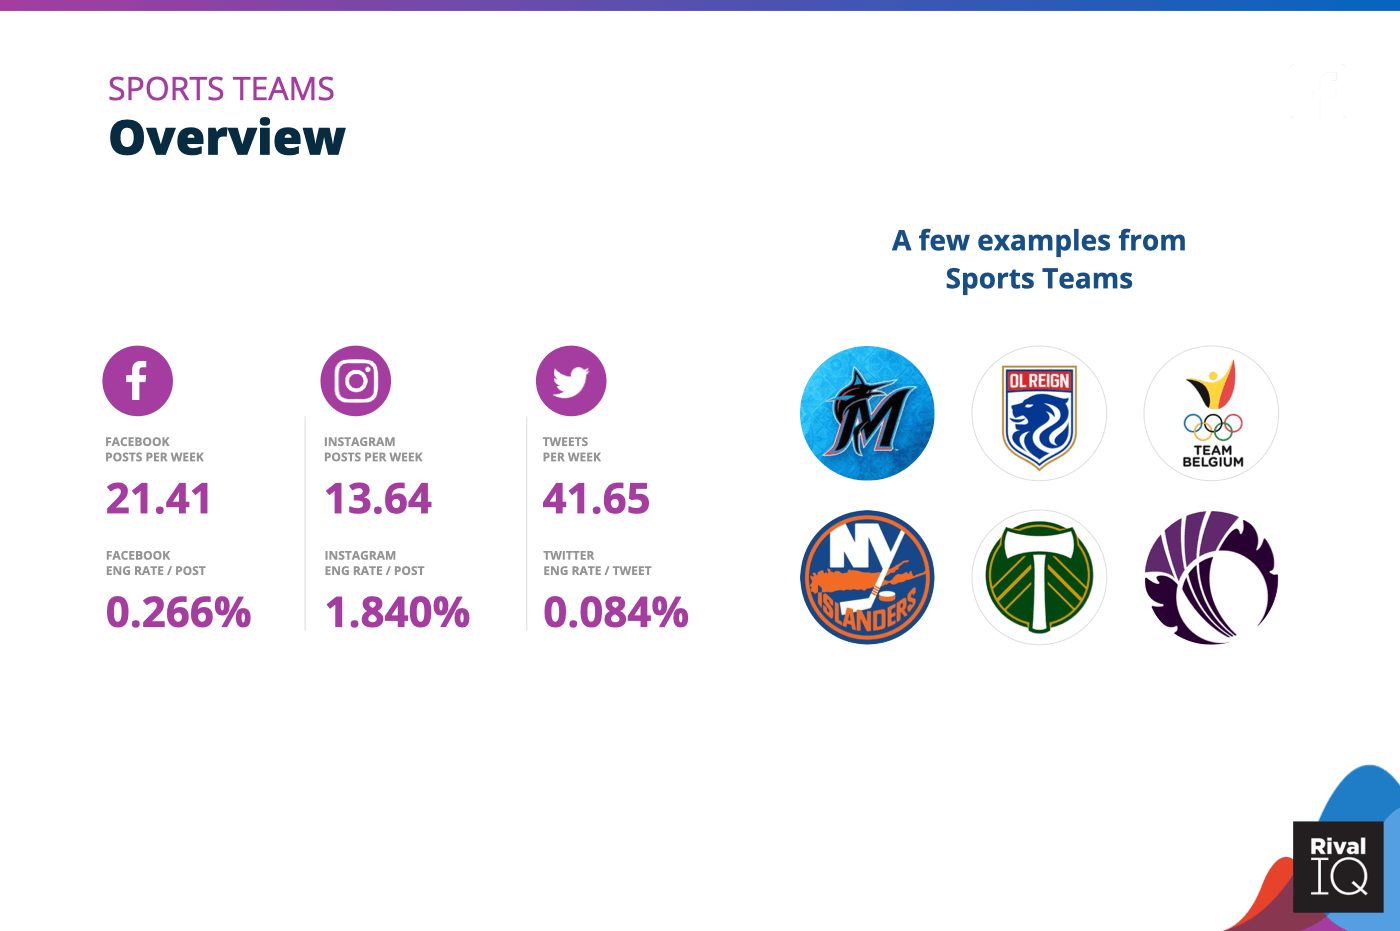
Overview of all benchmarks, Sports Teams
Notable brands in this year’s report include Miami Marlins, Team Belgium, Portland Timbers, OL Reign, New York Islanders, and Cricket Scotland.
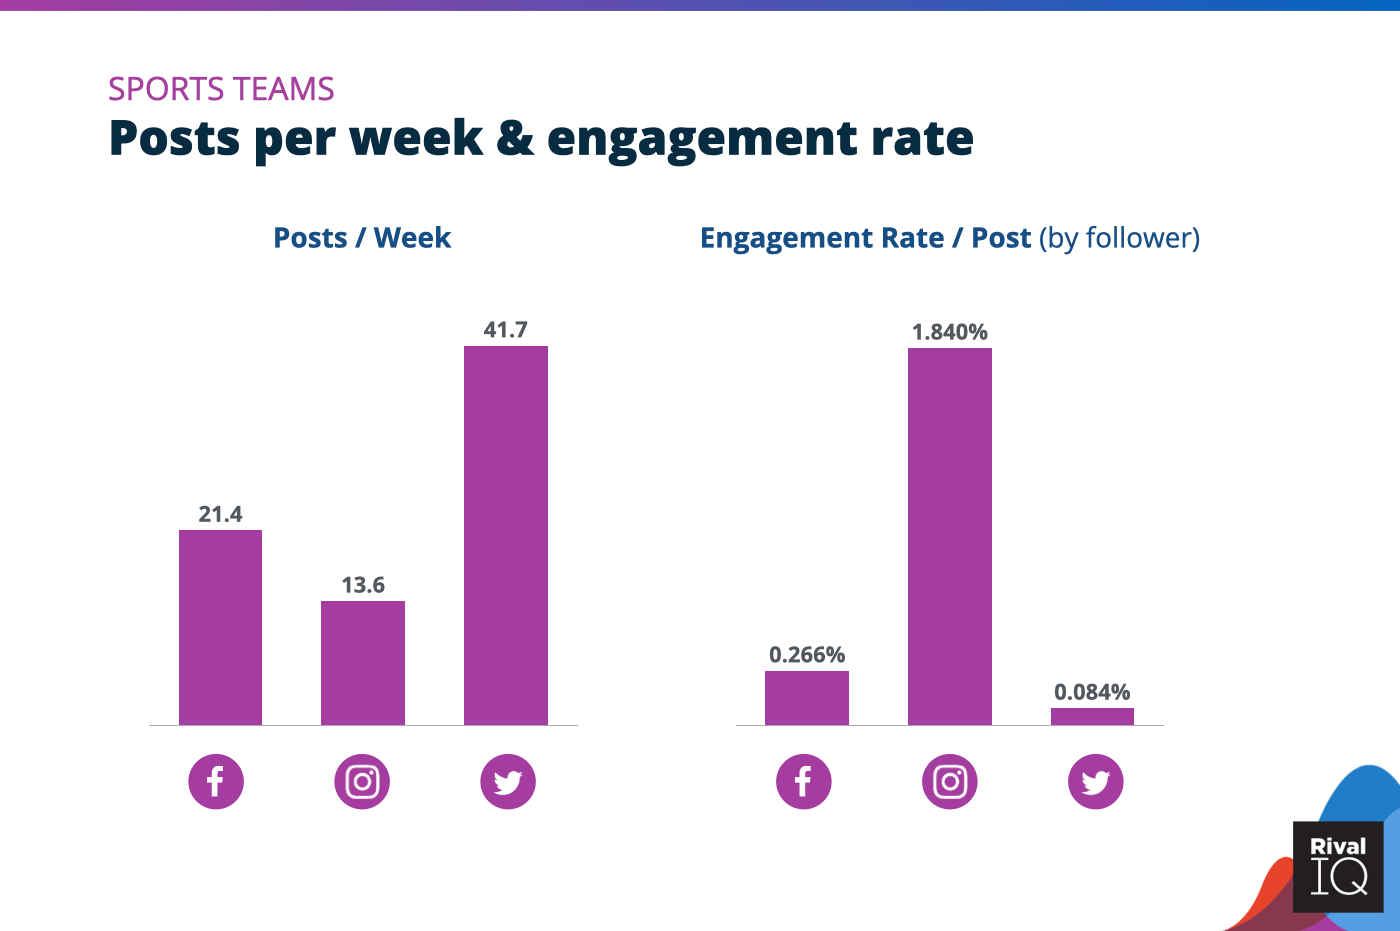
Posts per week and engagement rate per post across all channels, Sports Teams
Sports Teams were the only industry to pull off engagement rate increases on all three channels. Why? We bet it has something to do with 2021 having more games than 2020…

Facebook posts per week and engagement rate by post type, Sports Teams
Photo posts on Facebook helped Sports Teams earn more than 2x the median engagement rate on this channel, putting these brands comfortably in first place.
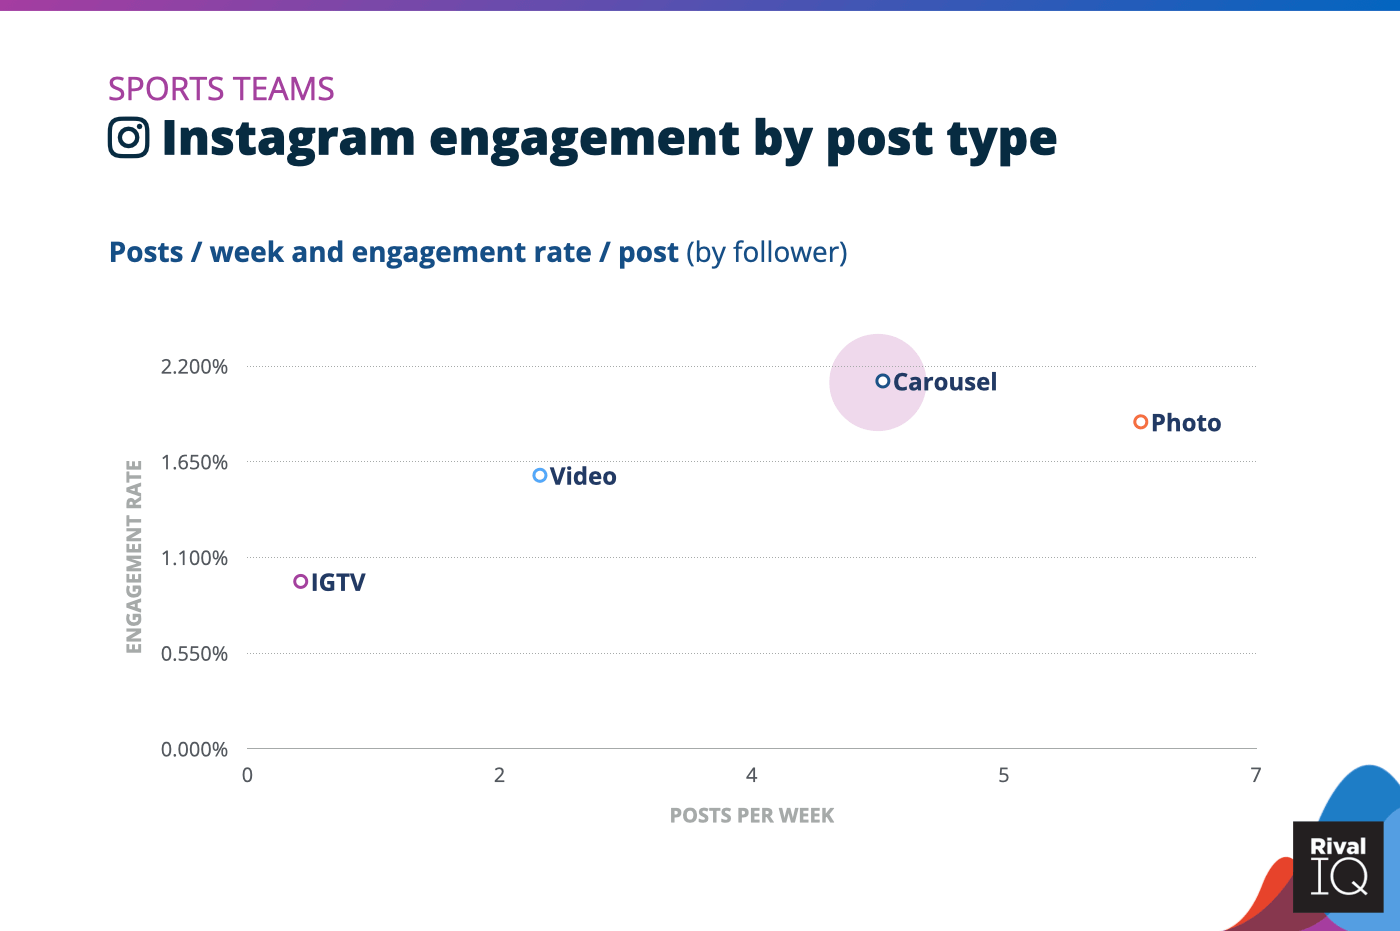
Instagram posts per week and engagement rate by post type, Sports Teams
Sports Teams like top-ranking Belgian Olympic team maximized engagement with photos and carousels promoting the successes of its athletes in the 2021 Tokyo Olympics.
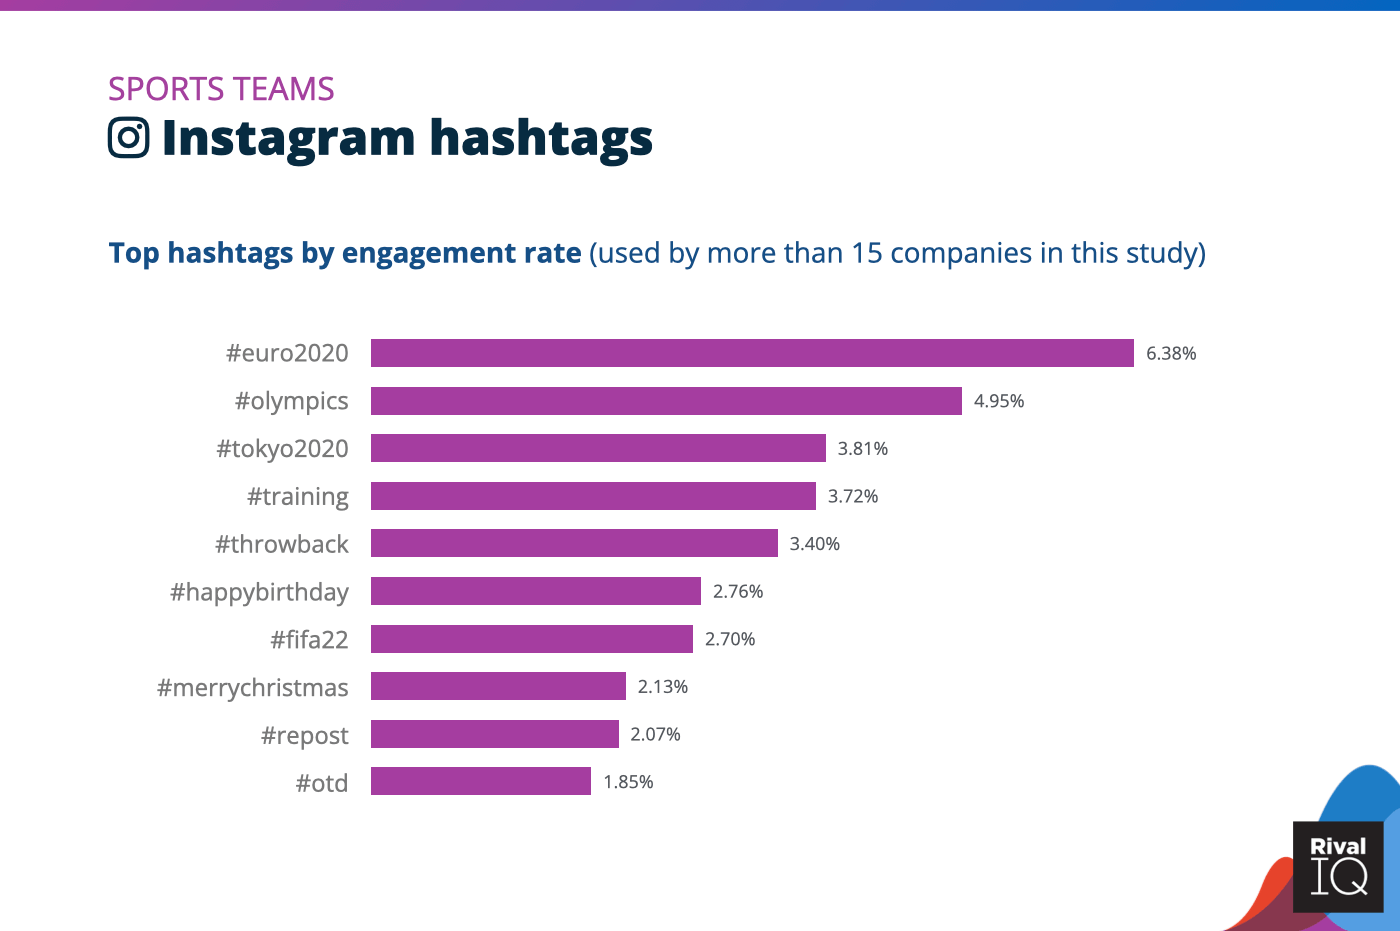
Top Instagram hashtags by engagement rate, Sports Teams
No surprise that Sports Teams saw high engagement on Instagram with hashtags helping fans follow the world tournament du jour, from Eurovision to Tokyo 2020 to FIFA.
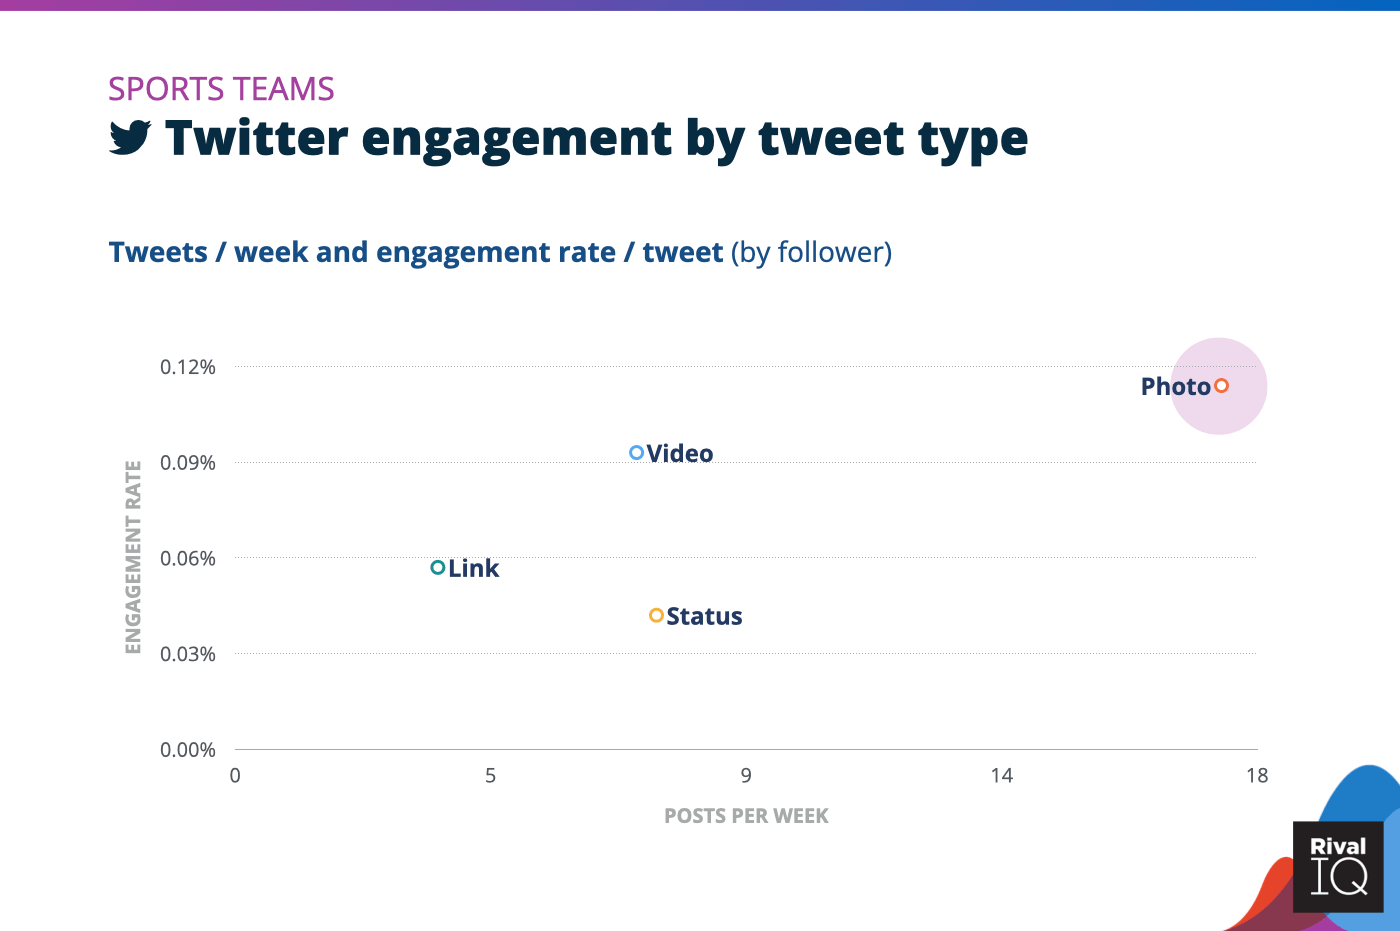
Twitter posts per week and engagement rate by tweet type, Sports Teams
Avid sports fans ate up photo tweets from Sports Teams this year.
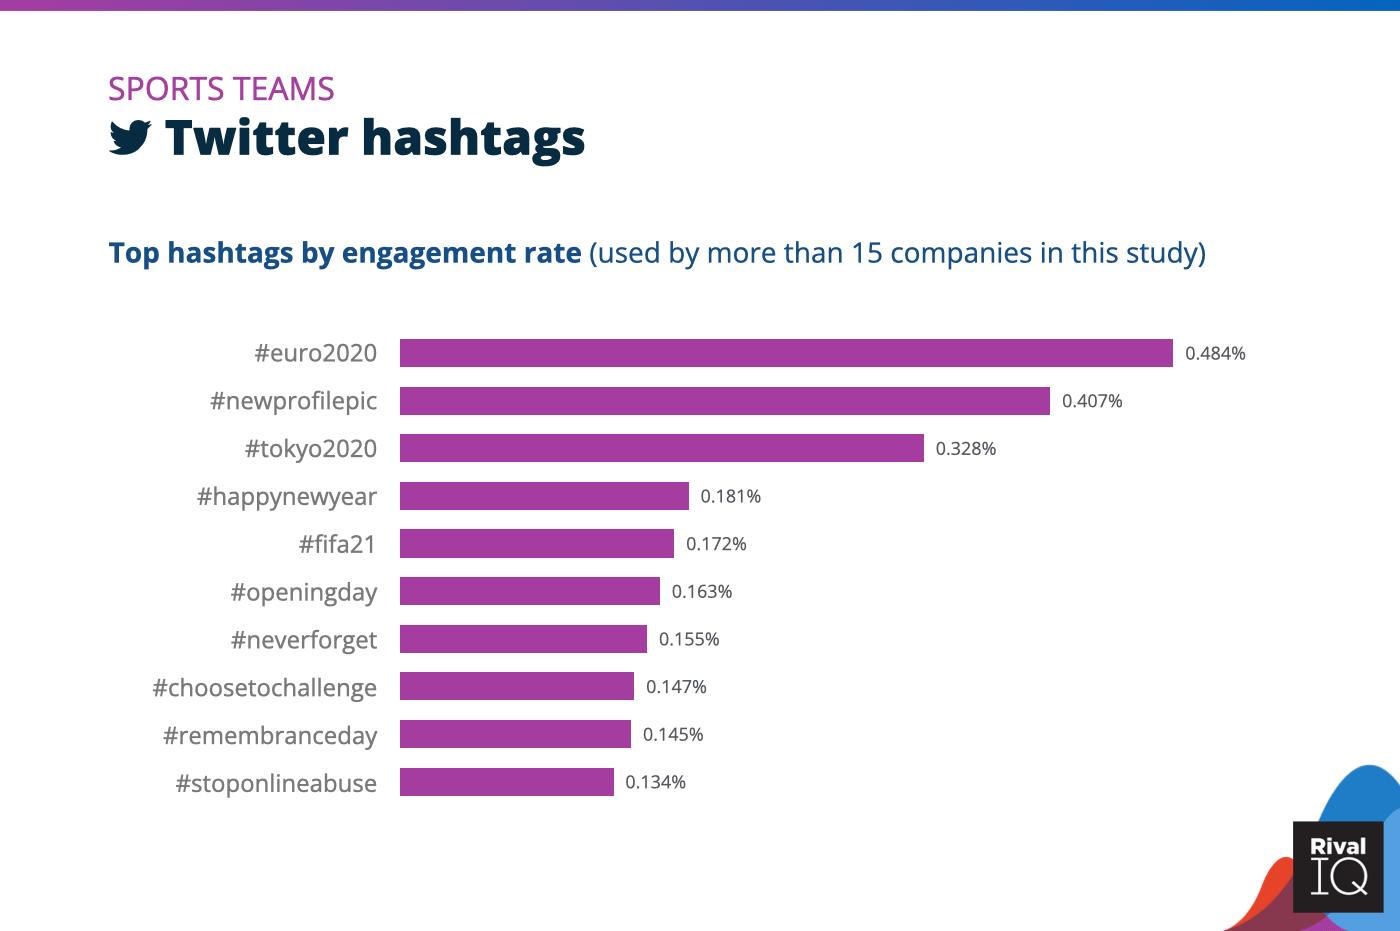
Top Twitter hashtags by engagement rate, Sports Teams
Event-themed hashtags like #Euro2020 and #Tokyo2020 helped Sports Teams succeed on Twitter, and fans also loved when teams moved to a #NewProfilePic.
Tech & Software Social Media Benchmarks
Tech & Software brands saw engagement rates right around the median this year on Instagram and Twitter but tied for last on Facebook.
Here are two ideas for improving engagement rates:
- Try experimenting with more video on Twitter to boost engagement.
- Followers on both Instagram and Twitter loved seeing a little #StarWars in their feeds, so don’t be afraid to get nerdy.
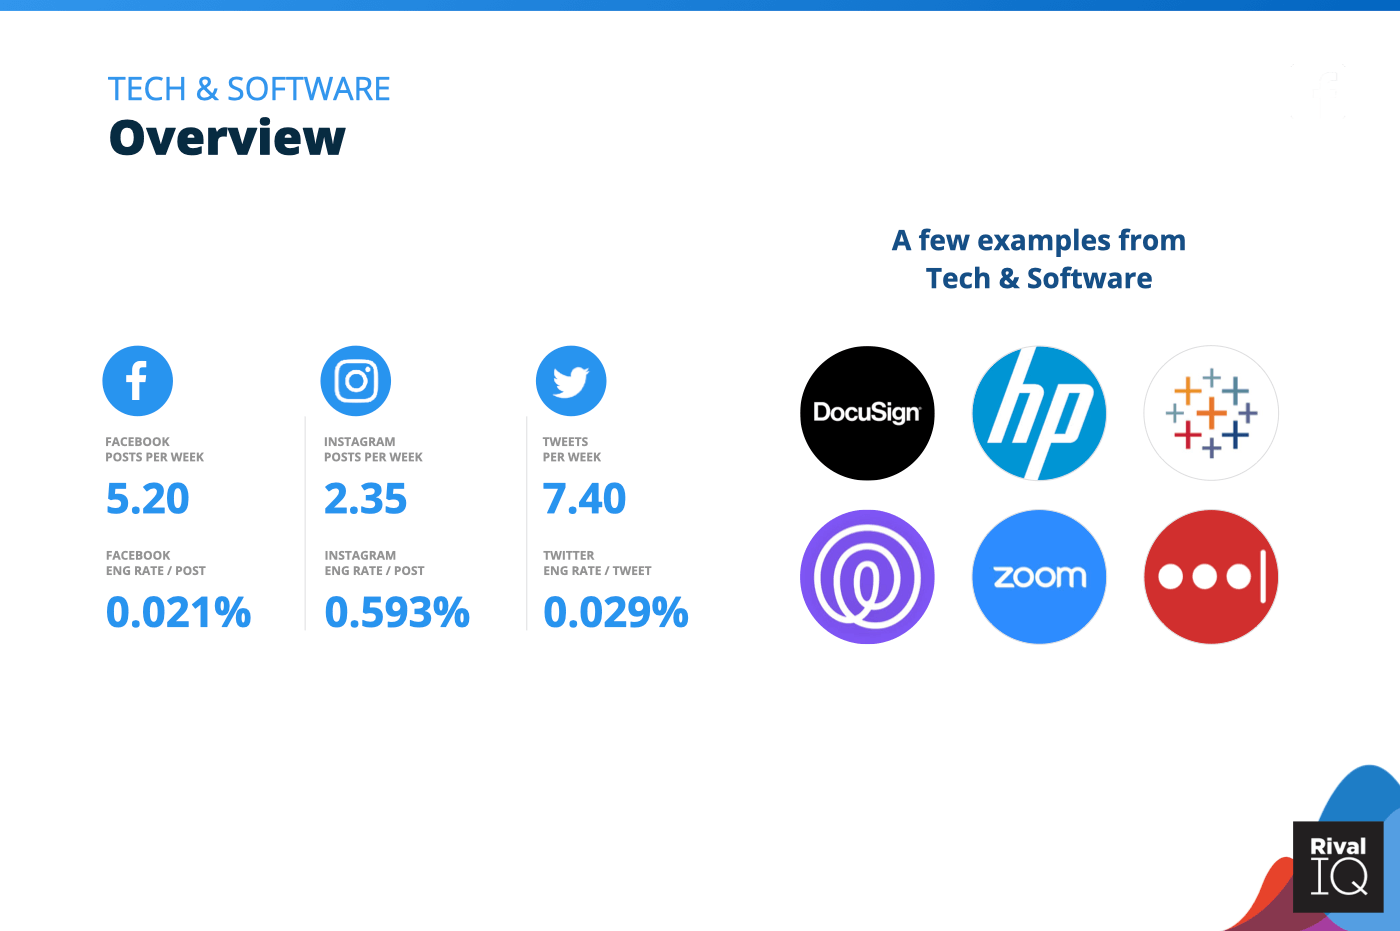
Overview of all benchmarks, Tech & Software
Notable brands in this year’s report include Docusign, Tableau, Zoom, Hewlett-Packard, Life360, and Lastpass.
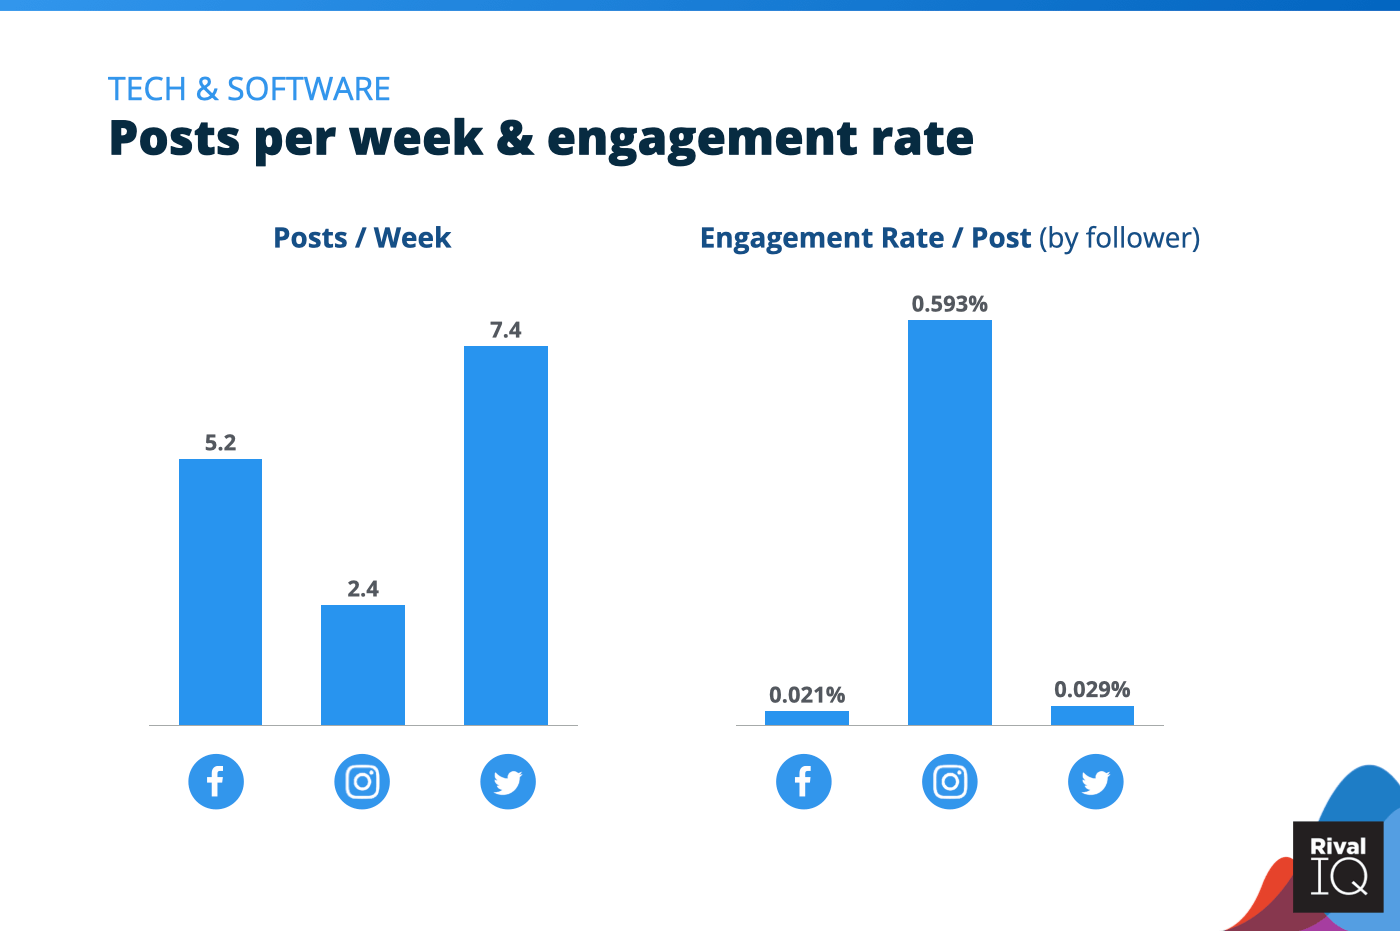
Posts per week and engagement rate per post across all channels, Tech & Software
Tech & Software brands saw flat engagement on Facebook and Twitter but dropped by about 50% on Instagram, suggesting more investment is needed on this channel.
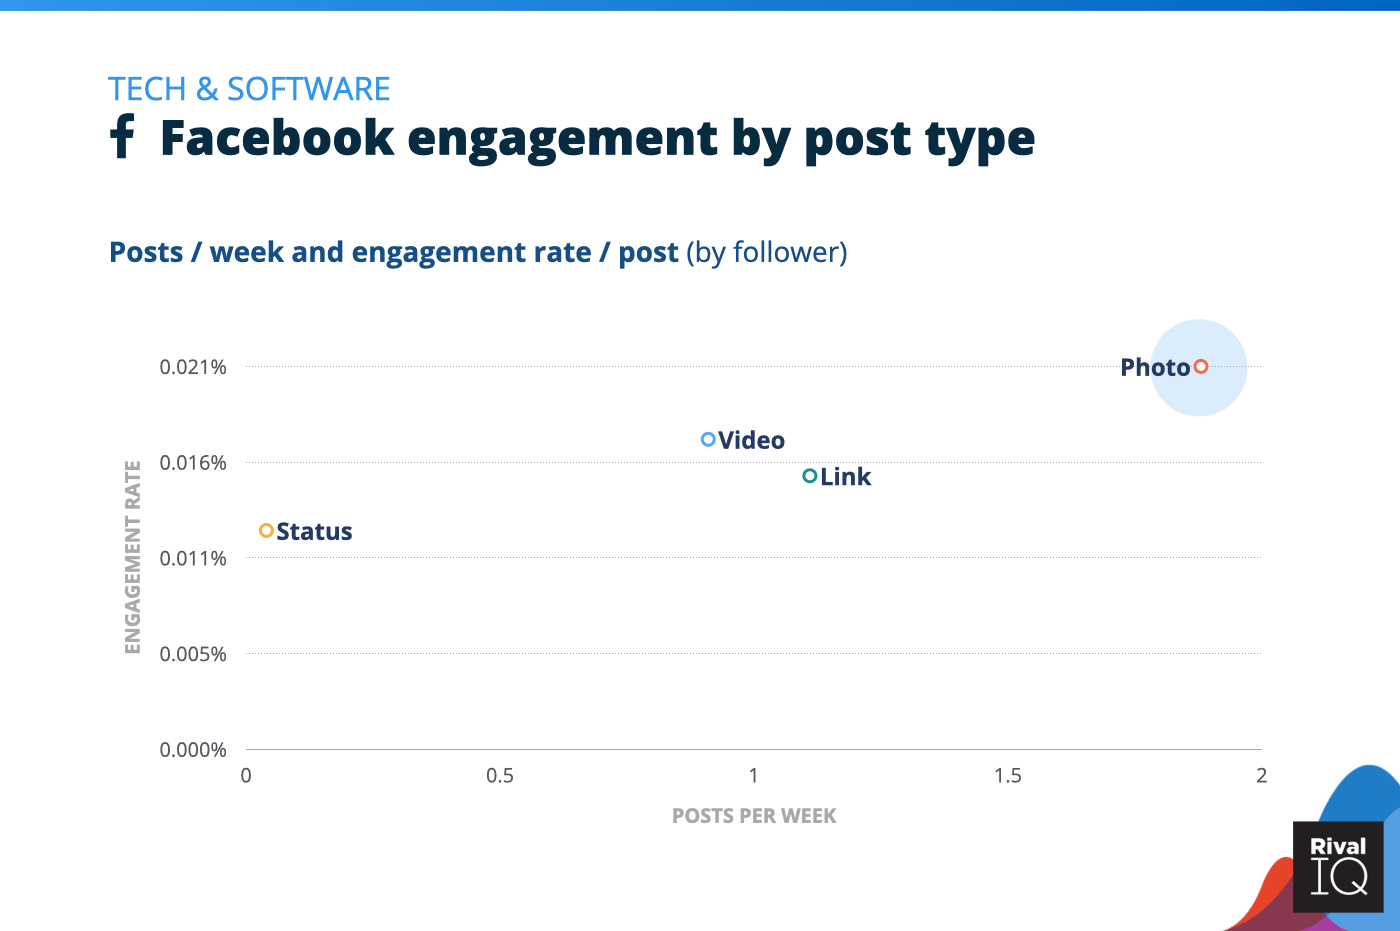
Facebook posts per week and engagement rate by post type, Tech & Software
Photos grabbed great engagement on Facebook for Tech & Software companies, but automation company UiPath dominated Facebook engagement rates with links (and a healthy dose of boosting).
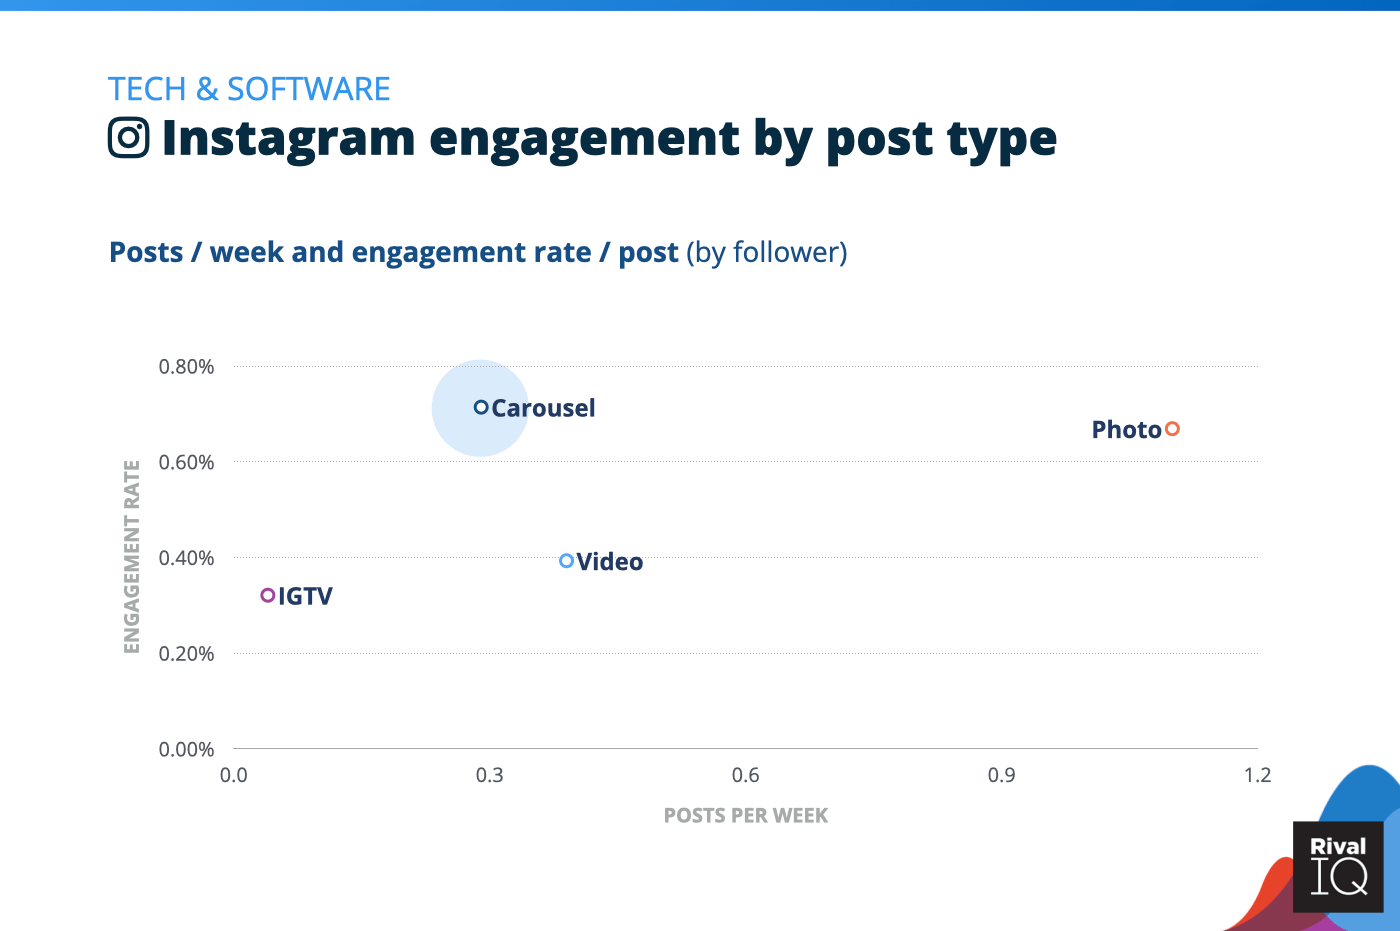
Instagram posts per week and engagement rate by post type, Tech & Software
Tech & Software companies increased their carousel posting on Instagram this year, which was a smart move for this top-performing post type.
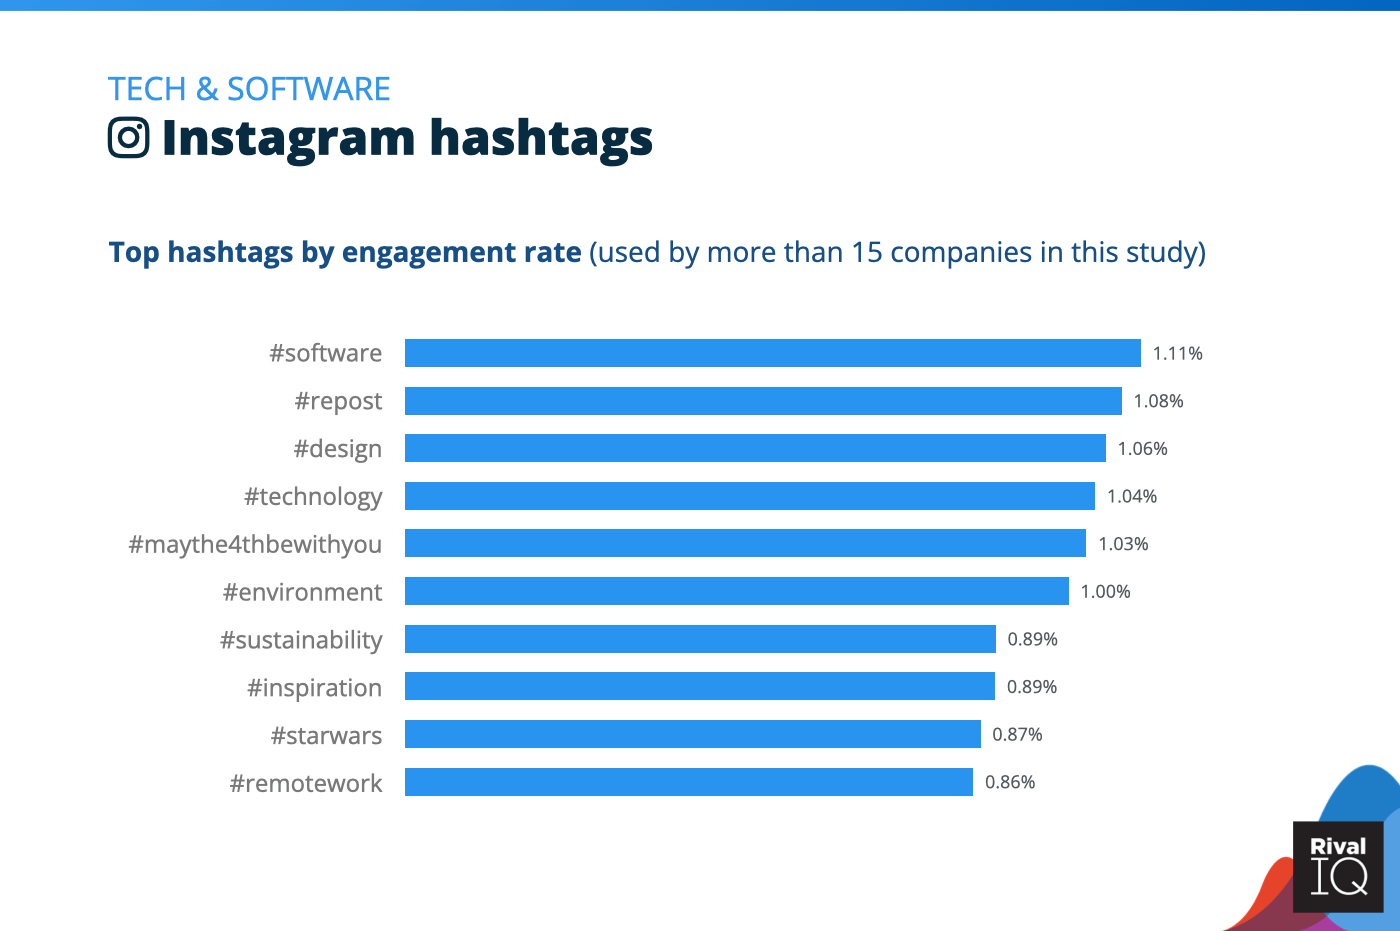
Top Instagram hashtags by engagement rate, Tech & Software
The nerd vibes were strong on Instagram for Tech & Software brands with hashtags like #MayThe4thBeWithYou and #StarWars.
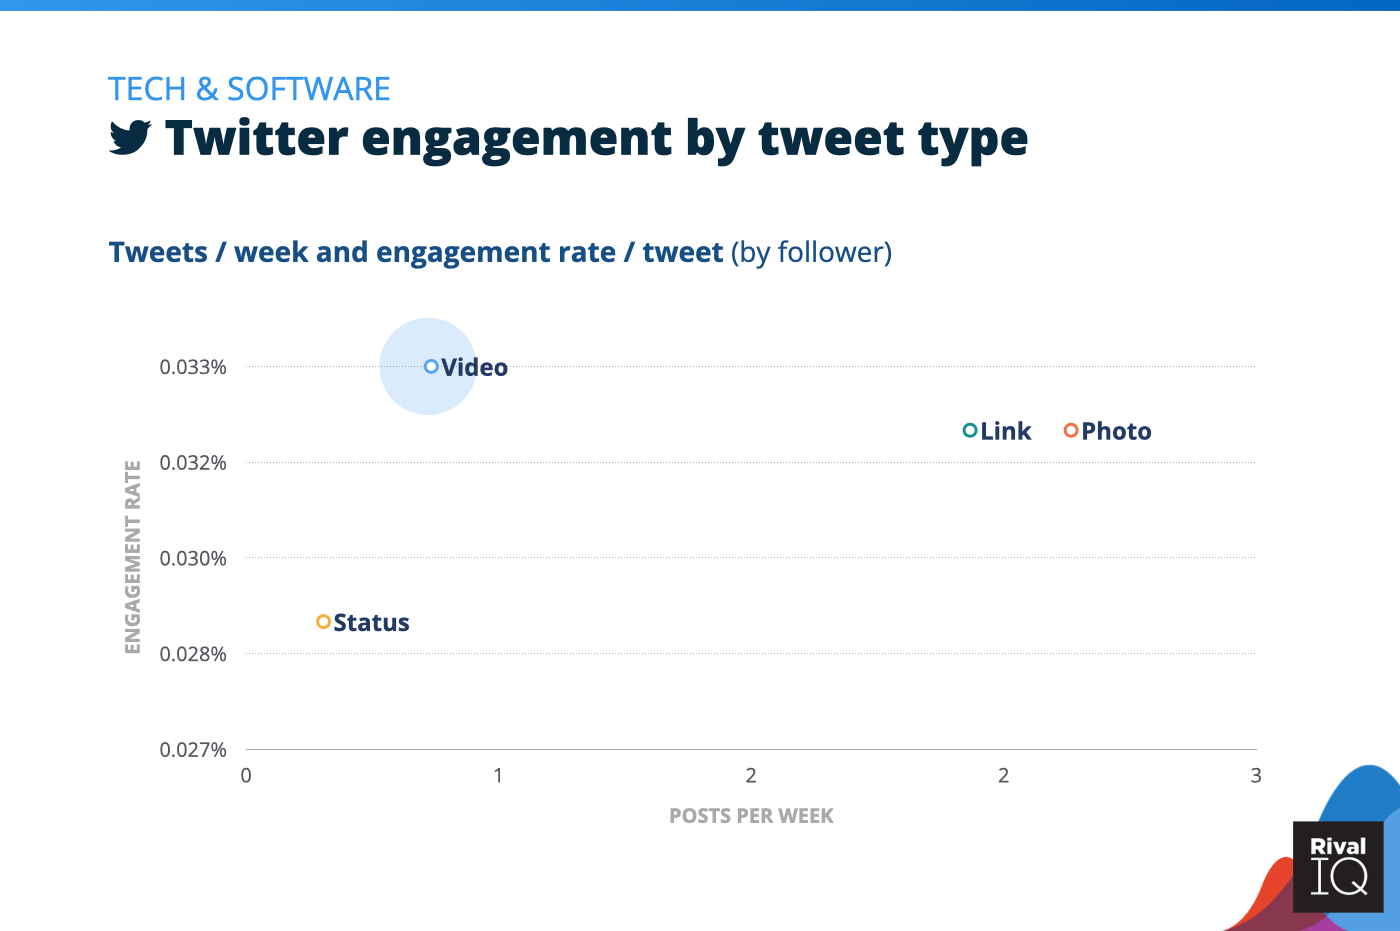
Twitter posts per week and engagement rate by tweet type, Tech & Software
Video earned top engagement rates for Tech & Software brands on Twitter, who were much more likely to tweet a link or a photo.
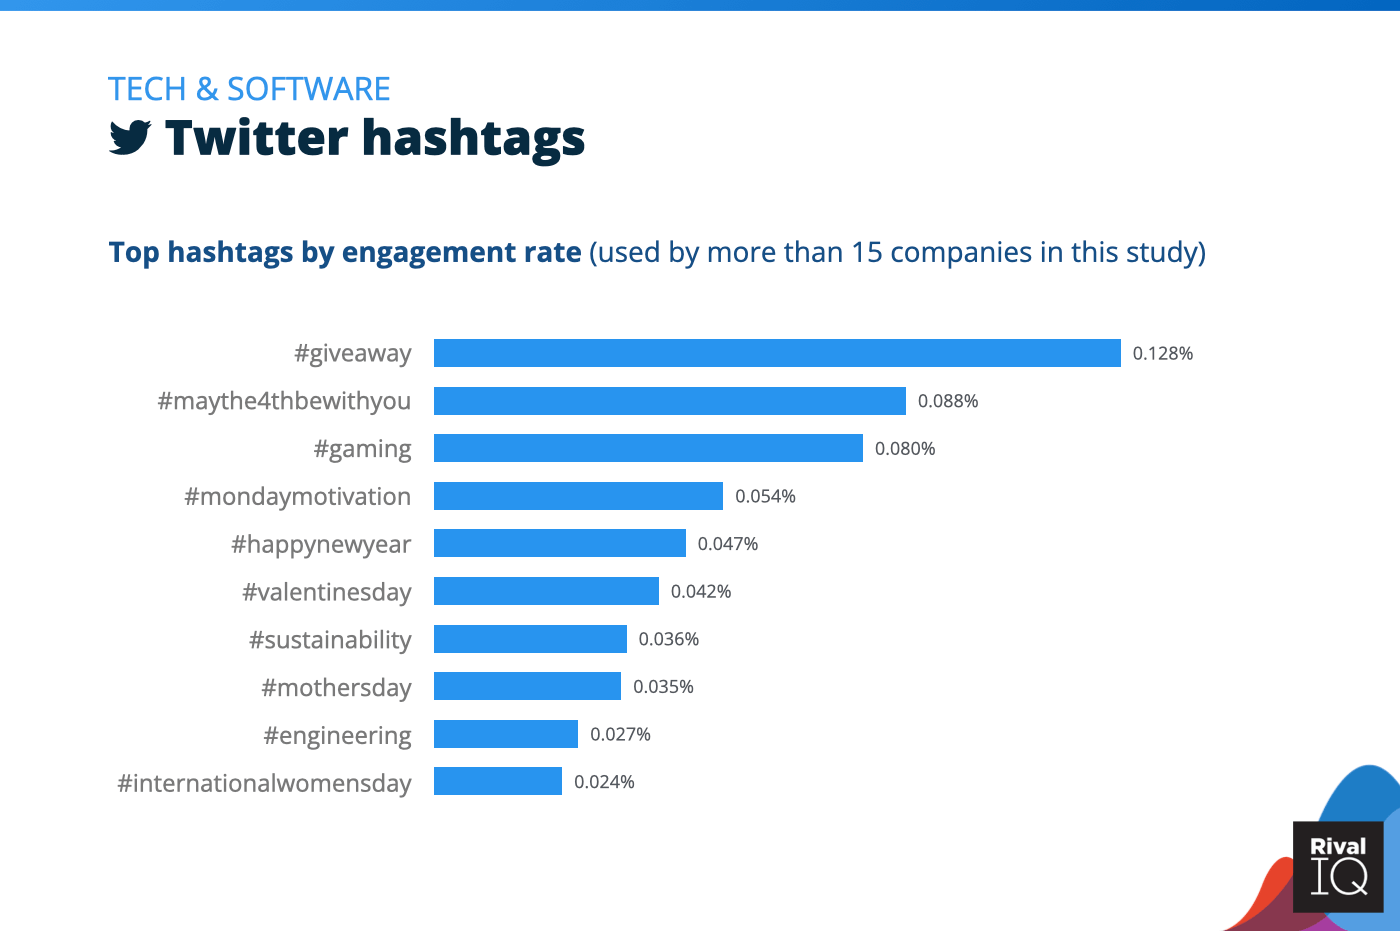
Top Twitter hashtags by engagement rate, Tech & Software
Giveaways topped the hashtag charts for Tech & Software brands on Twitter this year despite not breaking into the top 10 for the same brands on Instagram.
Methodology
To spot trends and identify benchmarks, we used Rival IQ to analyze engagement rates, posting frequency, post types, and hashtags on the top three social channels for brands: Facebook, Instagram, and Twitter.
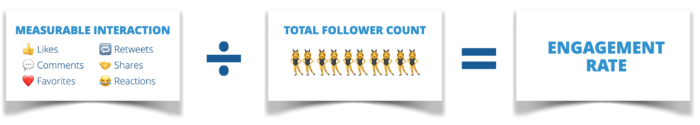
We define engagement as measurable interaction on organic and paid social media posts, including likes, comments, favorites, retweets, shares, and reactions. Engagement rate is calculated based on all these interactions divided by total follower count.
Within this report, we provide a representative sample of national and international companies in each industry by selecting 150 companies at random from each industry in our database of over 200,000 companies. Companies selected had active presences on Facebook, Instagram, and Twitter as of January 2021, and had Facebook fan counts between 25,000 and 1,000,000 and minimum Instagram and Twitter followers of 5,000 as of the same date.

We used median performance from the companies selected for each industry to compile the data for this report.

Why do we benchmark?
Social media success is about so much more than getting the most comments or likes: it’s about increasing engagement while also growing or maintaining the percentage of your audience that engages as you expand your audience.
To us, engagement rate per post is the metric because it controls for post volume and audience size and helps marketers understand how they’re doing in relation to their competitors.
Why can’t you gauge success on likes alone? Because audience size is hugely important: 1,000 likes makes a huge difference to a brand with 2,000 followers, but is a drop in the bucket to a brand with 100,000 followers.
Live Social Media Benchmarks
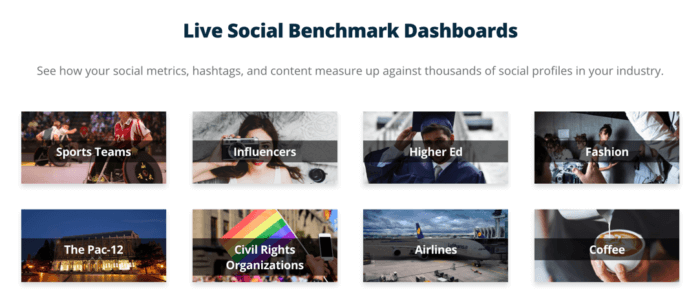
Ready to start benchmarking your social media performance? Check out our Live Benchmark landscapes, where we feature live social media metrics from a sample of companies from each industry represented in this study. These landscapes feature hashtag performance, top post types, and so much more on Facebook, Instagram, and Twitter.
(Oh, and if you’re a Rival IQ customer or in a trial, you can add those stats directly into your Rival IQ account for even more comparisons.)
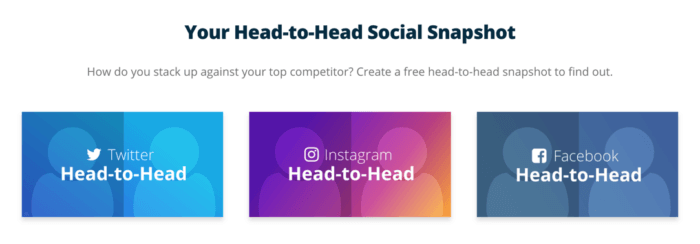
Or, run a free Head-to-Head report against your biggest rival to see how you measure up to both your competition and against industry benchmarks represented in this study.
Wrapping It Up
2021 presented a number of challenges for marketers (and everyone else) as the world tried desperately to “get back to normal” in spite of COVID variants and global unrest, but many industries were up to the challenge.
The engagement declines we saw reflect divided attention and a move to video-based channels like YouTube and TikTok, but the news isn’t all bad. Industries like Sports Teams and Higher Ed were able to increase their engagement rates thanks to stellar content and diehard fanbases. And the fact that nearly every industry saw engagement boosts with hashtag holidays and contests means many brands have developed a tried and true recipe for social media engagement (at least for now).
Savvy and creative brands don’t (necessarily) need to depend on epic investments or expensive video production to get ahead in 2022. We say it every year, but carousels consistently top the charts on Instagram, so brands should consider saving up a few photo posts and turning them into carousels. Many industries are posting videos less frequently than other post types, suggesting they haven’t fully embraced our new videoverlords YouTube and TikTok. That pivot is coming whether we like it or not, so it’s time for brands to pull out their iPhones and get filming.
As always, we’d love to hear how your brand measures up and is preparing for social media in 2022, so feel free to ping us on Twitter.