In this episode of the Data-Driven Marketer, we took a deep dive into the 2023 Social Media Industry Benchmark Report with Rival IQ Co-founder and Head of Product Seth Bridges.
During his talk, Seth interprets the industry benchmark report, going step-by-step through his favorite takeaways and connecting insights and data from other Rival IQ research, including the 2023 Instagram Stories Benchmark Report.
Watch the full episode below as Seth walks you through eleven more takeaways from the report and answers live questions from the audience.
Watch the full video for the top takeaways
Key takeaway 1: Low engagement rates, except on TikTok
Much of the chatter on social media following the publication of the 2023 Benchmark Report was about the low absolute value of the engagement rates on Instagram, Facebook, and Twitter relative to TikTok.
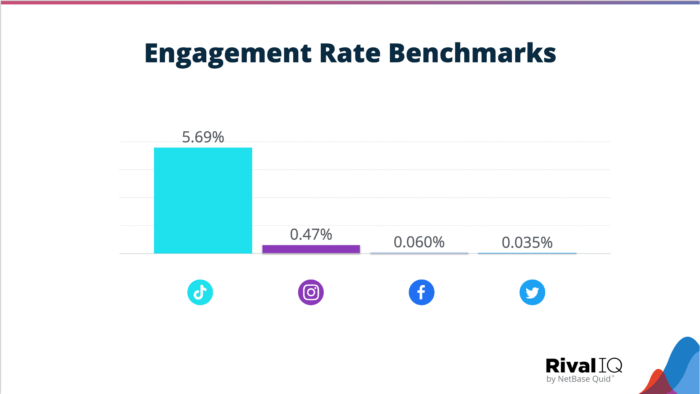
The slide above shows the 2023 median engagement rates for TikTok, Instagram, Facebook, and Twitter. The engagement rate on TikTok is 5.69%, which is twelve times higher than the average engagement rate of 0.47% on Instagram.
There has been a bit of discussion around the fact that, with the exception of TikTok, these engagement rates are relatively small. “But, small compared to what?” is the question Seth dug into.
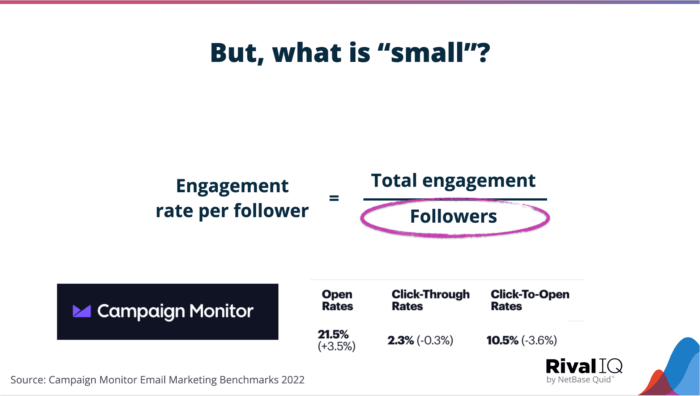
In the slide above, you’ll see that Campaign Monitor reports click-through rates as 2.3%. Even the average engagement rate on Instagram at 0.47% is more than five times smaller than that. Facebook and Twitter? They’re more than 39 times smaller. Yikes.
Key takeaway 2: Engagement rates trending down—in part—by declining reach
Engagement rates by follower count on the three big social networks are trending down over time. It’s not surprising, considering how the platforms have all chosen to push for a pay-to-play model, resulting in steadily declining organic reach. Sigh!

Key takeaway 2a: Instagram engagement rates took a tumble
The pace of decline for average engagement rates is the fastest on Instagram in the last three years. Since 2021 the average engagement rate on Instagram has fallen by 29%.
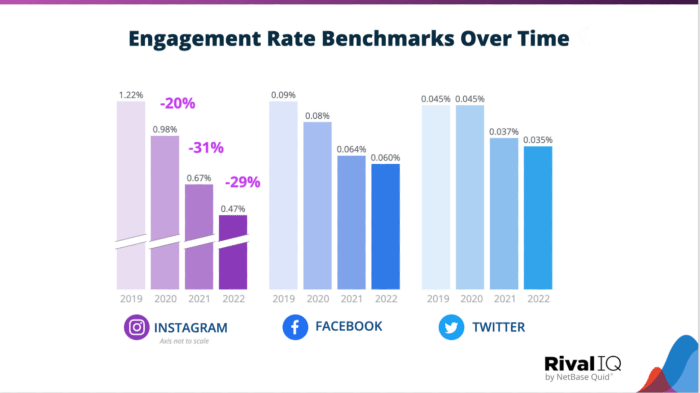
The slide above shows data from this year’s study, along with data from our industry benchmark reports in 2022, 2021, and 2020.
Key takeaway 3: Declining organic reach is the culprit
Have you ever wondered if engagement rates might be dropping because organic reach is on the decline? To help you find answers to this question, Seth digs deeper into reach issues, particularly on Instagram.
If your followers aren’t logging on regularly and engaging with your content when they do, then there’s a reasonable chance that the algorithms on each platform aren’t serving them your content very often.
And if people aren’t seeing your content, it’s pretty hard to generate engagement.
Using more data from our 2023 Instagram Stories Benchmark Report, we examine the change in post reach rate on Instagram from 2021 to 2022.
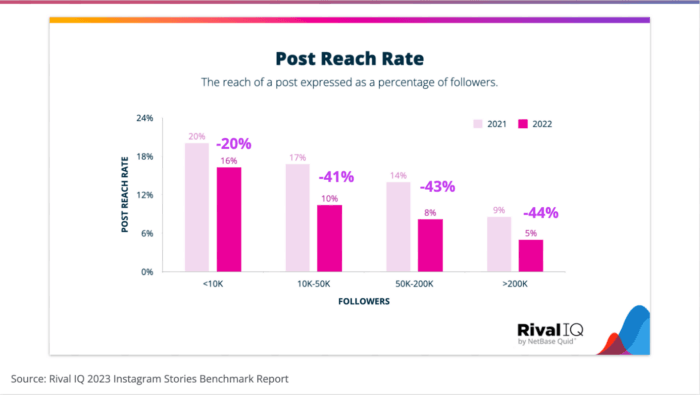
The slide above shows the post reach rate for Instagram feed posts in 2021 and 2022. Note the significant decline in the organic reach of the average brand post from year to year. These double-digit changes are likely the main culprits in driving engagement rate change in this year’s benchmark report.
Key Takeaway 4: Reels, Reels, Reels
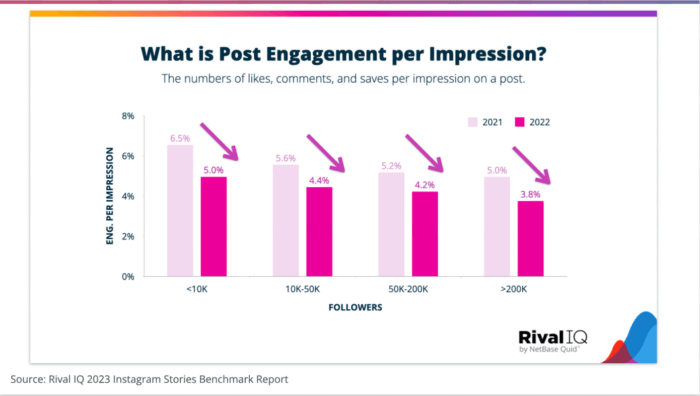
Data from the 2023 Instagram Stories Benchmark Report helps us understand engagement for viewers that actually see your content. The graph shows the average engagement per impression on Instagram feed posts in 2022 vs. 2021. You can see that the average engagement per impression fell from the 5-6% range to 4-5%.
If engagement rates aren’t going down because of content quality, what else could it be? Seth believes that it’s not that people’s content necessarily got worse, but a shift from one content type to another, particularly if they have different engagement behaviors, could be a driver in your engagement rate numbers.
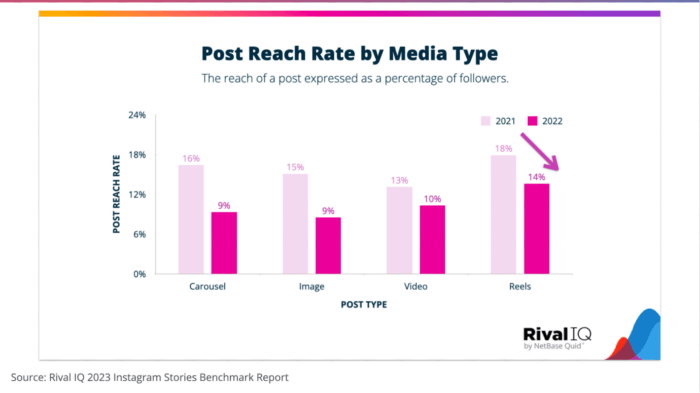
In the slide below, you can see that, on average, across all account sizes, even though the reach rate for Reels fell from 18% to 14% in 2022, Reels continue to earn more reach than all the other media types.
Key Takeaway 5: Increased reach from Reels likely yields higher overall engagement
Now, what happens when folks actually see your content?
As you can see in the slide below, Reels and Videos earn fewer engagements on a per impression basis on Instagram. So, if someone is watching a reel, even if more people are seeing it, they are less likely to interact with it than what we see for images and carousels.
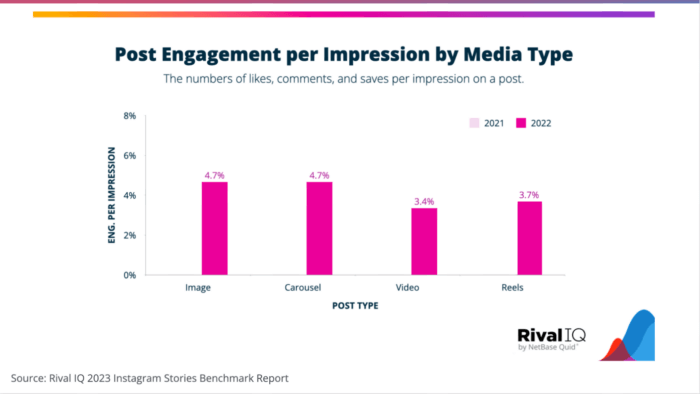
In looking at how those numbers have changed since last year, we see a drop for all media types, but the decline for Reels between 2021 data and 2022 data is relatively small, from 3.9% to 3.7%.
From studying these charts, it’s safe to say that even though Reels may be earning fewer engagements per impression compared to carousels or images, the increased reach you’re getting from Reels is likely offsetting that drop to yield higher overall engagement.
Key takeaway 6: TikTok earns much higher views per follower
Shifting our focus to TikTok, let’s try to understand how and why the platform enjoys a comparatively high engagement rate of 5.69% compared to Instagram’s 0.47%.
Seth starts by analyzing TikTok behavior by exploring two theories, one based on more reach on a per-follower basis and the other focusing on content quality.
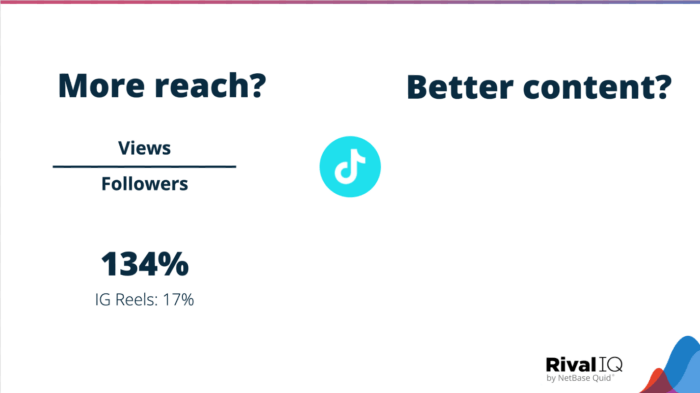 The slide above contains unpublished data (surprise!) but does a good job of illustrating that brands across this study earn, on average, 134 views relative to their following. This number is nearly eight times the reach seen for Instagram Reels.
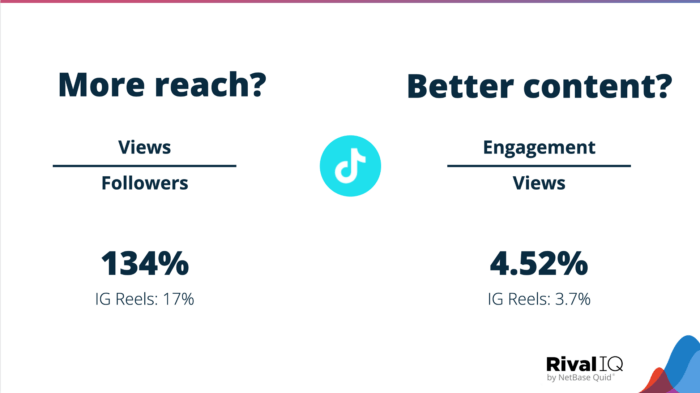
Key takeaway 7: Instagram and TikTok are pulling in similar engagement rates, so keep investing in both
Is the content brands create on TikTok that much better and engaging that audiences see it so much more? Well, not really.
The slide below shows you that the engagement per view on TikTok is 4.5%, which is only slightly higher than the 3.7% engagement per impression on Instagram Reels.
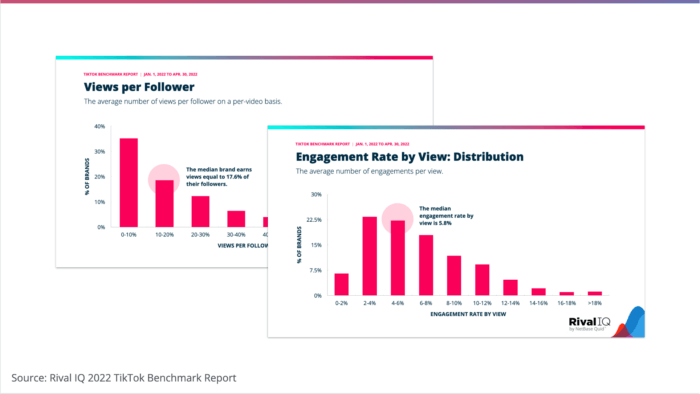
Key takeaway 7a: The FYP is a huge driver of engagement on TikTok
The chance to go viral because of the FYP algorithm is the driver of high engagement rates on a per-follower basis on Tiktok, which allows brands to reach beyond their followers. This viral effect explains the massive 134% average views per follower number.
In last year’s TikTok Benchmark report, we studied the median engagement views per follower and found them to be in the 15%-20% range, pretty close to what we see on Instagram.
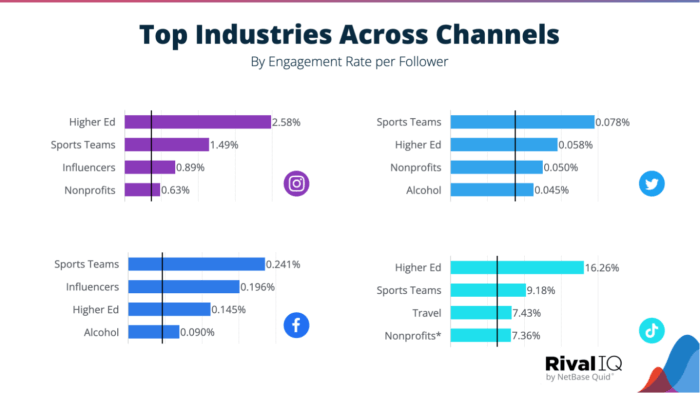
Key takeaway 8: The top industries on social are on top, regardless of channel
In this section of the webinar, Seth examined which industries rise to the top on social. We learned that the top social industries are on top, regardless of channel.
Looking at the top industries for social media on Instagram, Facebook, TikTok, and Twitter, we see a mostly consistent set of industries across all three channels: Higher Education, Influencers, Nonprofits, and Sports Teams. On TikTok, Travel broke into the top four, while Alcohol showed up on Facebook and Twitter.
Key takeaway 9: Knowing your audience is a superpower
Knowing what creates a response from your audience—and then delivering that content consistently—will yield above-average results.
In this section of the talk, Seth digs into the performance of The Yacht Week, a popular yacht rental company in the Mediterranean.
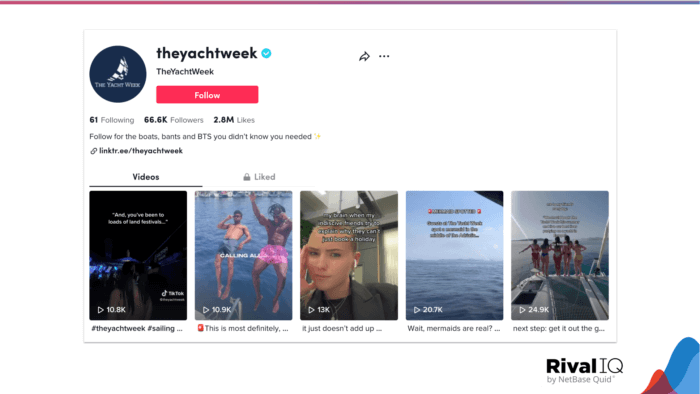
During 2022, The Yacht Week’s TikTok performance was stellar. They posted slightly over six times a week, earning an average engagement rate by follower of 17%, well above the average of 7.43% for our Travel benchmark.
Looking at The Yacht Week’s top posts, we notice that their TikTok content strategy involves being consistent, being on trend, using long text overlays, and publishing a ton of videos with humor and aspiration blended together.
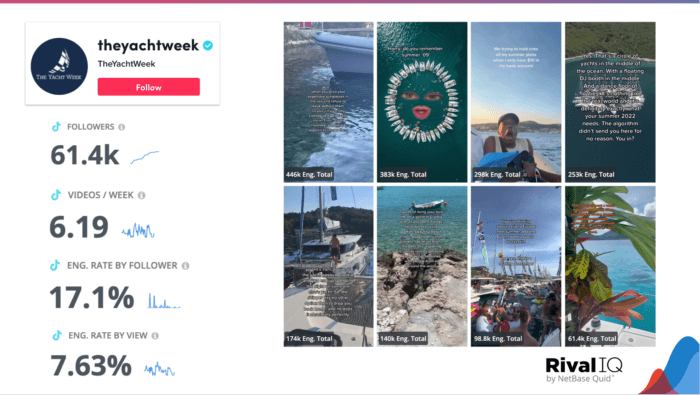
Over the entirety of last year, The Yacht Week earned over 30 million views and almost 2.5 million total engagements.
The Yacht Week really knows what its fans want, both on a yacht and on their social media, and they deliver both consistently throughout the year.
Wrapping It Up
We hope these key insights from our industry benchmark report will help shape your brand’s marketing strategies and get you prepped for social media success in 2023 and beyond.
If you have more questions about social media metrics or how to be a guest on the Data-Driven Marketer, reach out to us on Twitter. Till then, happy benchmarking!