A social media audit is key to building a competitive social media strategy. By regularly stepping back and evaluating your social channels, you can gain a fresh perspective on what’s working, what’s not, and where there’s room for improvement.
Social media audits are an effective way to assess your strategy, see how your content is performing compared to similar brands, and identify new opportunities and improvements. To get the most out of your audit, it’s helpful to use a template as your framework so you don’t miss an important metric or assessment. So, whether you’re preparing for a new campaign or simply looking to sharpen your strategy, grab our free social media audit template and quickly see how you stack up.
Let’s dig into why a template is helpful and then we’ll walk through how to use our social media audit template so you’re prepared to start auditing your own social channels.
Ready to conduct your own social media audit?
Download our free templateWhy you should use a social media audit template
Whether you’re taking over social media duties in your new role, your company has shifted its business goals, or you simply want to take stock of how your brand performed on social media, a social media audit will help you reassess your strategy and get you back on track.
A social media audit is a way to analyze your content, engagement, activity, and audience metrics to assess your performance, compare with the competition, and identify opportunities to improve. Even though the word “audit” may sound intimidating or scary, it’s a valuable process for social media marketers that can be done in just a few steps — especially if you use a template.
A social media audit template makes the audit process smoother by providing the framework for what you should be analyzing. Not to mention, using a template helps keep your audits consistent across reporting periods, whether you audit on a quarterly or yearly basis.
How to use our social media audit template
If you haven’t already, download the free slide deck, which includes everything you’ll need to get started. We included social media auditing template slides and a sample report we filled out that’ll help you see what goes where. Then, log into your Rival IQ account (or sign up for a free trial) to conduct your own audit by following these steps.
To help you get started, let’s walk through the template slides and our example audit of Zara, so you can see a social media audit in action.
Step 1: Build a competitive landscape
Before you start your audit, have a list of competitors to refer to for benchmarking and gathering inspiration when auditing your brand. As a social media marketer, you’re always keeping tabs on your brand’s competitors so this shouldn’t be anything new for you. But to conduct an accurate audit, it’s helpful to have all of your competitors’ social analytics in one place so you can easily access and compare. To create this, use a social media analytics tool like Rival IQ to build a competitive landscape.
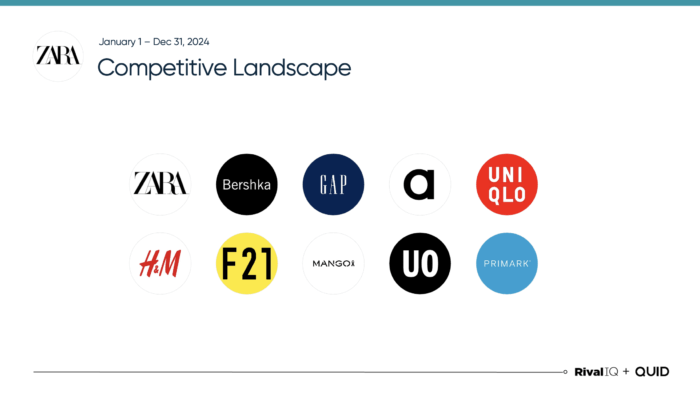
For reference, here’s the competitive landscape for Zara which was built in Rival IQ:
Once you have your landscape built, it’s time to start filling out the template. The first slide is where you’ll add your logo, brand name, reporting period, and anything else you’d like to have an overview of. For instance, there’s an open space on the left side of the slide where you can add images of your posts as a preview of what you’ll be reviewing in the report.
![A slide from our social media audit template with the title [reporting period] Social Media Audit.](https://www.rivaliq.com/wp-content/uploads/2025/01/social-media-audit-template-image-2-700x381.png)
If you want to showcase some of your best posts here, head to your dashboard in Rival IQ and select the channel you want to feature. Then, go to “Social Posts” and check out the “Top Landscape Posts” to screenshot your posts. For this example, we are auditing Zara’s performance for the entire year. Feel free to customize the reporting period to look at the monthly or quarterly performance depending on your auditing cadence.
Here’s an example of how the first slide could look:

Step 2: Summarize your profiles
The next slide is a profile overview. Here is where you’ll add your current bio for each of your channels. Make note of any hashtags, emojis, links, or CTAs you use in each of your social bios.
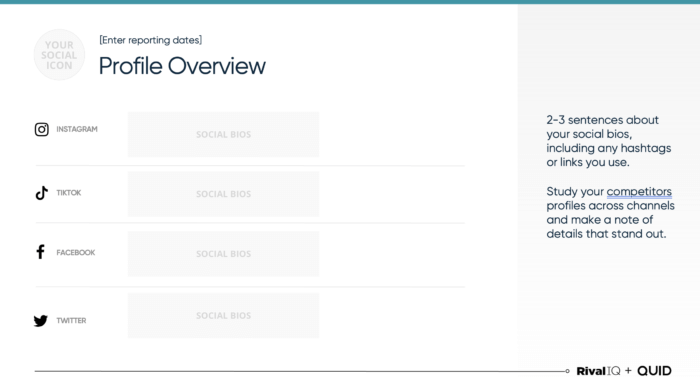
You should also check out what your competitors’ bios say. Doing this can help you identify any key differences or give you some ideas for what you can add to craft an effective bio. While you can certainly check out every competitor’s bio manually, doing so for every channel can take a while. Save time by heading to your Rival IQ landscape and adding a Social Bios Summary template to your custom dashboard. This way you can see all of your competitor’s bio information in one place and even get alerted when anything changes.
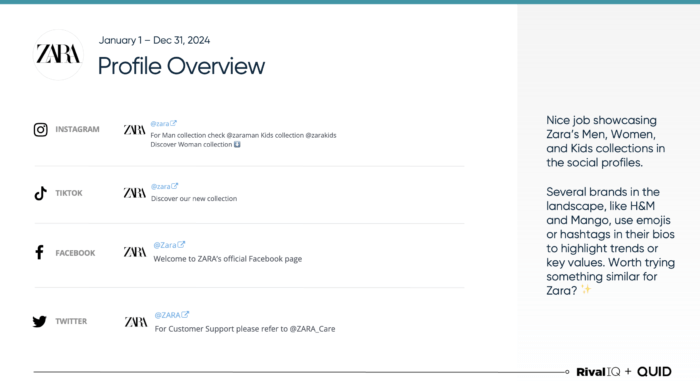
Here’s an overview of what this slide looks like for Zara. As you can see on the right side of the slide, there are notes that sum up some quick thoughts on the general qualities of the brand’s social bios. There is also a note about a key differentiator between Zara and the rest of the brands in the competitive landscape: a majority of Zara’s competitors use emojis or hashtags in their bios. This is a subtle but important change that Zara could make to improve its brand bios.
Step 3: Review your cross-channel performance
Next, summarize your cross-channel engagement and audience metrics. For this section, you’ll need to compare your current reporting period to the previous period. For example, if you’re conducting a quarterly audit, then the previous reporting period would be the last quarter.
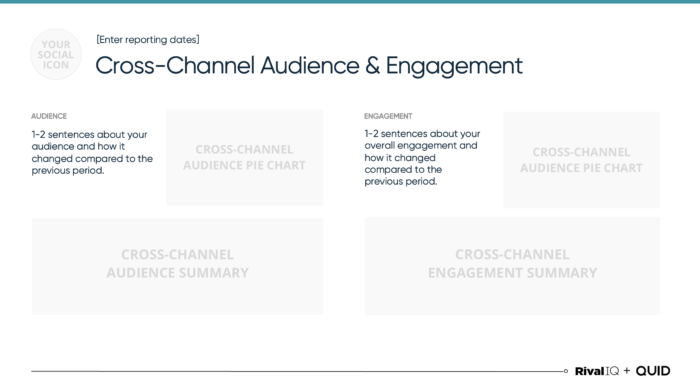
Once you have your reporting periods set, you’ll add a couple of sentences about your audience and how it changed compared to the previous period. Did you see a spike in followers? Has your growth rate been steady or stagnant? Make note of any changes across each channel.
You’ll also do the same for your cross-channel engagement. What were your engagement rates on each channel? How do they compare to industry rates?
Find out what is a good engagement rate on social media. 
Here’s how the cross-channel slide looks in practice:
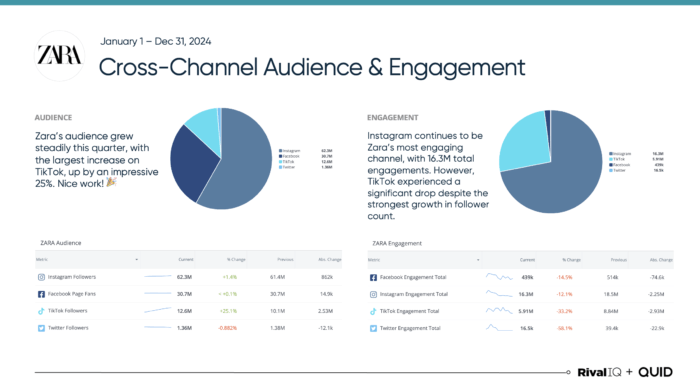
The charts and audience and engagement summaries were pulled from Zara’s dashboard in Rival IQ. The data was auto-populated based on the reporting period. The landscape generated visual standings which makes it easier to understand and digest in a report format. Including a cross-channel overview in your audit helps to quickly understand how your brand is performing and where it’s seeing the most success. For Zara, we can see that Instagram is the brand’s most engaging channel and its audience increased over the course of the reporting period.
Step 4: Dive into channel-specific metrics
Now it’s time to audit your performance for each channel. Copy the metrics overview slide and create one for each of the social channels you’re active on. This slide is where you’ll make note of key metrics for that channel for the reporting period.
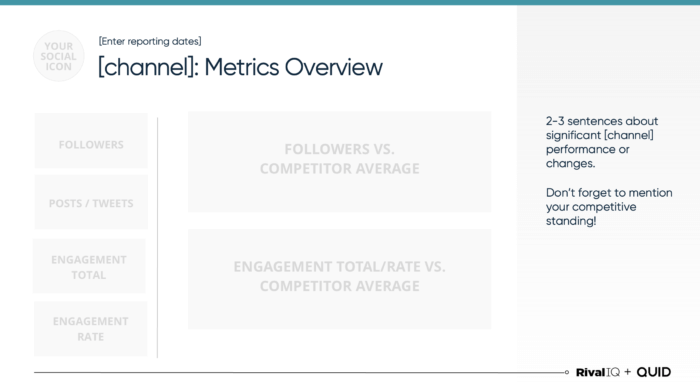
The metrics we like to audit are the number of followers, number of posts, engagement total, and engagement rate. Enter all of this data onto the slide and write a few sentences that sum up any significant changes during this reporting period. Here’s an example: “We doubled our posting frequency from 2 posts per week to 4 posts per week and saw our engagement rate increase by 10%.”
Again, let’s take a look at how this slide looks in practice using Zara’s analytics. This slide is the metrics overview for Instagram. It provides a visual representation of changes in followers, posting frequency, and engagement. There are also some notes on the right side of the slide that sum up the reasons for the changes during the reporting period.
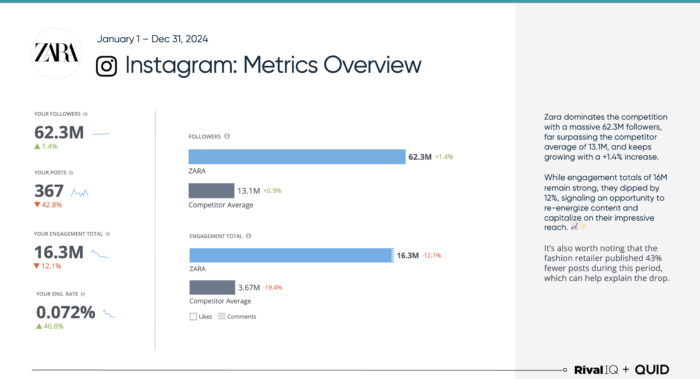
You’ll repeat steps four through seven for each channel you want to audit. This will be the main portion of your audit before you wrap it up with an action plan (more on that in step eight, below).
Step 5: Compare your performance to the competition
Another key to a successful audit is to compare your metrics to your competitors. Doing this helps you get a more accurate picture of how you’re performing in relation to similar brands in your industry.
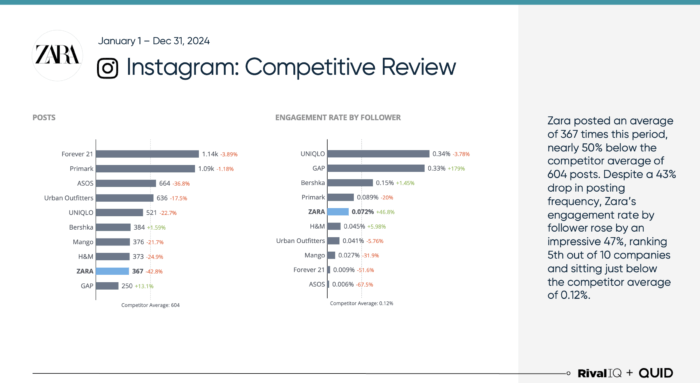
Using your competitive landscape in Rival IQ, you can see where you rank among the competition on each channel. Let’s say your landscape includes 10 brands (including your own) in the health foods industry. On the Audience Leaderboard, you can see that Zara ranks first on Instagram and Tiktok, second on Facebook, third on Twitter, and first overall. Make note of these standings on each relevant slide to provide more perspective on how your brand is performing.
Here’s how this slide looks for Zara. The brand’s Instagram rankings are showcased in bar graph form to better demonstrate how it’s performing in terms of the number of posts and engagement rate when compared to the competition. The audit notes also do a great job of putting more context behind the graphs.
Step 6: Evaluate your posting activity
Once you have an overall sense of your social performance compared to the competition, the next step involves going one level deeper into your posting frequency and the post types that are generating the most engagement for the channel. Within Rival IQ’s Social Posts panel scroll down to the the Activity & Engagements section to visualize the average posts and engagement rate trends matching your selected filter set and time period. Take a screenshot of this chart to complete the left side of the slide below.
Scroll a little further down within the Social Posts page to get to the Post Types widget. This section shows you your brand’s posting activity broken down by post type and which types of posts get the most engagement in your landscape.
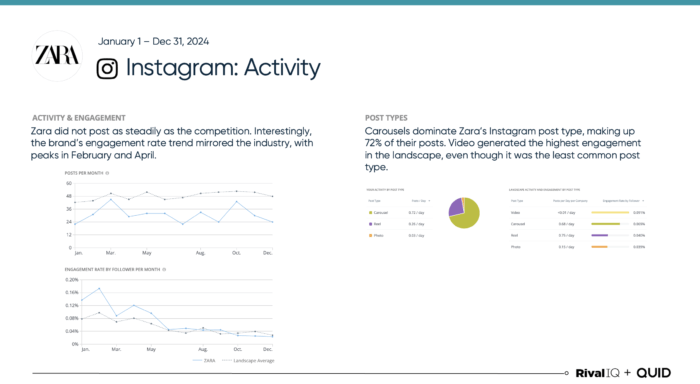
In our social media audit of Zara, the slide below indicates that Zara’s posting activity and engagement rate by follower on Instagram was lower than the competition. Interestingly the engagement rate trend followed that of the landscape average.
In the post-type breakdown section, we observe that Carousels dominate Zara’s Instagram post type, making up 72% of their posts. Video generated the highest engagement in the landscape, even though it was the least common post type.
Step 7: Review what worked and what didn’t work
Now that you have an overview of how your brand is performing on each channel, it’s time to review specific posts. To see your top posts for the channel you’re auditing, go to “Social Posts” and check out the “Top Landscape Posts.”
Audit your top and bottom posts to identify any patterns that could’ve been attributed to the performance. What made your top posts stand out? Were they part of a specific campaign? Did they all follow a similar format? Make note of what worked well and why (and don’t forget to include performance metrics like the engagement rate or total) so you can create similar content going forward.
Conduct the same analysis for the posts that performed the worst on that channel. Sometimes we think a post will perform well and it ends up falling flat. See if there’s a reason why. Maybe your lowest-performing posts were photos but your audience gravitates towards video content. Or perhaps you didn’t include a hashtag and, as a result, your post didn’t reach as many people. Identify any patterns and make note of them for your audit.
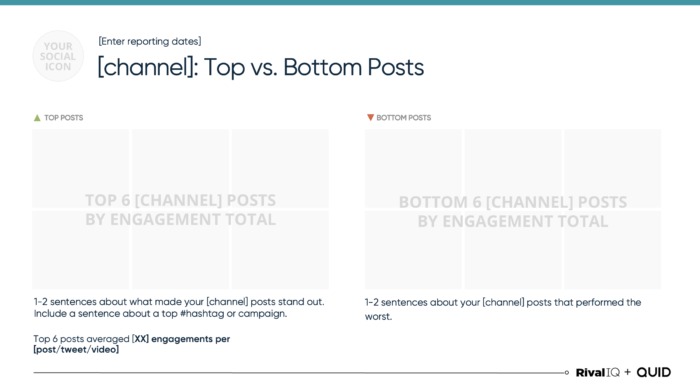
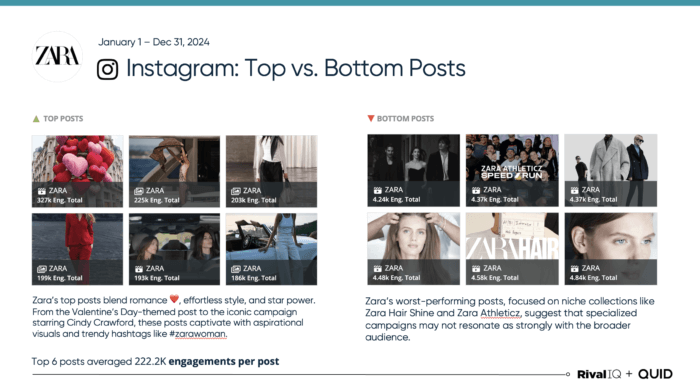
Here’s how the top vs. bottom posts slide looks in practice. As you can see below, Zara’s top posts on Instagram were focused on collection launches and the debut event for Zara Streaming – the brand’s new video shopping platform, featuring supermodel Cindy Crawford and her daughter Kaia Gerber. If you’ve kept up with our industry benchmark reports, this comes as no surprise — brands continue to find success with celebrity partnerships due to the significant boost in reach, likes, and shares that they generate. We can also see that Zara’s lowest-performing posts were Reels that announced their lesser-known niche collections.
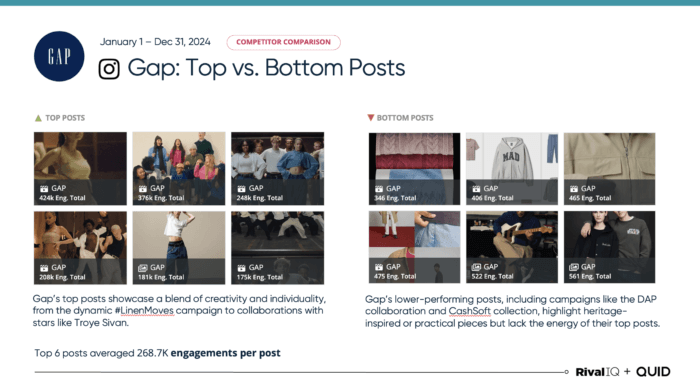
Once you’ve audited your brand’s top and bottom posts, you should also recreate this slide for a few of your competitors. Competitive benchmarking helps you better evaluate your own performance by seeing what your competitors are doing differently and how you can improve.
In the example below, one of Zara’s competitors, Gap, saw success when it announced brand partnerships across several posts featuring pop stars. The brand’s worst posts were visually unappealing campaigns and lackluster giveaways that didn’t seem to entice the audience. Seeing this information could inspire Zara to lean into its giveaways and add more celebs to its roster.
Step 8: Create an action plan
After you’ve completed steps four through six for every channel you want to audit, the last step in conducting a social media audit is to create a to-do list based on your findings. You learned a lot about what’s working well, which channels perform better than others, and how you differentiate from the competition. Make note of the major takeaways and how you want to apply them to your strategy during the next reporting period.
We recommend identifying up to four initiatives you want to try next.
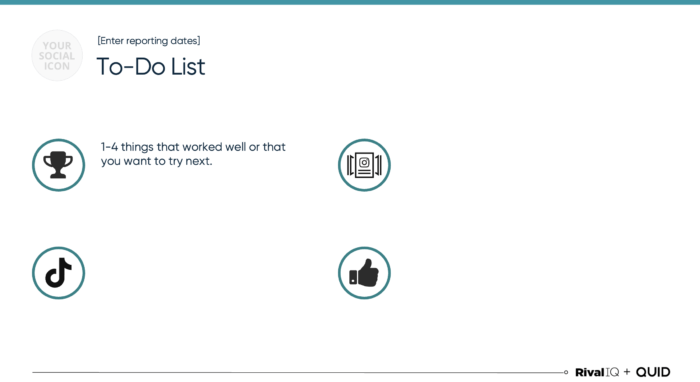
Here’s Zara’s to-do list based on the learnings from its social media audit:
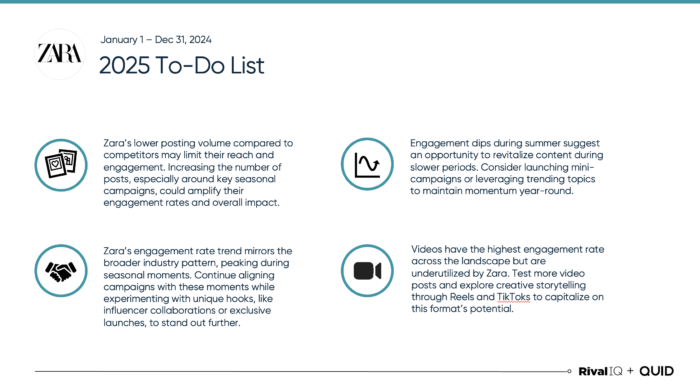
Each action item includes a couple of sentences that explain what went well and how the brand wants to implement that takeaway in future content. This to-do list perfectly sums up what the takeaways are and helps everyone on the social team get on the same page about what the social priorities are for the next reporting period.

Want to conduct your own social media audit?
Download our free templateCommon Audit Mistakes to Avoid
Even with a solid framework, it’s easy to miss crucial steps in a social media audit. Let’s look at a few common pitfalls and how to steer clear of them:
Focusing only on vanity metrics: Sure, follower counts and total views are nice to have, but they don’t tell the full story. To get a clearer picture of your social media performance, focus on engagement metrics like total engagement and engagement rate, as well as likes, comments, shares, and saves.
Skipping competitor analysis: If you only look inward, you’re missing half the picture. Keeping an eye on how competitors are performing helps you spot trends and opportunities you might have overlooked.
Ignoring audience sentiment: It’s easy to get caught up in the numbers, but don’t forget to check in on what your audience is saying. Comments, reviews, and feedback can offer invaluable insights into what’s working and what needs improvement.
Treating all platforms the same: Each platform has its own quirks and audience behavior. What works on Instagram may fall flat on TikTok or LinkedIn. Tailoring your approach to fit each platform is key to maximizing results.
By avoiding these common mistakes, you’ll ensure that your social media audit is both thorough and actionable, helping you refine your strategy and achieve better results.
More resources for your social media audit
You’ve successfully completed the social media audit template, but the fun doesn’t stop there! Take your social media audit a step further by tapping into more resources. Here are a few tools and resources that can help inform your social strategy year-round, and can be especially helpful for conducting your next audit or putting together a social media report.
Industry benchmark reports
Our annual Social Media Industry Benchmark Report is a comprehensive guide on industry performance and trends across Facebook, Instagram, Twitter, and TikTok. The report breaks down engagement rates, posting frequency, and other key metrics by industry, from Food & Beverage to Health & Beauty to Higher Education, so you can benchmark your brand’s social performance to similar brands and see where you stand.
Live benchmarks
Looking for real-time insights? Explore our live benchmarks. The live benchmarks sum up industry metrics from the past 30 days including top-performing posts, trending hashtags, and notable activity.
The data is broken down into specific subsets within industries — for instance, under the Beverage category, you can see data for craft beer brands or coffee brands — so you can see which brands in your niche are standing out on social.
Social media audit course
If you want to dive deeper into the ins and outs of auditing, we have a course for that. Our Social Media Competitive Audit Course, led by marketing expert Lauren Teague, is a self-paced video course that walks you through detailed steps of building a competitive social strategy. Each lesson is packed with actionable takeaways that you can use to analyze your brand’s social channels and effectively compare your performance to the competition. And did we mention it’s free?
Free head-to-head analysis
Remember step five from our social media audit? (If you need a refresher, it’s “compare your performance to the competition.”) A quick and easy way to gather the information you need for this step is with a head-to-head report.
A head-to-head report is useful when you want to analyze key metrics such as engagement rates, top posts, and follows so you can quickly see what differentiates you from your top competitor at a glance.
Here are the head-to-head report tools for each channel, for easy access:
- Instagram Head-to-Head Analysis
- Facebook Head-to-Head Analysis
- Twitter Head-to-Head Analysis
- TikTok Head-to-Head Analysis
Social media analytics tools
Using a social media analytics tool to track and measure your performance year round is essential when it comes time to conduct a social media audit. Having all of your key metrics and content activity in a central location helps you find the information you need when you’re putting together a report or conducting an audit, and that’s where Rival IQ comes in. Create landscapes, spot industry trends, and gather detailed insights on engagement across all channels — all in one place.
Start auditing your social media with Rival IQ. 
Wrapping it up
Social media audits are a key element of a successful, well-informed social strategy. By using a template for your audit, you save yourself time and resources instead of trying to create these reports from scratch every time you want to conduct an audit. Audit your way to social media success by using a template to get started.
This blog was originally posted on July 14, 2023, and has since been updated.
