When was the last time you checked out the competition on social media?
We’re willing to bet you do this on a regular basis — as you should! — but are you taking a look at the right competitive benchmarks?
Competitive benchmarking is the key to improving your social media performance across all channels. Rather than solely measuring your own success on a given platform, competitive benchmarks help you understand where your brand stands in relation to the industry.
Below, let’s go over what competitive benchmarking is, why it’s essential to improve your social media performance, and a few examples of how to analyze key social media benchmark metrics.
What is Competitive Benchmarking?
Competitive benchmarking is the process of comparing your brand to your competitors using a set of defined metrics. Benchmarking helps you evaluate your performance not only against the competition but also within the overall industry.
Competitive benchmarks provide a bigger picture of social media success as they help you understand everything from engagement to follower growth as it relates to your industry rather than relying only on your own performance over time.
A major benefit of competitive benchmarking is that it helps you identify areas for improvement based on how your competitors are performing and what they’re doing differently on social media. On the flip side, benchmarking can also help you understand where your brand is succeeding so you can lean into those tactics even more.
How to Use Competitive Benchmarks to Improve Social Performance
When applied to your social media strategy, competitive benchmarking can have a major impact on how you approach each channel.
To conduct an effective competitive analysis, you need a set of metrics to measure. The key performance indicators (KPIs) you already use to track your overall performance are a great starting point. These can include:
- Audience
- Posting frequency
- Engagement rate
- Engagement total
You can also benchmark your content and strategy against your competitors, which we’ll explain more about below. Let’s go over how each of these metrics can be used as benchmarks when comparing your social performance to the competition.
Audience
Follower count has always been an important social metric to keep an eye on. But what’s more indicative of your success on any platform is your audience growth over time, especially when compared to your competitors’ growth rate. If you’ve been able to consistently grow your follower count, then you’re clearly doing something right. But if your audience size has stayed the same — or worse, decreased — then your content may not be resonating and could use an evaluation.
In Rival IQ, you can track your audience’s net change and compare it to your competitors’ audience size to see how your brand stacks up. Getting a visual of audience growth can really put it into perspective and give you a better understanding of how your follower count has grown (or stayed the same) and whether or not it aligns with similar brands in your industry.
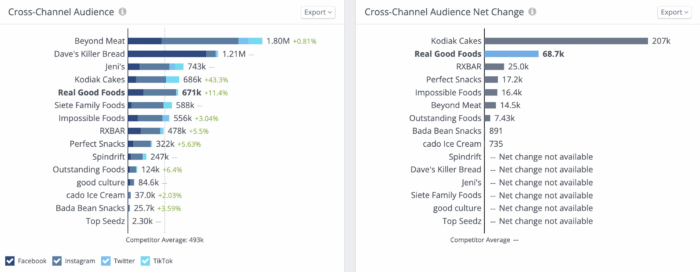
For example, if you see that your competitors are growing their audiences at a much faster rate than you, you could look into what they’re doing differently to gain so many followers (hint: the answer is probably running a giveaway). You can also create a custom dashboard to track audience growth over time and get more insight into the ebbs and flows across a set period of time, whether that’s yearly, quarterly, or monthly.
Posting frequency
These days, there isn’t one magic number to aim for when it comes to how often you should be posting. Our latest report found that posting frequency has generally declined, but it varies by channel and industry. For example, most brands only post on TikTok once or twice a week but post on Instagram nearly five times per week.
To get a better idea of how often to post on each channel, it’s helpful to use posting frequency as a competitive benchmark. Take a look at how often your competitors post to each channel and how that frequency correlates to other metrics such as engagement rates or follower growth.
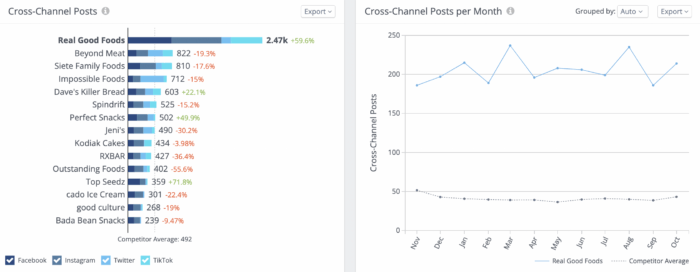
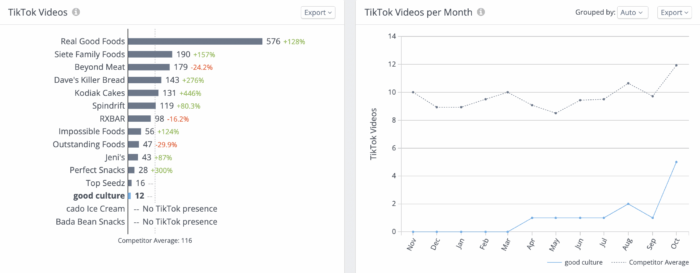
In the example above, we can see that the health food brand Real Good Foods posts significantly more across all channels than similar brands in its industry. If Real Good Foods is your competitor, you could use this information to analyze whether the brand’s posting frequency has made a positive impact on its audience size or engagement rates and then decide if that’s something you want to incorporate into your social strategy.
Engagement rate
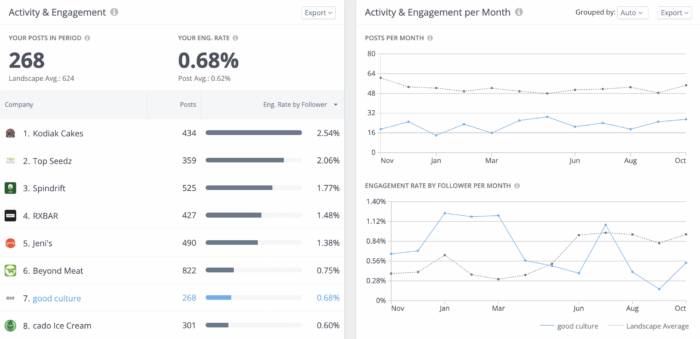
Engagement rate is a key competitive benchmark to use when measuring your success on a platform. Engagement rate tells you whether your content is resonating with your audience. An engaged audience can translate into a number of business benefits such as increased brand awareness, customer loyalty, website traffic, and even sales if your content is compelling enough. So it’s safe to say social media marketers are always looking for ways to improve engagement rates across channels.
Monitoring your own engagement rate is a good first step, but understanding how your engagement rate compares to your competitors can tell you a lot more. When you can see how your rate stacks up within the industry, you have a clearer picture of whether you’re on the right track or missing the mark.
Engagement total
In addition to engagement rate, measuring the total number of engagements you and your competition are getting can tell you a lot. At Rival IQ, we define engagement as measurable interaction on organic and paid social media posts. These interactions include likes, comments, favorites, retweets, shares, and reactions and comprise the engagement total.
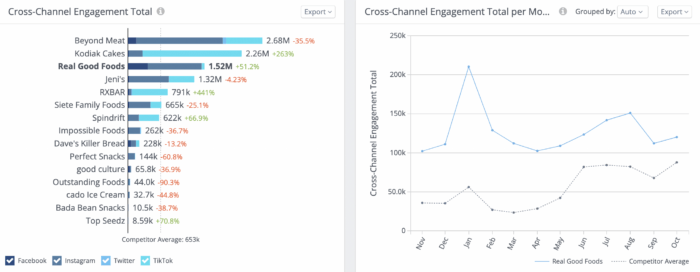
When digging into engagement totals, it’s important to take a look specifically at the types of engagements you and your competitors are receiving.
For example, let’s say you generate a decent amount of likes on your Instagram posts but your competitors tend to get more comments and shares. This could indicate that while your followers may be seeing your posts, those posts may not resonate with them as much as your competitors’ posts do.
Strategy benchmarks
Once you have an idea of where you stand among the competition when it comes to audience size and engagement rates, it’s a good idea to dig a little deeper into what exactly they’re doing differently from you.
You can measure your overall social strategy against the competition by analyzing content metrics. These types of metrics can include popular topics, engaging hashtags, and top-performing posts. How exactly do these help with benchmarking? Let’s take a look at the example below which features popular topics and hashtags used by health foods brands.
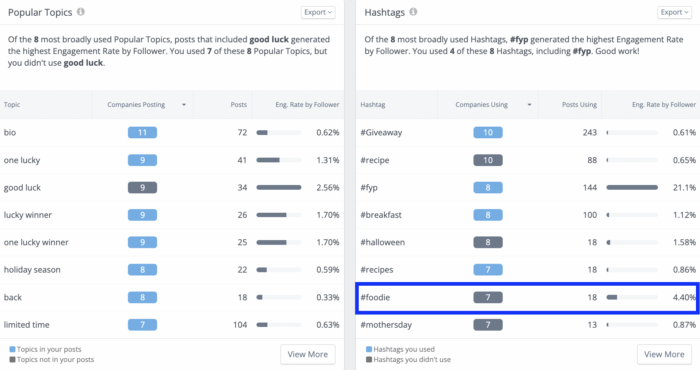
You can see that one of the most engaging hashtags used by this landscape of brands is #foodie, with an engagement rate by follower of 4.40%. However, out of the 15 brands being analyzed in this landscape, only about half are using this hashtag in their posts. If you happened to be one of the brands that haven’t used this hashtag before, then this insight would tell you that it’s worth sneaking #foodie into your captions every once in a while in an effort to improve engagement. Had you not benchmarked your brand’s content against the competition, you may have missed out on a simple yet effective change you could make to improve your content.

Creating a competitive landscape using Rival IQ
Once you’re ready to use competitive benchmarks to improve your social performance, you can use Rival IQ to set up a landscape. A landscape is simply a collection of companies you analyze together in one place.
To create a landscape, start by identifying your competitors. These are the brands you want to compare your social performance with. If you’re new to an industry or just not sure who your competitors are, Google your brand name to see which other brands come up. You can also search your name on a social platform and typically the platform will suggest similar brands to check out.
Once you have a set of competitors that you want to compare your own brand to, you can create a landscape in Rival IQ.
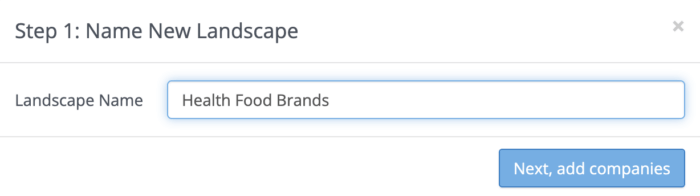
Start by choosing a name for your landscape. To keep with the food theme, we’ll create one for health food brands.
Next, add your competitors to the landscape. Rival IQ gathers the brand’s public social media accounts from its website. If you start to type in a brand’s name, its website URL should pop up and then you can add it to your landscape.
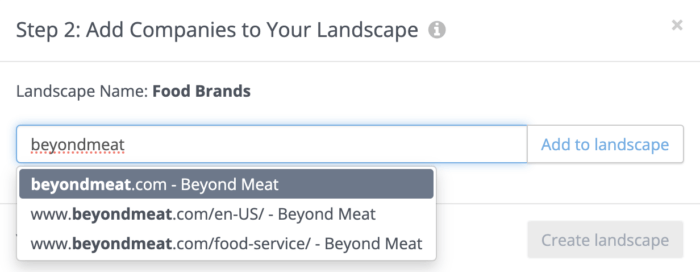
Once you’ve added all of the companies you want to compare your brand to, create your landscape to start analyzing.
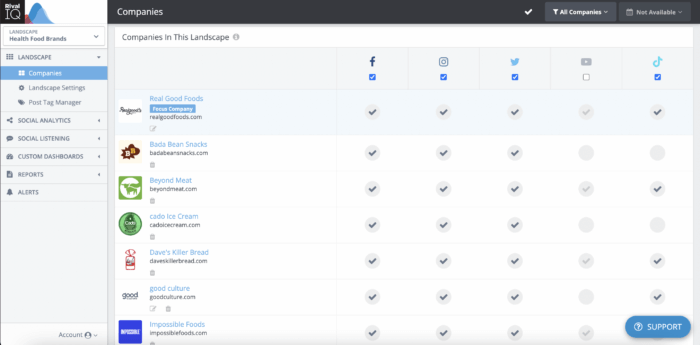
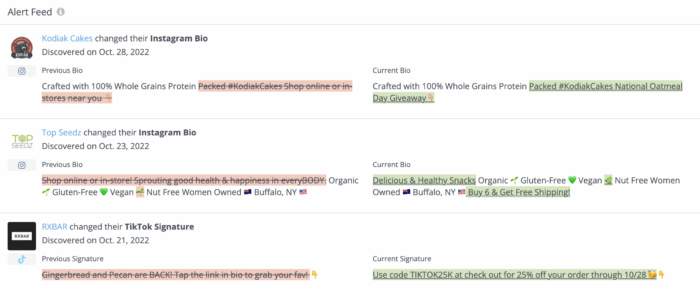
You’ll see all of the companies in your landscape in one place so you can monitor everything from when they change their bio to notable posts to popular topics. You can even set up alerts that notify you of these changes so you can stay on top of your social game without combing through different accounts all day long.
4 Examples of Using Competitive Benchmarks for Social
Now that we know how competitive benchmarks can impact your social performance, let’s take a look at competitive benchmarking in action on each channel. We’ll use the health food brand good culture as our example.
On Facebook, good culture’s most common post type is a photo. While photos get a decent amount of engagement on the platform, links are *slightly* more engaging for brands in this landscape. However, this analysis also tells us that health food brands on Facebook, good culture included, aren’t posting nearly as many links as they are photos.
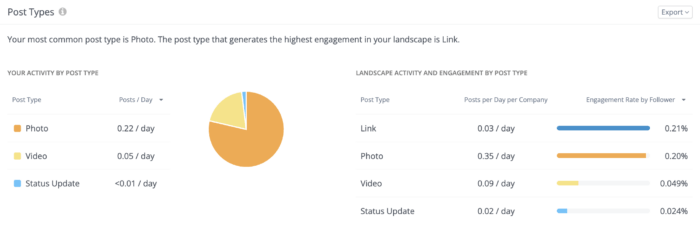
What does this all mean in terms of benchmarking? If good culture and similar health food brands want to improve engagement on Facebook, then it would be worth it to post a mix of photos and links to stand out among the competition.
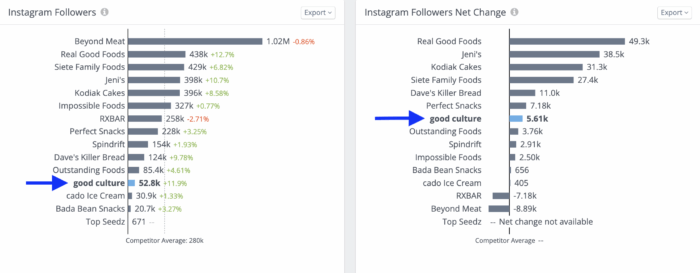
Now let’s analyze good culture’s Instagram performance compared to competitive brands. When it comes to audience size, good culture is towards the bottom of the pack. However, the brand has seen decent improvements when it comes to growth rate during this reporting period.
If good culture wanted to work on increasing its audience size, there are a couple of things they could evaluate. First, what did they do during this reporting period that could have resulted in an increase in followers? Second, what did their competition do to grow their audiences?
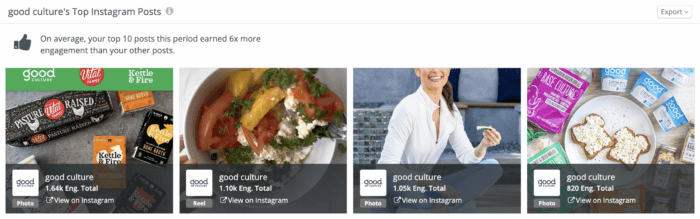
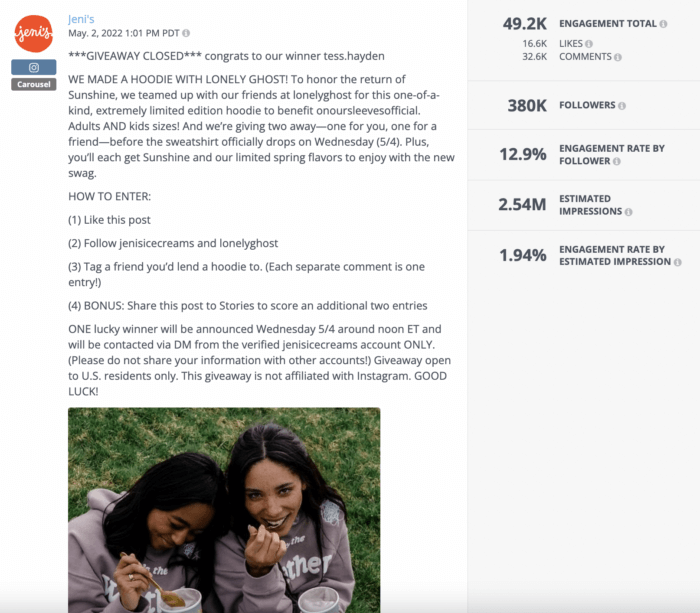
For starters, if we take a look at good culture’s most engaging posts for this reporting period, we can see that three out of four of them were giveaways. Giveaways are a tried and true method for getting in front of a new audience and gaining more followers, so it makes sense that these contests were a key part of good culture’s growth strategy.
Next, let’s take a look at what good culture’s competitors did to boost their follower count to identify any similarities or differences. Two of the brands that saw the greatest increase in audience size were Real Good Foods and Jeni’s Ice Cream. If we take a look at some of the top-performing posts for each of these brands, we can see that they were also giveaways.
This indicates that good culture is on the right track when it comes to its method for increasing its audience size on Instagram. As a next step in the competitive analysis, the brand could compare its engagement rates or post types to its competitors to identify other areas it could improve on the platform.
TikTok
We can’t forget about TikTok! TikTok is by far the most engaging platform for most brands with a median engagement rate of 5.69%, so it’s worth considering for your social strategy if you’re not active there yet.
Going back to our benchmarking example, let’s take a look at how good culture could use competitive benchmarks to improve its TikTok performance.
For starters, good culture isn’t nearly as active on TikTok compared to other health food brands. The brand only posted about one video per month during this reporting period. If good culture wanted to invest more time and resources into the channel, they could start by posting at least 1.75 times per week, the median posting frequency on TikTok across all industries.
After good culture steps up its TikTok activity, the brand could look at other competitive benchmarks to increase engagement, reach, and views on the platform. For example, if we take a look at popular topics and hashtags used by other health food brands on TikTok, we can see that good culture hardly mentions any of these in its videos (to be fair, the brand also hasn’t had many opportunities to since they don’t post often).
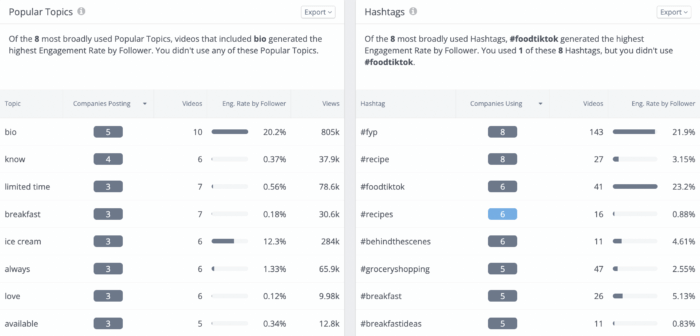
To keep up with the competition, good culture could start by including the most engaging hashtags in their videos like #foodtiktok and #fyp. Seeing what their competitors are talking about on TikTok can also help good culture brainstorm relevant content ideas so they can publish videos on a regular basis.
Health food brands are less active on Twitter compared to other industries, only tweeting about 1.4 times per week. Even so, good culture still has some catching up to do to step up its Twitter presence. good culture tweets less than once per week and those tweets are typically replies so they don’t get much engagement either.
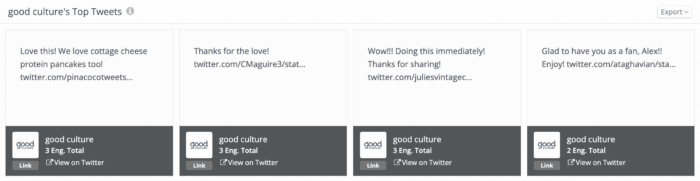
If good culture wanted to increase its engagement on the platform, it could look at what similar brands are doing to spark conversations and interactions. For example, if we look at the top tweets for this set of health food brands, we can see that giveaways are a common way to generate engagement.
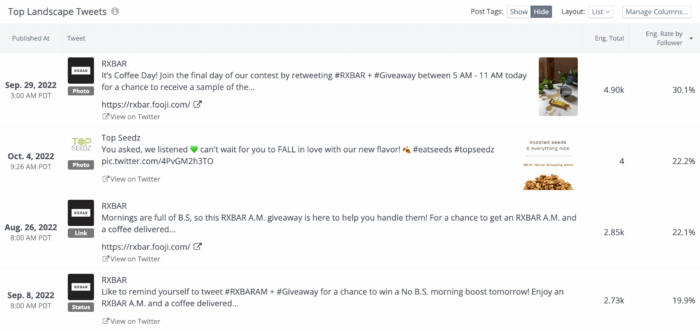
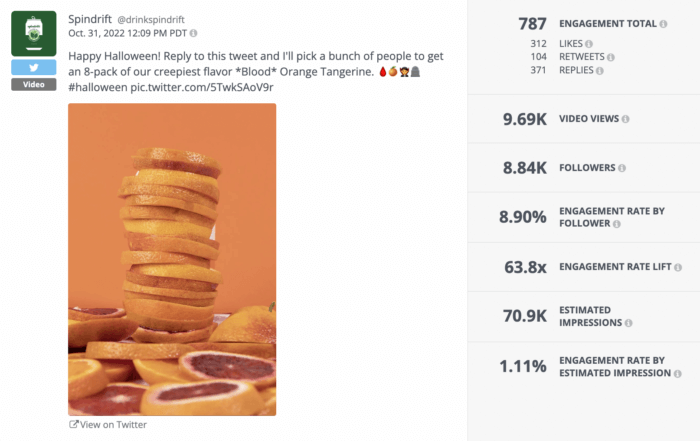
One way to run a successful giveaway on Twitter is to lean into the conversational element of the platform as Spindrift does in the tweet below. Instead of following the typical giveaway format that comes across like an announcement, the sparkling water brand casually encourages people to reply to the tweet for a chance to get a free pack.
This is just one way that competitive benchmarking can be used to adjust good culture’s strategy on Twitter. The brand could also take a look at the competition’s types of engagements, posting frequency, and audience growth to get a more complete picture of how they compare on the channel.
Wrapping it Up
Measuring your social performance and regularly evaluating your strategy on each channel is key to your growth. But you can’t do it alone. To get a comprehensive understanding of your activity and performance, it’s essential to see how your brand is doing relative to the industry by performing a competitive analysis.
Competitive benchmarking helps uncover opportunities for improvement that you otherwise would’ve missed if you were only focused on your own brand. The key is to analyze the *right* benchmarks. These are the ones that give you better insight into industry-specific success so you can take your content from just-okay to content that goes beyond industry averages.
As your brand grows and your strategy evolves, use competitive benchmarks as a best practice to help guide your approach and let you know how you can improve along the way.