I shudder at the word “audit.” As a previous independent contractor, nothing scares me more than the prospect of an IRS letter showing up in my mailbox because of some overlooked issue from old tax filings. However, when it comes to social media, an audit is the best thing you can do to find the gaps in your digital marketing strategy. So, let’s start with a Facebook audit.
It’s critical that you dive into your metrics and truly understand what you’re doing right and wrong. After all, why spend precious time and effort on promoting content and assets that aren’t leading to more likes, followers, engagements, and conversions? I’ve put together an easy-to-follow Facebook audit guide in conjunction with our free Rival IQ social media audit course. Combining these resources will help you identify the strengths and weaknesses of your social media and put you on the path to viral success!
So, let’s jump into it.
1. How to Export your Facebook metrics
The foundation of every Facebook audit is built on data. Let’s take a look at your metrics and see where your page currently stands, where it has come from, and what you can change in the future.
Pulling from Facebook Insights
A great place to start is the “Insights” section on the backend of your Facebook page.
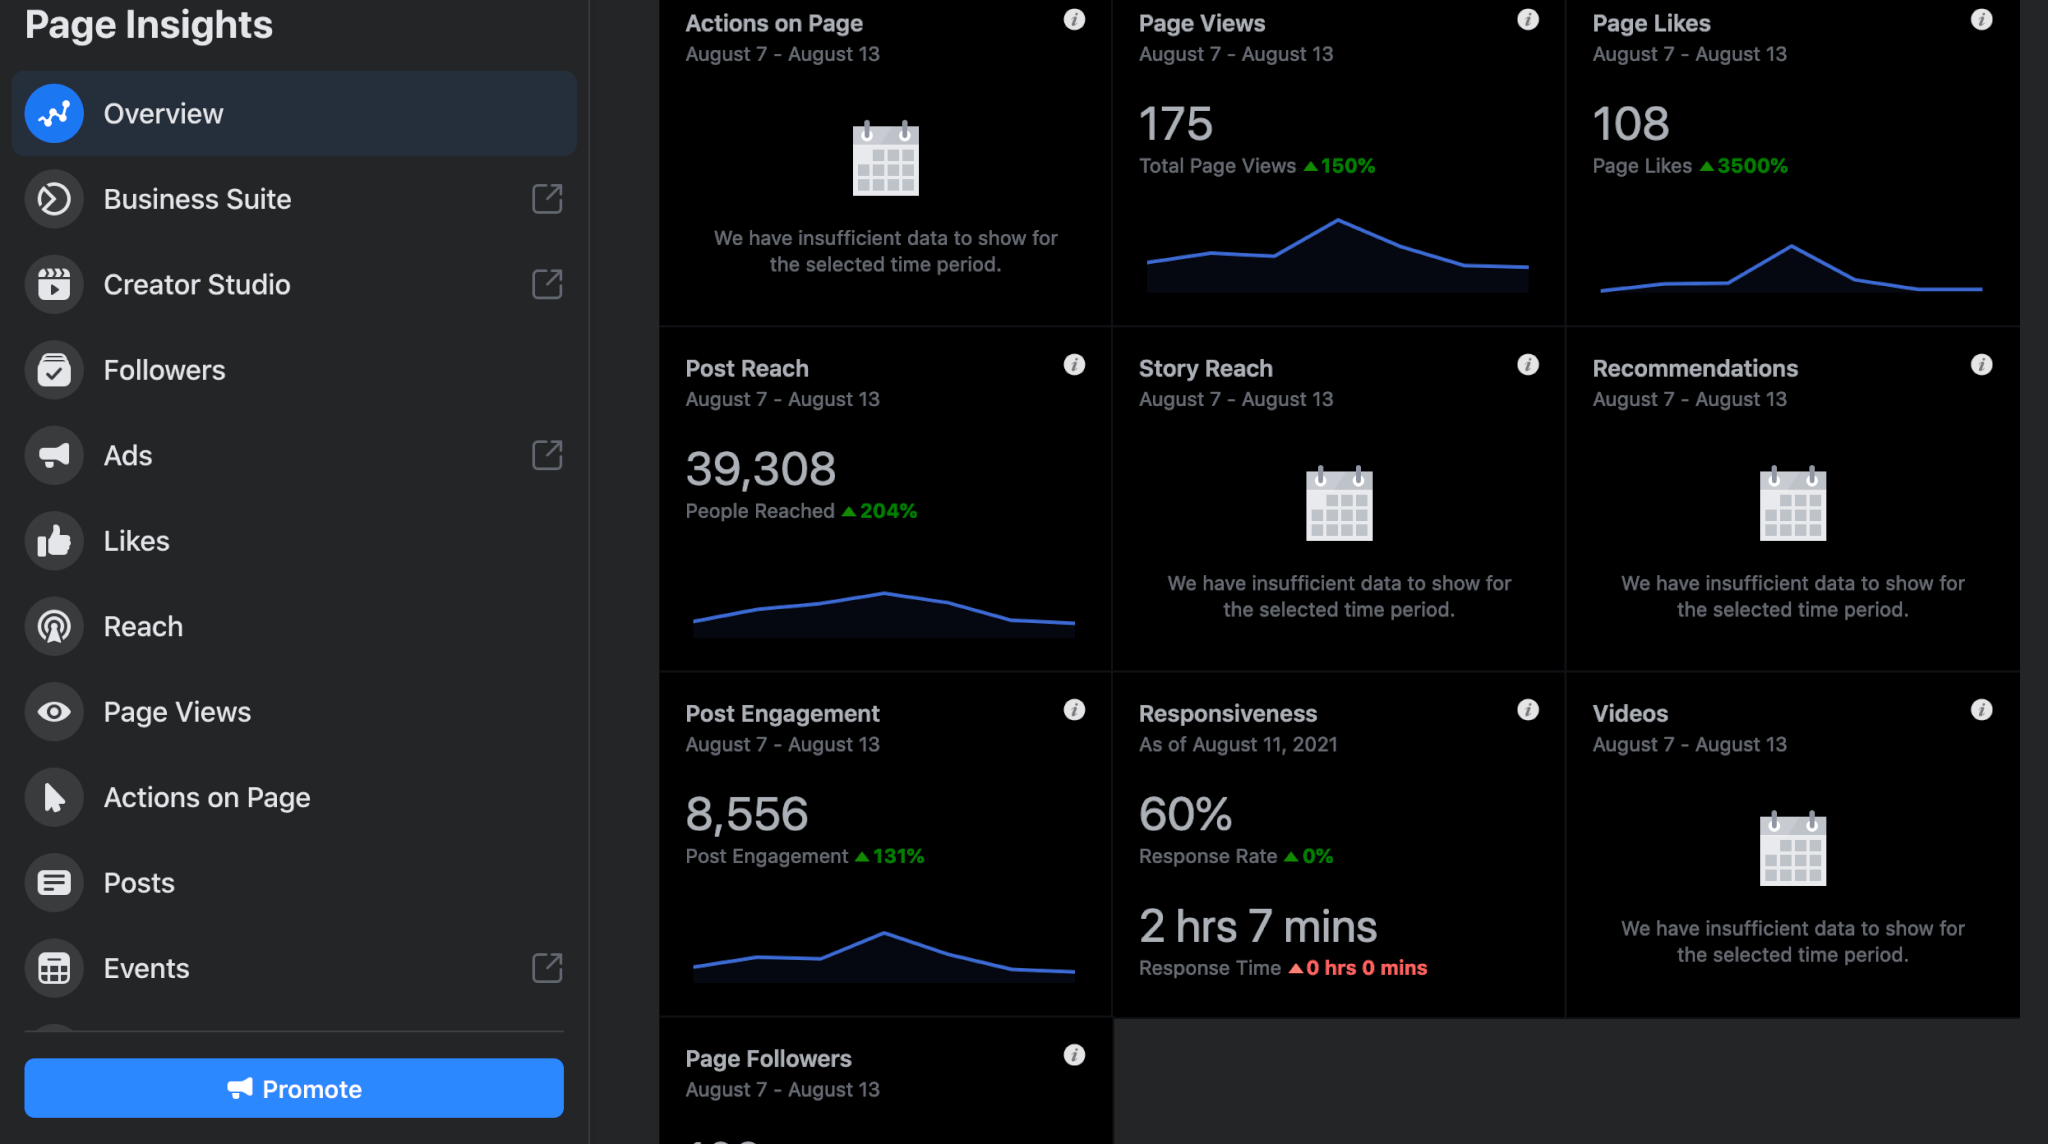
Using Facebook Insights you can gather all kinds of information, from post reach to engagement rates. Utilize this information to make inferences regarding what has and hasn’t worked for your brand within a designated period.
If you’re looking for additional insights into your Facebook data, especially in comparison with other competitors, you might want to consider using a social media analysis tool like Rival IQ.
Pulling from Rival IQ
If you’ve made it this far, you’re looking for additional insights into your current social media strategy, and the good news is that Rival IQ has lots to offer. Our social media course dives into the intricacies of pulling your metrics from our very own platform and making sense of this data.
Lauren Teague, our social media instructor, pulled in metrics on our platform in lesson 2 from all sorts of major tech companies, including Microsoft as an example.
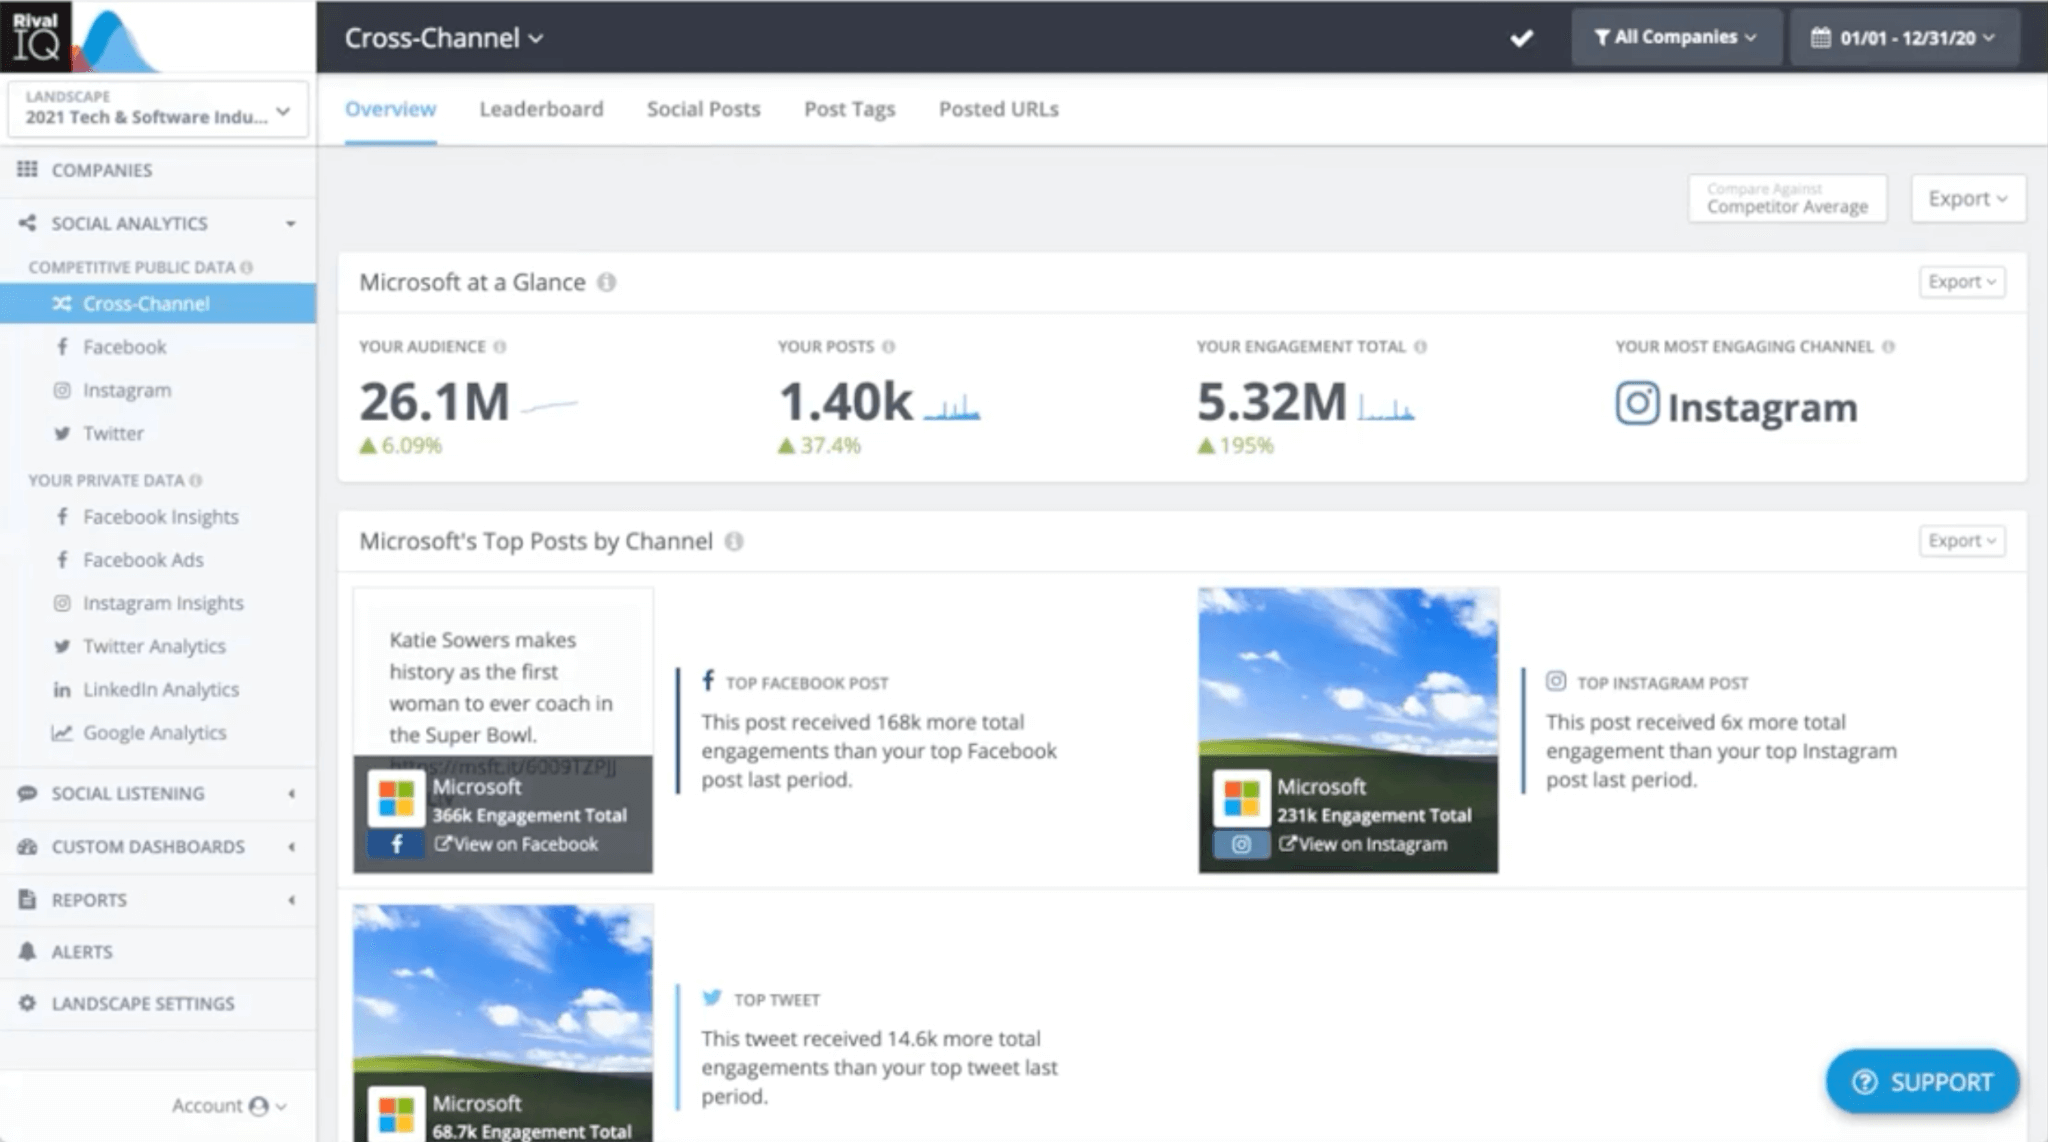
Just from the overview, you can see Microsoft’s audience numbers, how many posts they’ve put up, their total engagement, their most engaging social channel, and the top post from each channel.
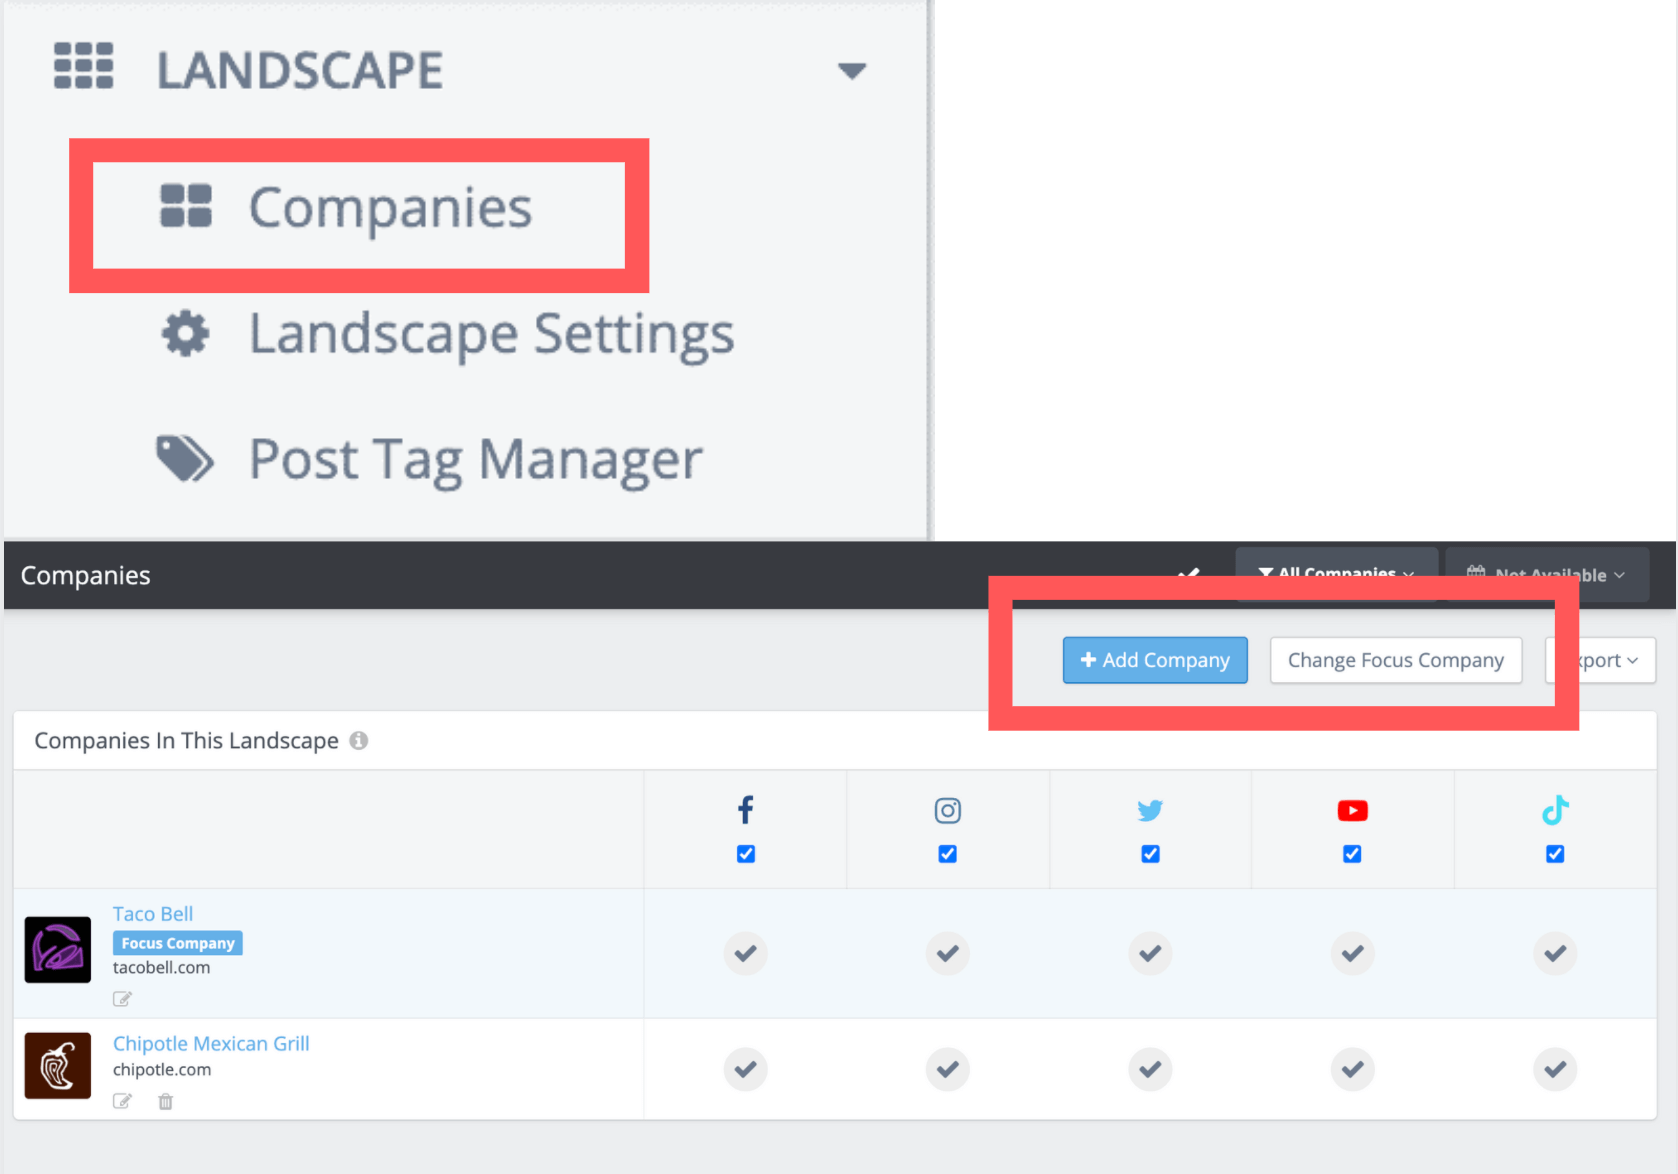
However, just for fun, let’s take a look at one of my favorite companies (Taco Bell) and pull some of Lauren’s knowledge to see what we might look for if we were running their Facebook strategy. First off, once you’ve added your company and your competitors to Rival IQ, you’ll want to set your page as the “focus company” which you’ll find under the “Companies” tab of the “Landscape” button on the menu. Once in the Companies area, you’ll find a button to add companies to your analytics and another to select your focus company.
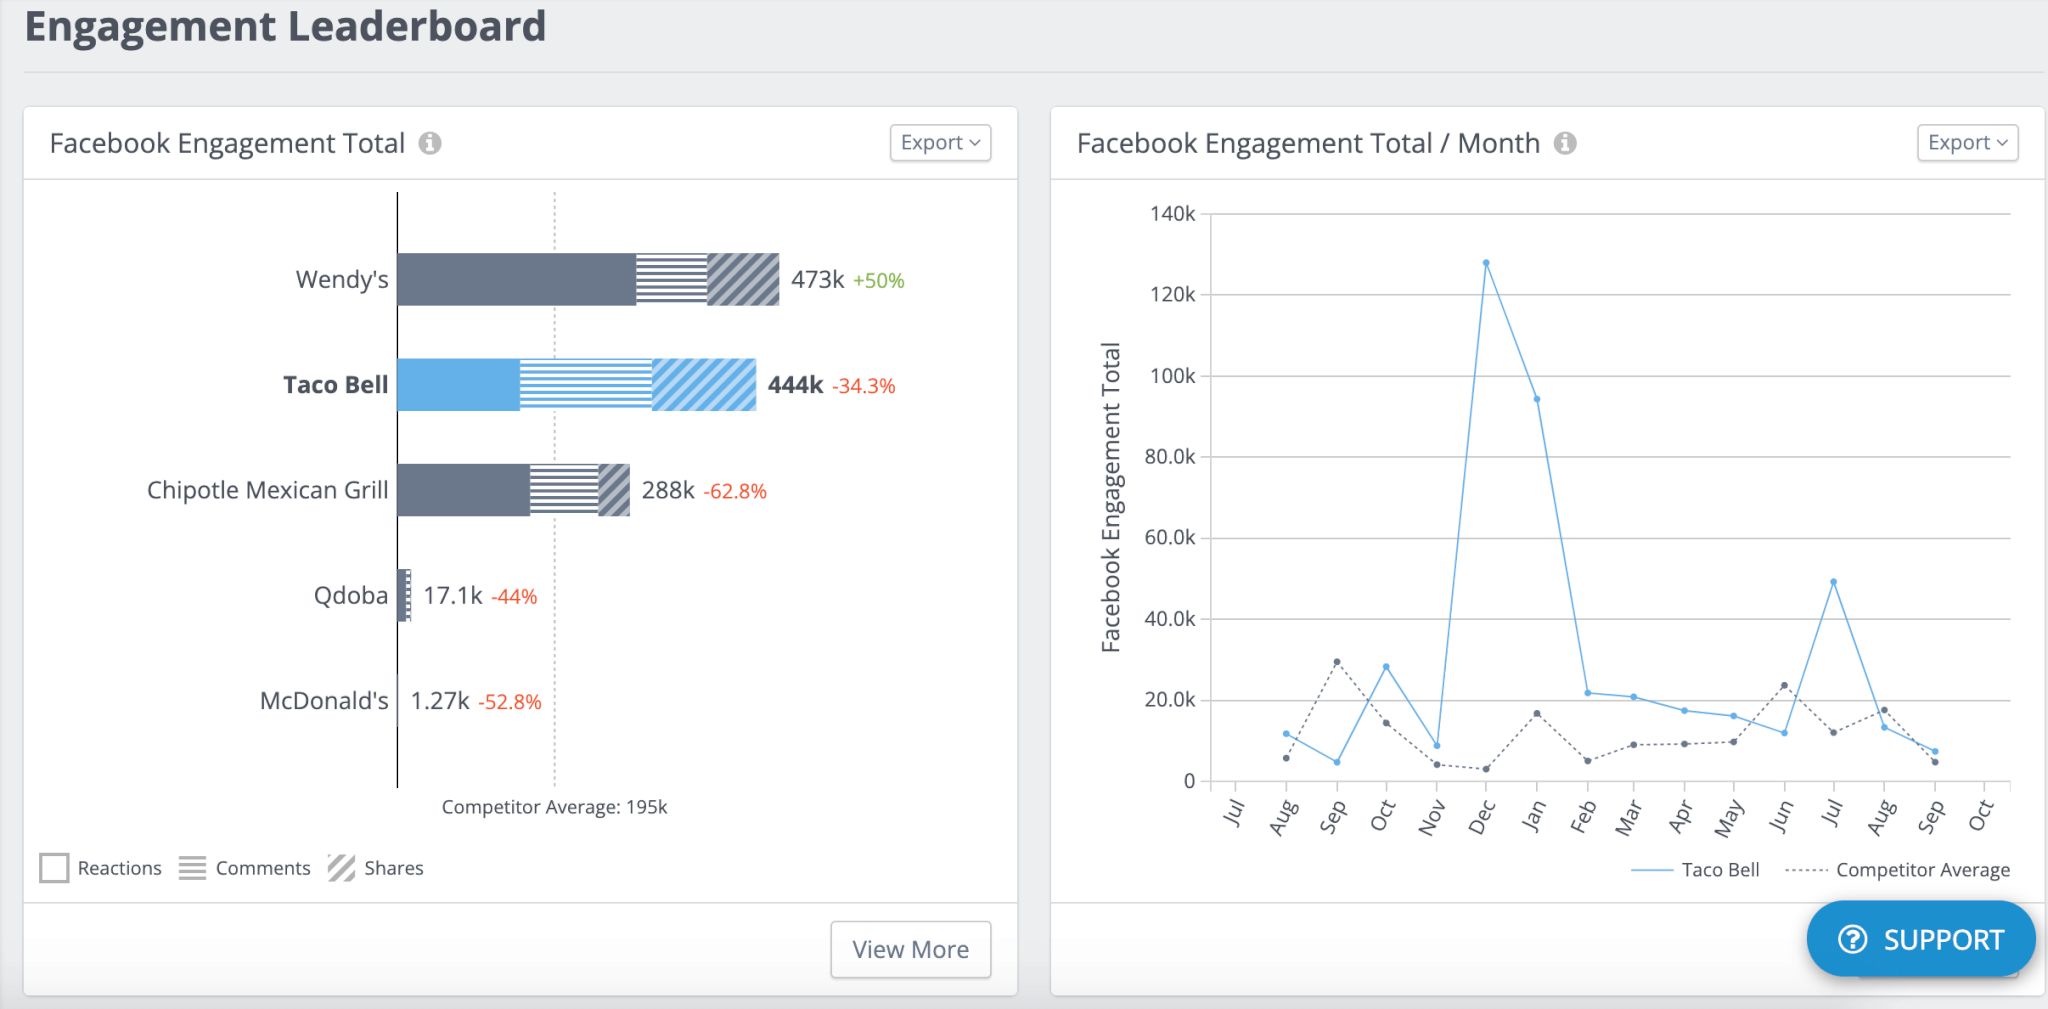
Just for fun, I put up Taco Bell against Wendy’s, Chipotle, Qdoba, and McDonald’s to see who was winning in the social race. It turns out that Taco Bell comes in second in overall activity on Facebook, with Wendy’s as the overall leader. This isn’t surprising considering Wendy’s sterling and snarky social media reputation. Comparing your performance against your competitors is helpful for establishing benchmarks, gathering post ideas, and measuring your performance improvements over time.
Here in Rival IQ, you can pull all kinds of data on your brand as well as your competitors. Since I am not the administrator of the Taco Bell Facebook page, I can’t pull any of their private data, but this will pull the standard insights you’d find such as likes, shares, engagement rates, page views, etc.
2. Find out which social strategies succeed and fail
The best thing about using Facebook Insights or a platform like Rival IQ is the newfound visibility into what is working for your brand and what you ought to leave behind. If certain posts aren’t performing up to standards, a Facebook audit like this will help you narrow down the details of those posts that aren’t resonating with your audience.
For instance, if it turns out that short videos are performing well on your page, but you’re seeing a pattern of low reach/engagement on text-only posts, you have a pretty good idea of what needs to change.
Your metrics will allow you to find out the best days and times to post content so you aren’t wasting your best material at the least opportune time.
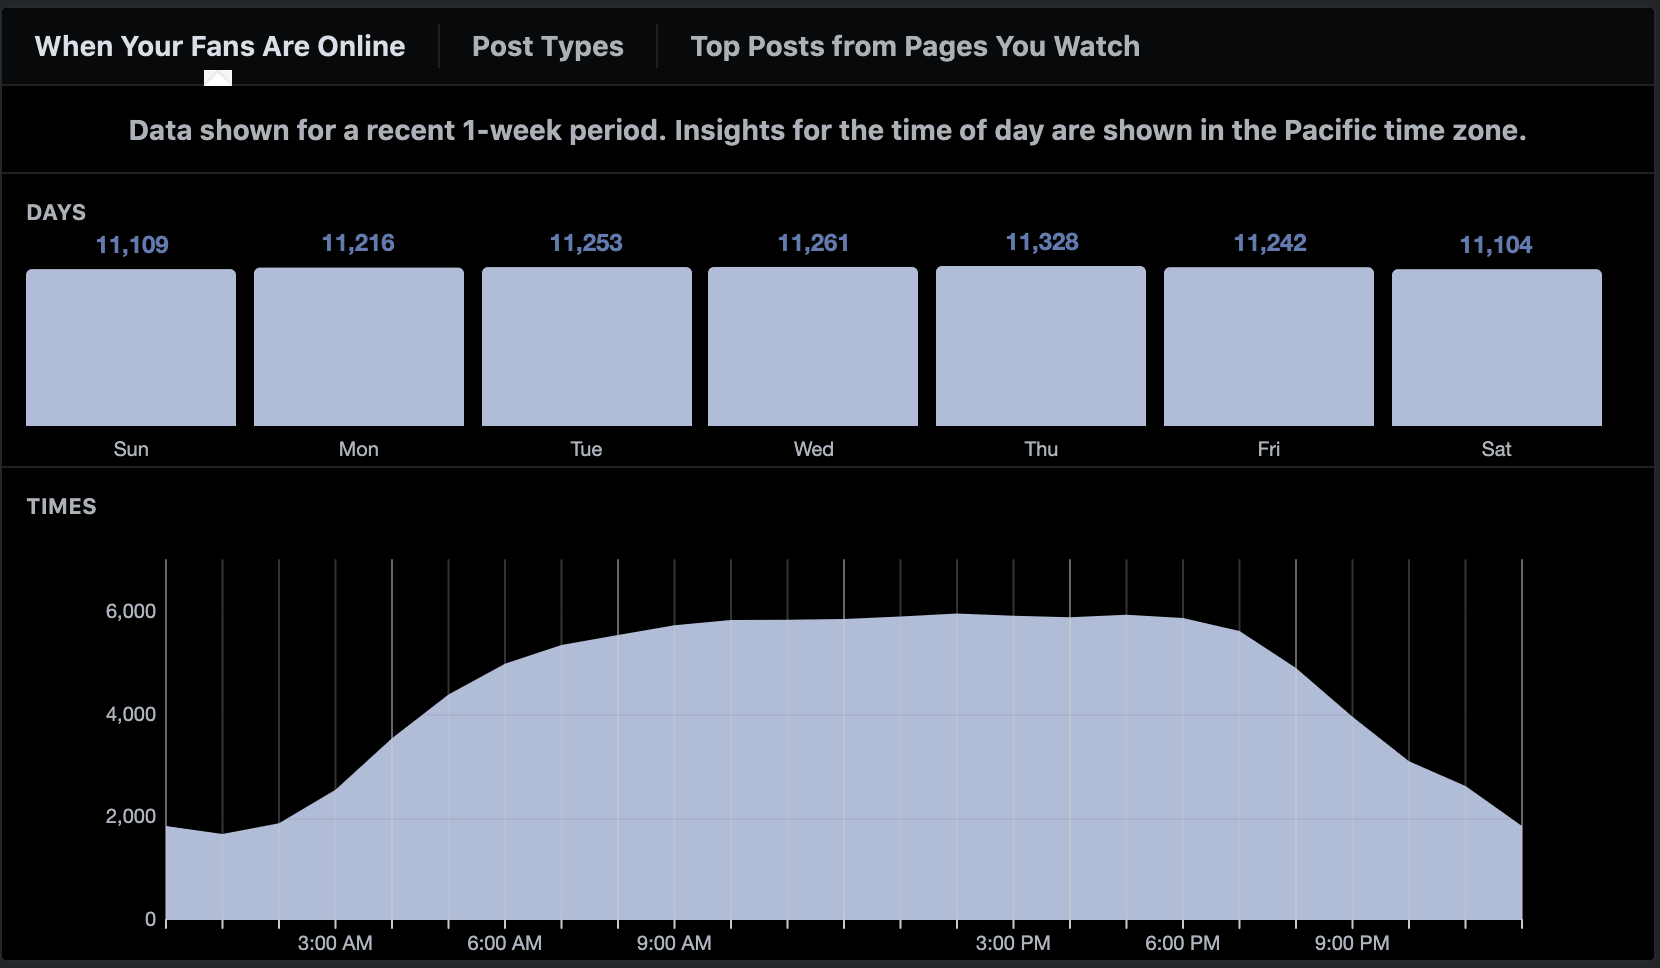
Find the best times to post
As you can see from the data below, the days are pretty consistent, but it looks like Thursdays are the best for reaching followers. Also, it looks like the peak posting times are between 11:00 AM and 5:00 PM, after which engagement tends to drop.
Most of these metrics were pulled from a Facebook page I am managing (no, it isn’t Taco Bell) and we were able to draw some interesting information from our metrics.
I found out that question posts were outperforming blog posts by a slight margin. This tells me that I might get better traffic with less work using these posts over putting more time into blogs.
These are just a few examples of the kinds of inferences you can make when auditing your Facebook page. It’s all about seeing what works and adjusting what isn’t.
Rival IQ also provides you with the inferences from the post data, as well as additional information you’ll need to construct a successful strategy going forward.
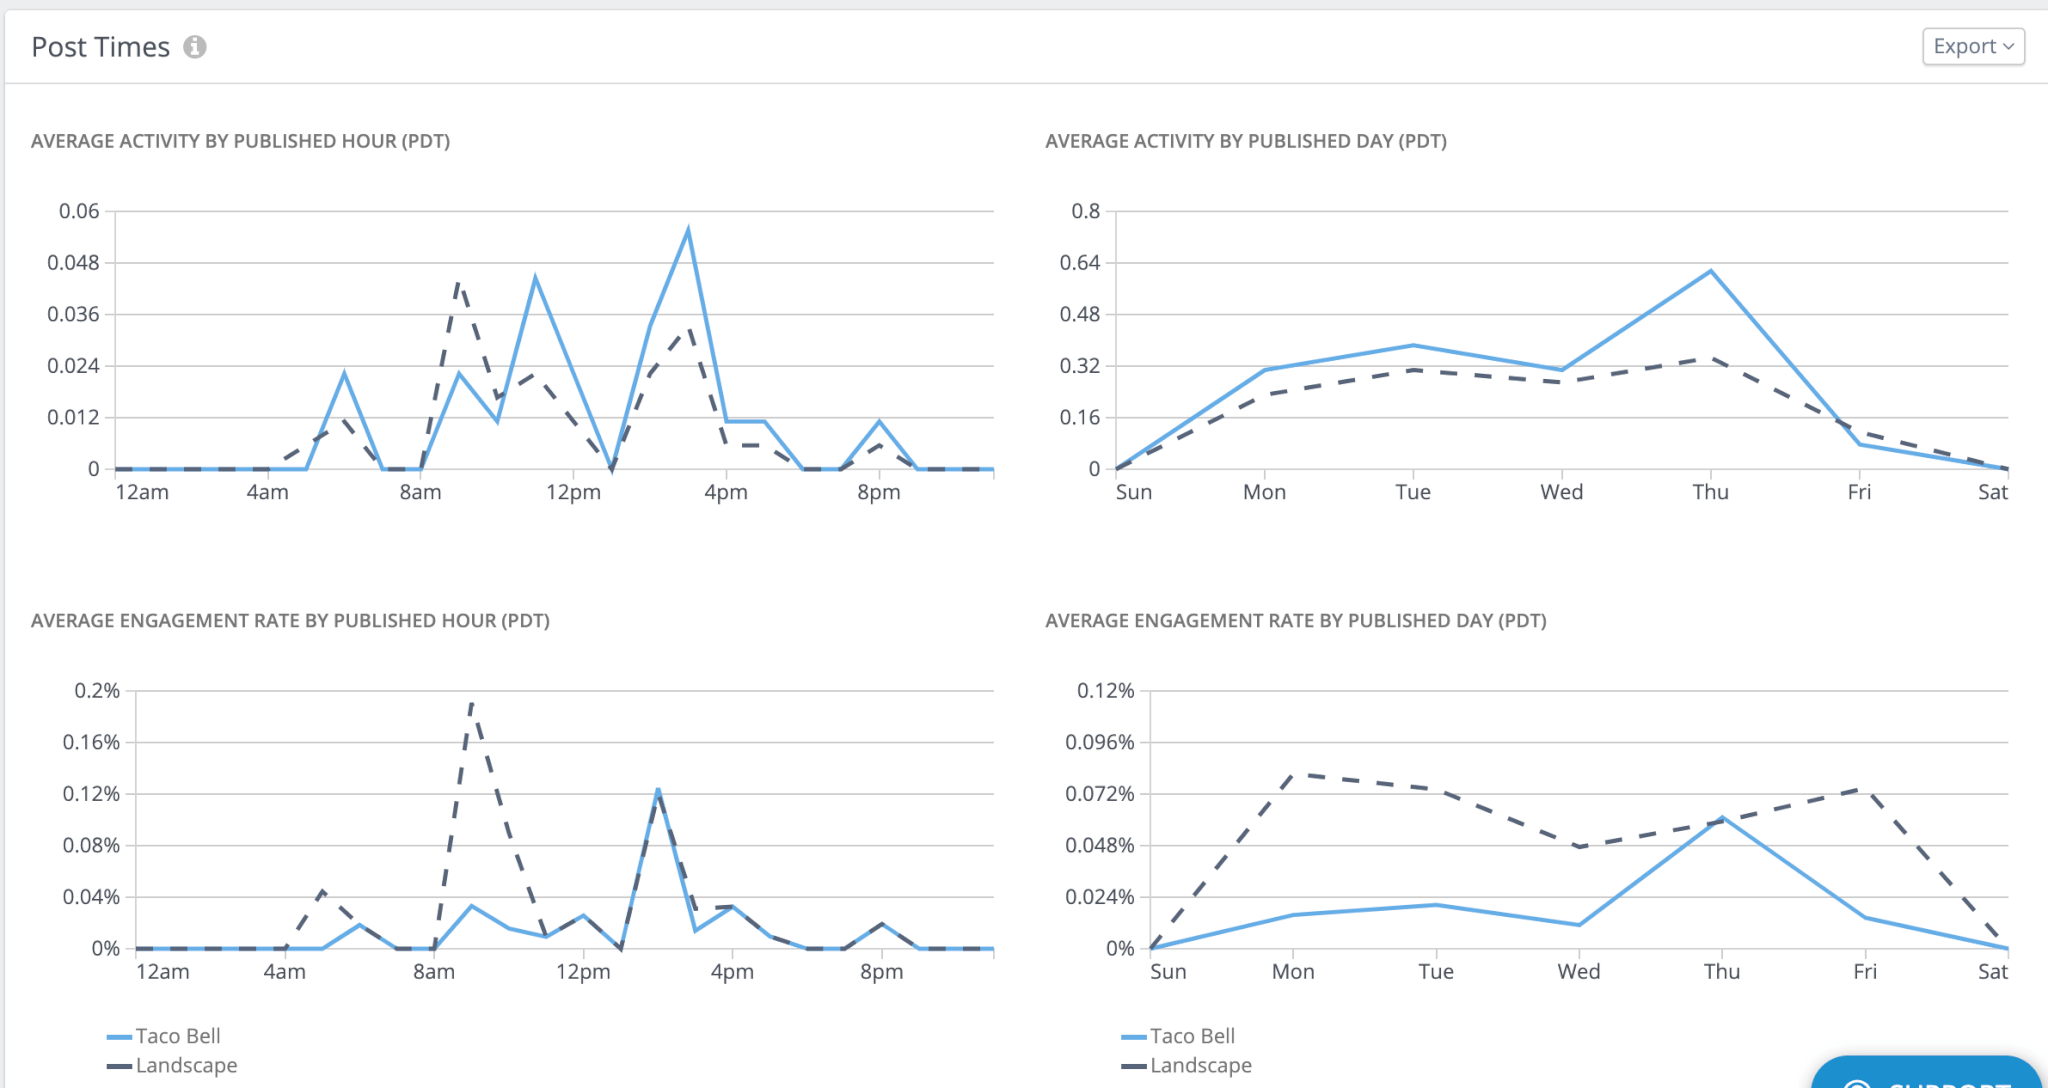
Rival IQ tells you your post engagement rates, which types of posts perform best on your page, how many posts you publish per day, and the average activity generated by this content. You can also compare your performance (blue line) to your competitors’ posting schedule (grey line) to see if there’s a better time to reach taco fans.
As we can see here, Taco Bell performs best between 5 AM and 8 AM PST (which is around mid-morning on the East Coast). Additionally, their busiest posting day with the best engagement rates is Thursday. Using Rival IQ you can use this data to acknowledge your strengths while visualizing the gaps in your Facebook social strategy.
Find the best post types for your brand
The beauty of social metrics is the insights you gain regarding everything that works best for your brand, including post types. Are videos, images, or text posts your best bet? These are the kinds of questions you can answer using Facebook Insights and Rival IQ.
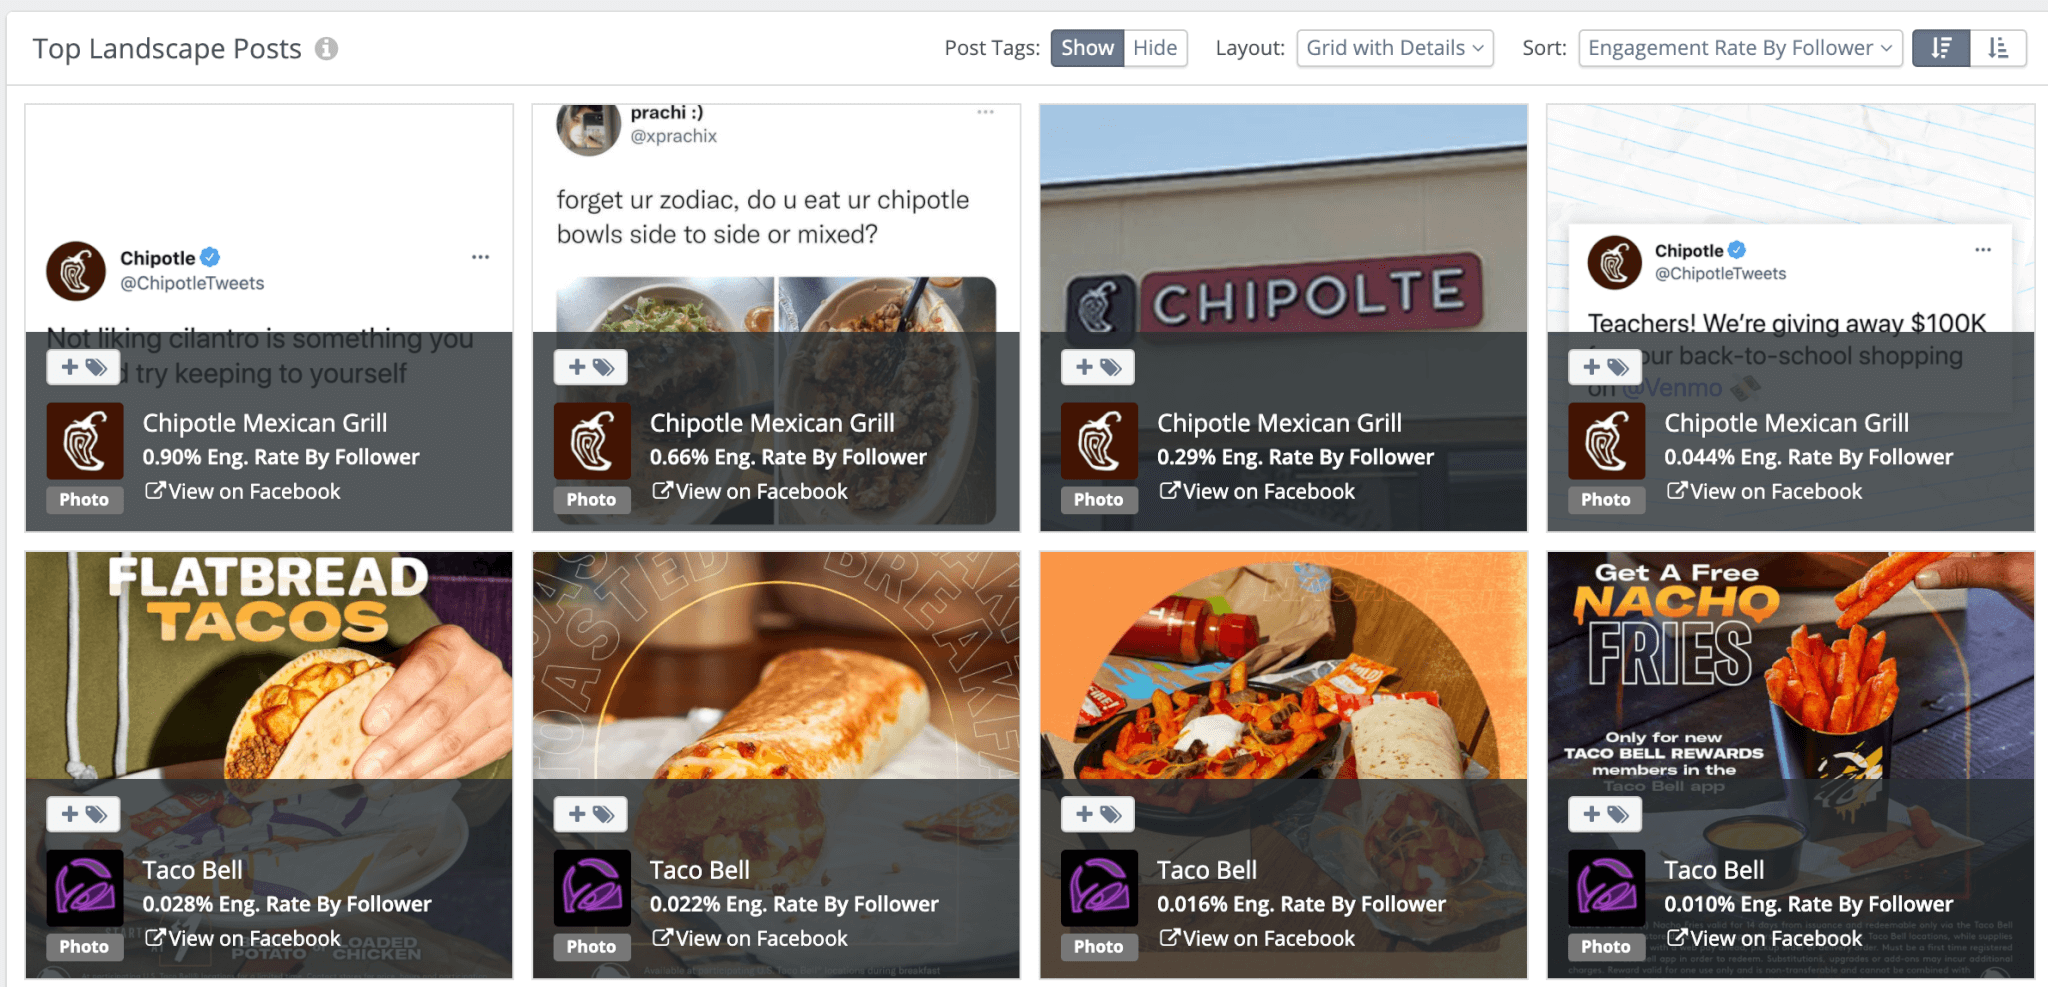
For example, as you can see in the image below, some of the most engaging posts from Taco Bell as of late were image-based, versus the lower engagement text-based posts.
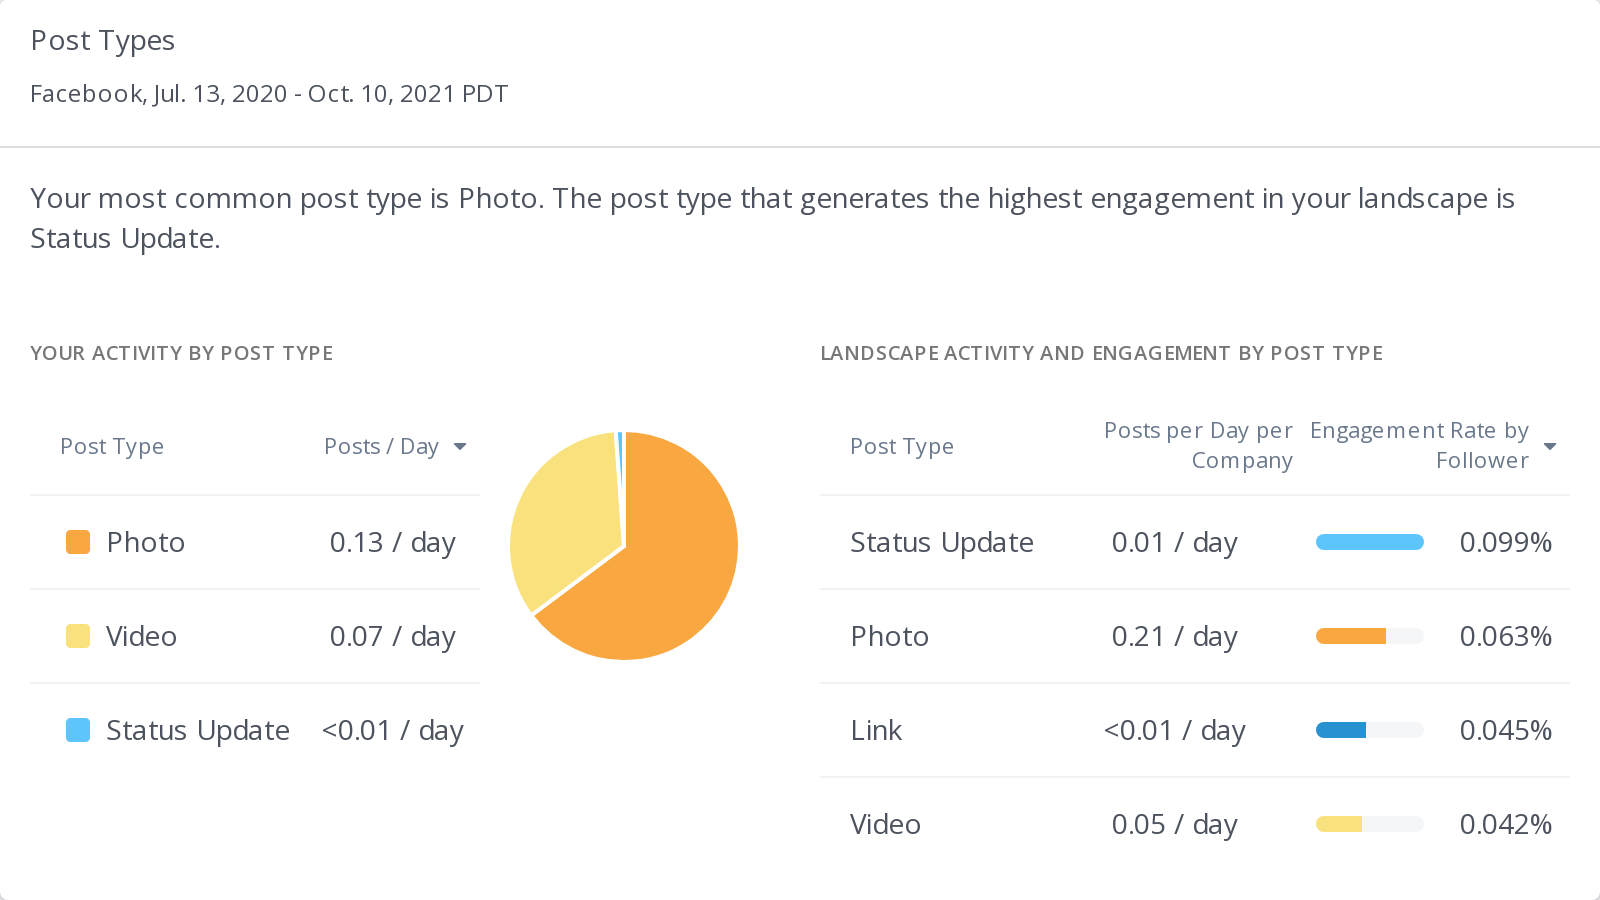
Using the metrics in your Facebook audit you can use insights like these to build a content strategy that performs best on your page and eschew efforts that are more than likely wasted.
Conduct hashtag research
Believe it or not, hashtags are still a thing on Facebook, yet their usefulness is dubious when compared to Instagram and Twitter. While Facebook Insights doesn’t provide any meaningful insights into your use of hashtags, Rival IQ compiles a list of your best-performing hashtags under the “Social Posts” tab, as such:
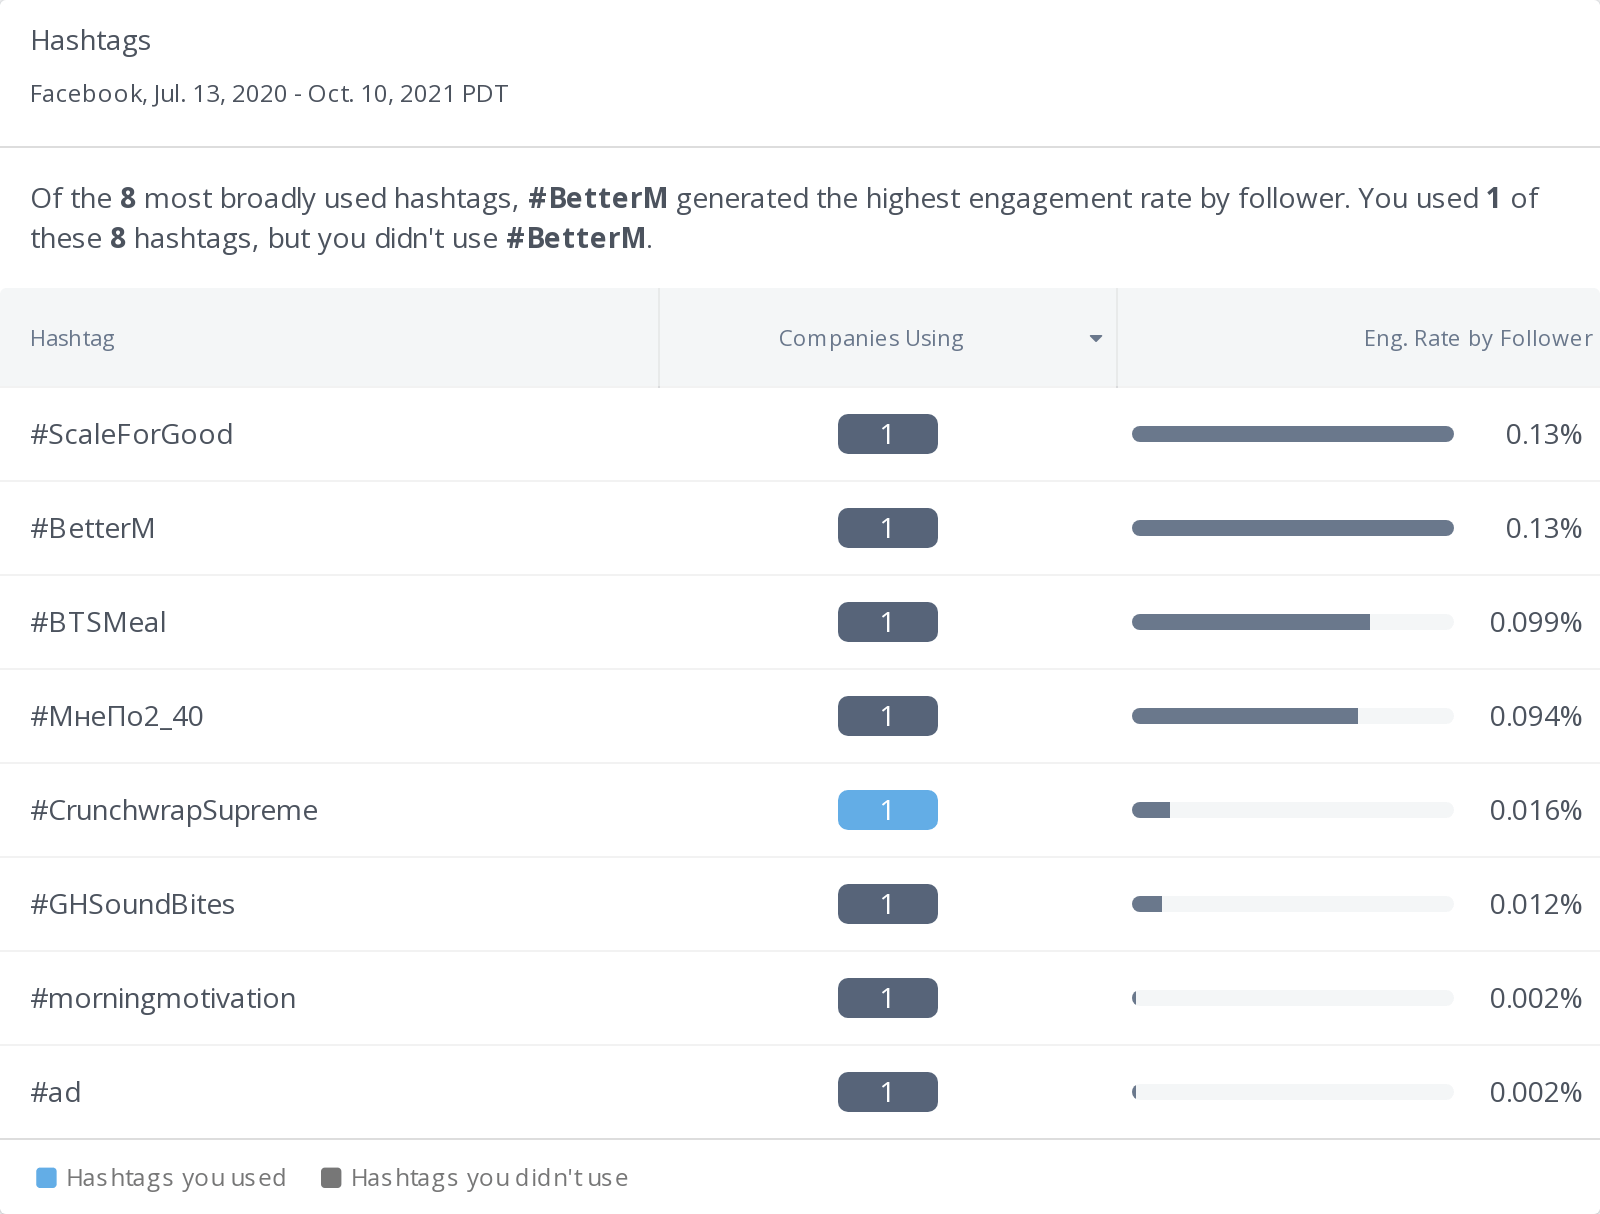
This is just an example of how your insights can provide you with useful information, even if that information is unexpected. One might think that hashtags would boost engagement rates, but in this case, it seems that the opposite is true.
Whatever the case, your analytics will help guide your hashtag strategy going forward once your Facebook audit is complete.
3. Evaluating your performance: Comparing metrics with competitors
Your brand isn’t the only one vying for the attention of millions of users. That’s why it’s crucial to not only evaluate your brand but to stack it up against your competitors to see what they’re doing right and emulate their success into your own Facebook strategy. But how do we do that?
Comparing with Facebook
When it comes to measuring yourself against your competitors, Facebook Insights leaves you with a whole lot of nothing. Well, almost nothing.
This is it. This is all that Facebook Insights will give you in terms of comparative data of your competitors. The rest of the digging is up to you and even then the findings aren’t particularly helpful. You can manually inspect other competitors’ pages to see the post frequency as well as the likes, comments, and shares for each post.
For everything else, you’ll need a third-party tool to gather all of this information to make inferences about your performance versus the competition.
Comparing with Rival IQ
Lauren Teague, along with her co-host, Seth, pull these metrics in Rival IQ in lesson 3 by plugging in the relevant companies as we discussed before. Using the public data tools in the Rival IQ menu they can find the top post metrics for Microsoft and their competitors, so that’s exactly what we’re gonna do for Taco Bell and their upscale competitor, Chipotle.
If we select “Facebook” under “Competitive Public Data” we can see that Chipotle holds the top four spots for post engagement over Taco Bell in the time period we selected.
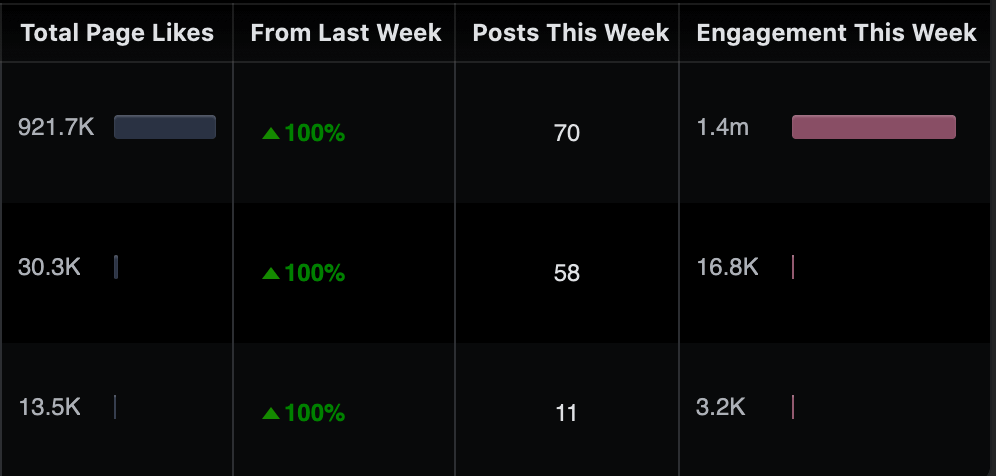
Rival IQ also provides you with generalized insights into your performance versus the competition. As you can see below, Rival IQ provides tips to increase engagement rates in the overview section under the Competitive Data Analysis.
In both instances of posts per week and the number of fans, Taco Bell is in the lead, but if I were managing their Facebook account I would take their advice to post at least once per day, rather than a little over once per week. Lauren and her co-host measured the success of Microsoft’s Facebook account and found similar results. Microsoft, while ahead of its competitors in terms of followers and posting frequency has room for improvement in terms of that frequency.
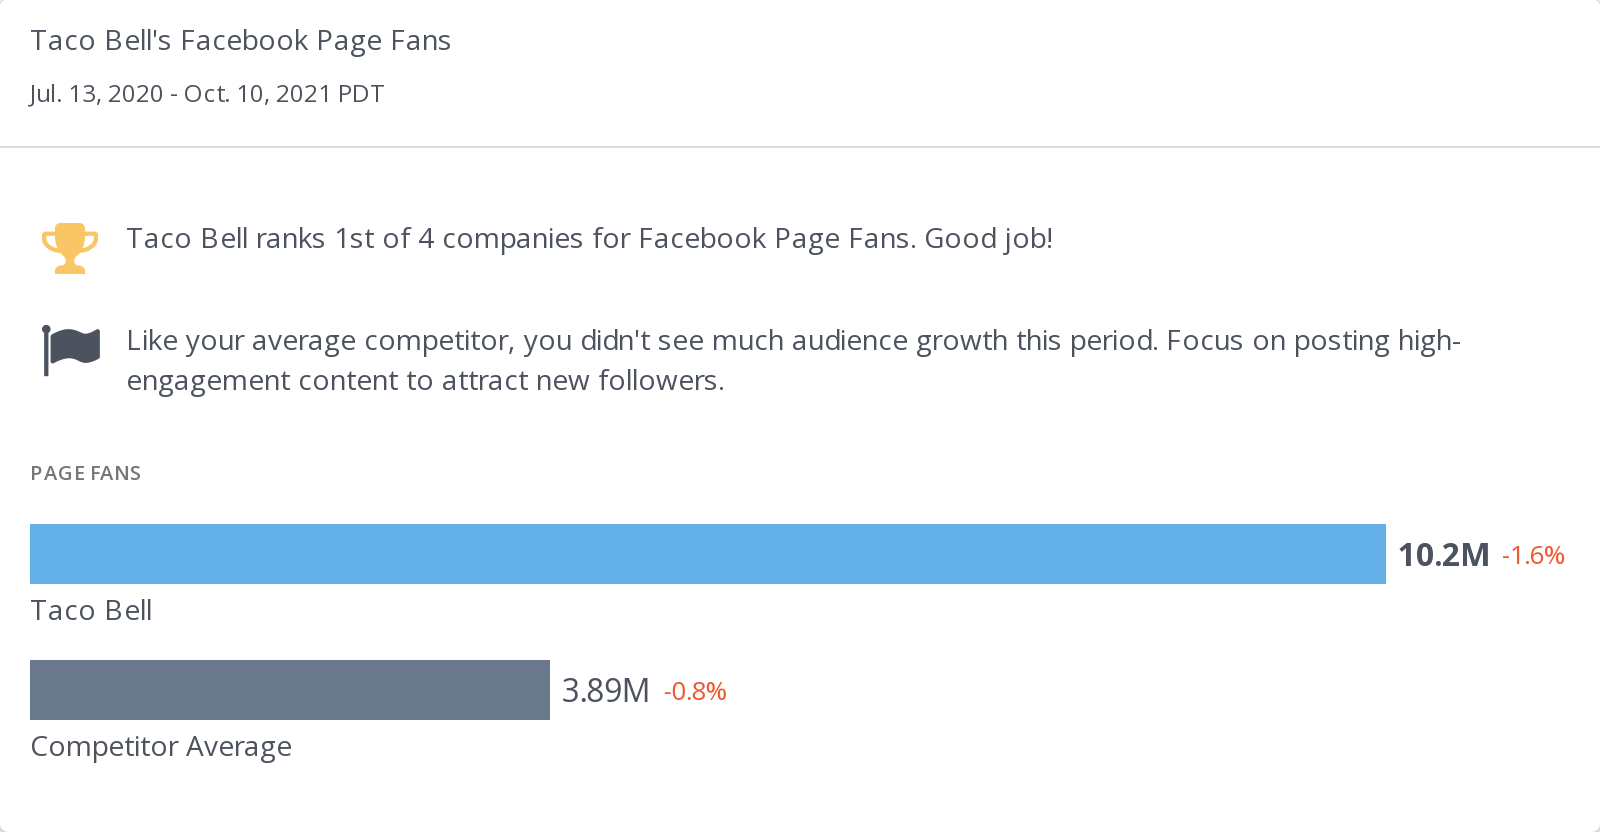
Rival IQ will help you compare all kinds of metrics against your competitors, including followers, post frequency, engagement rates, activity, tags used by competitors, most successful post types, and URLs used by other brands. Not only will you see what works for your brand, but what works well for others as well.
4. Quick post-Facebook audit wins
Now that you’ve done all of the heavy lifting for your Facebook audit, it’s time to make the outlying fixes to your page that’ll help optimize your page.
Scan your brand page for easy fixes
These are easy changes your brand can make in just a matter of minutes while you wrap up your Facebook audit. Let’s finish off on an easy note.
Checklist of simple fixes:
- Create a Custom URL: Facebook allows your brand to create a custom URL for your page. Rather than relying on a randomly generated string of numbers and letters, it’s always easier for your audience to find your page with a memorable, brand-specific URL like: https://www.facebook.com/YourBrandNameHere.
- Add Business Information: Does your Facebook page include useful business information, such as your address, phone number, email, links to your website, and other relevant means of contact? If not, this is a simple fix that’ll up the professionalism of your brand page.
- Create a Call to Action: Facebook gives your brand the ability to create a CTA button right on your page, whatever it might be. CTA button options include: Learn More, Shop on Website, Contact Us, Start Order, Follow, Book Now, and many others.
- Choose a Page Category: Choosing the right page category will help your audience understand the intent of your brand and what they can expect to find on your page.
- Complete Your About Section: Fill in the “about” section on your Facebook page. Drop-in some unique details about your brand and what makes it special.
- Pin an Important Post: Do you have some important information to share? Make sure it isn’t lost to the feed of posts you put up on your page. Pin it to the top of your page to make sure users can find it.
- Make Sure Your Profile is Verified: This establishes your business as the genuine article in a sea of pretenders. Ensure that your page is the official face of your brand by verifying with Facebook. Once you’ve verified your page, you can apply for the coveted blue checkmark.
Just because these fixes are easy, doesn’t mean they aren’t important. These are the little changes your page can make to take your brand to the next level. Sometimes it’s the little things you miss that sink the success of your social media strategy.
Evaluate your brand visuals
Now, auditing the visuals of your Facebook (your profile picture, your banner photo, and the images you share on your page) is a more involved process than just deciding that they look pretty. It’s important that all of the visual aspects of your Facebook page are the correct size and are consistent with your brand. Additionally, there are some Facebook best practices to adhere to when developing new material for your page, so let’s get into it.
These are the optimal sizes for images on Facebook:
- Profile Picture: 170 x 170 px
- Cover Photo: 851 x 315 px
- Portrait Photo: 630 x 1200 px
- Landscape Photo: 1200 x 630 px
- Story Photo: 1080 x 1920 px
It’s so important to adhere to these optimal sizes for a few reasons. First, these sizes ensure your photos won’t distort or lose quality in any way when posting them on Facebook. Second, these sizes will also prevent Facebook from cutting off parts of your images.
Additionally, we recommend using PNG file types when uploading images to your Facebook profile. JPG files tend to distort or pixelate due to the lost information every time they are saved, while PNG files are better suited for the platform as a lossless compression file, leading to higher-quality images. When auditing your images, make sure you’re adhering to all of these standards and fixing those that don’t.
Outside of these standards, evaluate your visual branding. Does it convey the purpose of your page and brand? Are all of the fonts, colors, and designs in line with your brand guidelines? Are there any outdated images, messages, or products on display?
Perhaps this is a good opportunity to consider a redesign. Maybe a new logo or change in color scheme might freshen up your brand. Auditing your visuals on Facebook or any social channel for that matter gives you the chance to reassess your strategy and make any improvements or updates to your styling.
Putting your Facebook audit to work for you
Once you’ve completed your Facebook audit for your brand it’s time to put your findings to work. Lauren Teague’s Social Audit Course will give you additional tips and insights on how to get the most out of these findings, especially in lesson four. Trust me, you won’t want to miss out!
Additionally, if you have any thoughts on our suggestions, feel free to find us on Twitter to share your feedback. We’d love to hear from you!