For nearly two decades, Twitter has been a place where ideas could spread. When you tweet, your thoughts could reach all around the world. And that’s been a boon to social media managers looking for new audiences for their brands.
But Twitter has been undergoing a few turbulent years with its new ownership and platform changes. According to our Social Media Industry Benchmark Report for 2023, posting frequency declined by 20% on Twitter throughout 2022. Surprisingly, while Instagram had a 30% dip in engagement, Twitter’s engagement rates were flat.
Twitter may be changing, but it doesn’t seem to be going anywhere just yet. With so many changes on the horizon, paying attention to your Twitter strategy is crucial. What worked a few years ago may no longer be the best way to capture your audience’s attention. These Twitter metrics can help you stay on track and continue to grow.

Start analyzing your Twitter metrics with Rival IQ.
Start your free trialDifferent Types of Twitter Metrics
1. Follower Growth
Follower growth refers to how many new people started following you over a period of time. You want to track follower growth to ensure that you’re trending upward. Are you gaining more followers than you’re losing?
2023 has been a tumultuous year for Twitter. According to a Pew Research survey taken in spring 2023, 60% of U.S. adults who had used Twitter in the past year said they took a break from the platform. The same survey also found that a quarter of current or recent Twitter users said they didn’t intend to be on the platform in a year. So, perhaps it’s no surprise that follower growth for many is either stagnant or on the decline.
In a list of some of the top coffee brands in the United States, the only brand that experienced growth since the start of 2023 was Dunkin Donuts. The brand gained 21,900 followers, while all other companies lost followers.
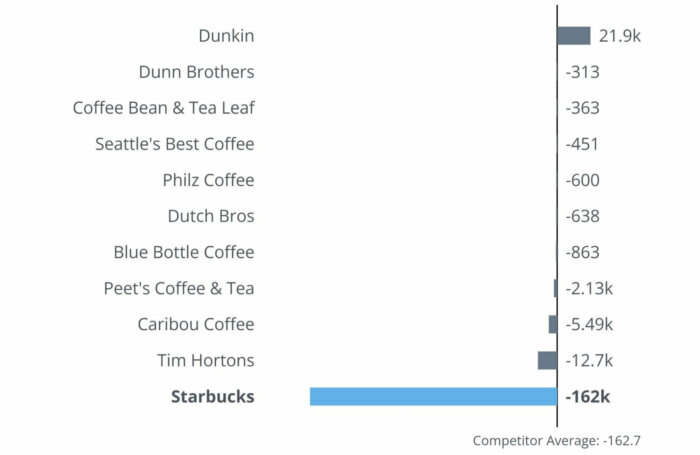
It’s beneficial to look at follower growth through the lens of your own growth and your competitors’. Dunkin’ may not feel like 21,900 over the course of nine months is worthy of celebration, but when you consider that they were the only major coffee brand experiencing growth, they may see things differently.
2. Reach
Reach refers to the total number of people who see and engage with your post. You might expect that your follower count and reach rate would be equal, but that’s generally not the case. Your followers won’t see all of your tweets, nor will they engage with them all. Your content is competing not only with all of the other content on Twitter but with all of the posts, videos, and Stories on other apps like Instagram and TikTok.
One of the key takeaways from our industry benchmark report was that engagement rates are down on Instagram, Facebook, and Twitter. One of the biggest reasons why? It’s primarily because organic reach is down. If no one sees your tweet, they can’t interact with it. Organic reach refers to the people who see your post when it’s not paid to be promoted. On many of the top social media apps, like Twitter, more and more promoted content is taking over feeds, making it harder to find the posts from people you’re actually following.
While you can’t control that reach rates may be declining on Twitter, you still want to take a plummeting reach rate seriously. Tweets are prioritized on users’ feeds based on whether Twitter believes that the tweet will interest them. If you’re seeing continuously low reach rates, it may be a sign that you need to switch up your content because Twitter seems to believe your followers don’t care for it.
Reach is a private metric on Twitter, but you can do some deducing on Rival IQ to get an idea of what kind of reach your competitor is getting. Perhaps Starbucks is your biggest competitor. Their best-performing post of the past 30 days, between August 16 and September 12, was simply a picture of the date August 24 carved into a pumpkin, signaling the start of their fall beverage offerings.
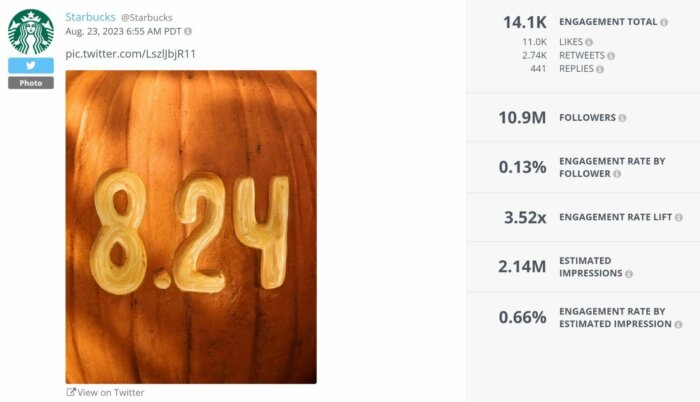
The tweet earned 11,000 likes, 2,740 retweets, and 441 replies. Assuming that some people may have done two of the three or all three actions on the post, the tweet must have reached at least 11,000 people.
3. Impressions
Now, let’s consider the above post in terms of impressions instead of reach. As you can see on our analytics page, the same Starbucks tweet has an estimated impression count of 2.14 million. So, why is there such a huge disparity between the reach and impressions?
These two metrics often get confused with one another, but there’s a distinct difference. While reach refers to the number of people who see and engage with your post, impressions are defined by the number of times your content is seen.
When you share a tweet on Twitter, your audience may view it multiple times. These impressions might happen unintentionally, but it can also be your fan’s choice to see the content over and over again. Perhaps it’s a video that they want to watch a few times. Or maybe it contains important information that they need to remember. When your content is being viewed repeatedly, it might suggest that you have a highly-invested audience.
So, while reach is an essential metric to understand whether Twitter thinks your content is valuable, impressions can tell you if your followers and fans themselves think your tweets are meaningful and important. For this reason, it’s essential to track both reach and impressions to help you optimize your content.
4. Engagement Rate
Engagement on Twitter comes in many forms, including likes, retweets, and replies. When you calculate your engagement rate, you can break it down in multiple ways. But we often look at either the engagement rate by follower count or the engagement rate by impressions. In the first case, you’re dividing the number of engagements by the number of followers. In the second, you’re dividing by the number of impressions.
Because your follower count and impression count can often greatly differ, you should choose one form of engagement rate and stick with it instead of comparing the two forms to each other on different tweets. Otherwise, you may end up with an inaccurate depiction of your engagement.
As we’ve already discussed, engagement rates are down across the biggest social media platforms, Twitter included. If you’re seeing increasing engagement rates across your tweets, you’re faring better than many other companies on Twitter. It’s beneficial to look at not only your own engagement rate but also the rates of your competitors to set benchmarks and get an idea of what a good rate looks like for your industry.
Say you’re launching a new coffee brand. You might want to take a look at the engagement rates of the top tweets from your major coffee brand competitors. The top three tweets from the past 30 days belong to Dunkin’ and Dutch Bros.
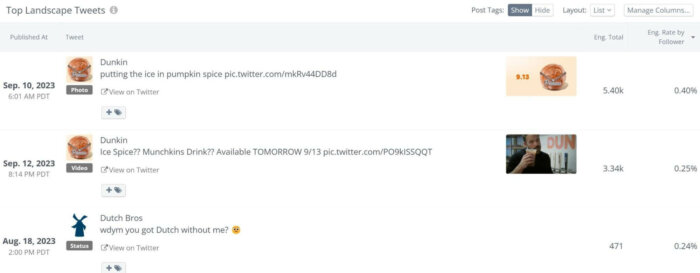
Dunkin’ earned the top two spots with announcements regarding their new collaboration with rapper Ice Spice. The first garnered an engagement rate of .40%, while the second scored .25%. Dutch Bros. earned .24% by asking a simple question: “[What do you mean] you got Dutch without me?”
These numbers can help you understand what you should be aiming for to compete with them on Twitter. You might also use these top tweets to get an idea of the type of content that coffee fans want to see. Judging by these high engagement rates, it seems that collaborations and questions can help you gain more likes, replies, and shares across the social media platform.
5. Mentions
As you might have guessed from the name, mentions refer to when someone mentions your brand on Twitter. Mentions don’t follow one set format. You might receive a mention when someone directly tags your brand, but they can also happen in other ways. Someone might make a tweet about your brand or simply talk about your company in an exchange with another Twitter user.
Mentions can be positive, negative, or neutral, but you want to pay attention to the good and the bad. A good mention can be turned into positive publicity for your company.
However, a negative mention can be equally as beneficial. When you receive many negative mentions discussing the same topic, you may want to take the comments to heart. These mentions can help you tackle bad publicity in its tracks, giving you the ability to pivot your marketing to address problems before they grow.
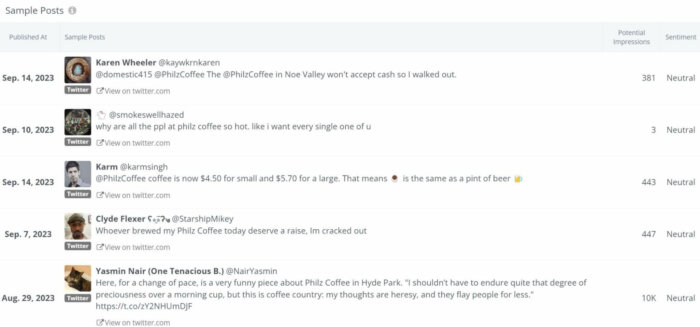
When we use our Instant Search feature to see who is talking about Philz Coffee, we can see that the coffee brand has many fans, but the conversation around Philz isn’t all positive. While some talk about the cost being too high, others have comments about a cash-free policy in one of their stores. This mention about the cash-free policy may be one Philz would want to pay attention to, especially if they’re unaware that any of their stores had set such a policy. Addressing this mention could allow Philz to set the record straight and regain a fan.
6. Post Volume
Post volume refers to the number of tweets containing your mentions. Like mentions can be positive, negative, or neutral, a high post volume doesn’t have to be good or bad. More posts mean that more people are seeing your brand online, which could be a good thing for your publicity or a sign of a growing issue.
Your own tweets only go so far. Not even all of your followers will see your tweets. But when you build up your online fanbase, they become your cheerleaders. The more people are talking about your brand beyond your own Twitter account, the more likely your brand will be able to grow on the platform. This cycle helps you beat out your competitors as the biggest brand in your industry on Twitter.
Let’s take a look at how many times Kodiak Cakes, one of our top health food brands on social media, is doing on Twitter according to our social listening features. According to our Instant Search feature, 766 posts have been written mentioning Kodiak Cakes in the past 30 days.
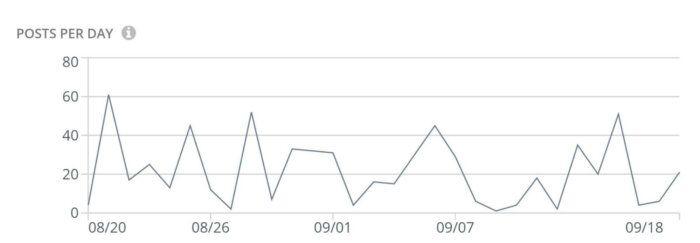
Those posts received 73 million impressions. For some comparison, the estimated impressions for the brand’s top tweet of the same time period was only 1,070. This disparity just goes to show how much having an engaged fanbase on Twitter can help with brand awareness and getting your name out there online.
7. Sentiment
Let’s dive deeper into Twitter’s social listening metrics. Sentiment informs you of whether or not your mentions are singing your praises or telling you about an issue. Your sentiment can be positive, negative, or neutral.
For Kodiak Cakes, their sentiment was a whopping 81% for the mentions from the last 30 days. So, what’s been making their fans so happy? Judging by our Sentiment Drivers by Type word cloud, which pulls together the top most-repeated words in the brand’s mentions and determines if the phrases are positive or negative, the brand’s fans are quite happy with Kodiak Cakes’ nutritional value.
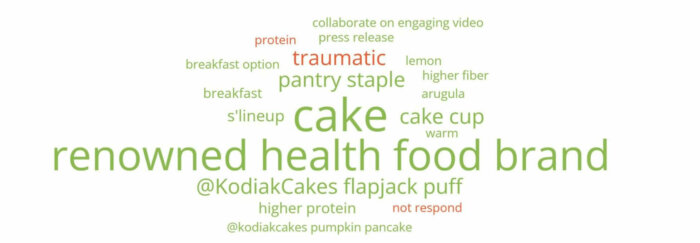
Top words include “renowned health food brand,” “pantry staple,” “higher protein,” and “higher fiber.” It also seems that fans are happy that pumpkin season has returned, as they appear to be excited about the brand’s pumpkin pancake mix.
By being knowledgeable about what their fans want to see, the brand can adjust their marketing to address what these mentions are talking about. If fans want to see more pumpkin, for instance, Kodiak Cakes might want to lean harder on their pumpkin-themed marketing this fall.
8. Hashtag Performance
Hashtag performance defines how well a hashtag is doing on Twitter in terms of reach, impressions, and engagement. When you use hashtags on Twitter, you’re helping categorize the content. That way, someone can simply search for the hashtag and Twitter will understand that your content relates to what they’re searching for.
If you’re using branded hashtags, whether they be a particular phrase or simply your brand name, you’re helping spread awareness of your company on Twitter. And the more other people use those hashtags, the more your brand will get out there.
But you might also want to use more general hashtags to help categorize your content. If you’re a makeup company, for instance, you might want to use hashtags like #crueltyfreemakeup, #naturalmakeup, or other phrases that relate to what makes your makeup unique. Paying attention to how hashtags are doing on Twitter can help you understand which ones are the best to use on your own posts.
In keeping with the idea of beauty content, let’s take a look at what happens when you use our Twitter Discover feature to look at how #skincare is doing on Twitter. While the hashtag gets 19.5 tweets per hour with 672 unique users tweeting with it, the posts only get an average engagement rate of .006%.
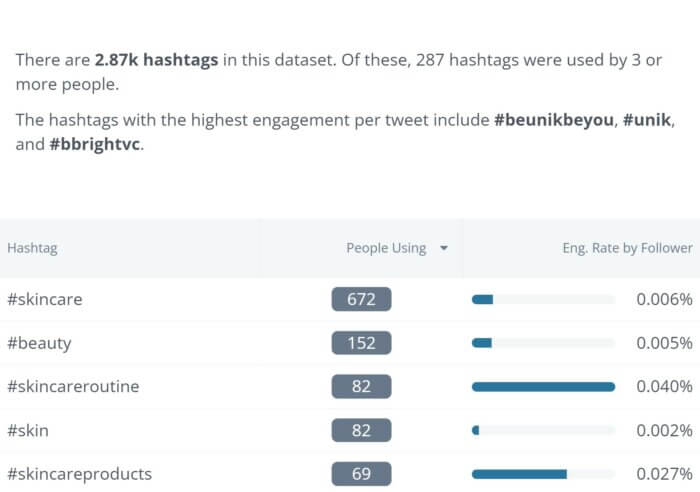
With the Twitter Discover feature, you can take a look at Coincident Hashtags to see what other hashtags are used alongside this one. You might get some ideas about different tags to use instead. For instance, #skincareroutine may be used less often, but it scores an average engagement rate of .04%, 6.67x the average engagement rate of posts with #skincare.
How to Analyze Your Twitter Metrics on Twitter
Twitter’s analytics page gives you a general overview of how you’re performing on the platform. If you want a quick peek at how you’re doing this month, go to the left-hand column and click More. It has three dots next to it. From there, expand Creator Studio and click Analytics.
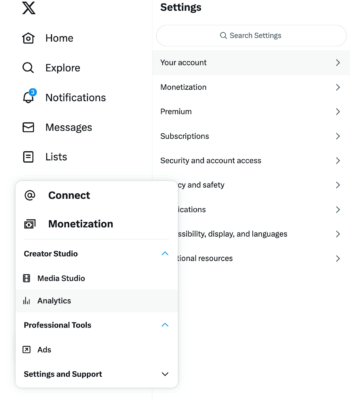
Your analytics page will give you a summary of your Twitter performance over the past 28 days. You’ll see how many impressions your tweets reached and your follower count.
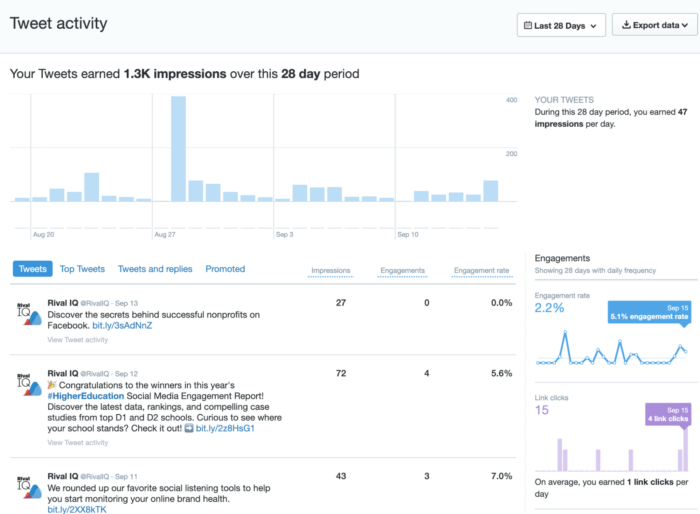
Below that, you’ll also get highlights of your best-performing tweets for the month. You’ll see your Tweet impressions from the past month and how many followers you gained and lost.
How to Analyze Your Twitter Metrics on Rival IQ
While Twitter can give you a basic overview of your Twitter performance, social analytics and social listening features, like Rival IQ’s suite of tools, can help you go much deeper. Let’s start with social listening and look at metrics like mentions, post volume, and sentiment.
Our Instant Search feature can help. In the Social Listening section of the left-hand column, you’ll find Instant Search, which lets you look for mentions across millions of websites, including Twitter, Reddit, and Quora. You can search for more than one term at a time. If you wanted to search for Dunkin’, for instance, you may want to look up Dunkin, #Dunkin, @Dunkin, and Dunkin* to encompass more mentions of your brand.
Or you could search one of our recommended topics. Let’s try Philz Coffee.
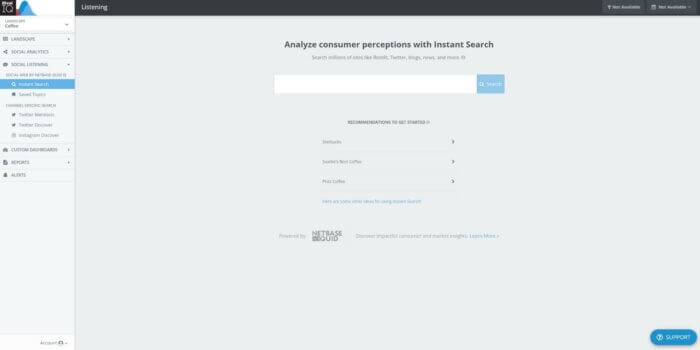
First off, let’s refine our search to focus on Twitter. At the top of the page, select the source you want to look at. Or click the Edit button to refine it even further. Here you can choose the source, include or exclude posts with specific phrases, exclude specific authors, or remove posts for other reasons, such as if they contain profanity.
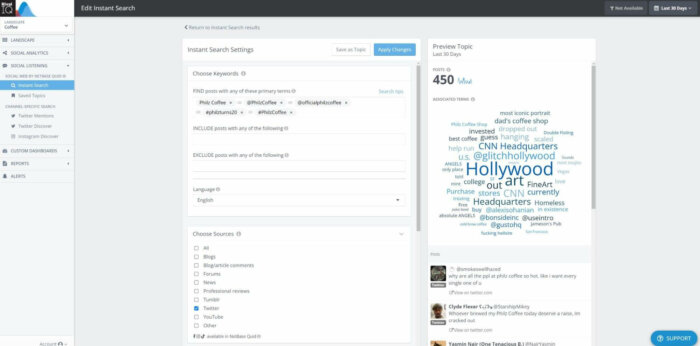
Hit Apply Changes, and you’ll get a look at metrics like your post volume, mentions, and sentiment over the last 30 days. You’ll receive a breakdown of your post volume alongside the sentiment of those posts, the most commonly said words about your brand, the top brands and people mentioned alongside you, the people who talk about you the most, and which hashtags appear in posts about you the most.
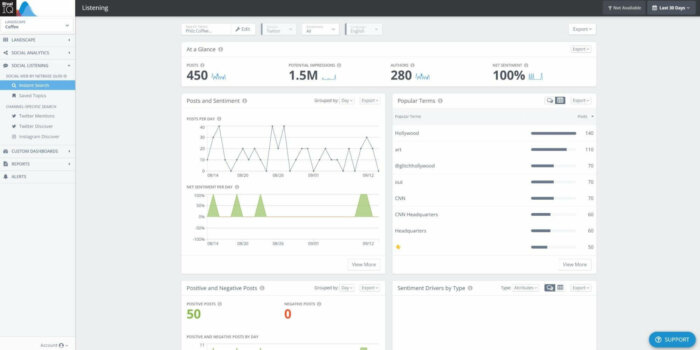
Scrolling further down, you can dive deeper into these social listening metrics by checking out the Sample Posts section. This section will show you the top posts mentioning you, as well as additional information like the post’s impression count and sentiment. You can also see more about specific sections by clicking the View More button.
Rival IQ has several features that allow you to take a look at your social listening metrics. Let’s move on to Twitter Discover.
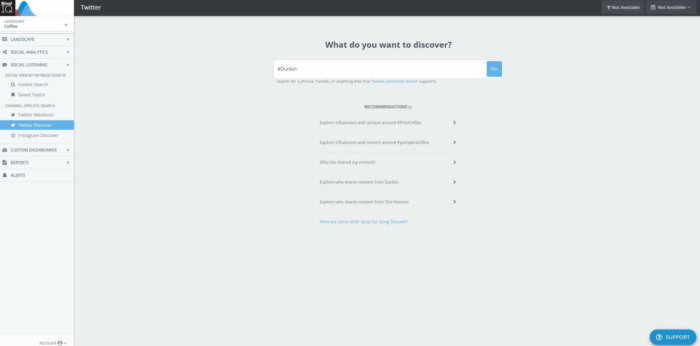
In the left-hand column, expand Social Listening and click Twitter Discover under Channel-Specific Search. Here, you can search for a brand name, hashtag, Twitter handle, or other ways to discover who is talking about your brand. Let’s try searching for people talking about #Dunkin.
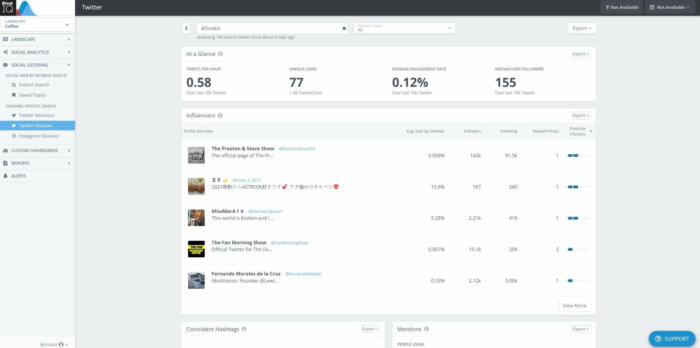
From there, you’ll get a summary of the hashtag, with the number of tweets per hour, how many unique users are tweeting it, the posts’ average engagement rate, and the unique users’ follower counts. You’ll also see who your most influential mentioners are, who you may want to reach out to in order to grow your influencer community. Rival IQ will also provide you with Coincident Hashtags and Common Phrases that turn up in posts mentioning this hashtag.
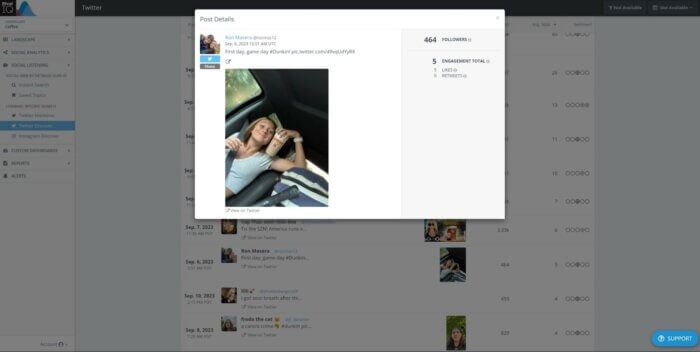
Scroll further down to see the Most Engaging Posts containing this hashtag. You can click out to a specific post to see its metrics.
Now, let’s look at more analytical metrics, like your reach, engagement, and follower growth.
In the left-hand column, expand Social Analytics and click to see just Twitter. Your Twitter social analytics page will populate, and you’ll see metrics like your top tweets over a designated time period, your follower count, how much you’ve tweeted, your total engagement, your engagement rate, and how you perform against your competitive landscape.
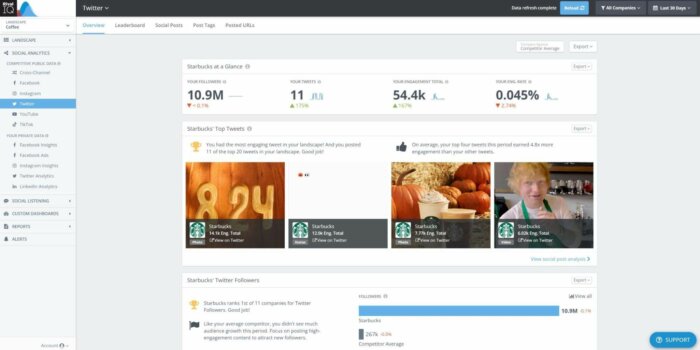
You can click into specific categories to learn more about how you are performing and compare against your competitors. Or click Social Posts in the top bar to dive into analytics on specific posts.
Wrapping Up Twitter Metrics
Staying on top of your Twitter metrics can help ensure that you stay ahead of your competitors. Twitter may be going through a lot of changes, but that just means that you need to stay vigilant now more than ever. What works one day may not work a few months down the road as more changes arise.
With tools like Twitter’s analytics page and Rival IQ’s suite of social analytics and social listening features, you can keep an eye on how the changes affect your metrics. With this knowledge in mind, you can ensure that your Twitter strategy is ready to pivot when need be and reach your audience in new ways.
Want to do a deep dive into your Twitter page? Learn how to do a Twitter audit to get ahead of your competition.
