We’re back with the most comprehensive version yet of our annual Social Media Industry Benchmark Report that studies more than 2,100 of the most engaging brands and companies to analyze what’s really making them so successful on social.
Our biggest report ever features the most important metrics across 14 top industries: Alcohol, Fashion, Financial Services, Food & Beverage, Health & Beauty, Higher Education, Home Decor, Hotels & Resorts, Influencers, Media, Nonprofits, Retail, Sports Teams, and Tech & Software.
This report has everything you need to measure your social media success against your competitors on Facebook, Twitter, and Instagram across these 14 major industries. We also feature tons of insights about how social media engagement has changed over the last year for these industries so you can optimize your strategy in 2020.
As usual, we have channel insights, best post types, Instagram and Twitter hashtags, and more. We also added two new industries (Financial Services and Tech & Software) this year by popular demand.
Now, let’s get benchmarking.
Social Media Benchmark Key Takeaways
| Engagement rates decreased on Instagram, stagnant on Facebook and Twitter The world’s most engaging social channel became a little less engaging this year while Facebook and Twitter managed to maintain engagement levels from 2019. |
|
| Posting frequency is down Brands are posting a little less often on every channel. |
|
| All about the giveaways Contests and giveaways were popular hashtags across almost every industry, so brands should seek out opportunities to engage followers with contests. |
|
| Carousels are key for Instagram Carousels lead to high engagement across all industries, so brands should look for opportunities to combine photos into carousels. Why? Instagram carousels get re-served to users who don’t engage the first time, earning them more impressions. |
|
| Two new industries this year We included Financial Services and Tech & Software for even more social insights for 14 top industries. You might be surprised to learn that Financial Services performs above average on each channel, while Tech & Software is an unexpected Instagram powerhouse. |
All-Industry Social Media Benchmarks
All-Industry: Facebook
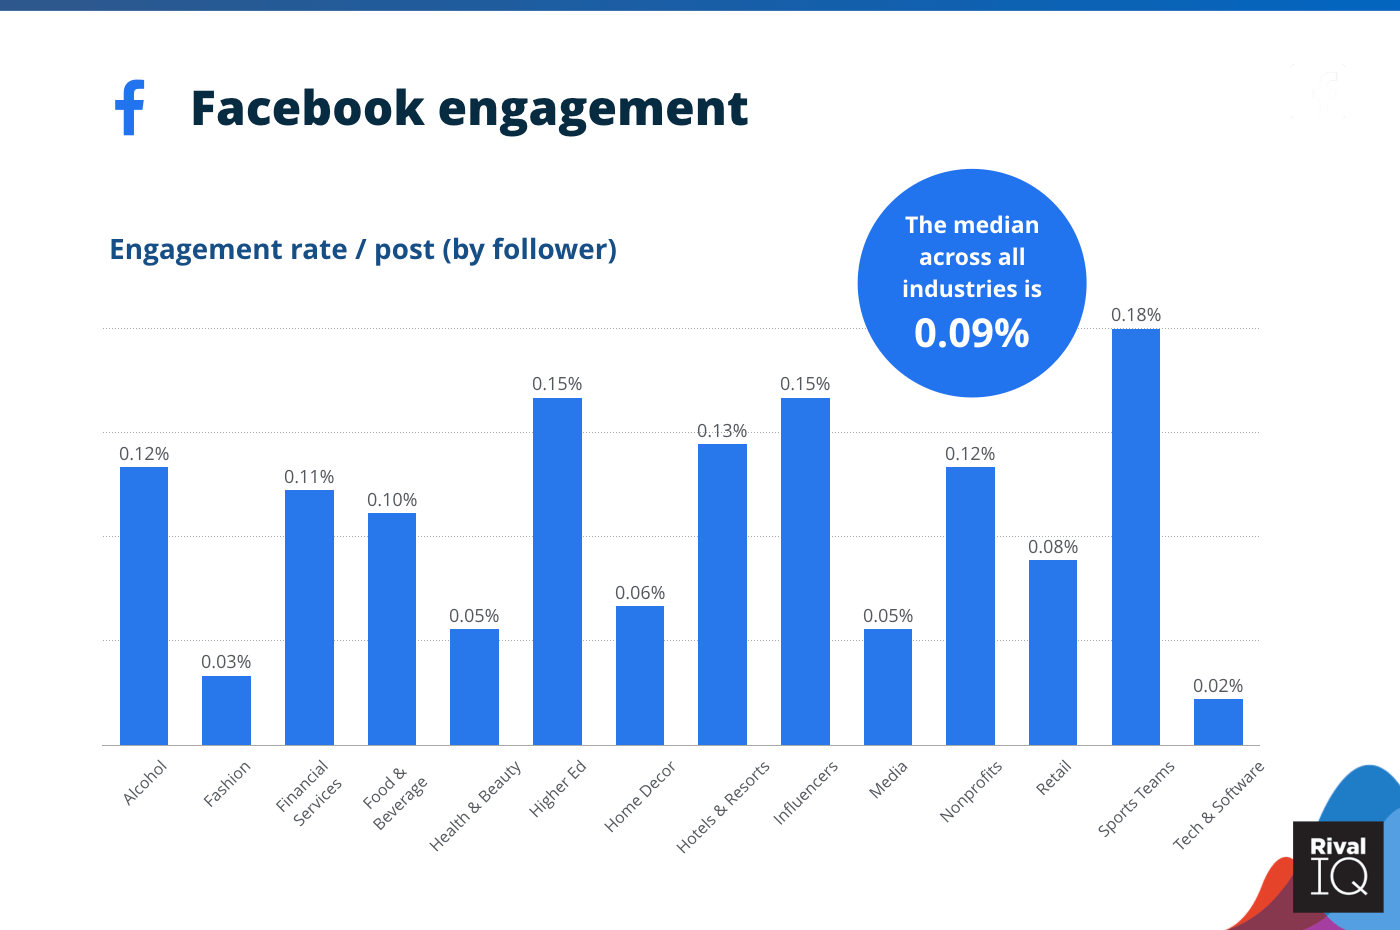
Average Facebook engagement rate per post, all industries
The all-industry Facebook median stayed flat this year, though Higher Ed, Influencers, and Sports Teams were able to make some real inroads here.
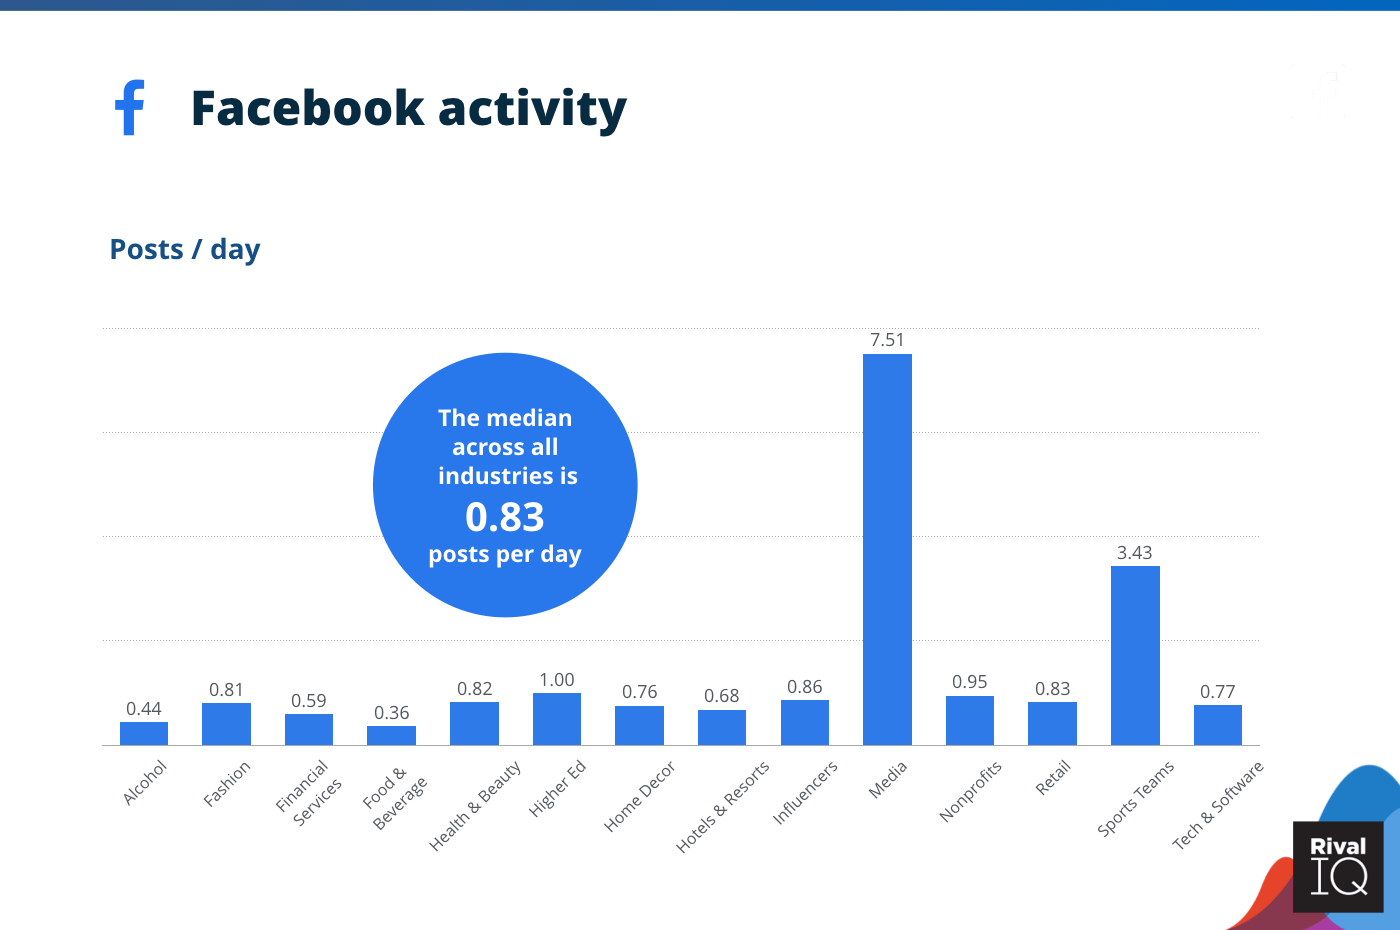
Average Facebook posts per day, all industries
Industries decreased their posting frequency on Facebook by about 14% this year.
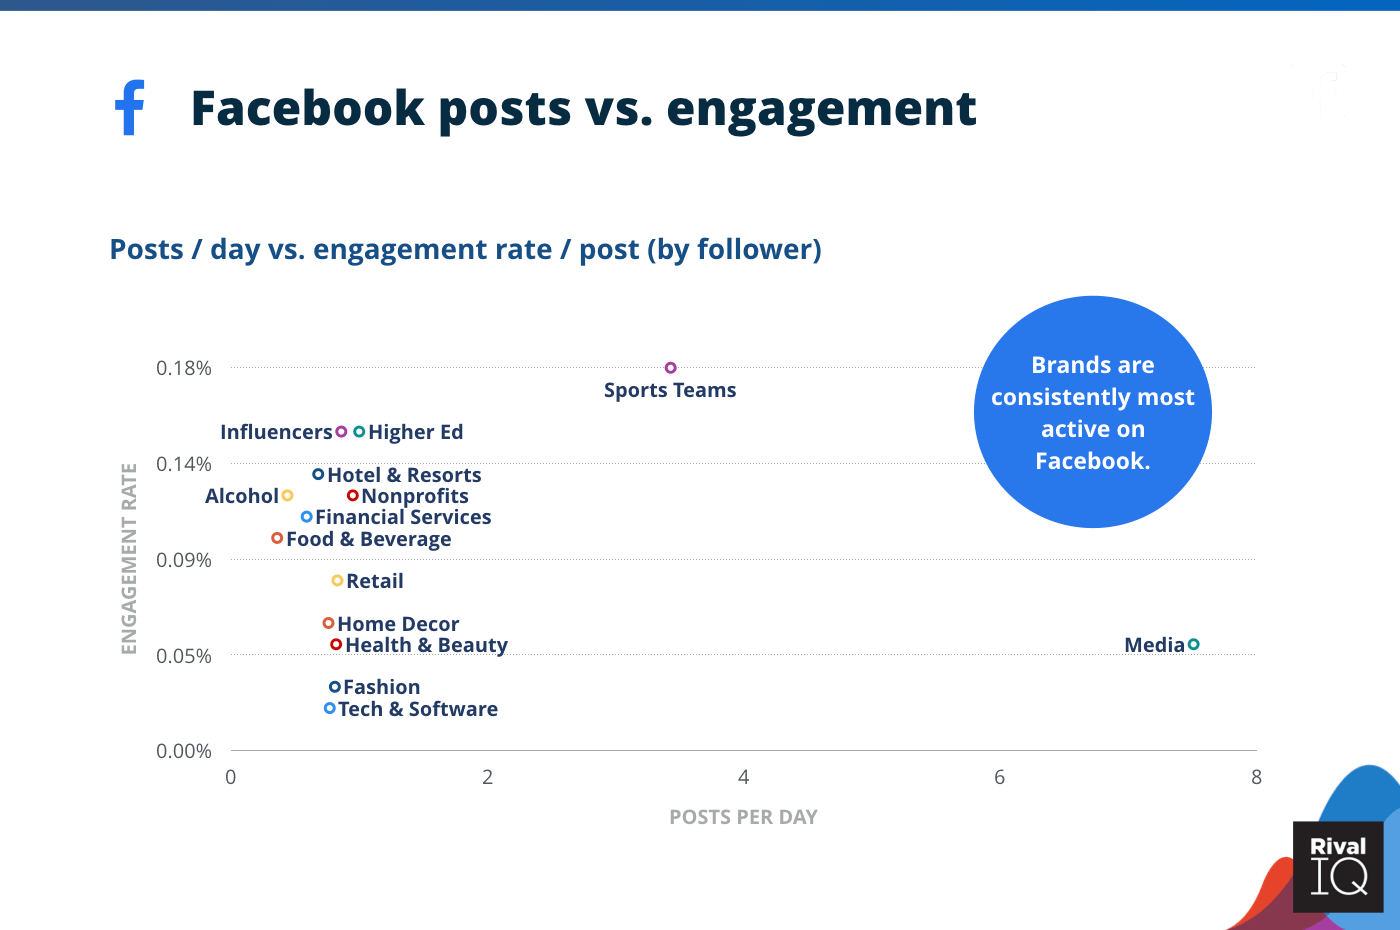
Facebook posts per day vs. engagement rate per posts, all industries
Top Facebook performer Sports Teams posted 2x the median posts per day, but Media’s performance shows that more frequent isn’t always better.
All-Industry: Instagram
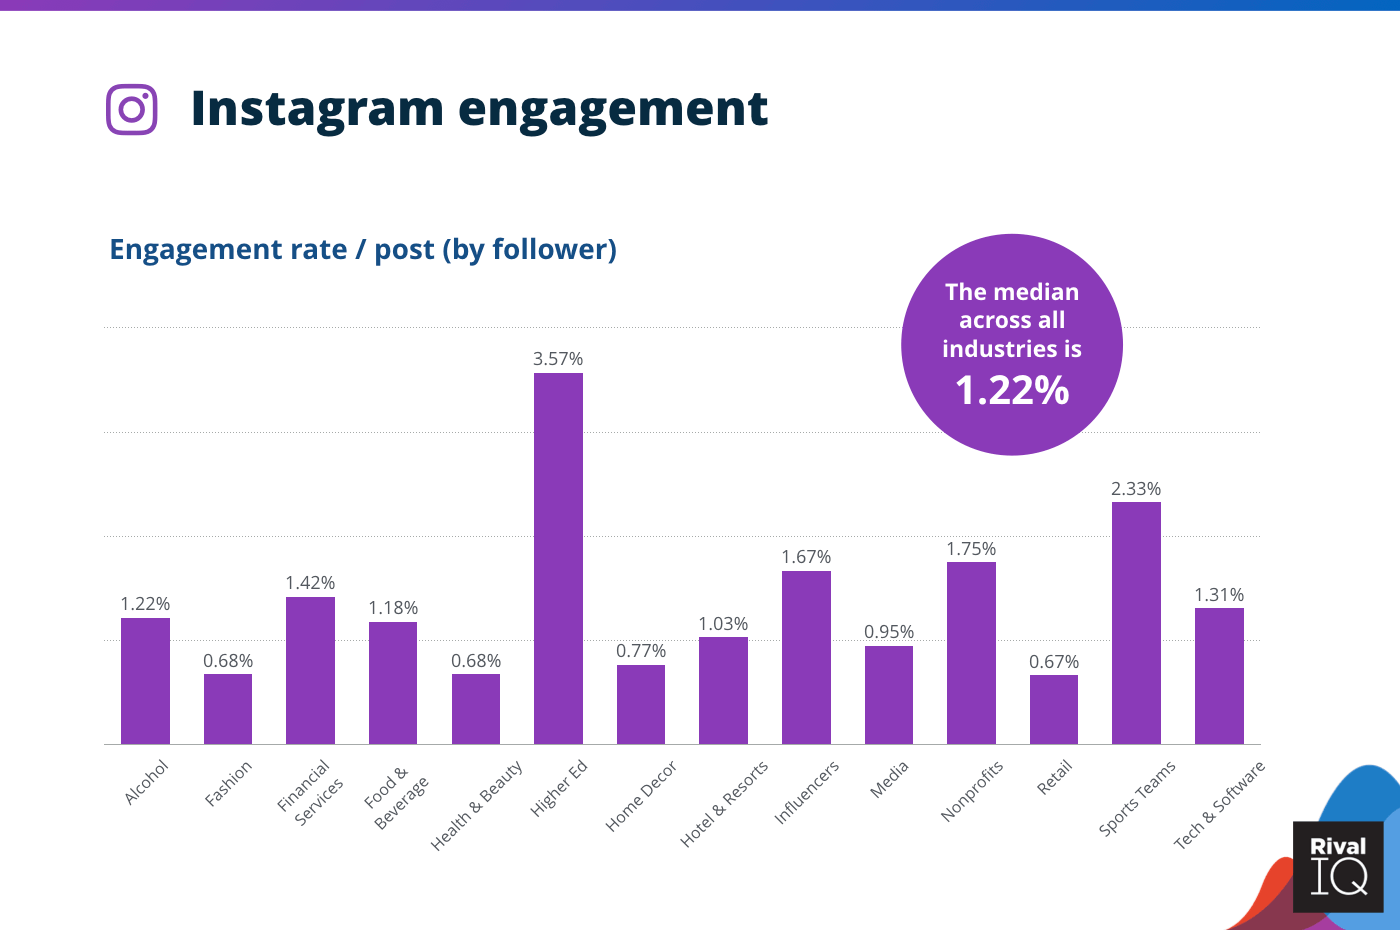
Instagram average engagement rate per post, all industries
Every industry in our study took a hit on Instagram this year, and the all-industry median decreased by 23% from 1.60% to 1.22%.
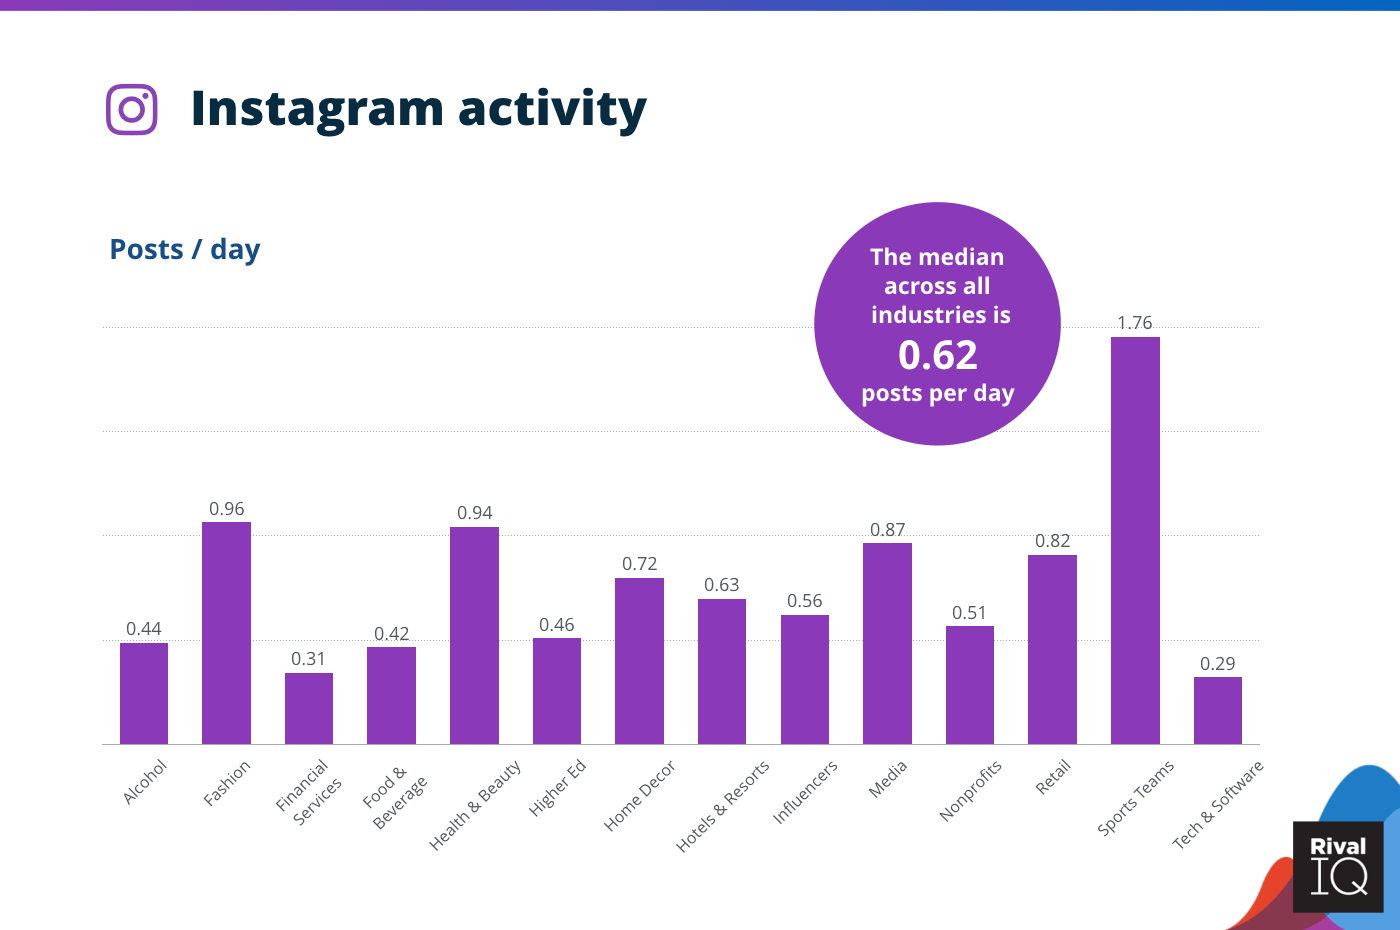
Instagram posts per day, all industries
The median posting frequency across all industries declined by just 5% on Instagram, but top performer Sports Teams actually increased their posting.
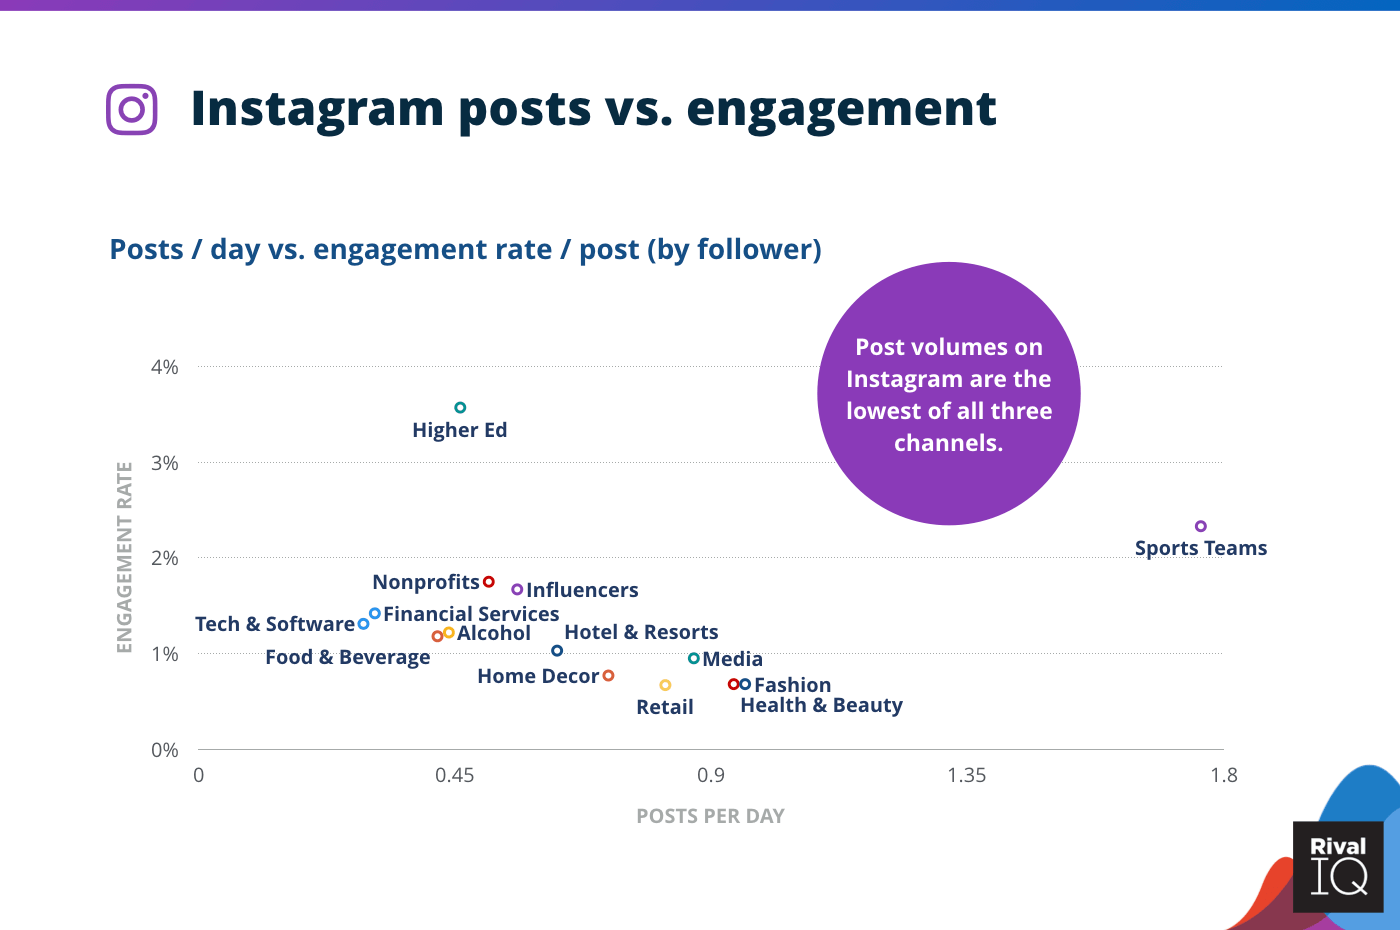
Instagram posts per day vs. engagement rate, all industries
Higher Ed was the clear engagement winner on Instagram despite below-median posting frequency, suggesting more isn’t always better on Instagram (though second-place Sports Teams might beg to differ).
All-Industry: Twitter
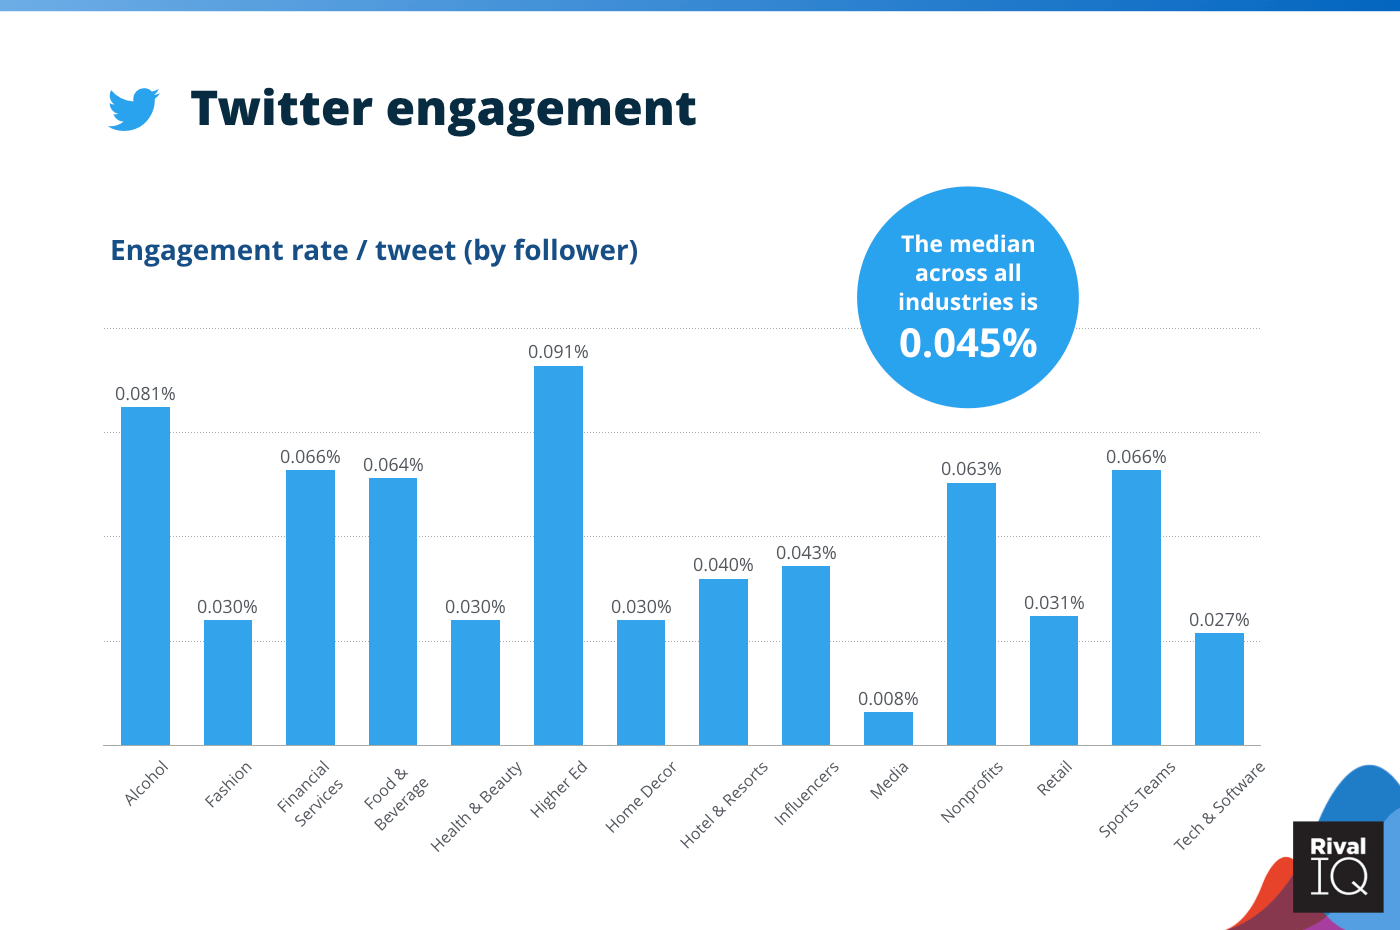
Twitter average engagement rate per tweet, all industries
Twitter engagement remained consistent for the third year in a row, with Higher Ed and Alcohol staying ahead and Media pulling up the rear because of their high-frequency posting.
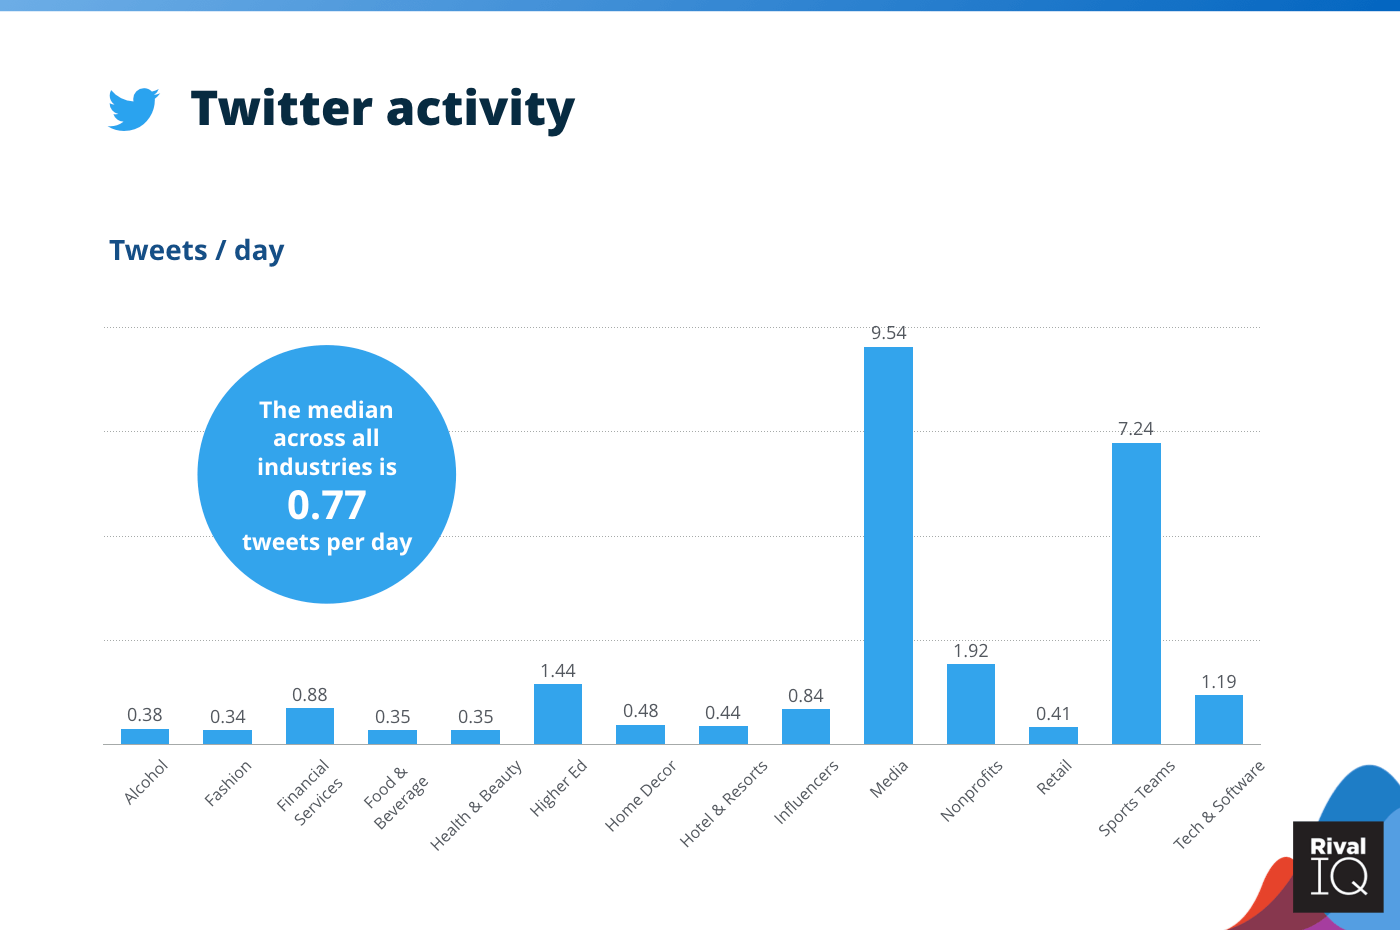
Twitter tweets per day, all industries
Tweeting frequency declined by about 10% this year, with Media and Sports Teams tweeting more than all the rest of the industries combined on Twitter.
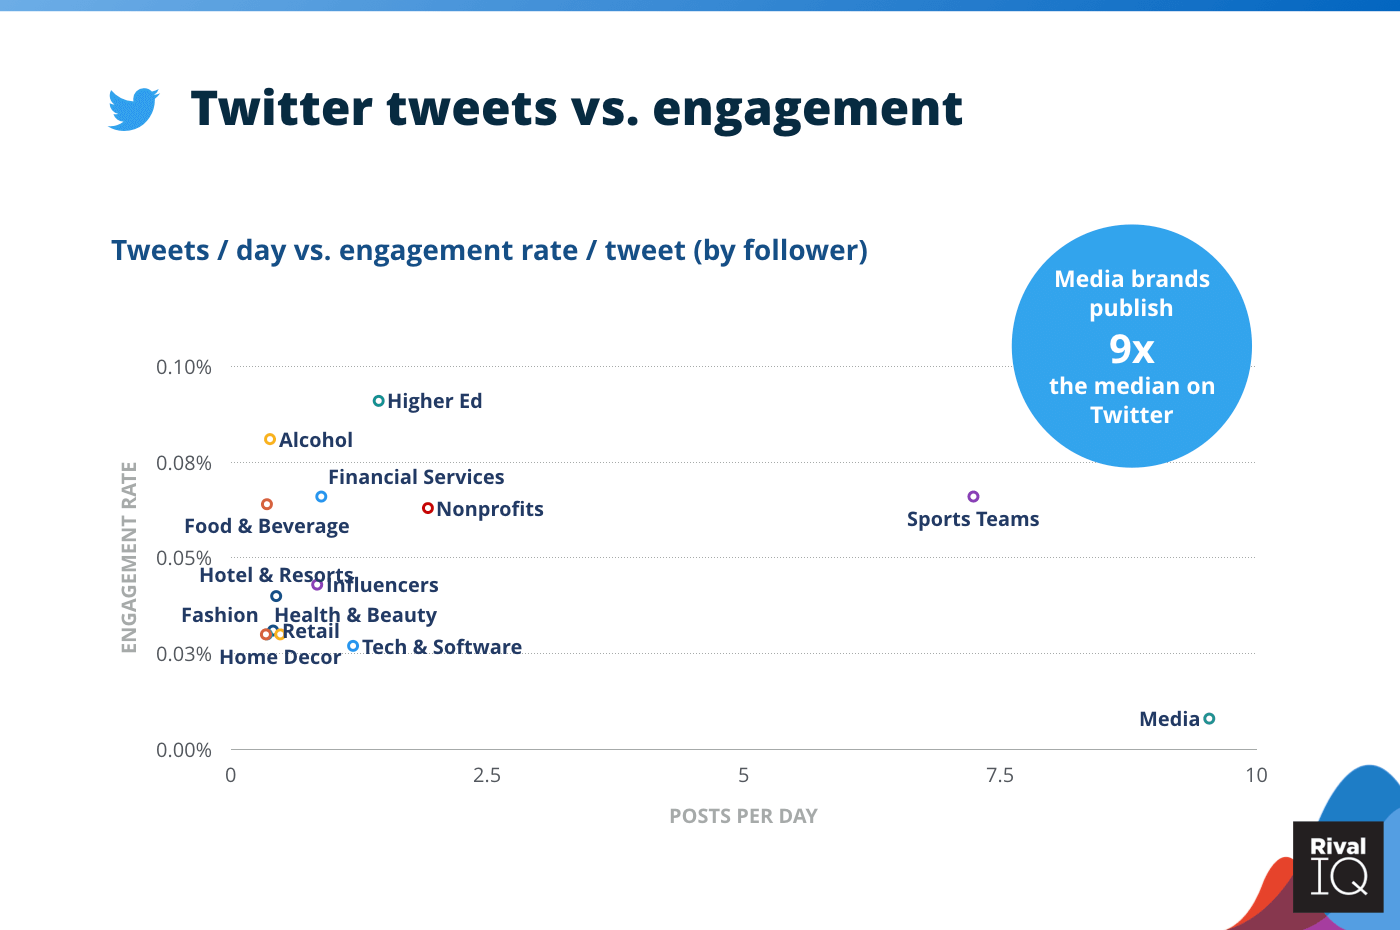
Twitter tweets per day vs. engagement rate, all industries
Higher Ed, Alcohol, and Financial Services managed wins on Twitter without bombarding their followers with above-median tweets per day.
Want to figure out the best time to post on Facebook, Twitter, and Instagram? We’ve got a report for that.
Industry Snapshot: Alcohol
Alcohol brands won the silver on Twitter but were middle-of-the-road on Facebook and Instagram.
A few ways Alcohol brands can keep up the pace:
- Keep favoring photos on Facebook, but be sure to repurpose those on Instagram, especially if you can turn them into carousels.
- Alcohol brands saw high engagement but low posting frequency on Twitter, so consider putting a little more effort into that channel.
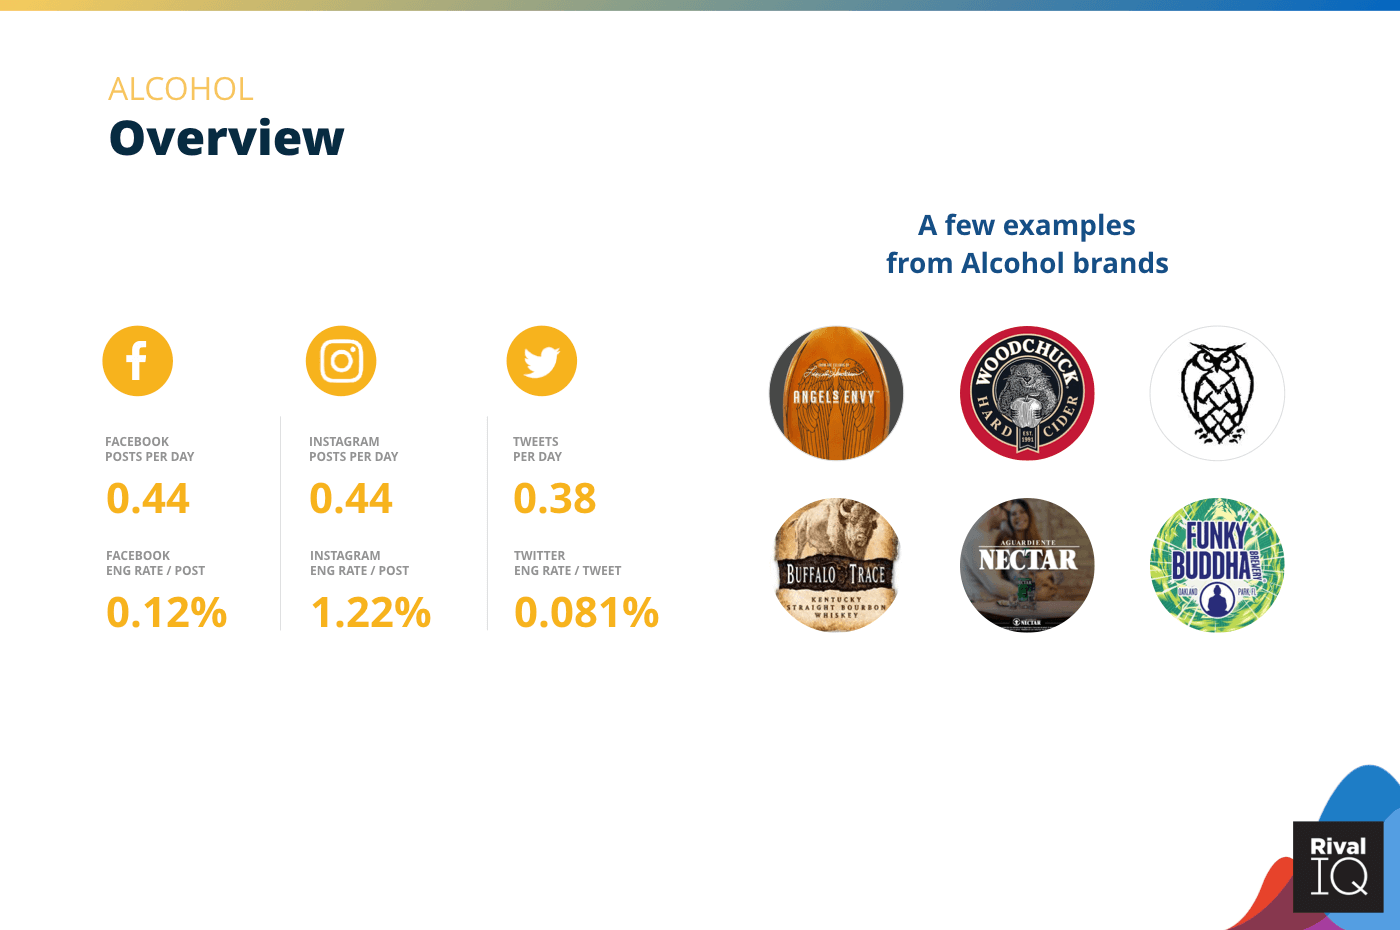
Overview of all benchmarks, Alcohol
Notable Alcohol brands in this year’s report included Angel’s Envy, Woodchuck Cider, Buffalo Trace, Funky Buddha Brewery, Night Shift Brewing, and Aguardiente Nectar.
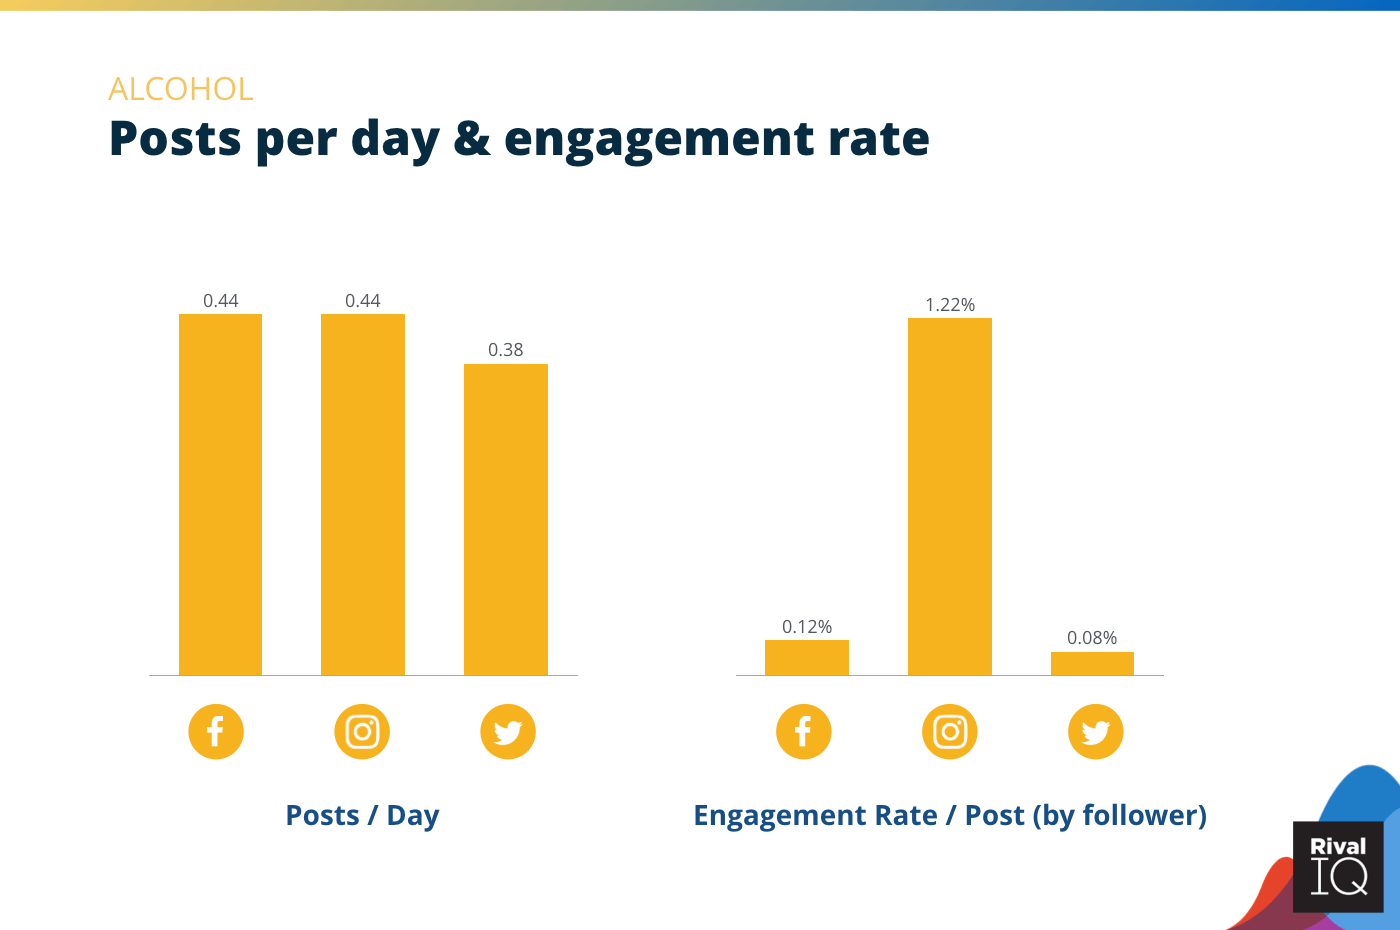
Posts per day and engagement rate per post across all channels, Alcohol
As with all our industries, Alcohol brands saw the most success on Instagram but were still posting pretty consistently across all three channels. Consider repurposing some of that Facebook energy for Instagram.
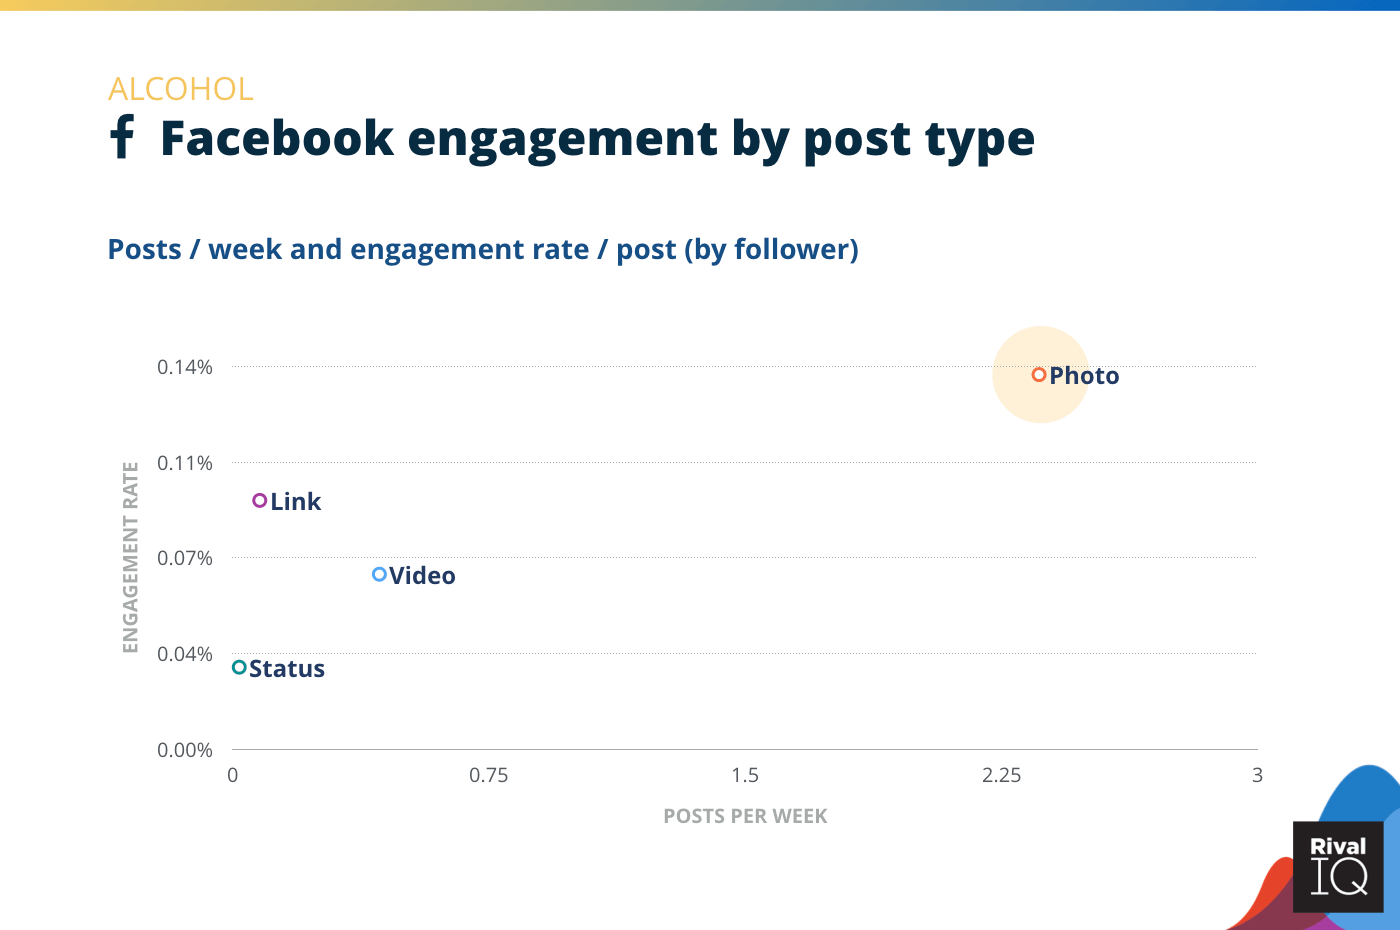
Facebook posts per week and engagement rate by post type, Alcohol
Alcohol brands make the most of photos on Facebook, which are consistently the highest-performing post type on this channel. Top performer Buffalo Trace doubled down on the success of photos paired with short captions for maximum engagement.
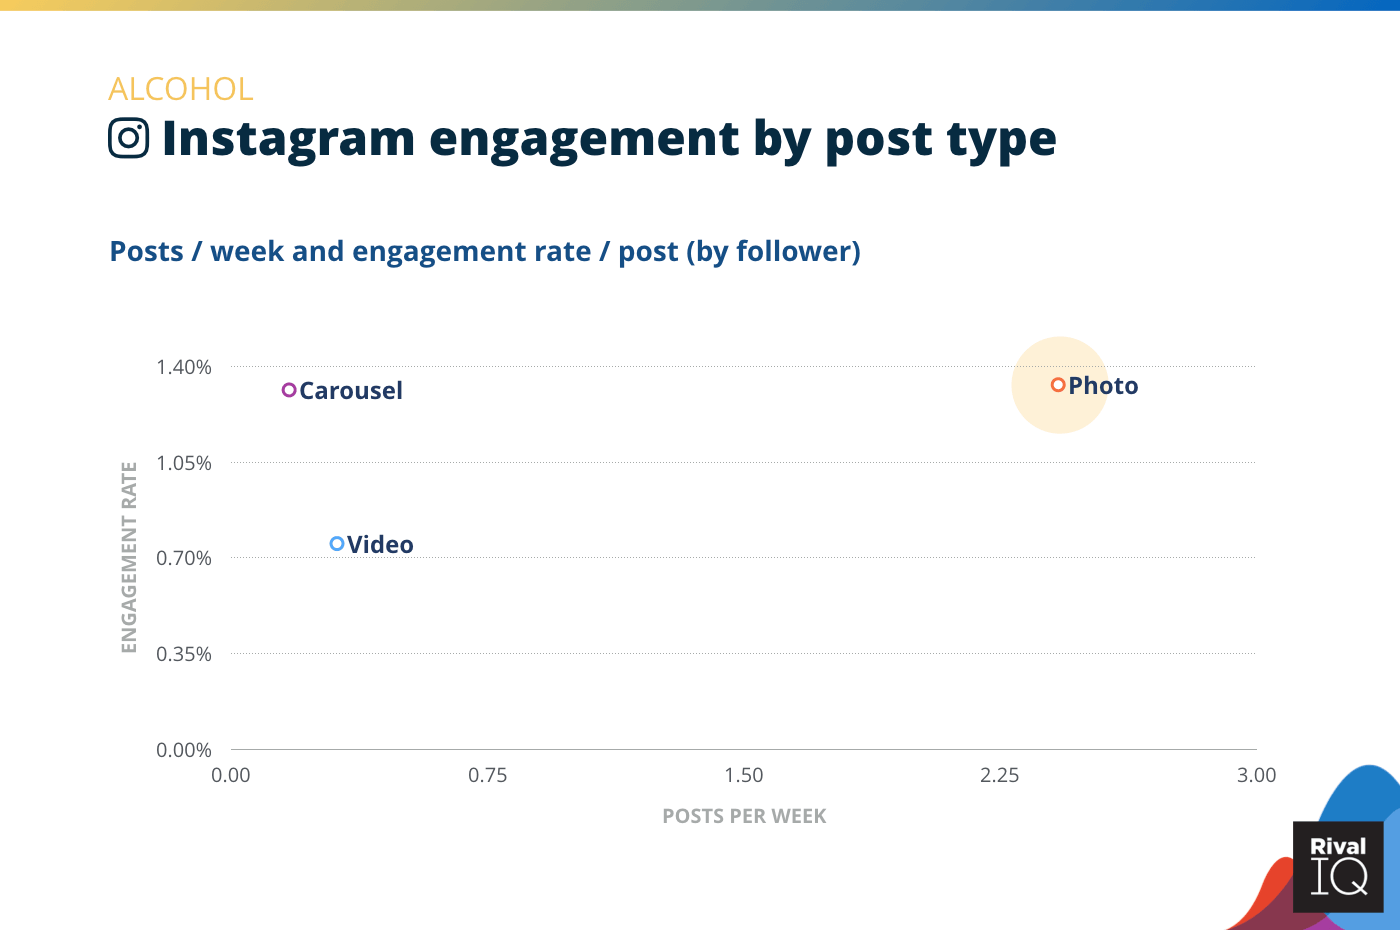
Instagram posts per week and engagement rate by post type, Alcohol
Alcohol brands are more than twice as likely to post photos on Instagram than other post types, but should consider combining a few of those single-photo posts into high-performing carousels.
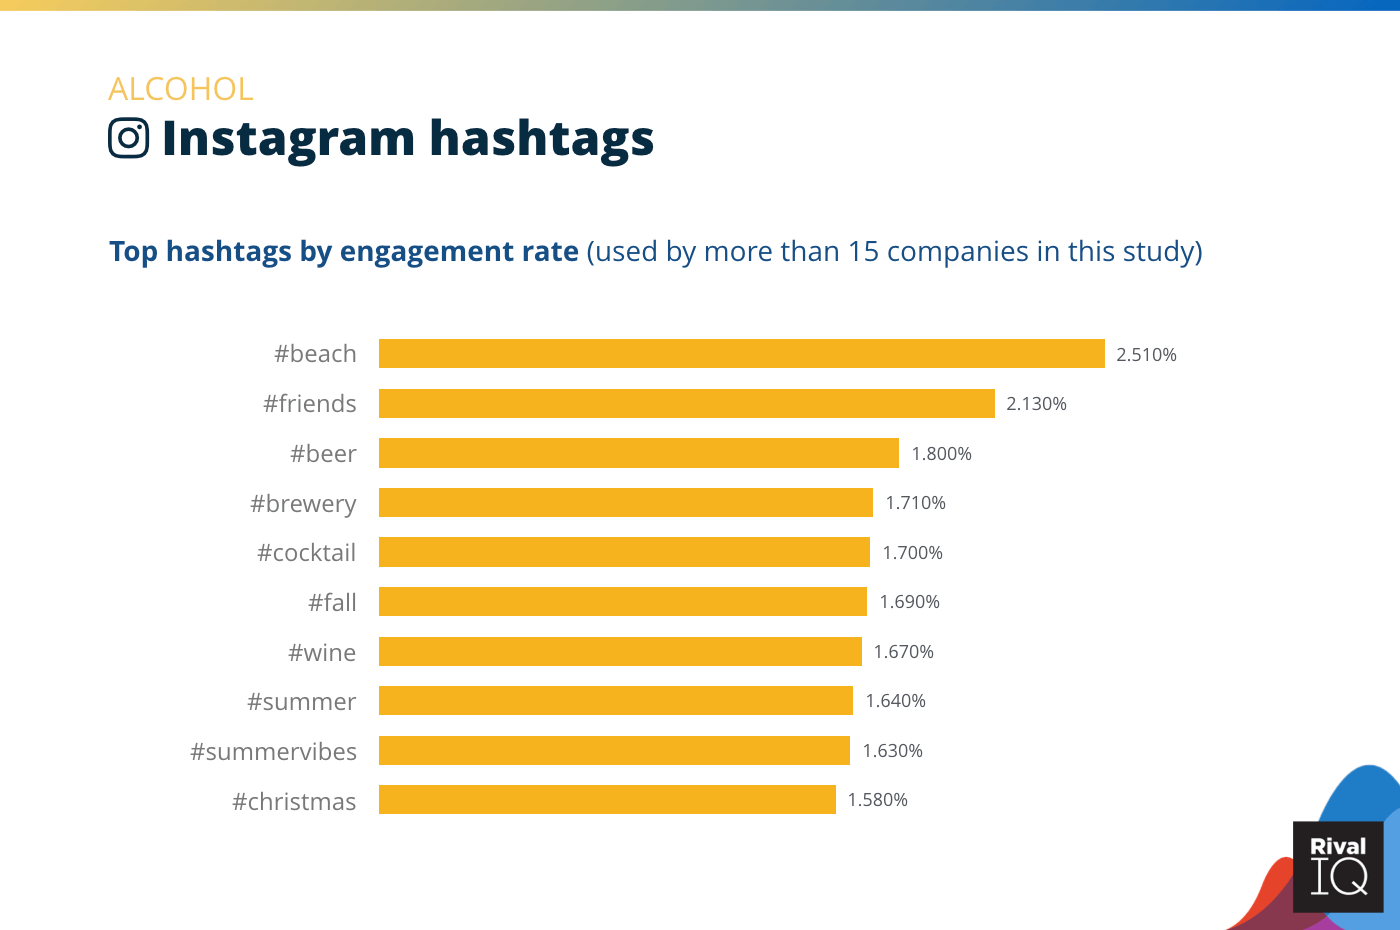
Top Instagram hashtags by engagement rate, Alcohol
Seasonal vibes and beverages topped Alcohol’s hashtag charts on Instagram this year.
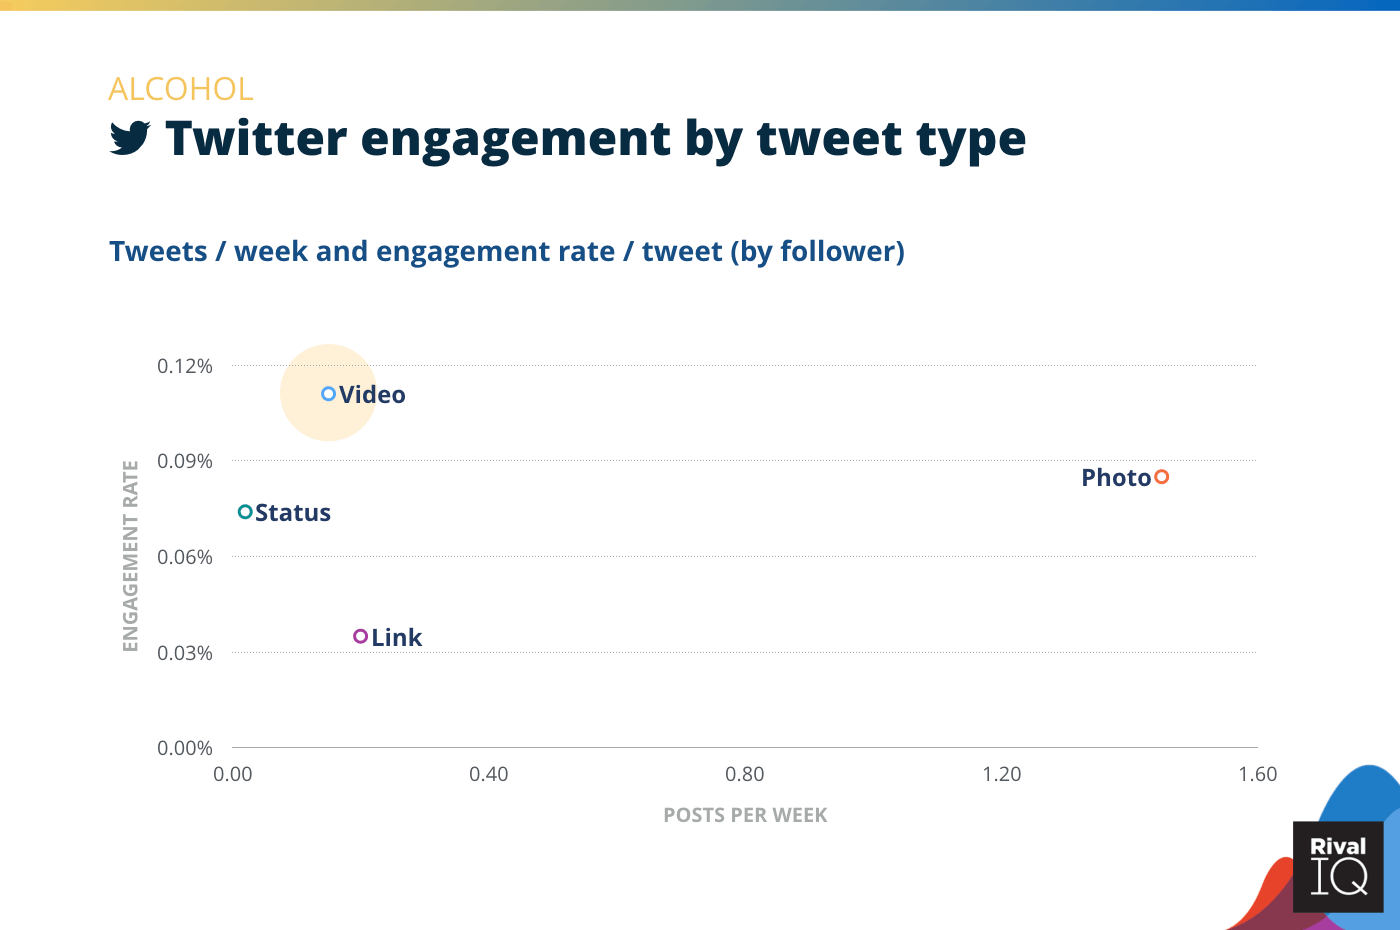
Twitter posts per week and engagement rate by tweet type, Alcohol
Alcohol brands were much more likely to post photos on Twitter than any other tweet type, even though video topped their engagement charts this year.
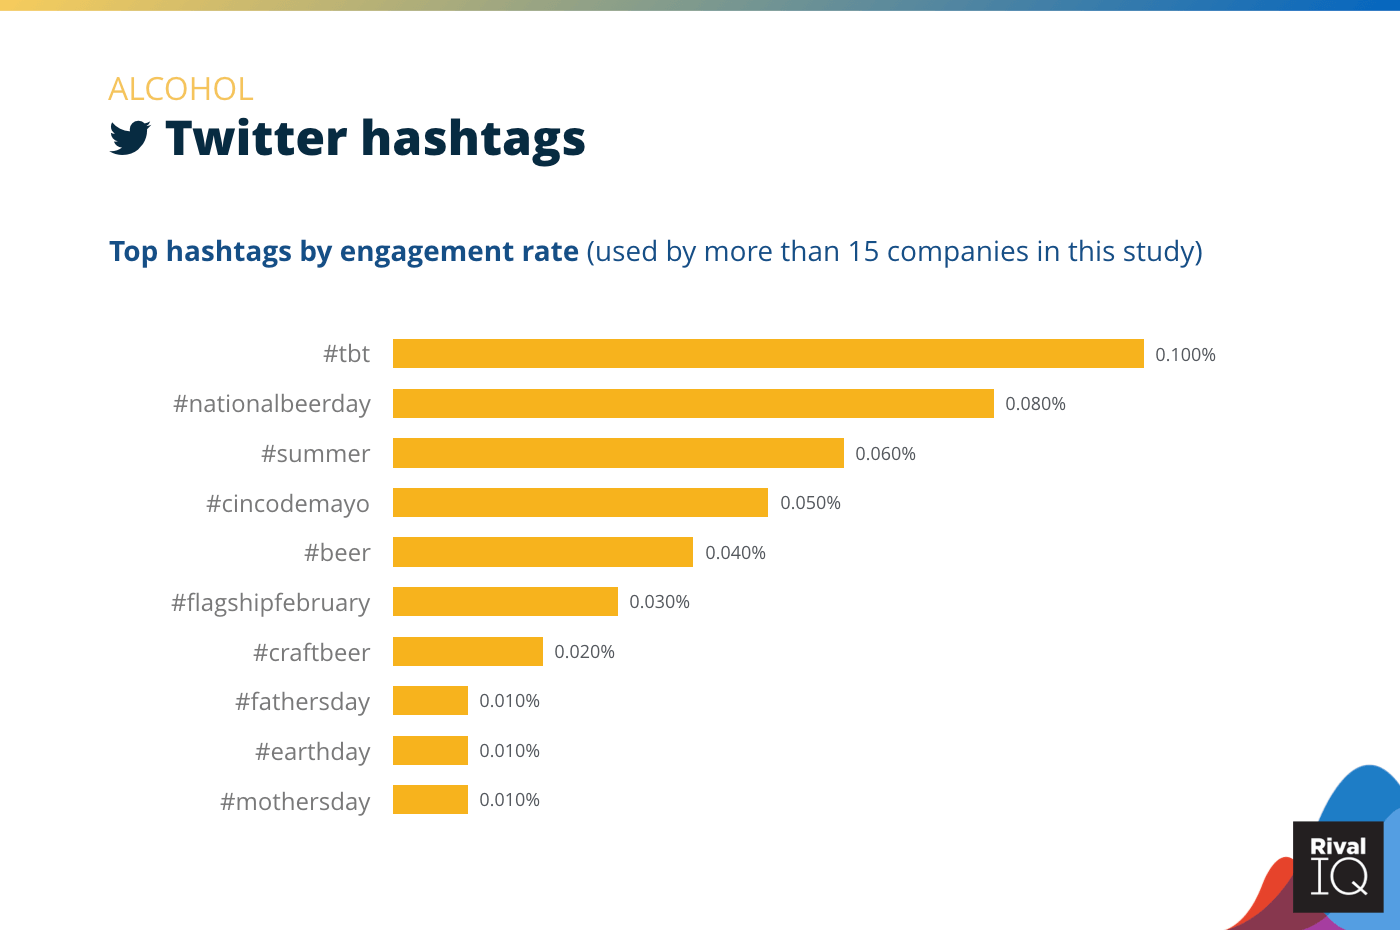
Top Twitter hashtags by engagement rate, Alcohol
Half of Alcohol’s top hashtags on Twitter were about holidays, which was pretty common across many of the industries we studied. Just two of these hashtags overlapped with Alcohol’s top Instagram hashtags.
Industry Snapshot: Fashion
Fashion brands saw some of the lowest performance on Facebook, Instagram, and Twitter for the second year in a row.
Some suggestions for Fashion brands:
- Posting most often on Instagram is a great allocation of resources. Shoot for more carousels, which outperform photos and videos because Instagram re-serves them to folks who didn’t engage with the post the first time around.
- Expand your giveaway and sale success from Twitter to other channels
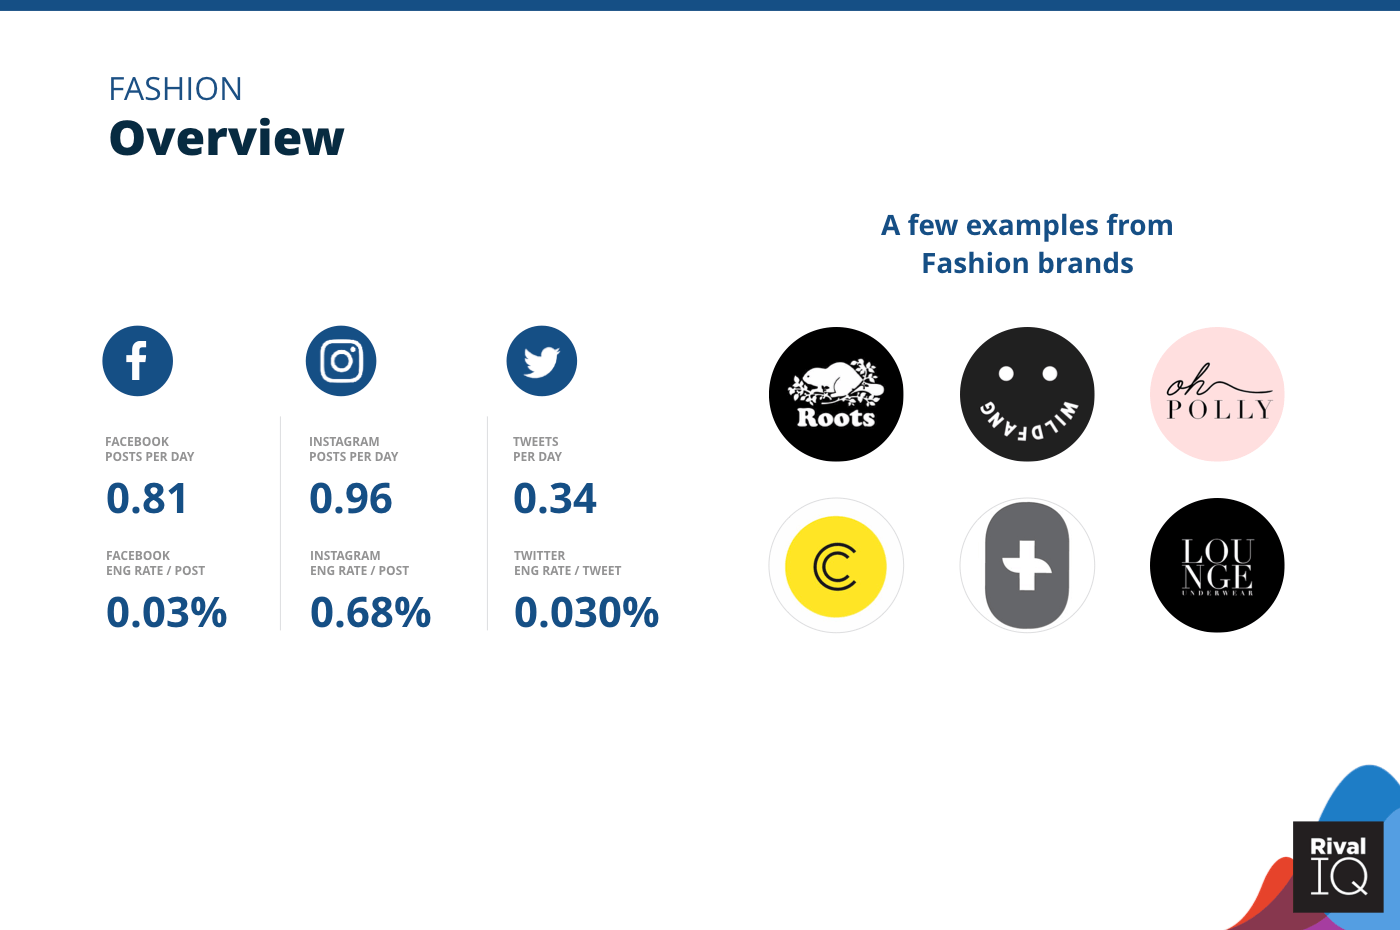
Overview of all benchmarks, Fashion
Notable Fashion brands from this year’s report include Wildfang, Oh Polly, Roots, Lounge Underwear, FIGS, and Cache Cache.
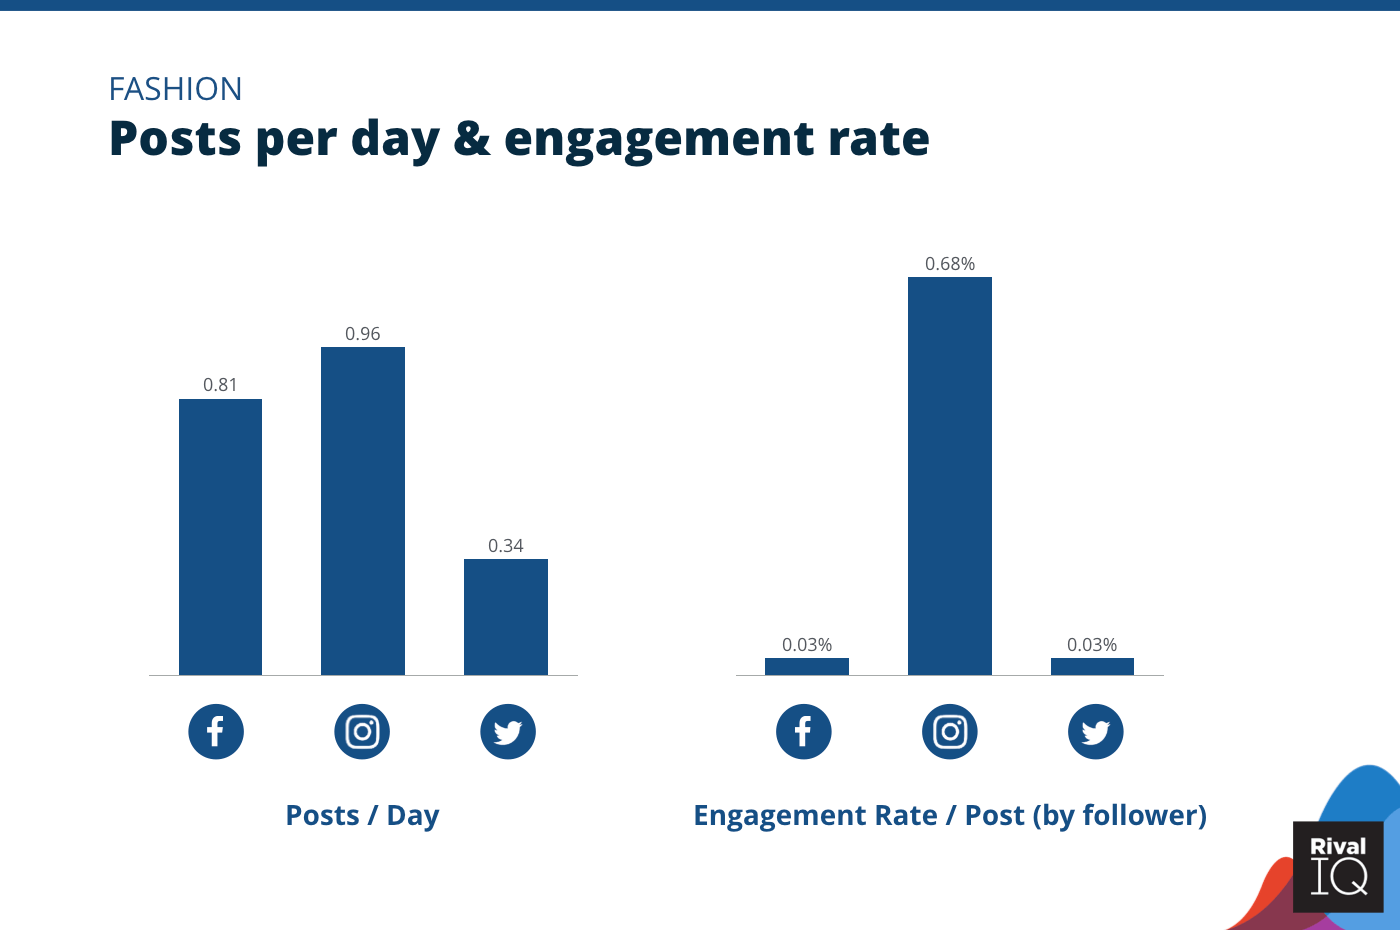
Posts per day and engagement rate per post across all channels, Fashion
Fashion brands posted less frequently across every channel than last year but really only saw a major engagement dip on Instagram, where they declined about 30%.
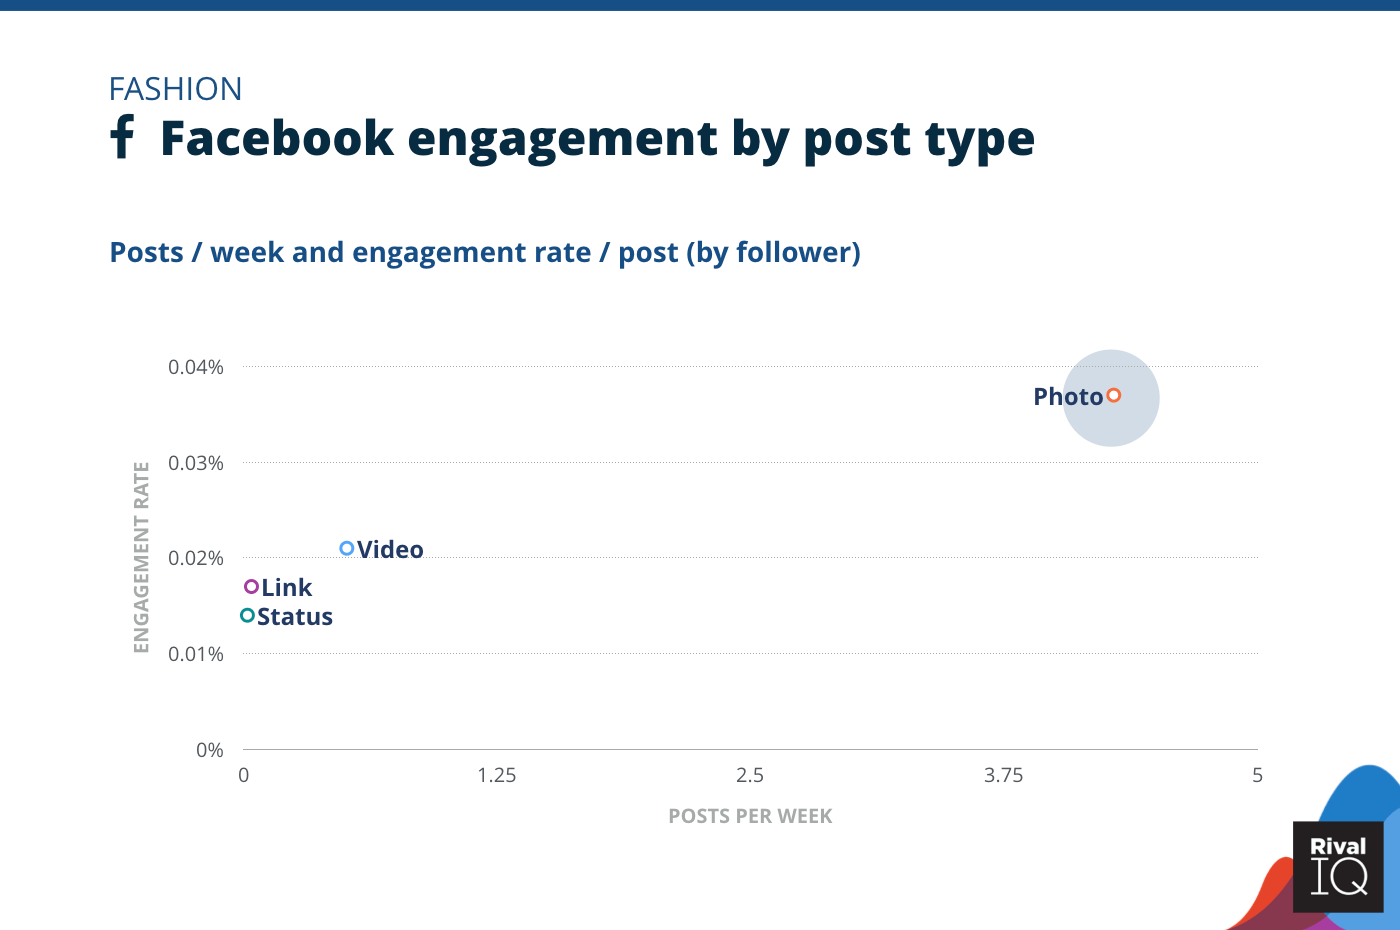
Facebook posts per week and engagement rate by post type, Fashion
Fashion brands see nearly twice the engagement with photos on Facebook that they do for any other post type, and accordingly are 8x more likely to post pictures. Smart allocation of resources, Fashion brands.
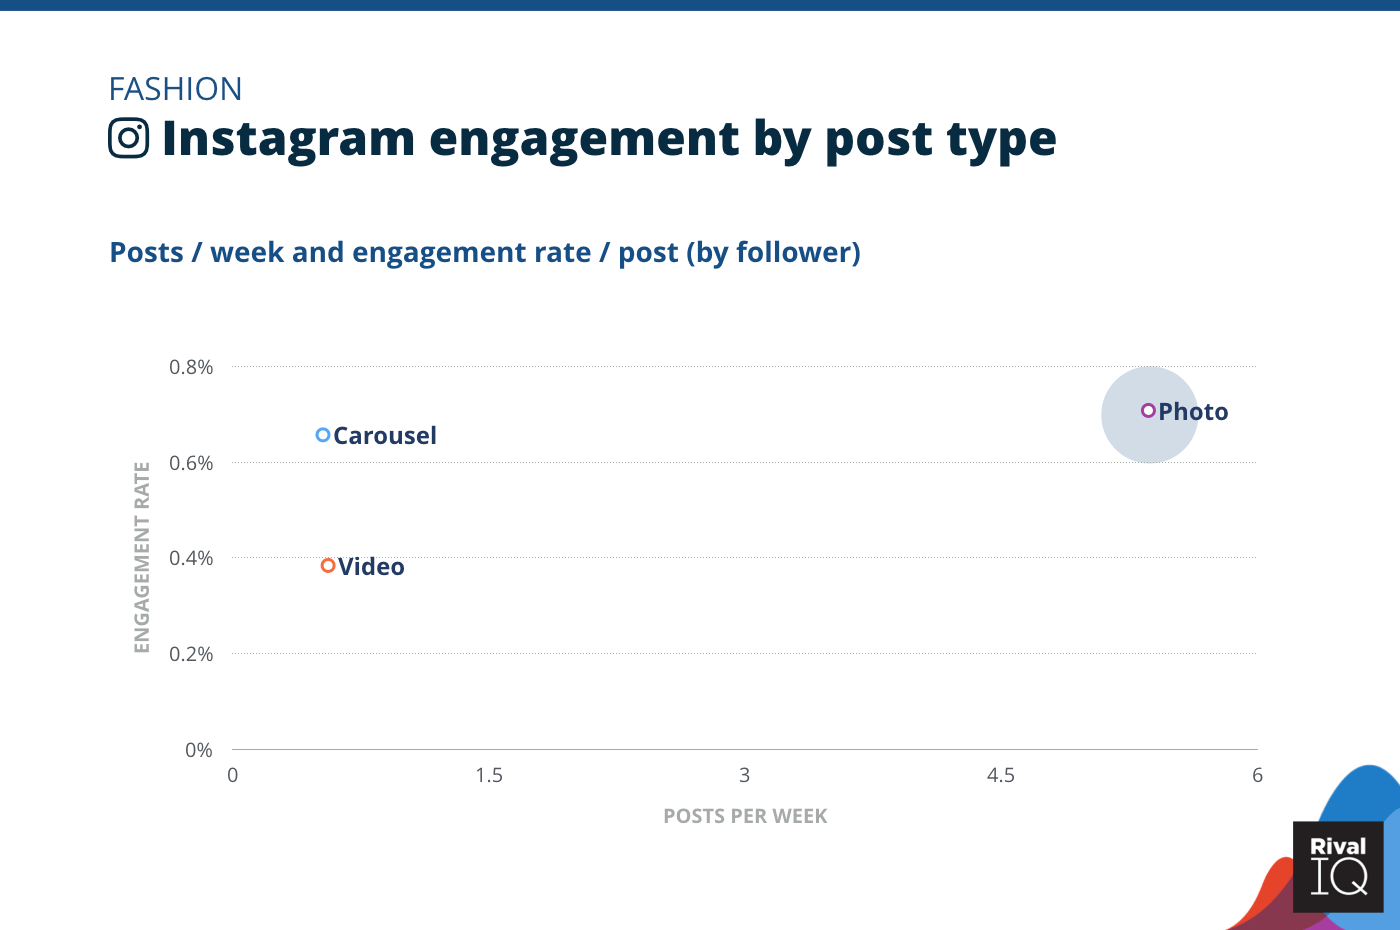
Instagram posts per week and engagement rate by post type, Fashion
Fashion brands are seeing half the median engagement on Instagram but posting way more often than the average brand. These brands should work smarter and not harder by posting more carousels and fewer single images.
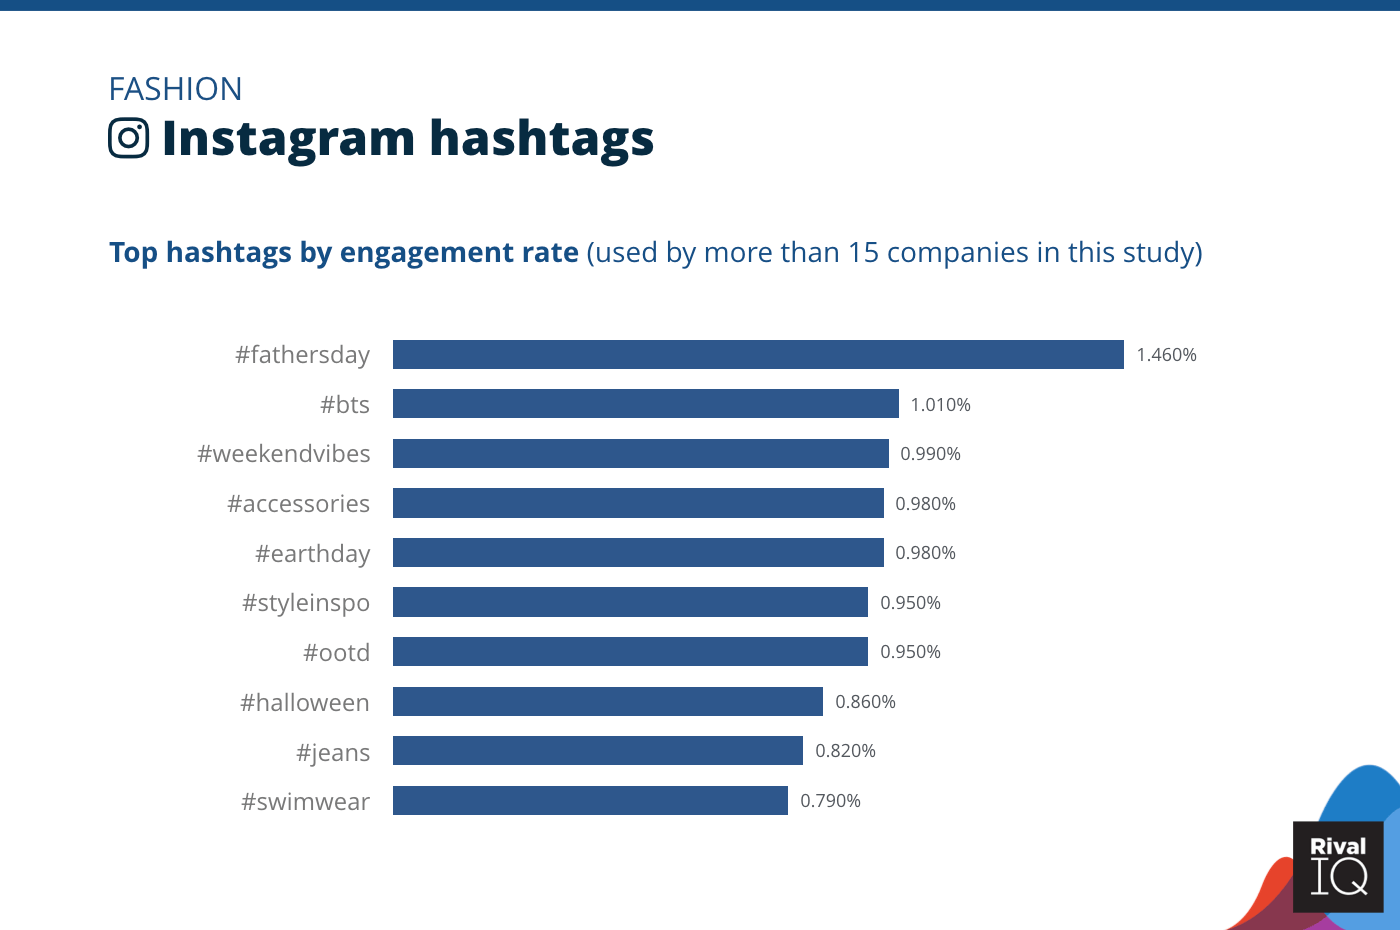
Top Instagram hashtags by engagement rate, Fashion
Fashion brands saw our second-lowest hashtag performance on Instagram, suggesting that more research is needed to find those high-performing hashtags to expand the reach of their content.
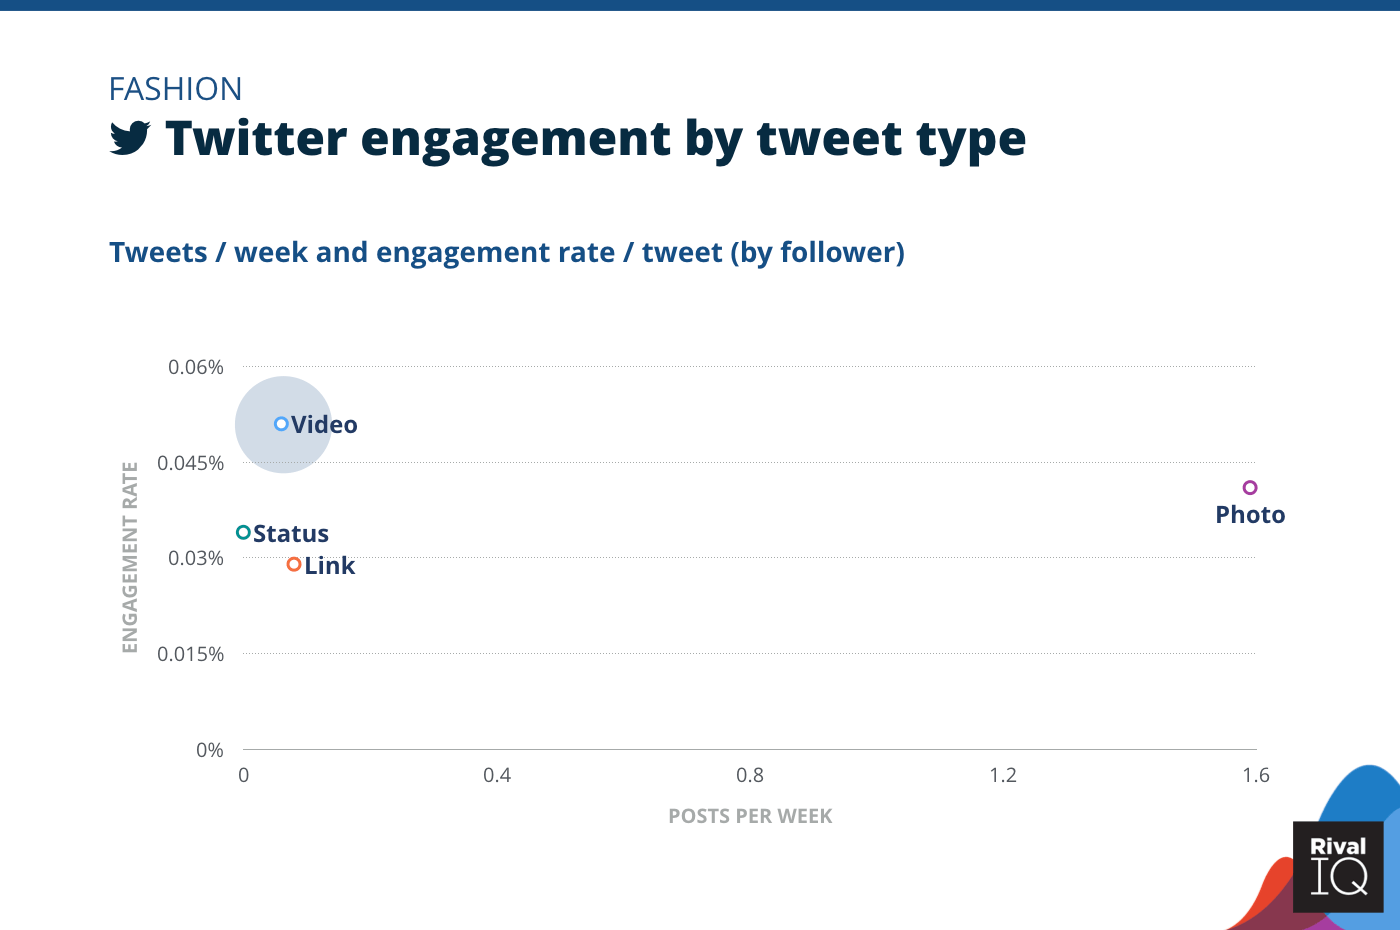
Twitter posts per week and engagement rate by tweet type, Fashion
Fashion brands were the least-frequent tweeters this year, tweeting half as often as the median brand.
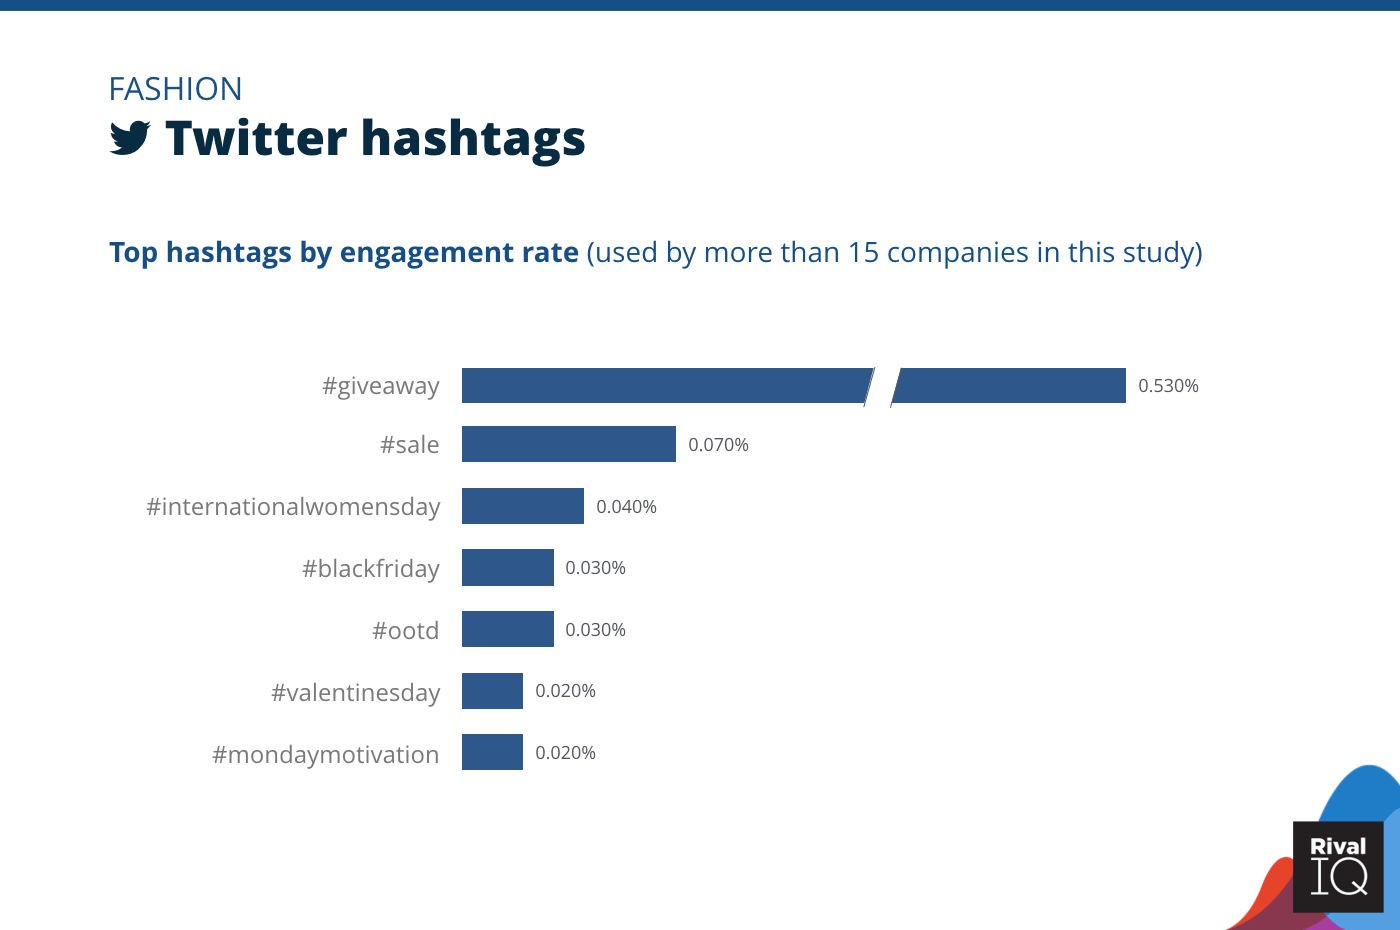
Top Twitter hashtags by engagement rate, Fashion
Fashion followers were very receptive to deals on Twitter, as seen by the high performance of #giveaway, #sale, and #blackfriday hashtags.
Industry Snapshot: Financial Services
Financial Services brands scored third place for Twitter engagement this year, but were more middle-of-the-pack for Facebook and Instagram.
Some ideas for Financial Services brands:
- Try to post more videos on Twitter for even more momentum on that channel
- Finance-related hashtags perform well on both Instagram and Twitter, so keep your hashtags hyper-relevant
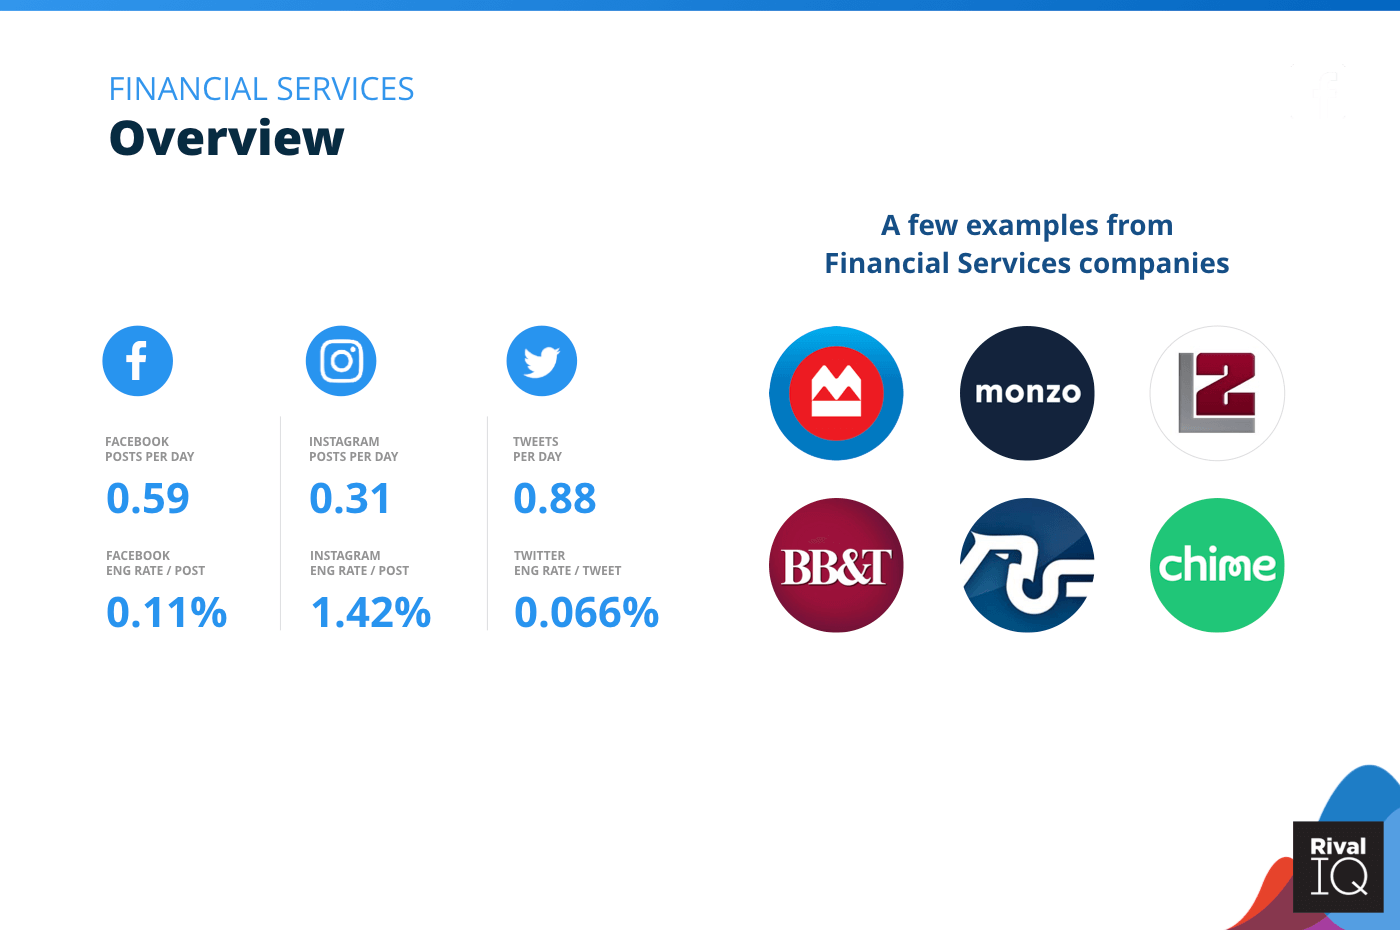
Overview of all benchmarks, Financial Services
Notable Financial Services brands in this year’s report include Monzo, Chime, BB&T, La Segunda, America First Credit Union, and BMO.
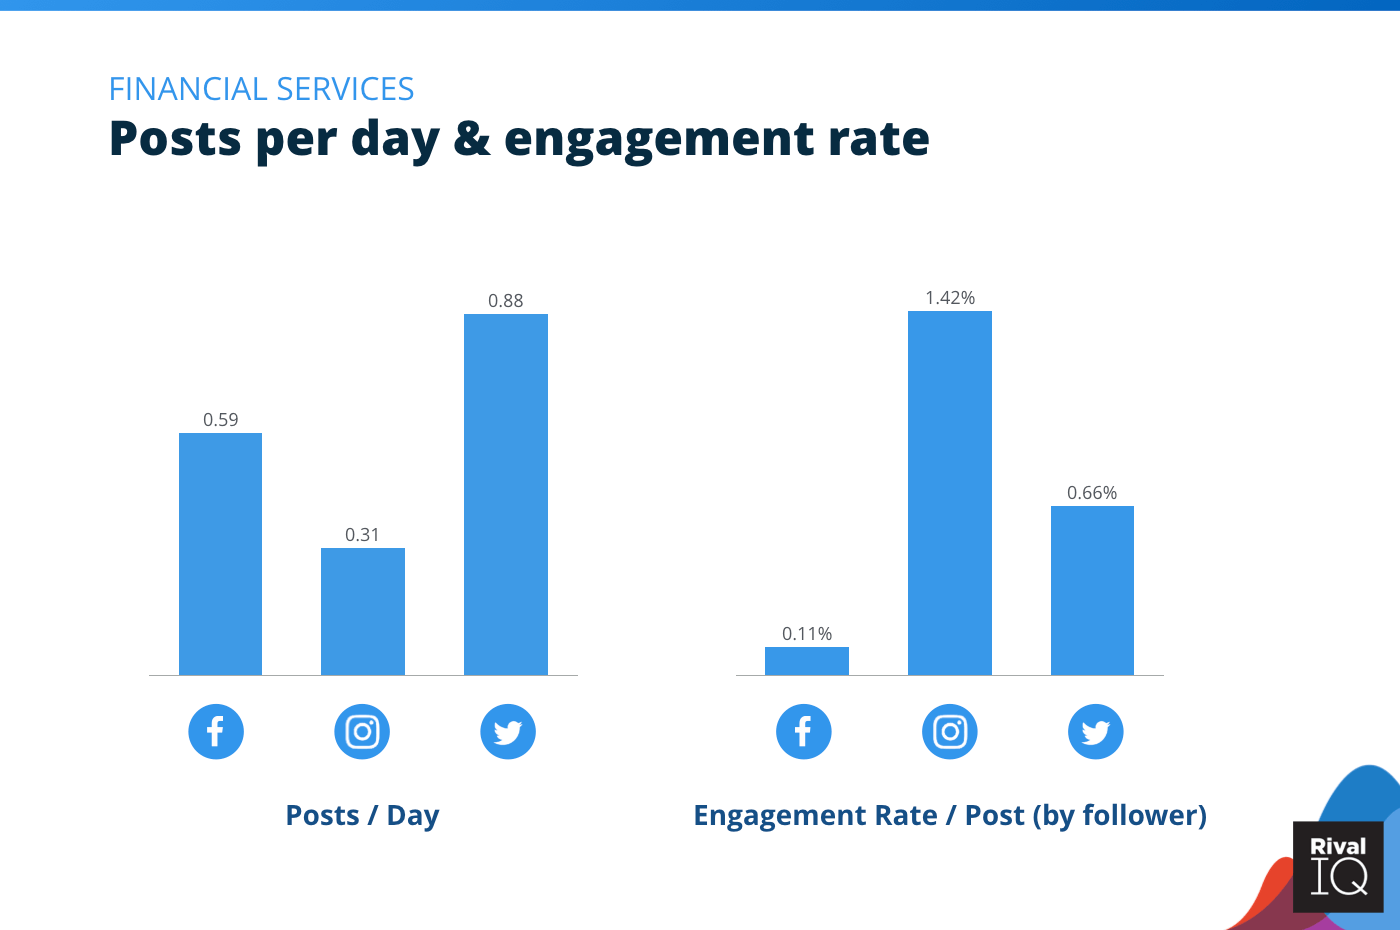
Posts per day and engagement rate per post across all channels, Financial Services
Financial Services posted less often than the median brand in our study on Facebook and Instagram and slightly more often on Twitter.
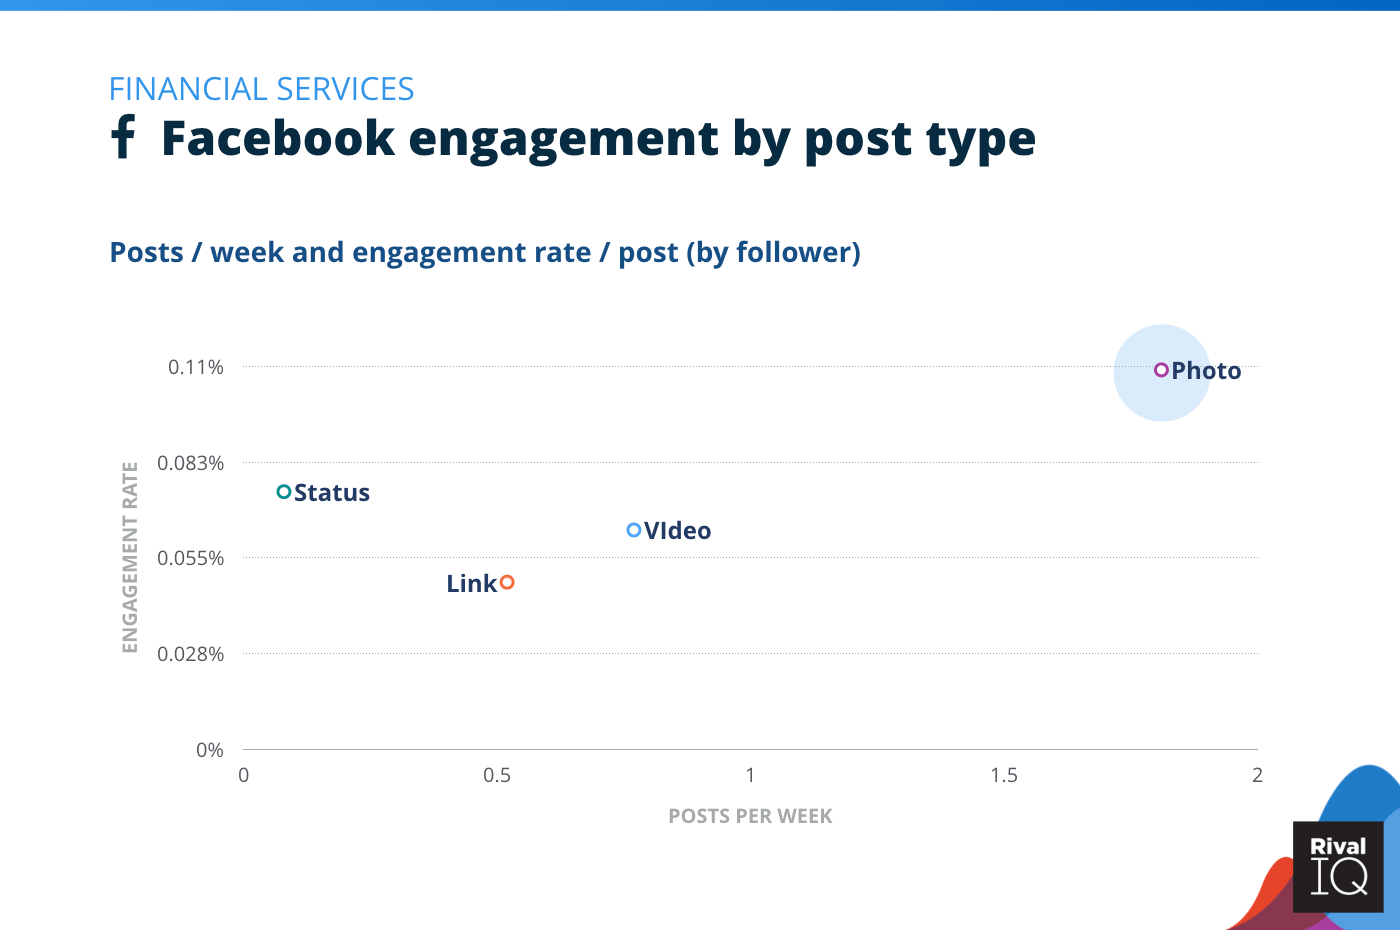
Facebook posts per week and engagement rate by post type, Financial Services
Financial Services brands focused their Facebook efforts on top-performing post type: photos. Financing company SoFi doubled the Facebook median with the strategic use of contests and giveaways.
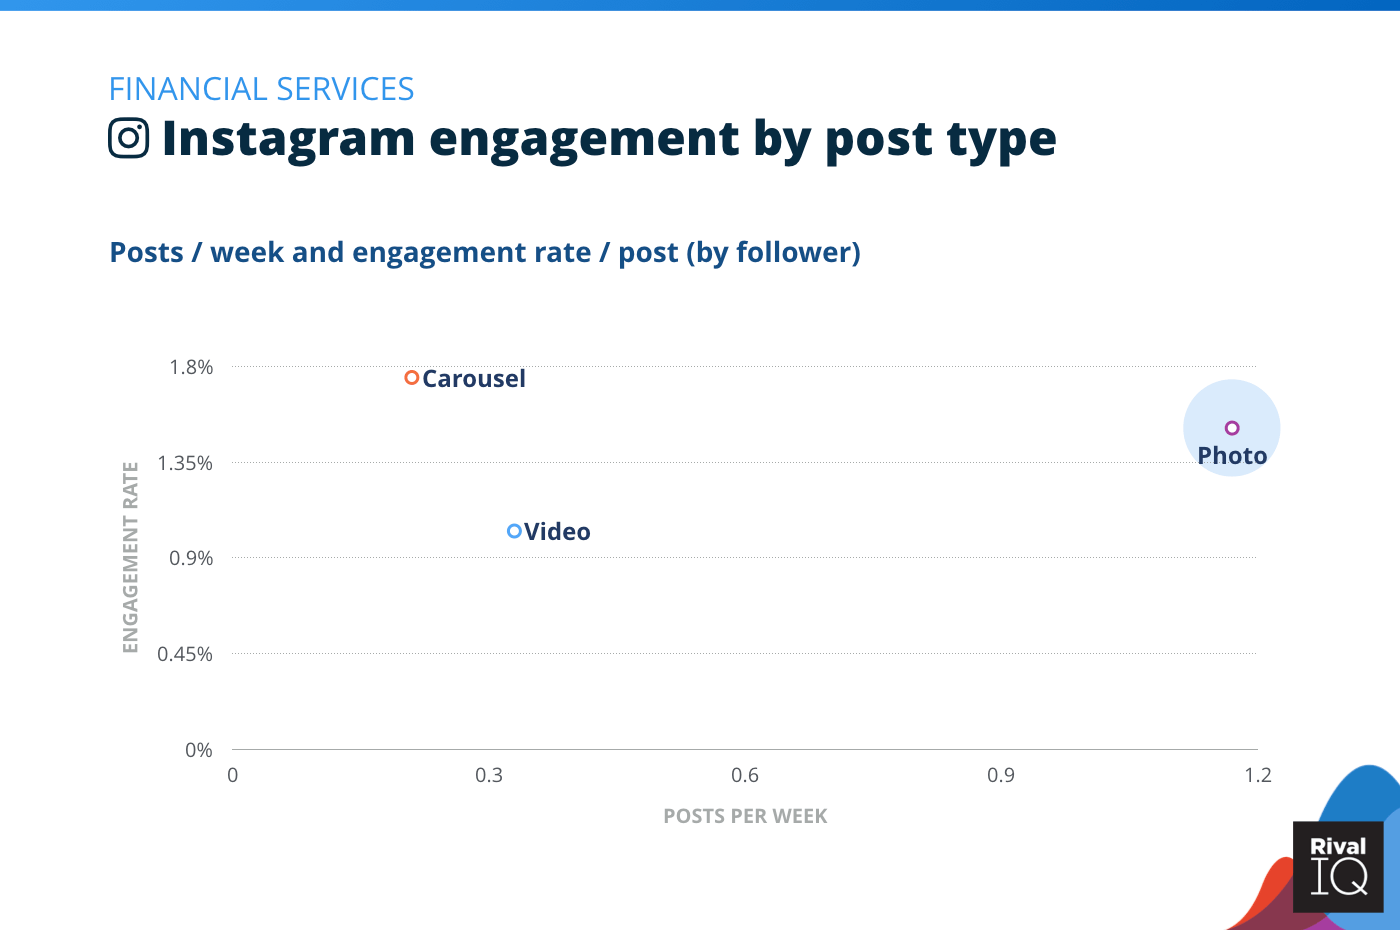
Instagram posts per week and engagement rate by post type, Financial Services
Financial Services brands were just above the median for Instagram engagement, and could push that lead even further with more carousels.
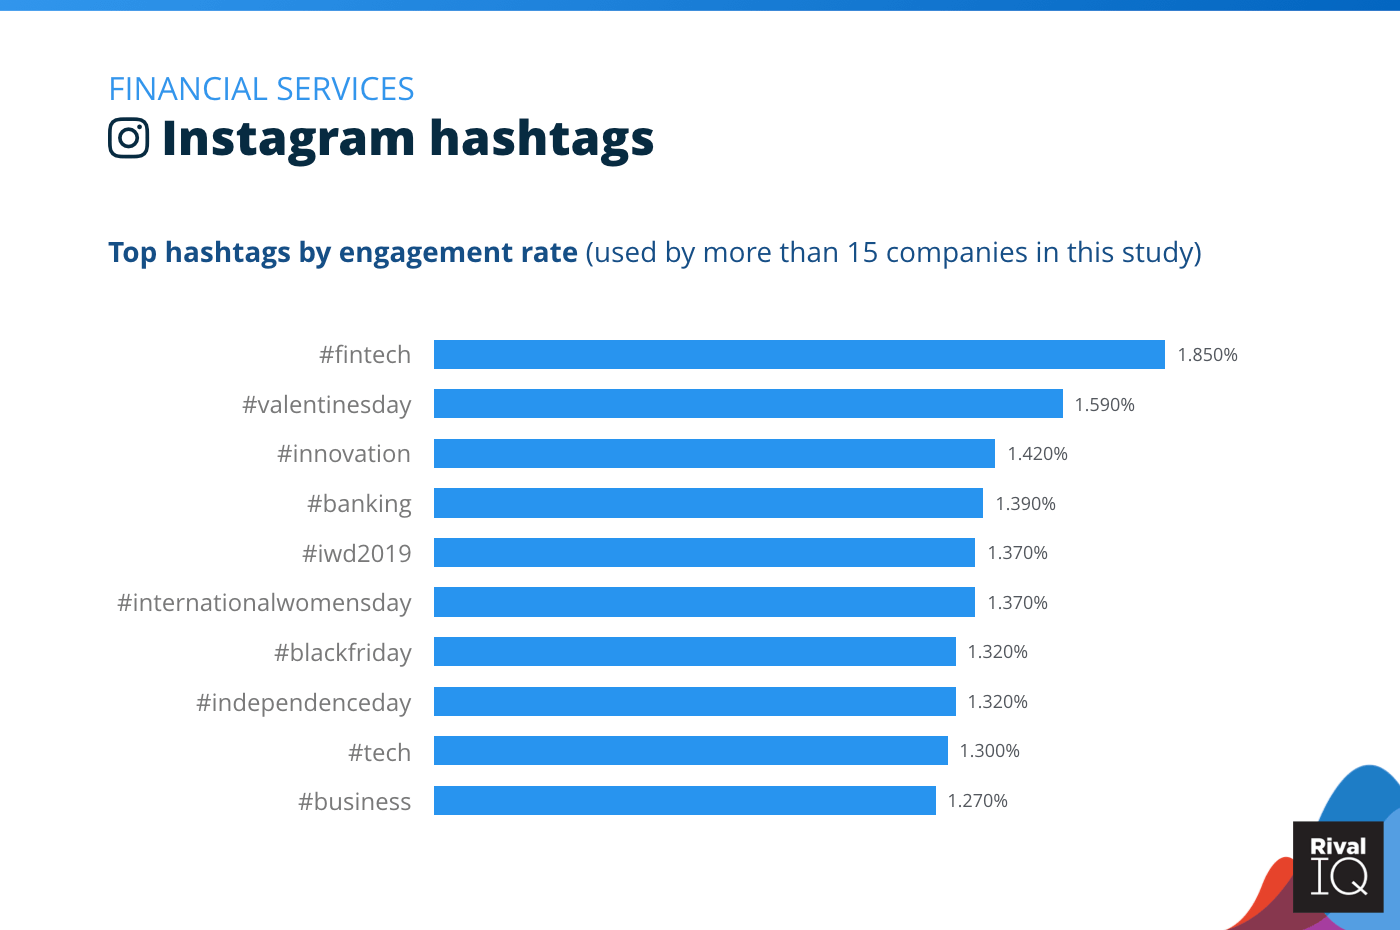
Top Instagram hashtags by engagement rate, Financial Services
Financial Services brands saw a lot of success with the industry-related #fintech hashtag, and also favored holiday hashtags.
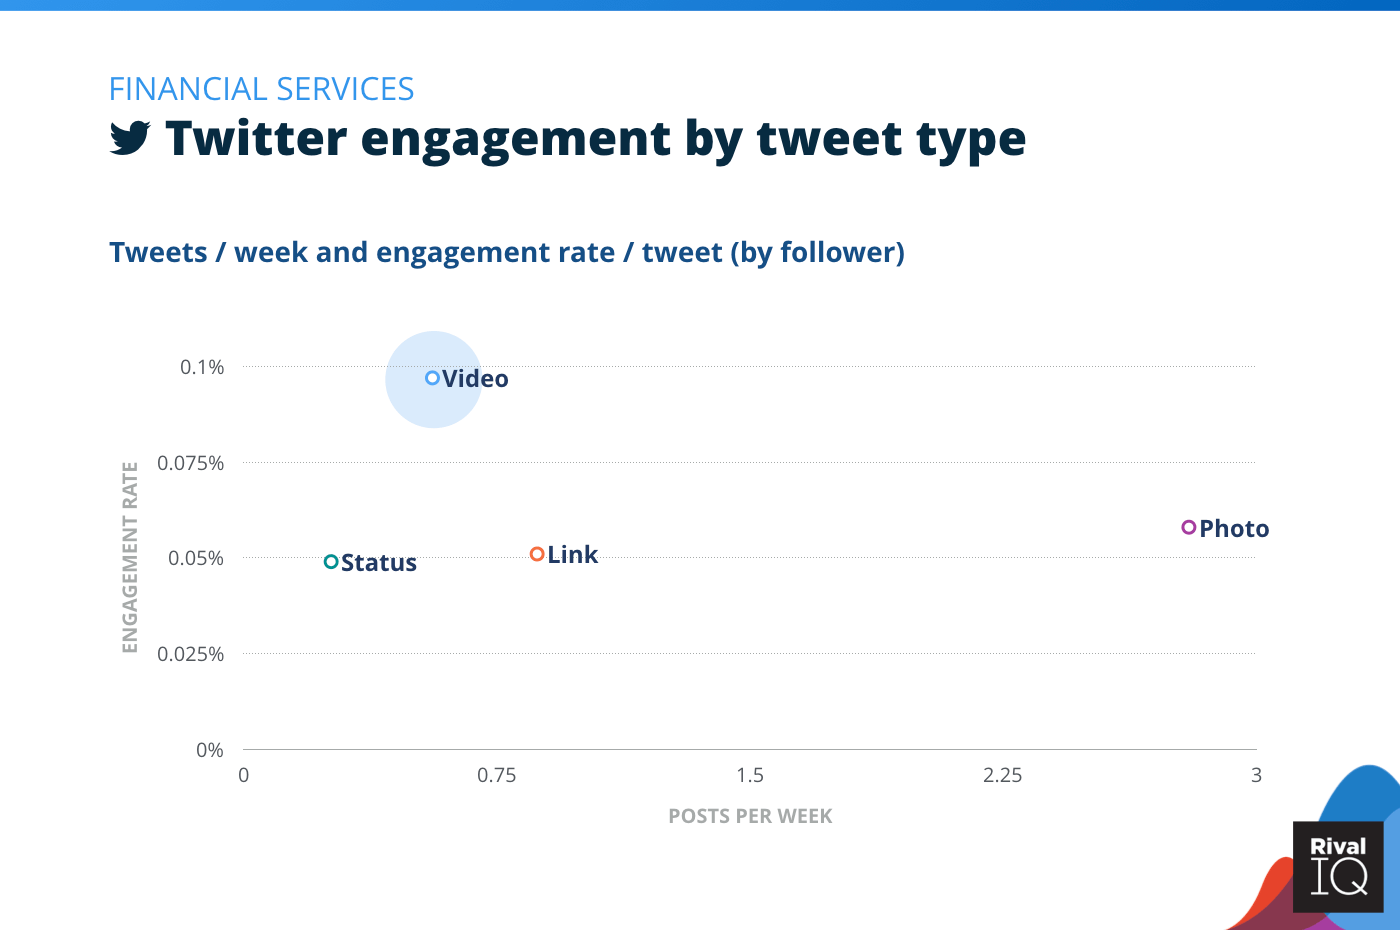
Twitter posts per week and engagement rate by tweet type, Financial Services
Videos were twice as engaging as any other tweet type for Financial Services brands on Twitter.
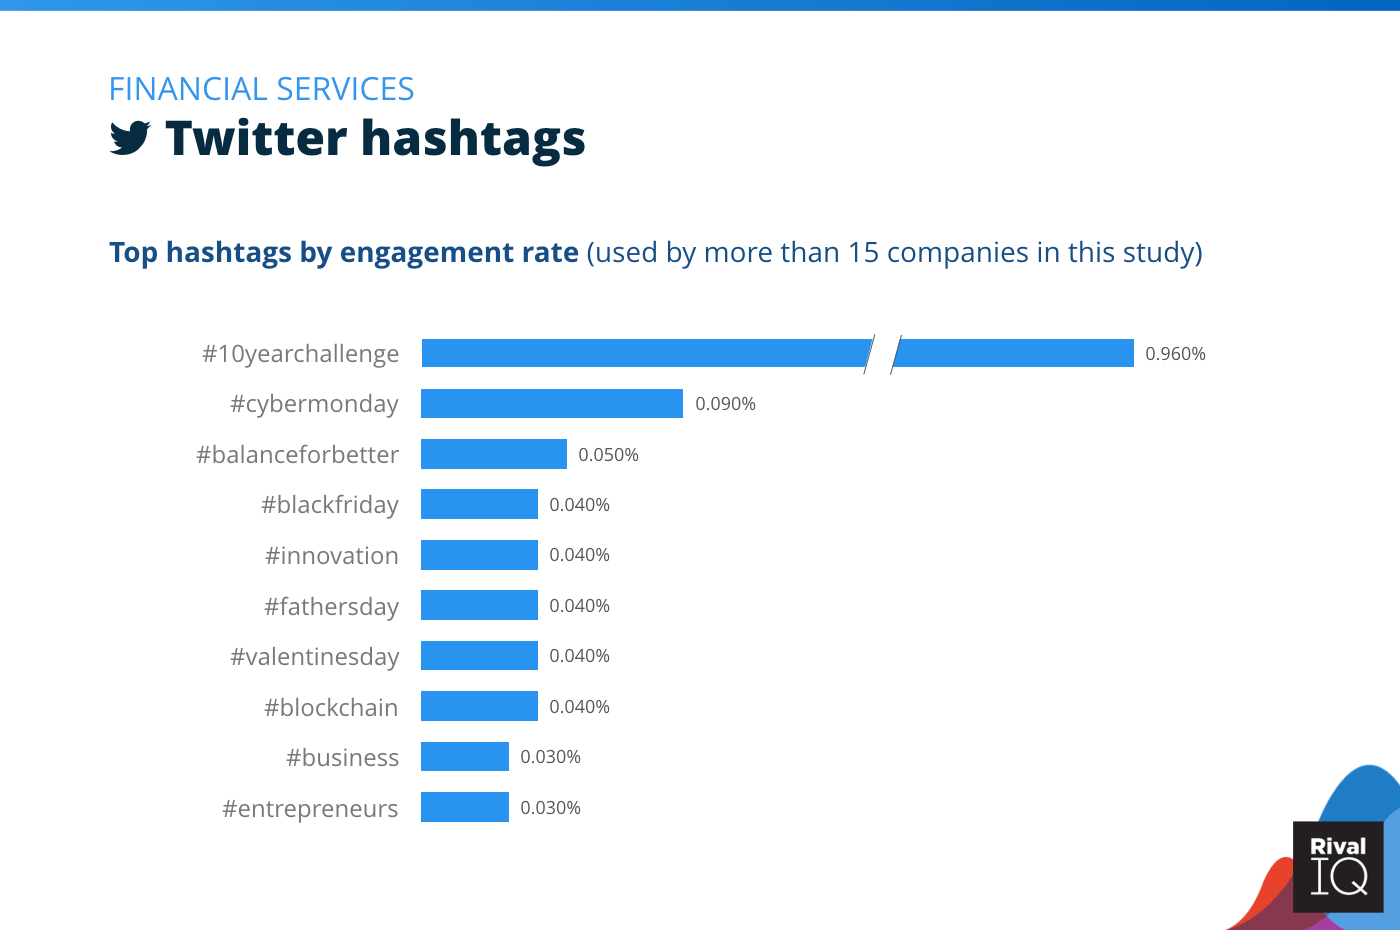
Top Twitter hashtags by engagement rate, Financial Services
Financial Services’ top-performing Twitter hashtag saw 10x the engagement as their second place hashtag. Like on Instagram, holidays helped fill out the rest of their top 10 hashtags.
Industry Snapshot: Food & Beverage
Food & Beverage posted well below the median frequency but still scored middle-of-the-road engagement across the board. For the second year in a row, their hashtag game was strong on both Instagram and Twitter.
Some ideas for improvement:
- Keep using high-performing hashtags–especially giveaways
- Food & Beverage followers love a good visual, so keep investing in photos and videos
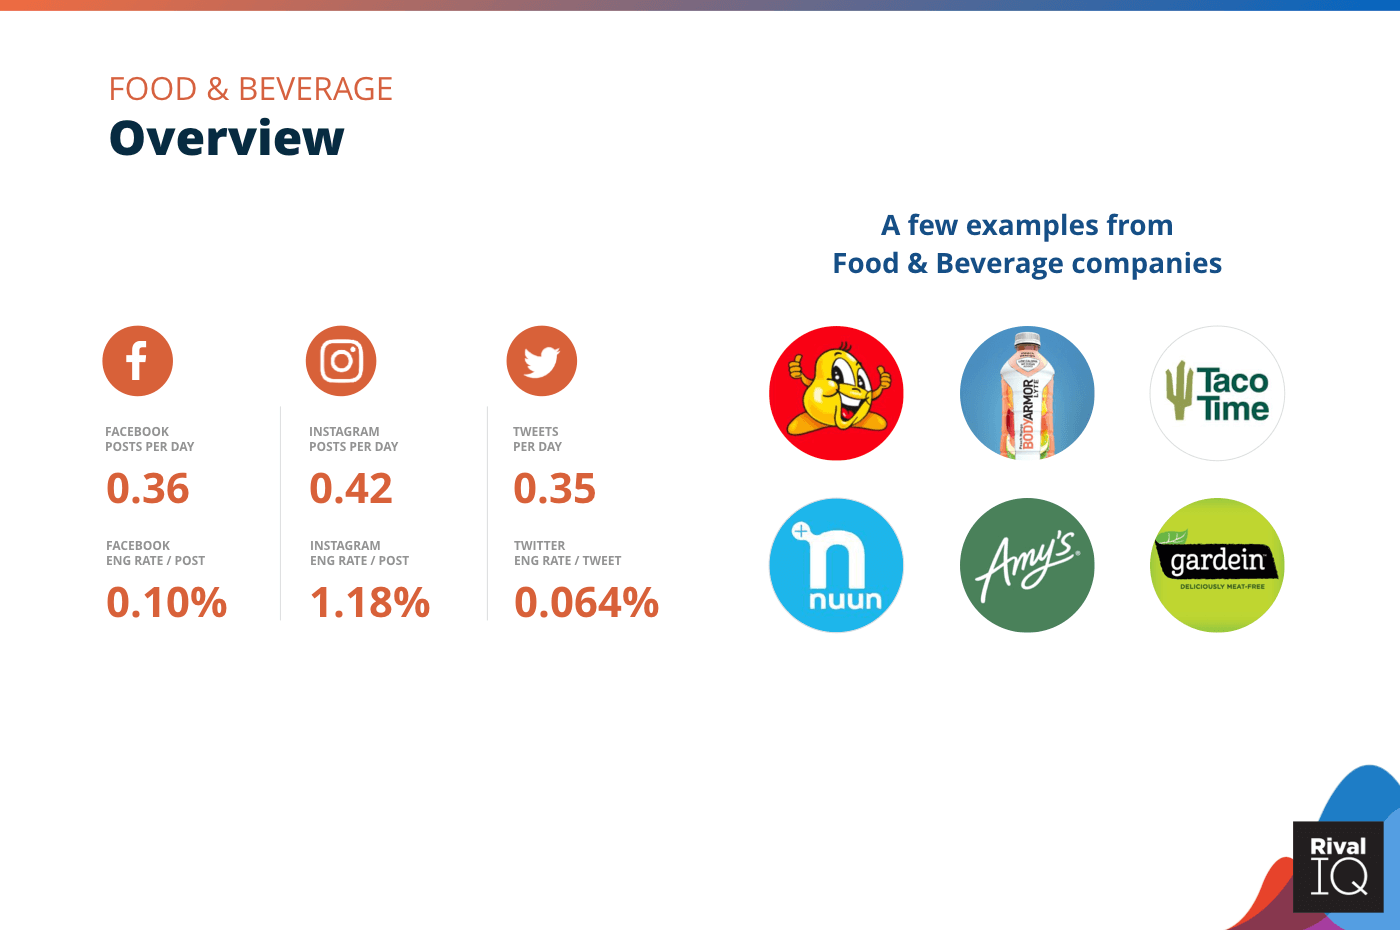
Overview of all benchmarks, Food & Beverage
Notable Food & Beverage brands in this report include Grefusa, BODYARMOR, Taco Time, nuun, Amy’s, and Gardein.
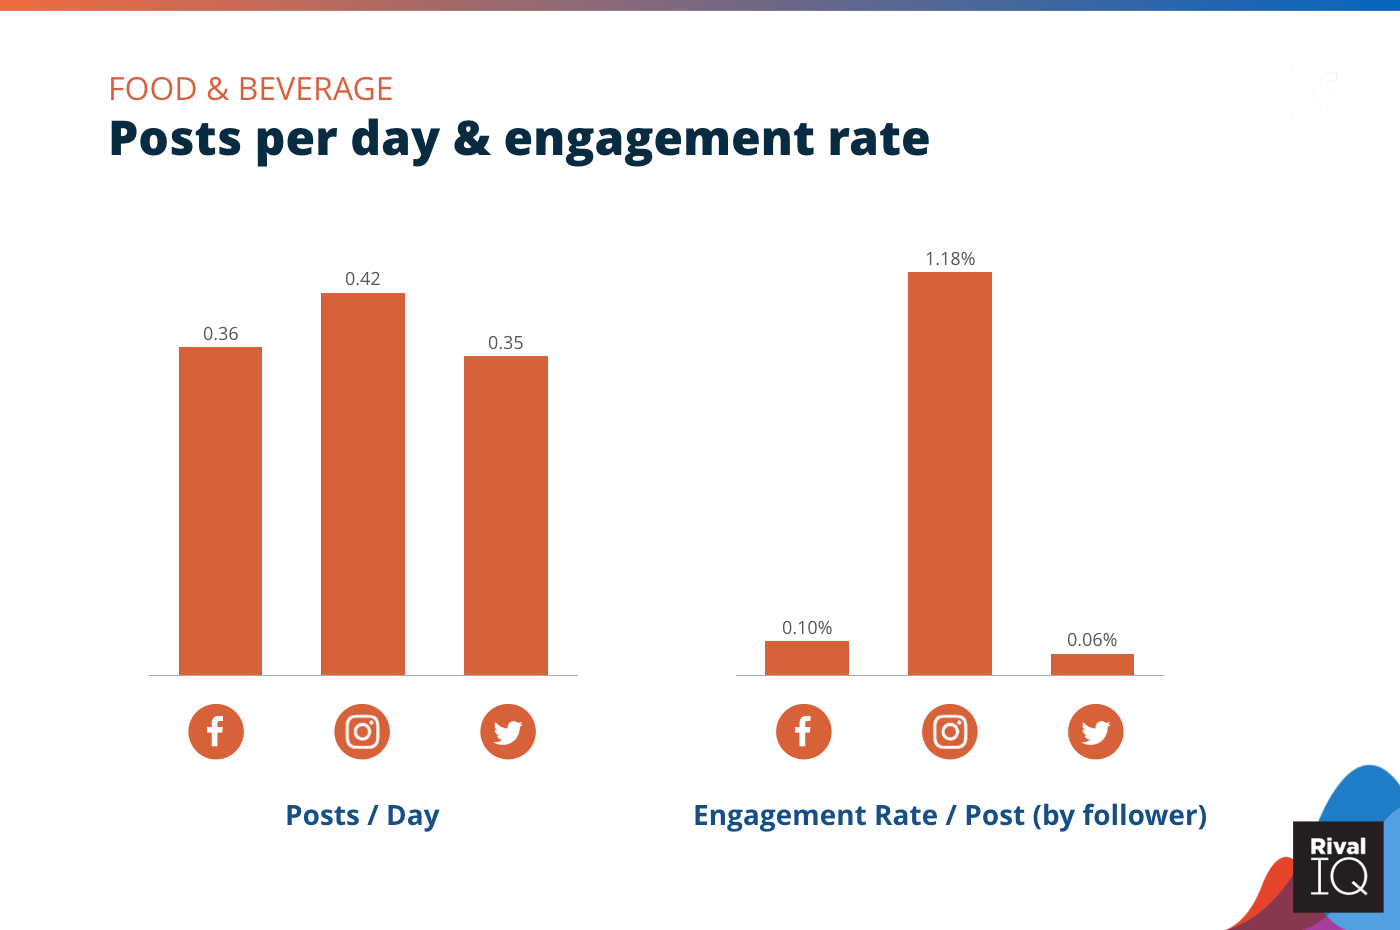
Posts per day and engagement rate per post across all channels, Food & Beverage
Food & Beverage brands saw 30% more engagement on Twitter than the median industry but were pretty average on Facebook and Instagram.
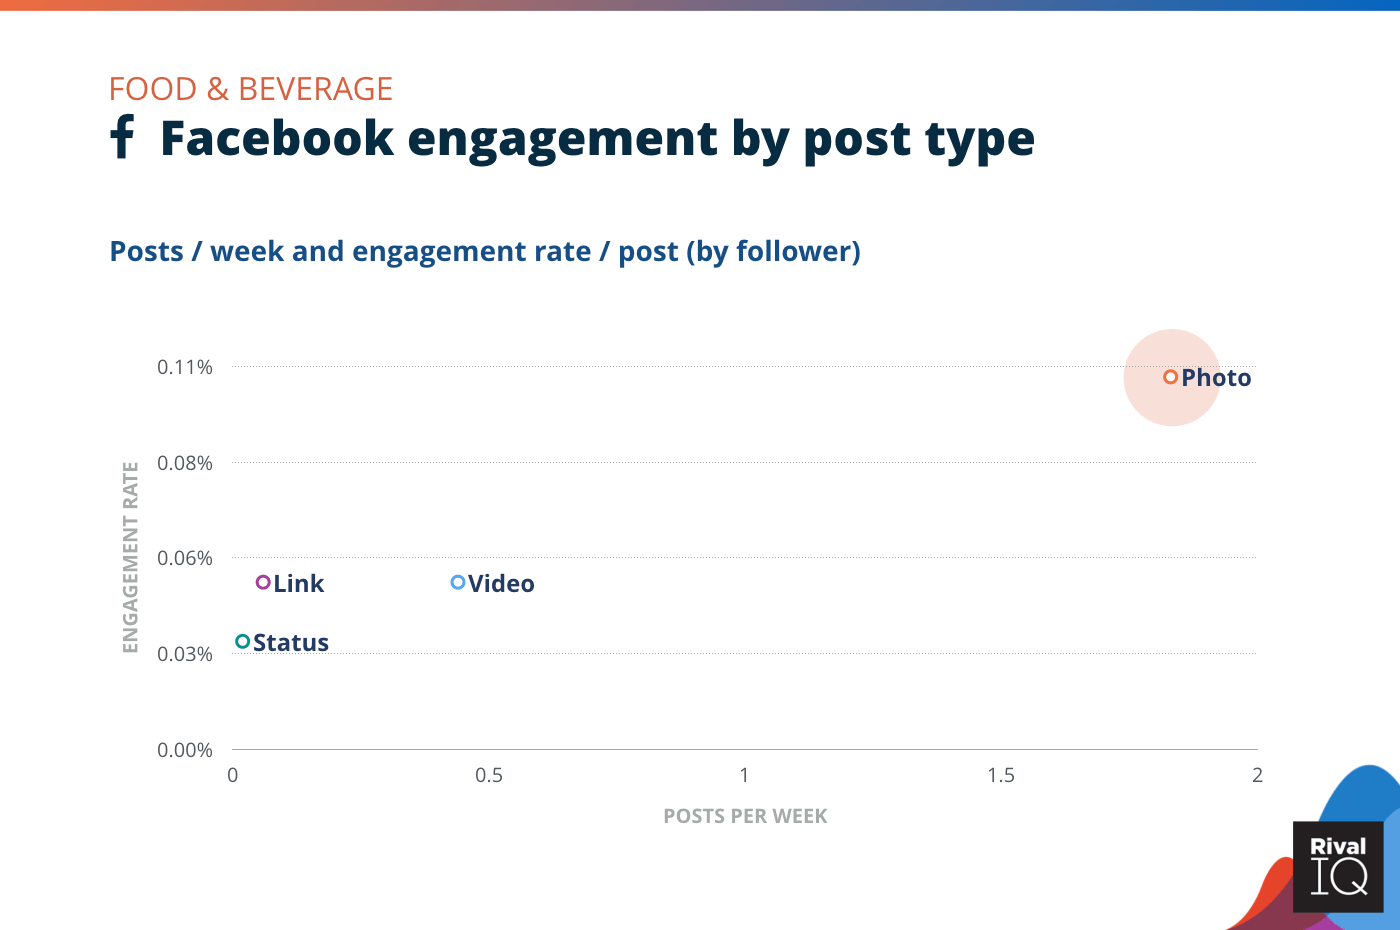
Facebook posts per week and engagement rate by post type, Food & Beverage
For the second year in a row, photos brought home the bacon for Food & Beverage brands on Facebook, with the next most popular post type (video) garnering about half as much engagement per post.
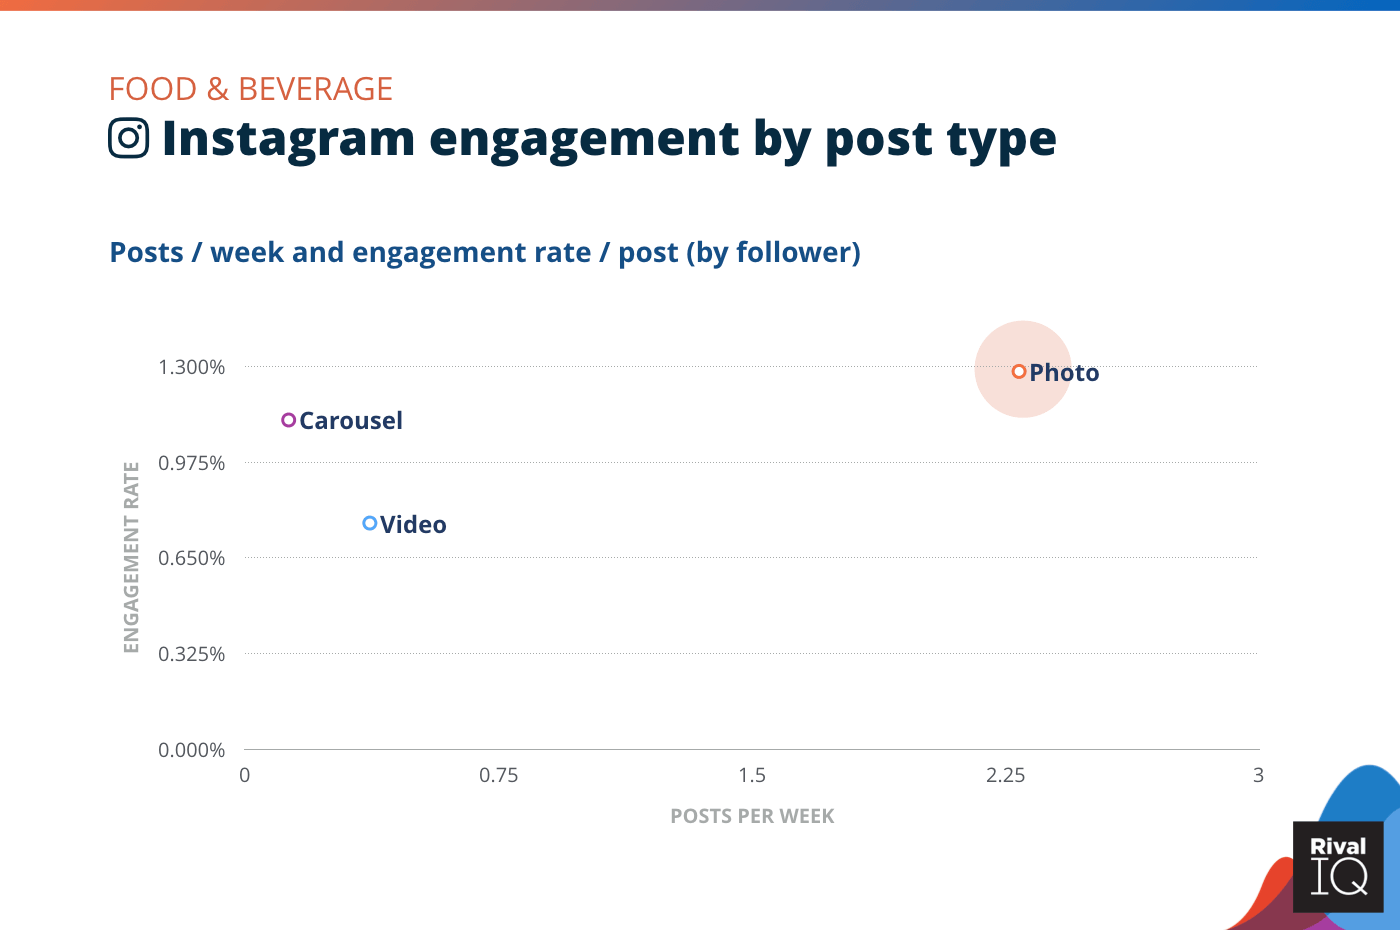
Instagram posts per week and engagement rate by post type, Food & Beverage
Second-place Food & Beverage brand Polar Seltzer made the most of Instagram’s most popular post type with colorful and fun meme-style photos that grabbed tons of attention.
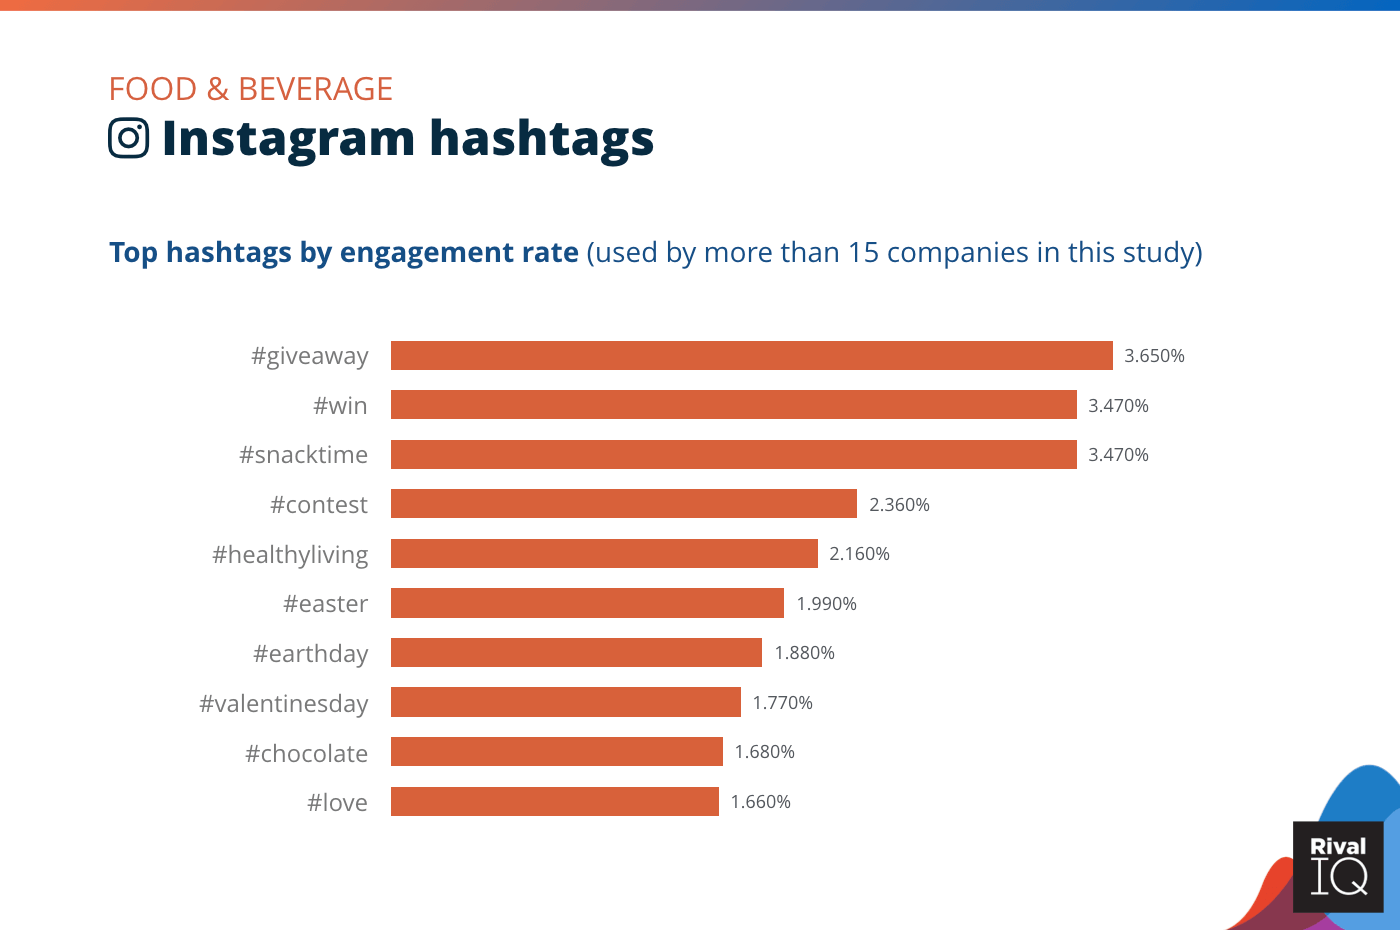
Top Instagram hashtags by engagement rate, Food & Beverage
For the second year in a row, Food & Beverage brands saw some of the highest hashtag engagement on Instagram. These brands were especially successful when posting about contests and giveaways.
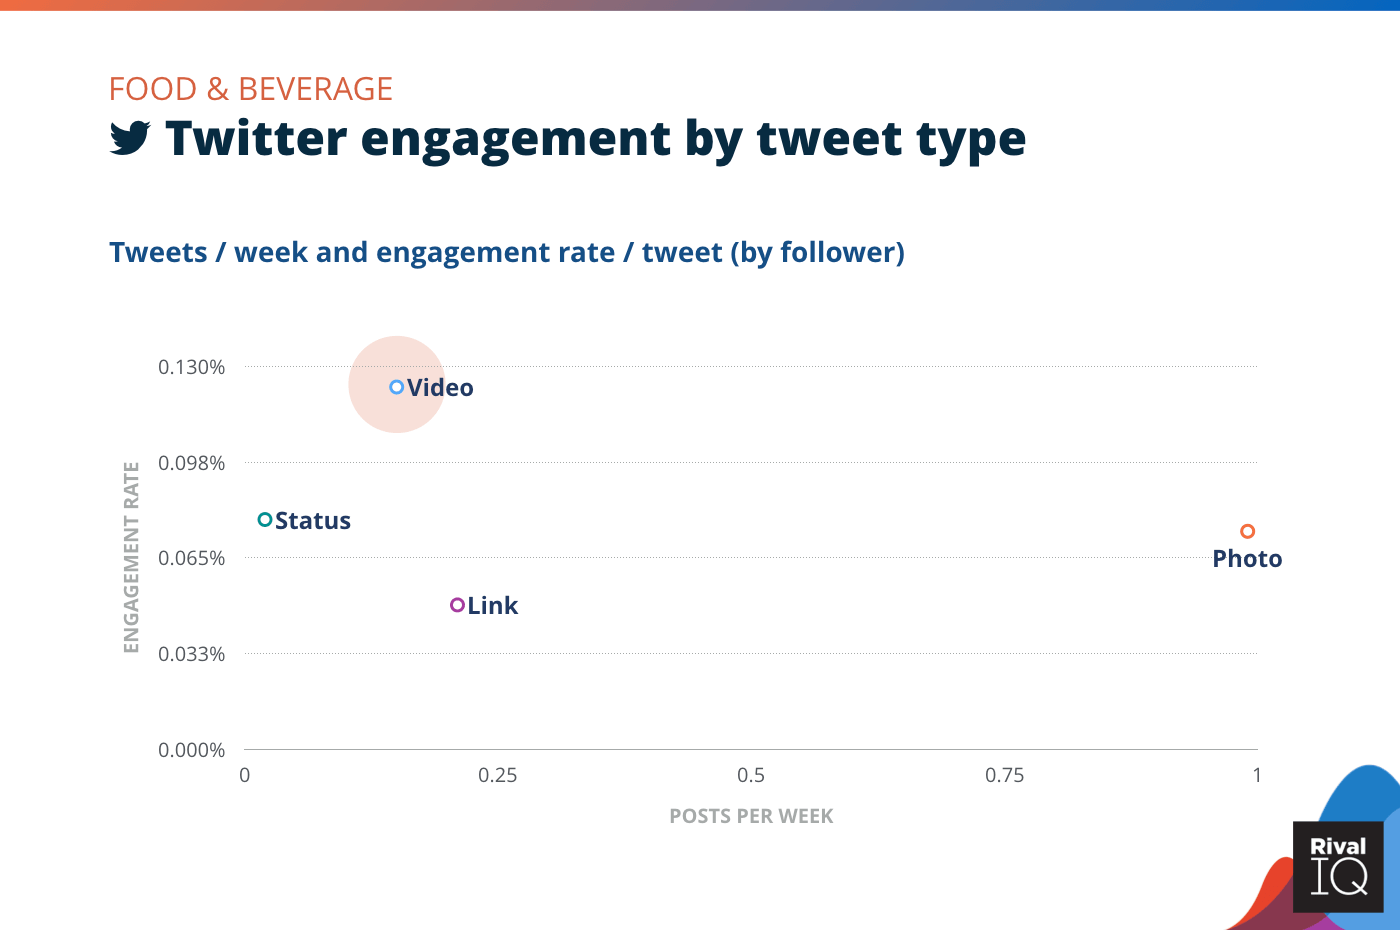
Twitter posts per week and engagement rate by tweet type, Food & Beverage
Food & Beverage brands saw an uptick in Twitter engagement this year, and should look into more video content to keep that momentum going.
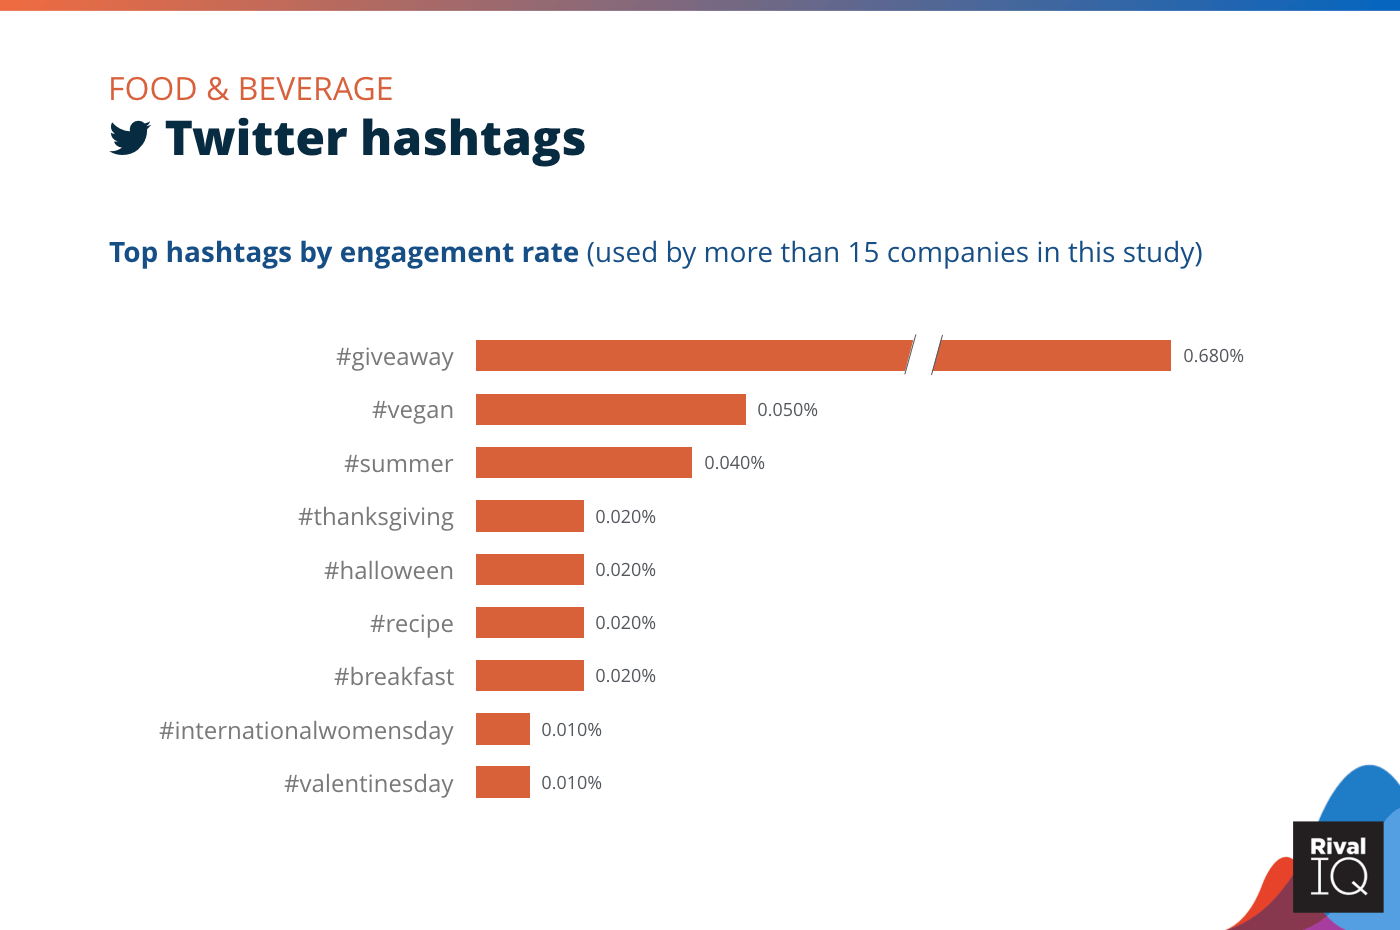
Top Twitter hashtags by engagement rate, Food & Beverage
Twitter giveaways performed 10x better than the median tweet for Food & Beverage brands.
Industry Snapshot: Health & Beauty
For the fourth year in a row, Health & Beauty saw below-average engagement across all social channels.
A few growth ideas:
- Photos fare best on Facebook and Instagram, so keep up with the glamour shots.
- Keep focusing on contests on Instagram and Twitter as a way to engage current followers and entice new ones.
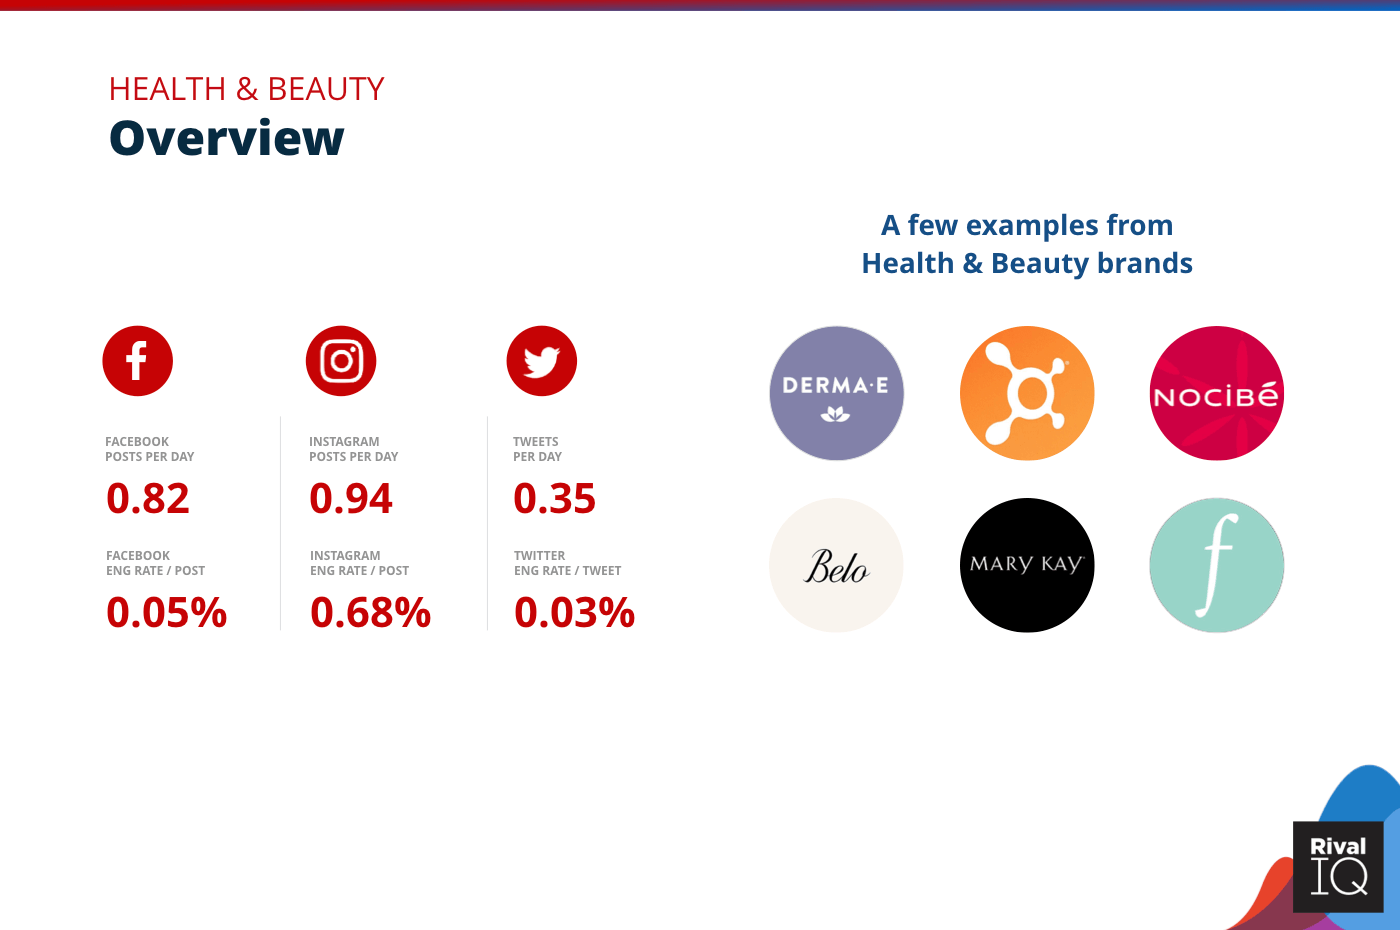
Overview of all benchmarks, Health & Beauty
Notable Health & Beauty brands in this report include Derma-E, Orange Theory, Nocibé, Belo Med, Mary Kay, and Function of Beauty.
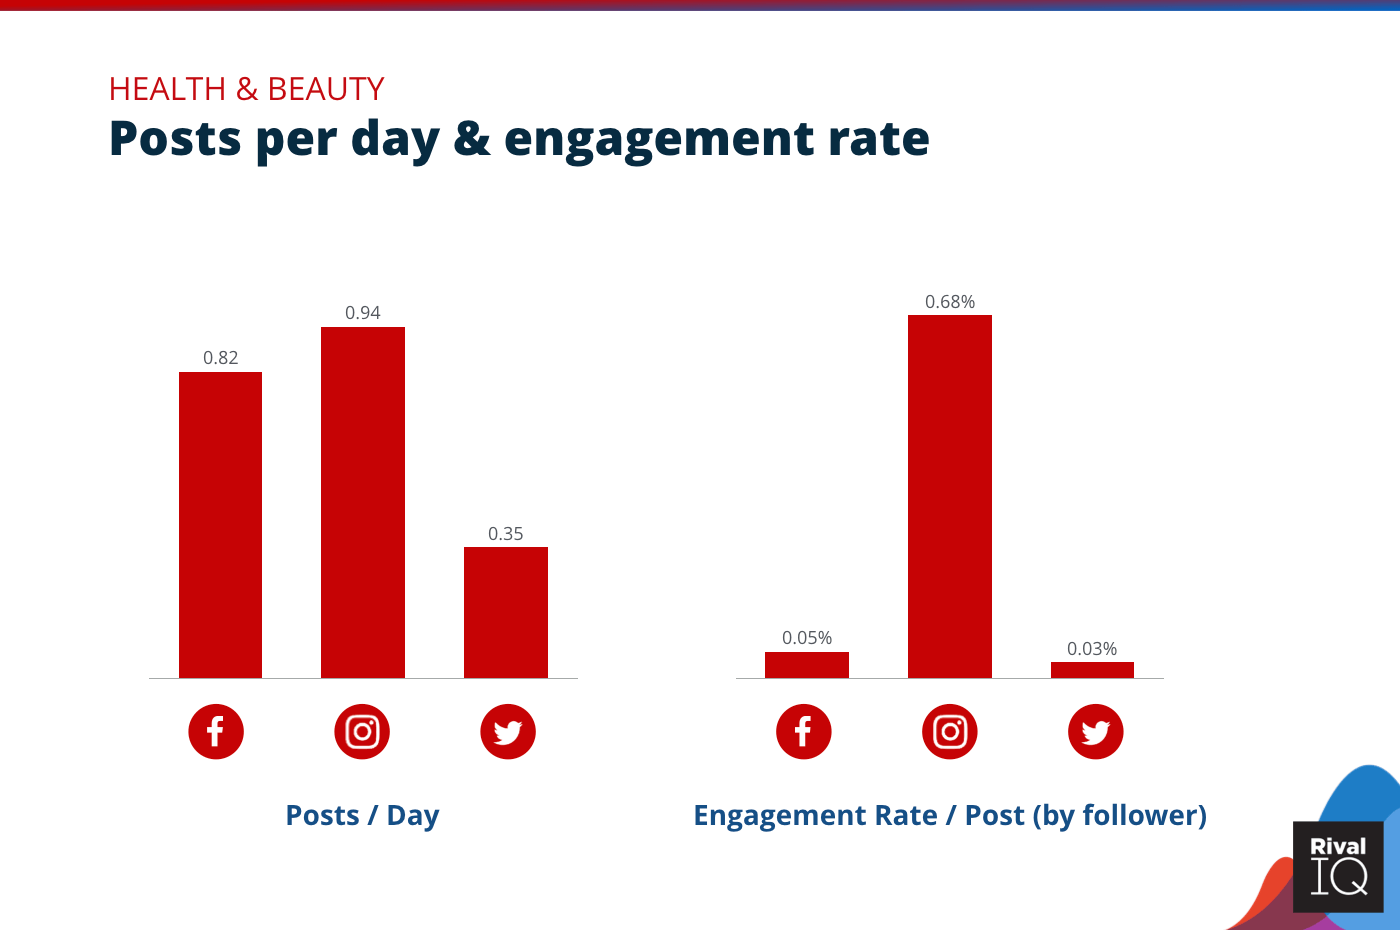
Posts per day and engagement rate per post across all channels, Health & Beauty
Health & Beauty brands saw below-median engagement rates despite median posting frequency on Facebook, Instagram, and Twitter, suggesting there’s more work to be done to engage followers.

Facebook posts per week and engagement rate by post type, Health & Beauty
Health & Beauty saw a 20% increase in photo performance on Facebook this year–always nice to report wins.
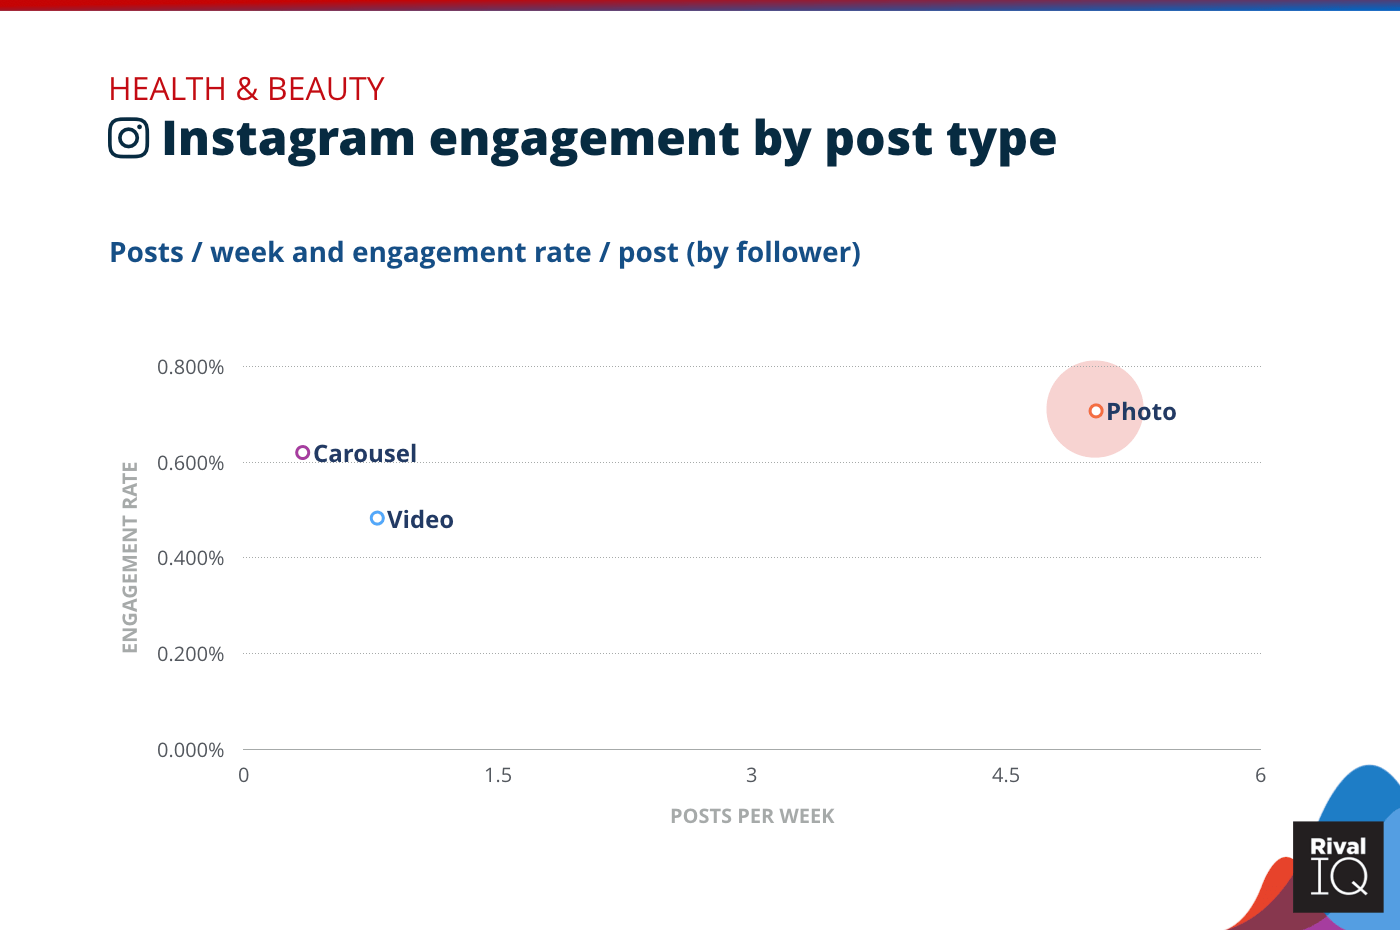
Instagram posts per week and engagement rate by post type, Health & Beauty
Photo posts on Instagram are top performers for Health & Beauty brands, and they’re taking advantage of this success by posting pictures more often than carousels or videos.
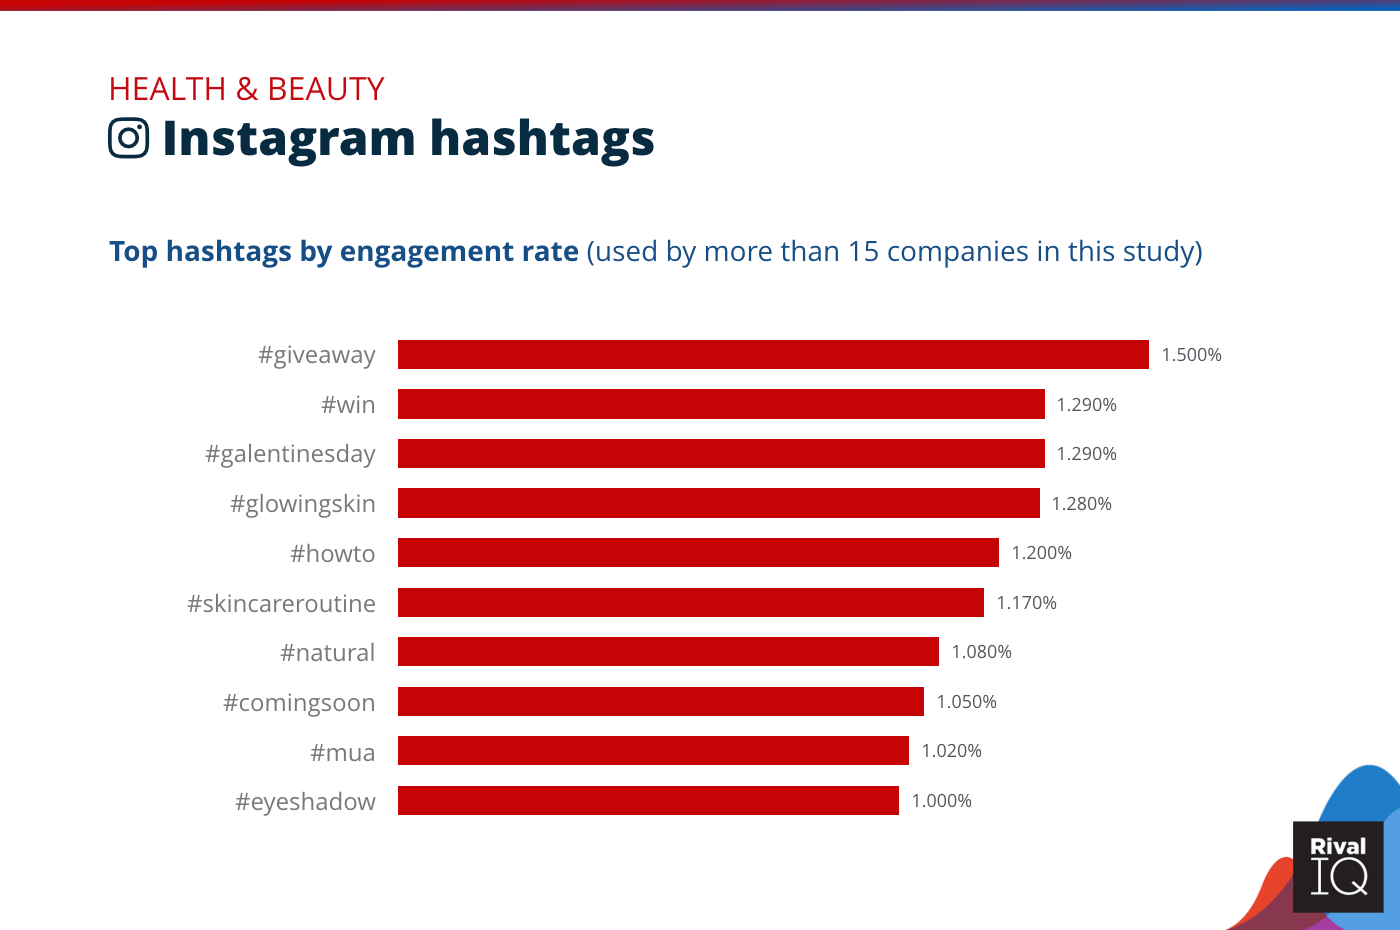
Top Instagram hashtags by engagement rate, Health & Beauty
Contests and giveaways topped the Instagram hashtag charts for Health & Beauty brands, but these brands also used hashtags like #skincareroutine and #howto to engage Instagram users looking to learn more about skincare and beauty routines.
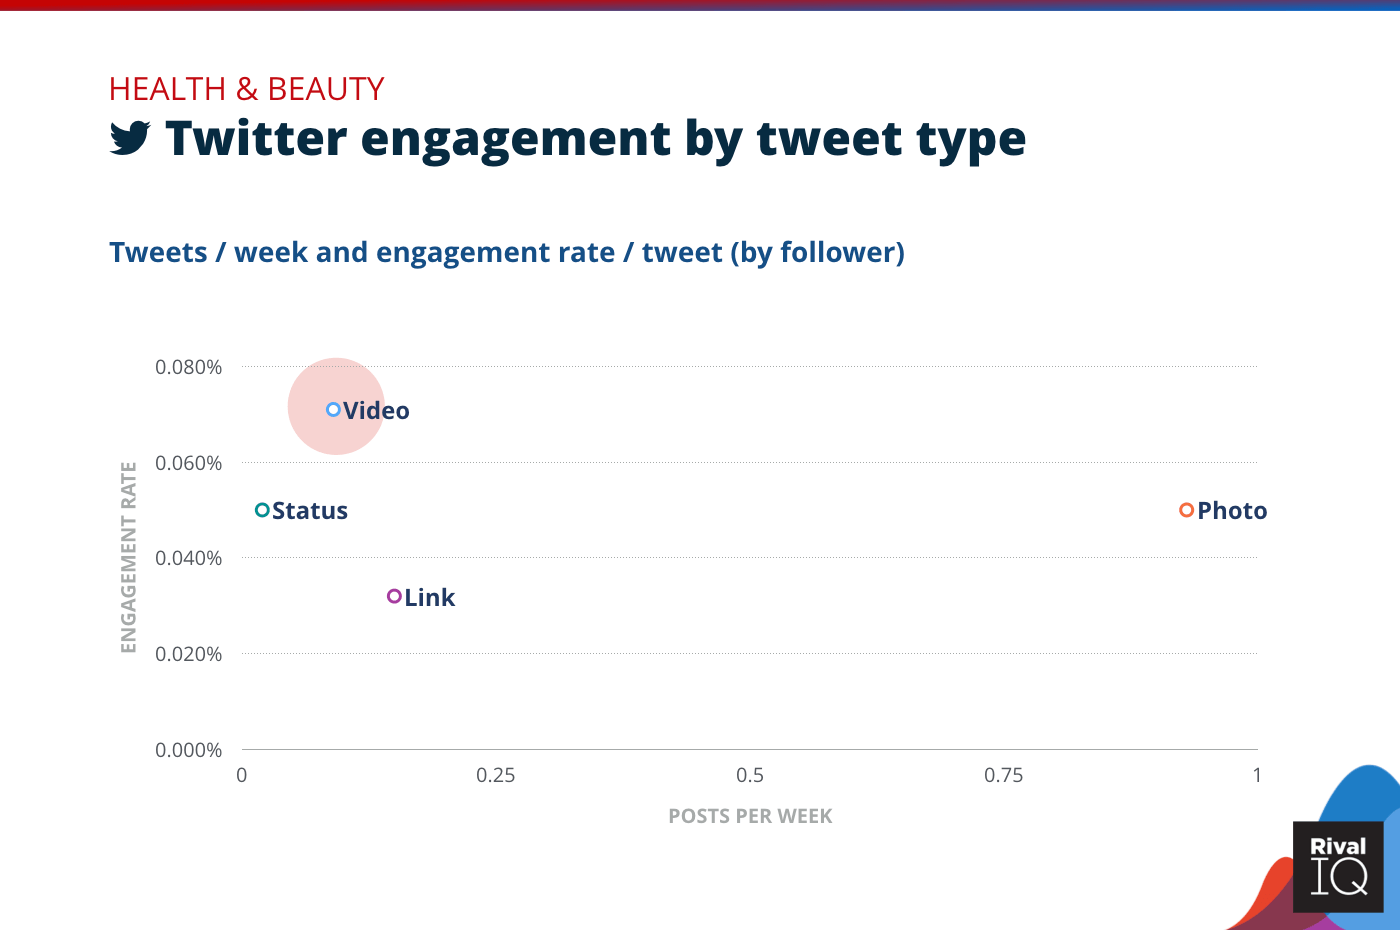
Twitter posts per week and engagement rate by tweet type, Health & Beauty
Video was a top-performing tweet type for Health & Beauty brands this year on Twitter despite their infrequency. Consider repurposing video content from Facebook and Instagram for use on Twitter.
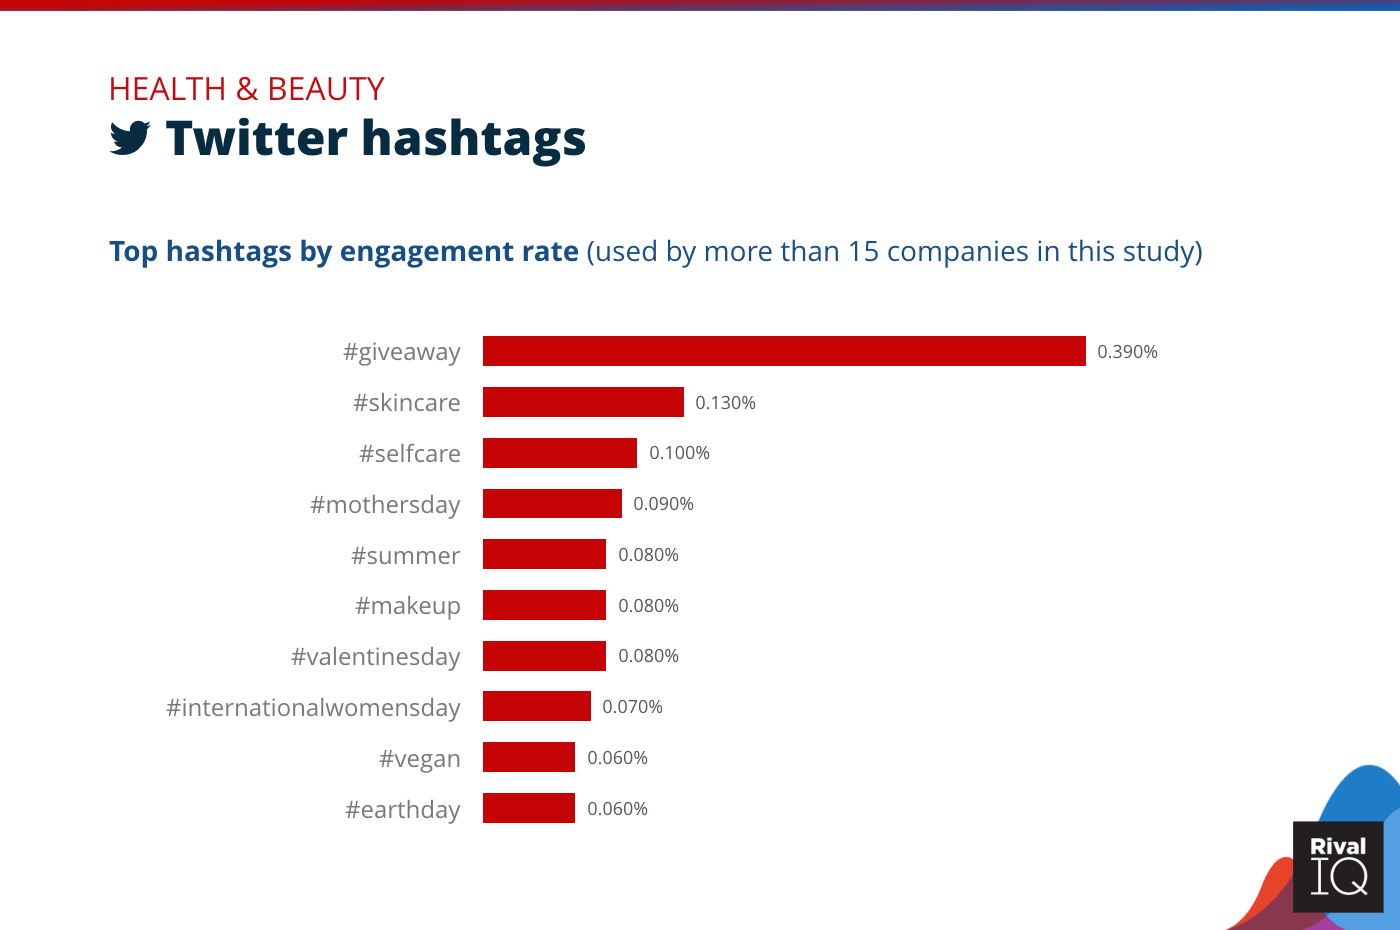
Top Twitter hashtags by engagement rate, Health & Beauty
As on Instagram, the #giveaway hashtag blew others out of the water, and skincare and holiday-themed hashtags also did well.
Industry Snapshot: Higher Ed
Higher Ed won the gold on Instagram and Twitter this year and tied for the silver on Facebook. Current students, parents, and alumni loved seeing what their colleges and universities are up to on social.
For extra credit in improving engagement rates:
- Keep creating hyper-relevant and timely content–your fans love holiday-themed or seasonal posts.
- Try to post more videos on Twitter.
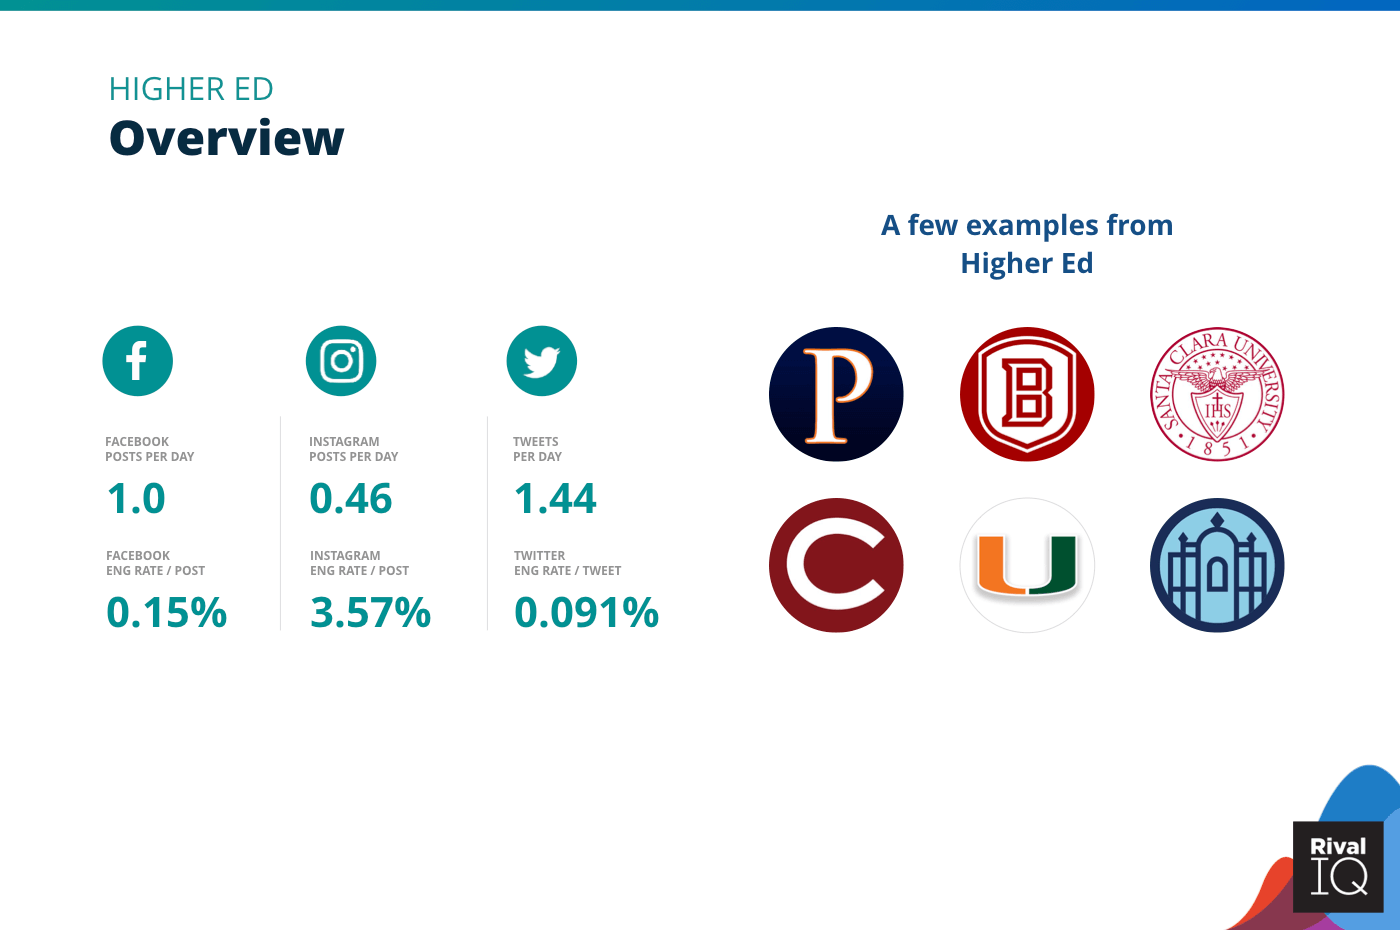
Overview of all benchmarks, Higher Ed
Notable Higher Ed colleges and universities in this year’s report include Pepperdine University, Bradley University, Santa Clara University, Colgate University, University of Miami, and Smith College.
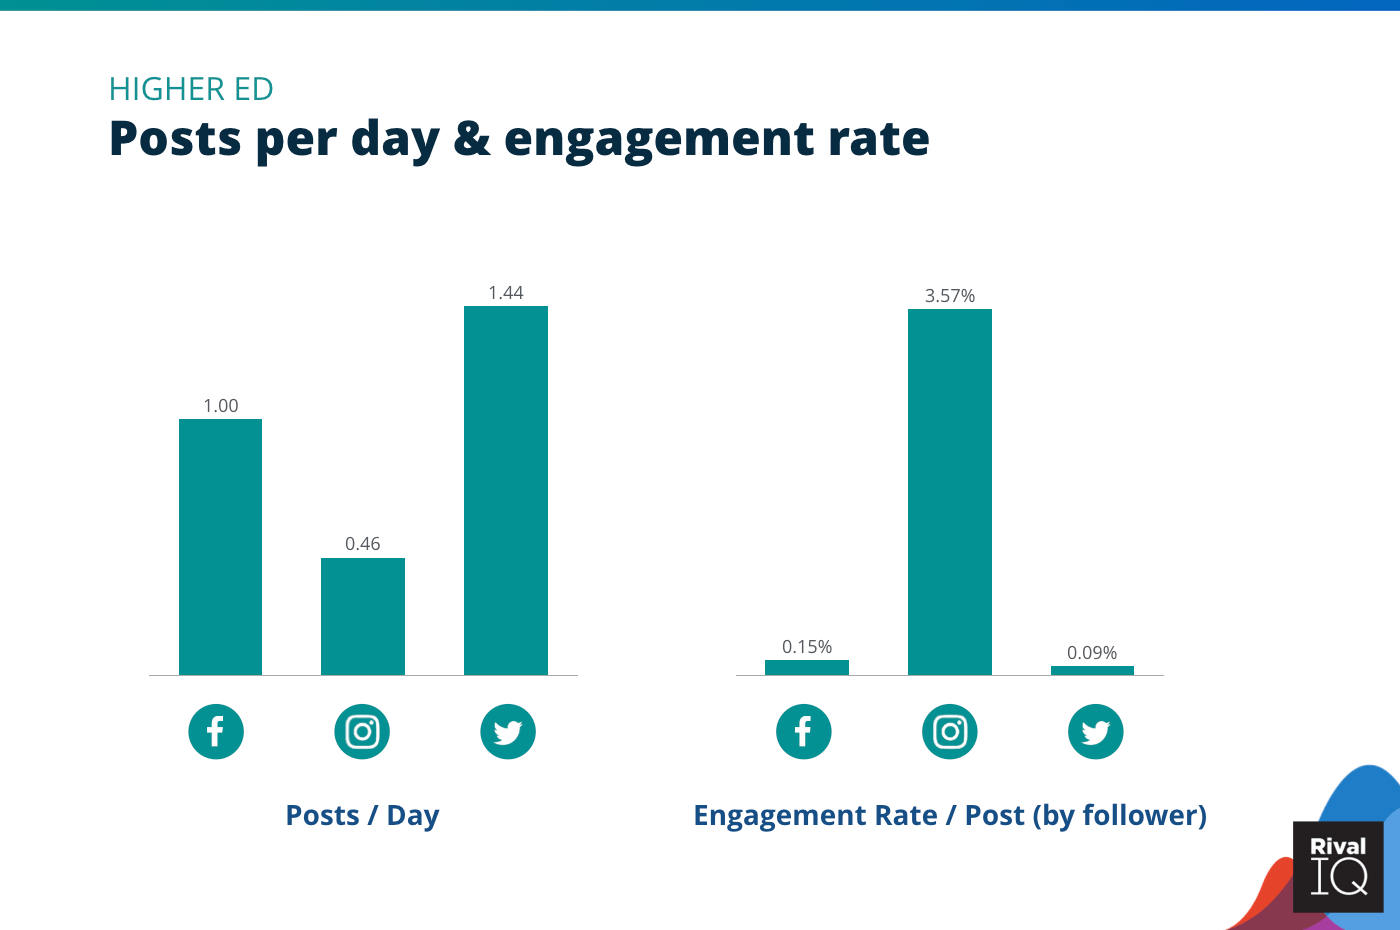
Posts per day and engagement rate across per post all channels, Higher Ed
Higher Ed dominated with high Instagram and Twitter engagement rates while staying in the middle of the pack with posting frequency, suggesting they’re giving their followers exactly the content they want on these channels without any wasted effort.
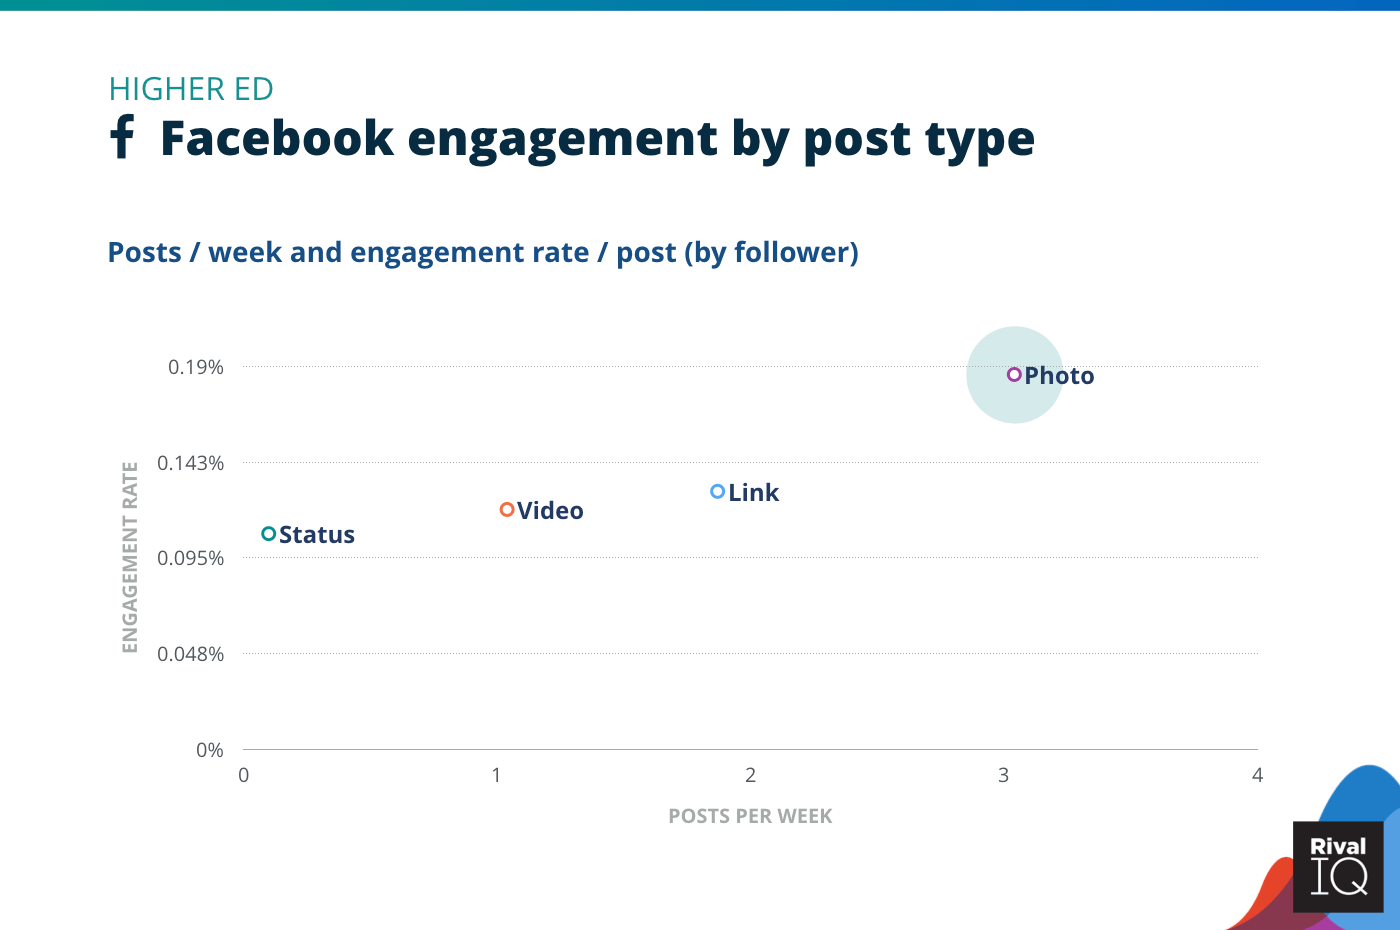
Facebook posts per week and engagement rate by post type, Higher Ed
Higher Ed’s increased engagement on Facebook this year really shines when examining post types–these schools saw an increase in engagement across photos, links, and status updates.
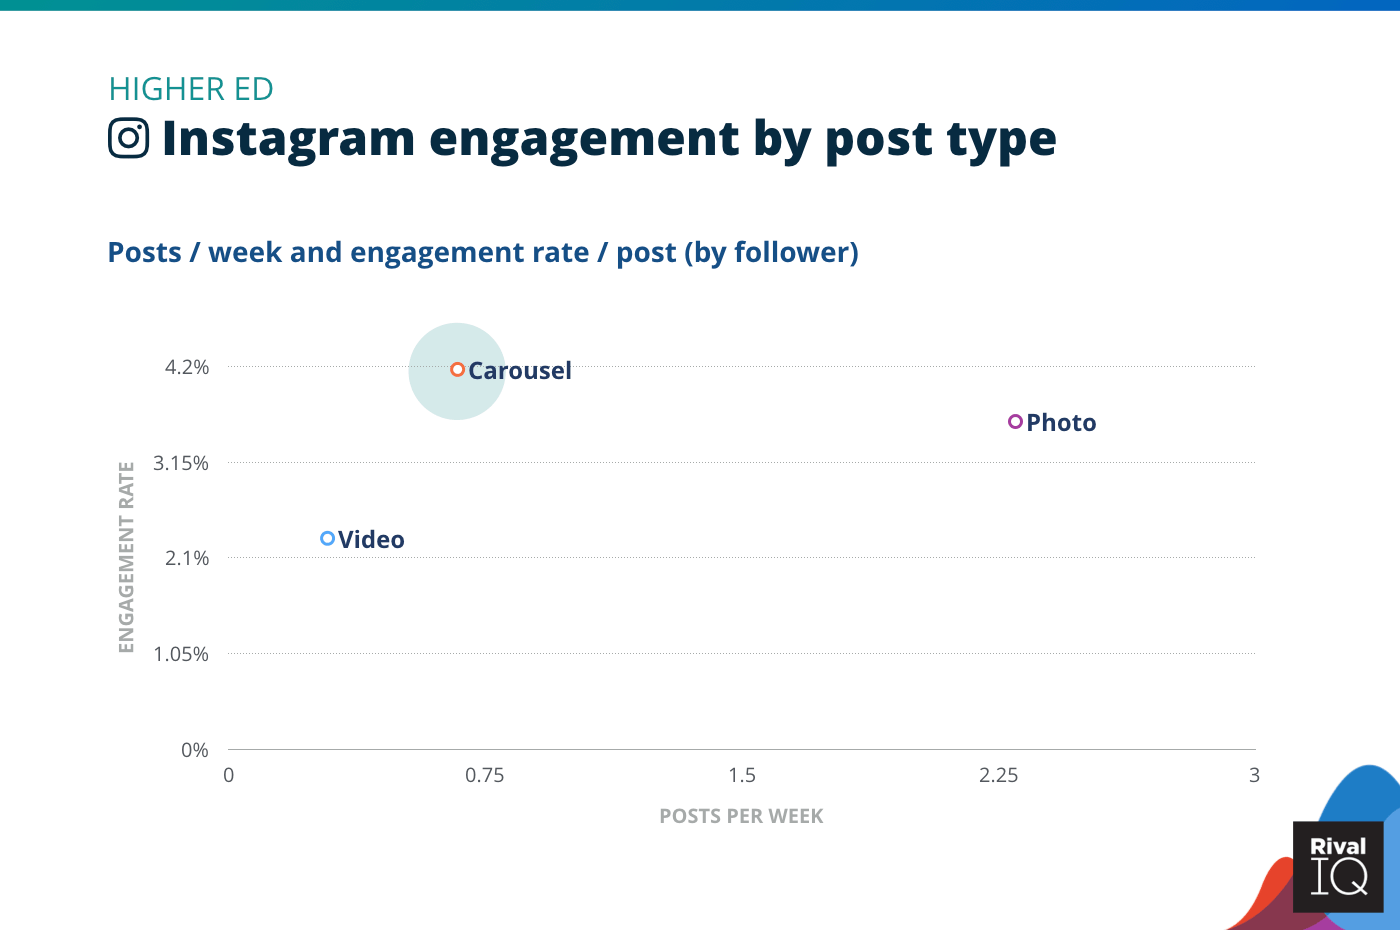
Instagram posts per week and engagement rate by post type, Higher Ed
Carousels were a top-performing post type for Higher Education, and colleges like Holy Cross and University of Virginia went above and beyond on Instagram with posts about epic sports wins to excite current students and reengage alumni.
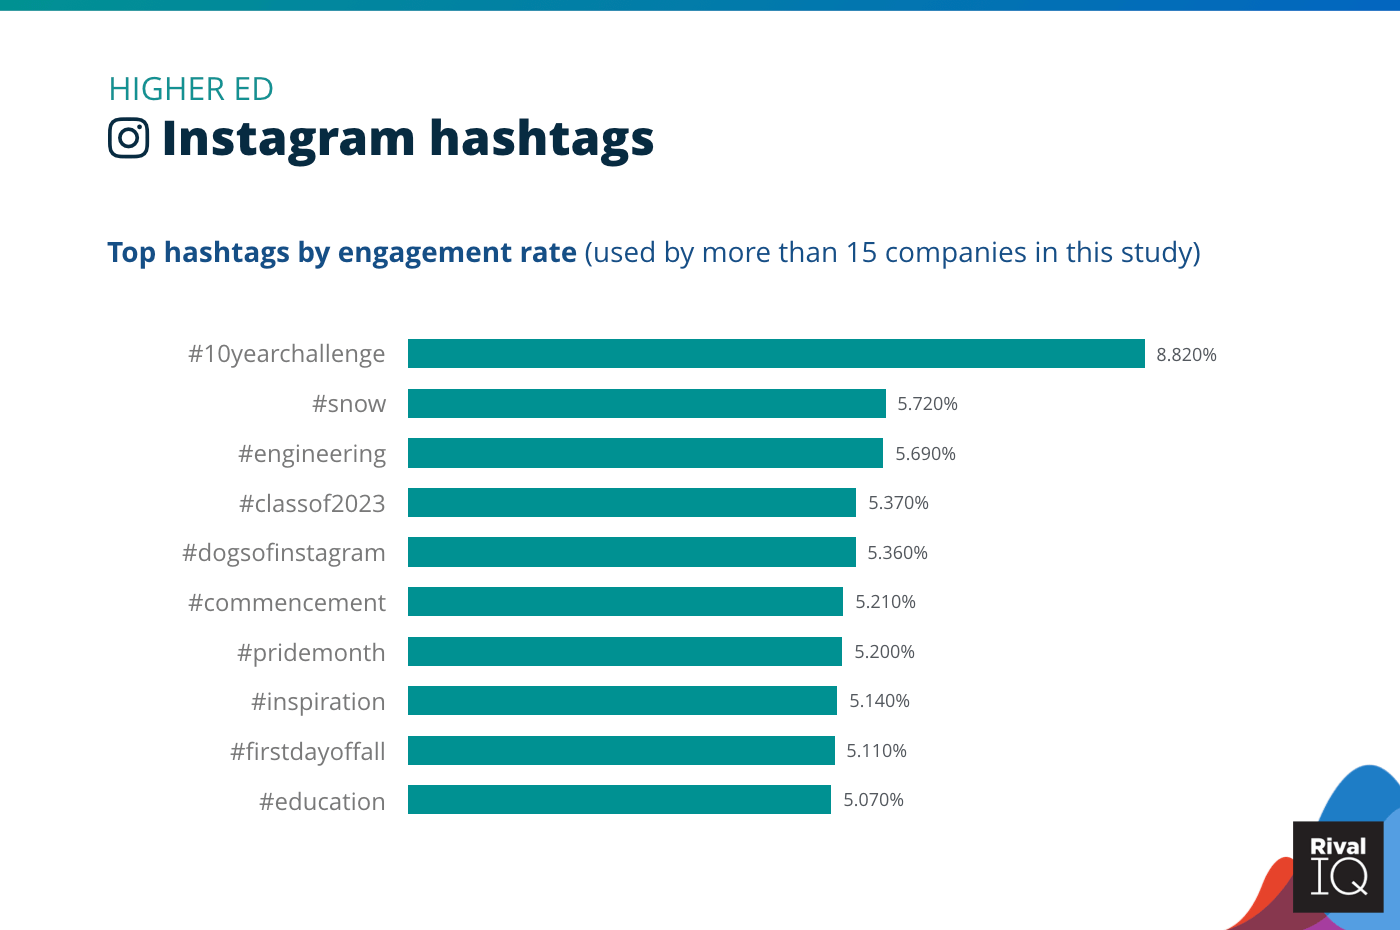
Top Instagram hashtags by engagement rate, Higher Ed
Higher Ed sees the highest Instagram hashtag engagement rates for the second year in a row. These colleges and universities grabbed the gold with seasonally-appropriate and trending hashtags.
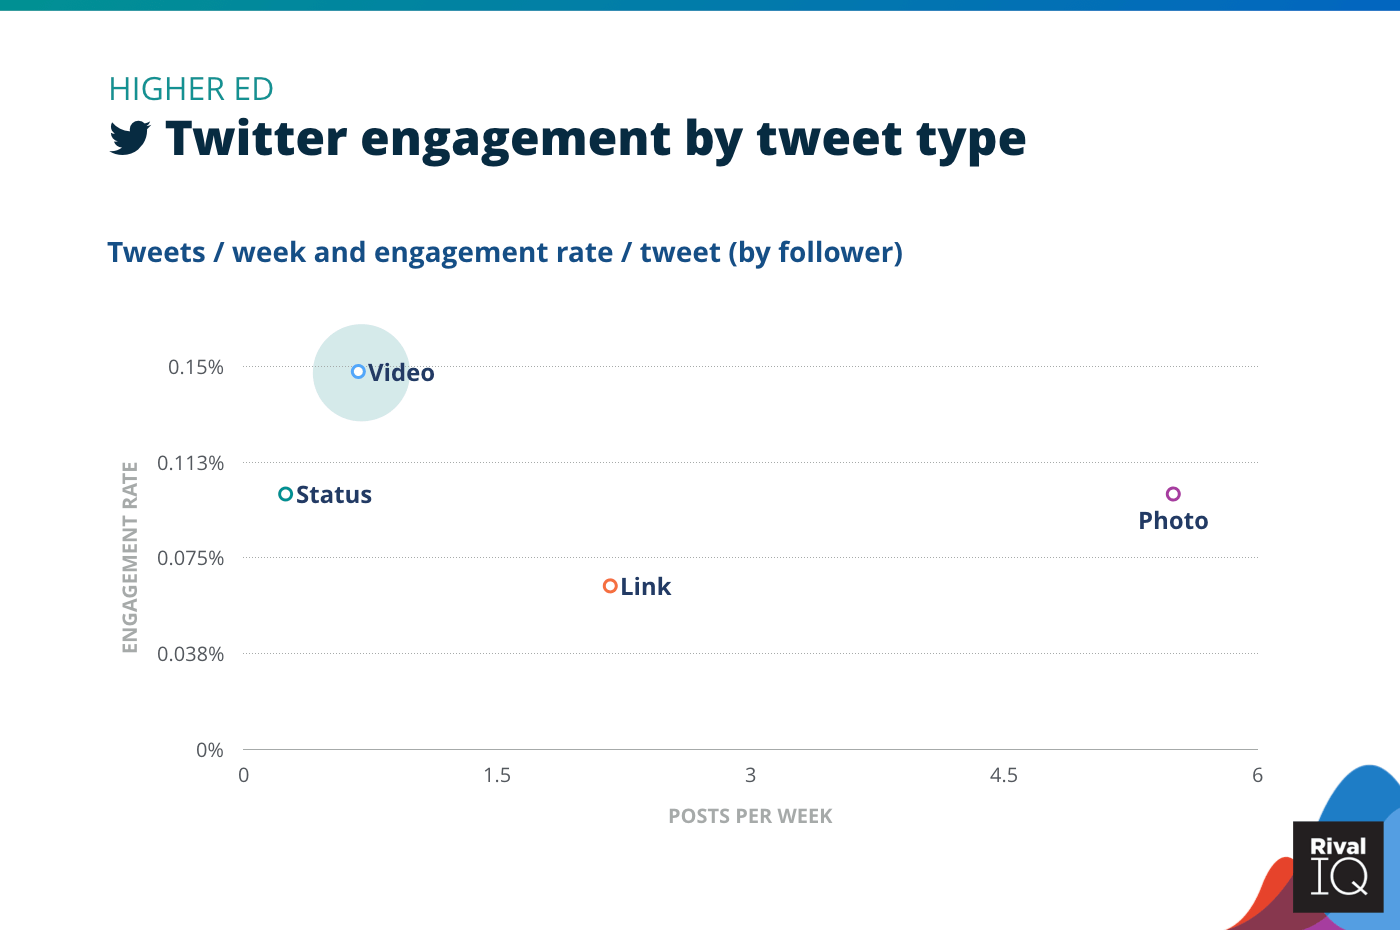
Twitter posts per week and engagement rate by tweet type, Higher Ed
Higher Ed was our overall winner on Twitter this year and should tweet more videos to lengthen that lead.
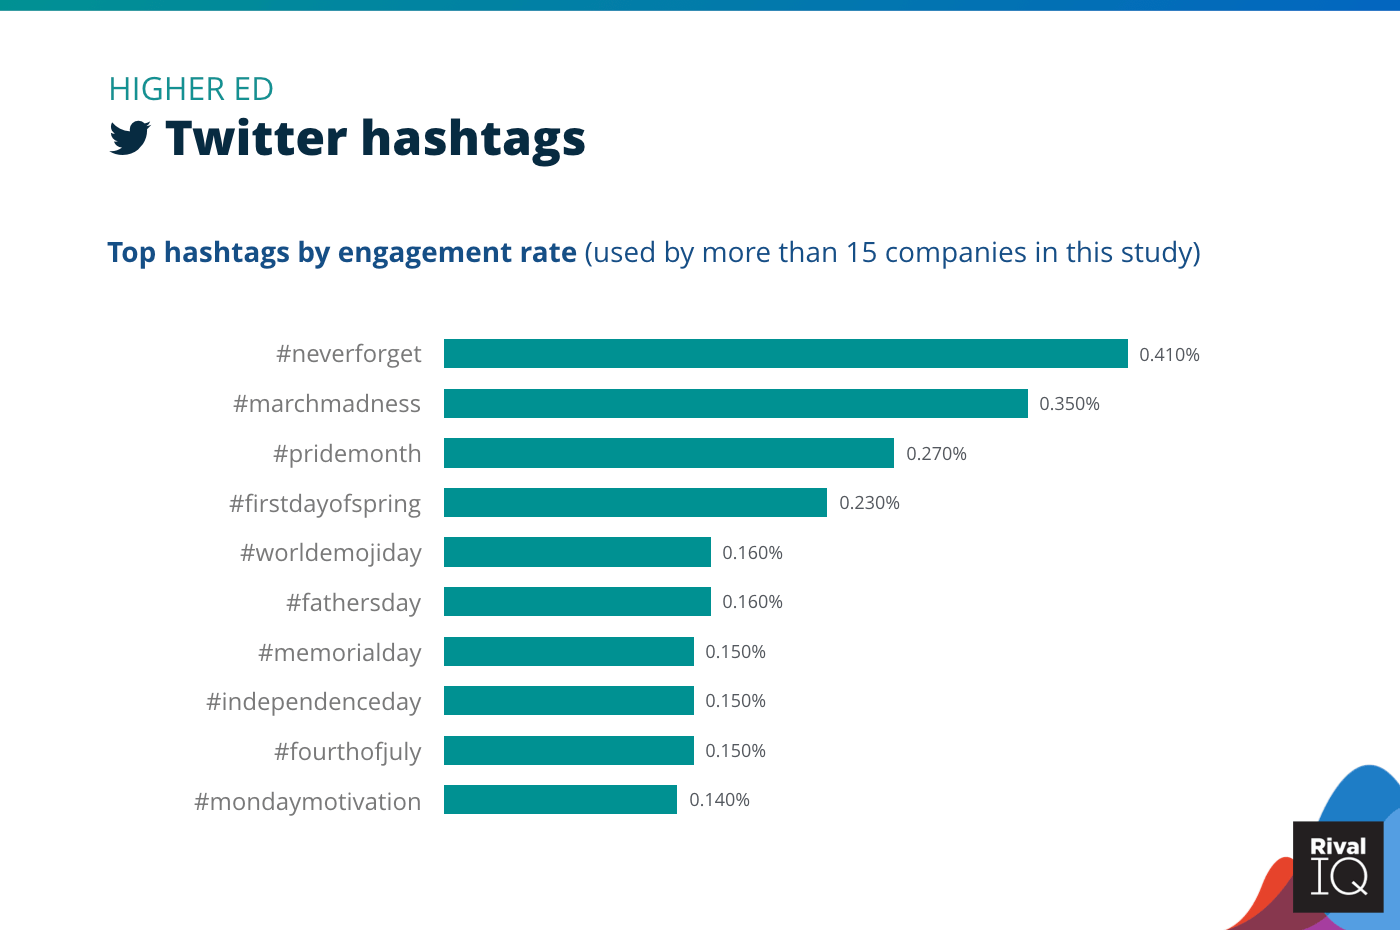
Top Twitter hashtags by engagement rate, Higher Ed
Nine of Higher Ed’s top-performing Twitter hashtags were about holidays or seasons, helping these colleges and universities stay current all year long.
Industry Snapshot: Home Decor
Home Decor brands struggled again this year with below-average engagement on Facebook, Instagram, and Twitter. On the bright side, these brands were able to hold their engagement rates steady on Facebook from last year.
Some ideas for increasing engagement:
- Combine photos on Instagram into carousels.
- Increase videos and status updates on Twitter to make the most of increased engagement on that channel.
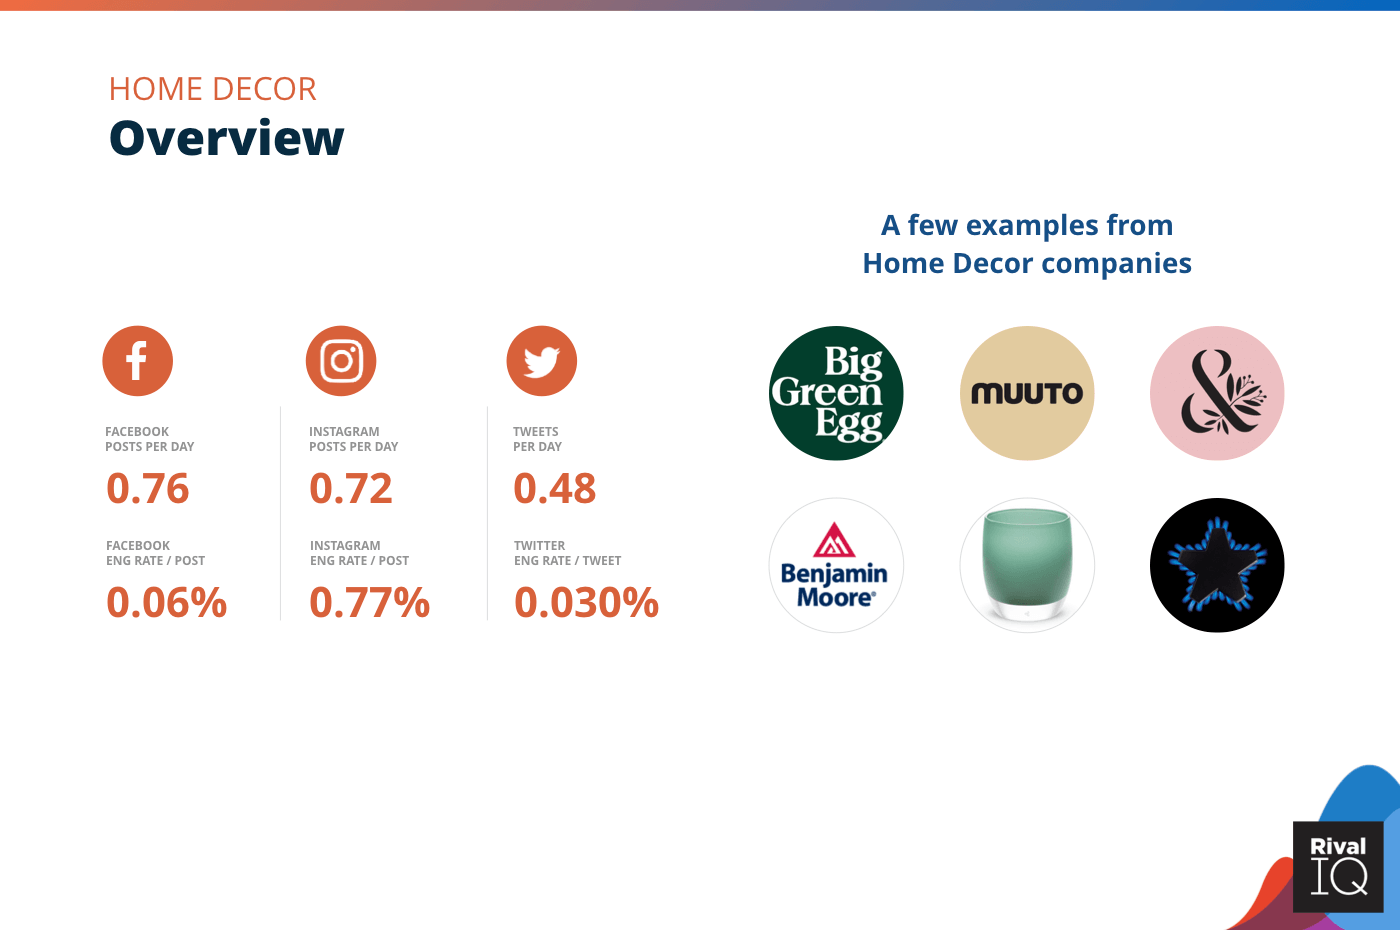
Overview of all benchmarks, Home Decor
Notable Home Decor brands in this report include Big Green Egg, Muuto, Benjamin Moore, Glassybaby, and Thermador.
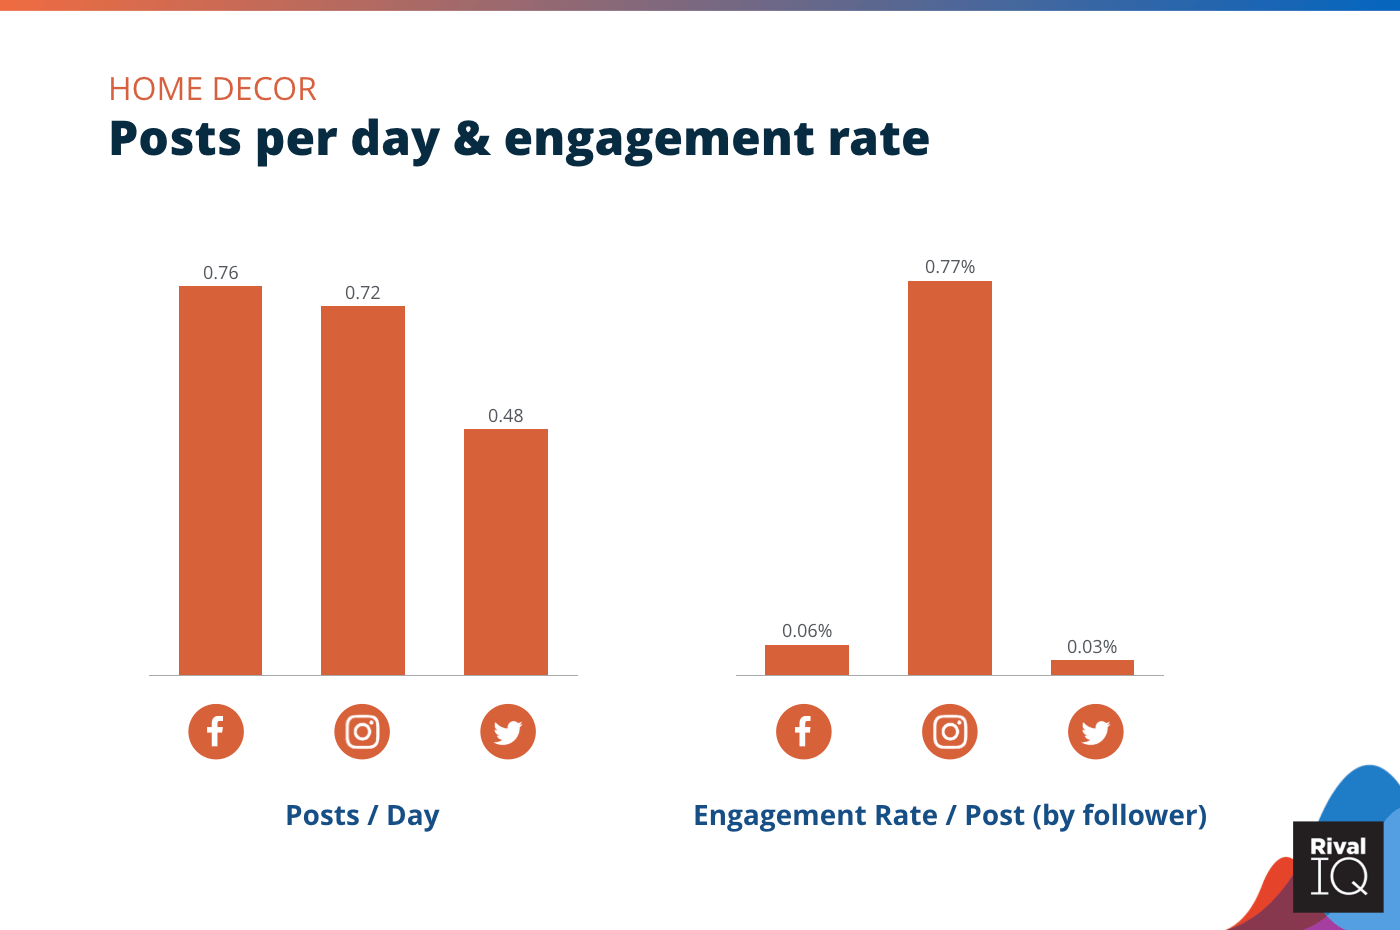
Posts per day and engagement rate per post across all channels, Home Decor
Home Decor brands saw engagement rates and posting frequency below the median on all three channels.
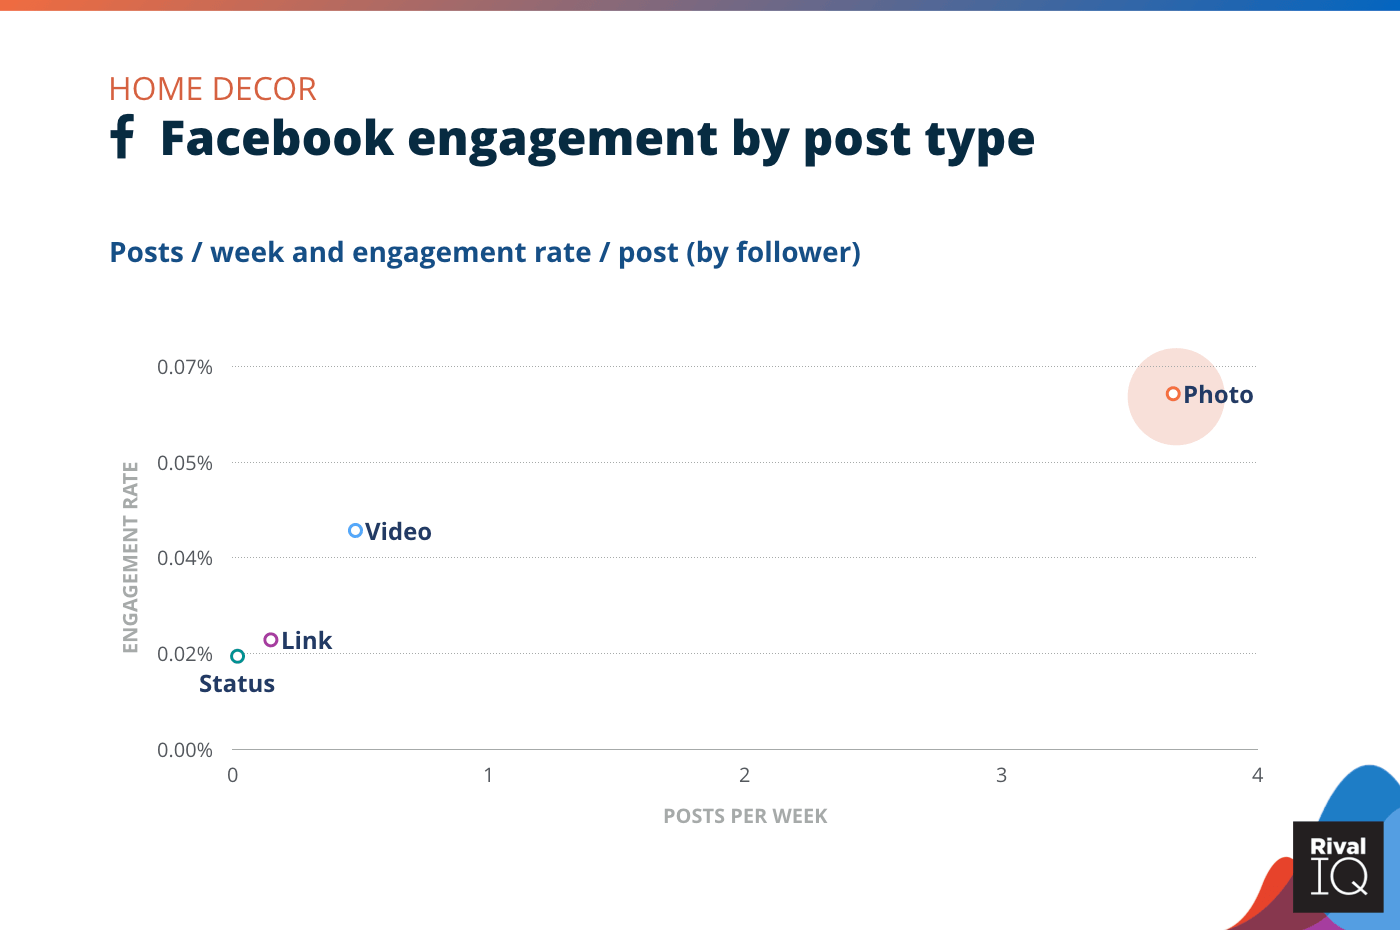
Facebook posts per week and engagement rate by post type, Home Decor
Photos continue to score the highest engagement rates on Facebook for Home Decor brands.
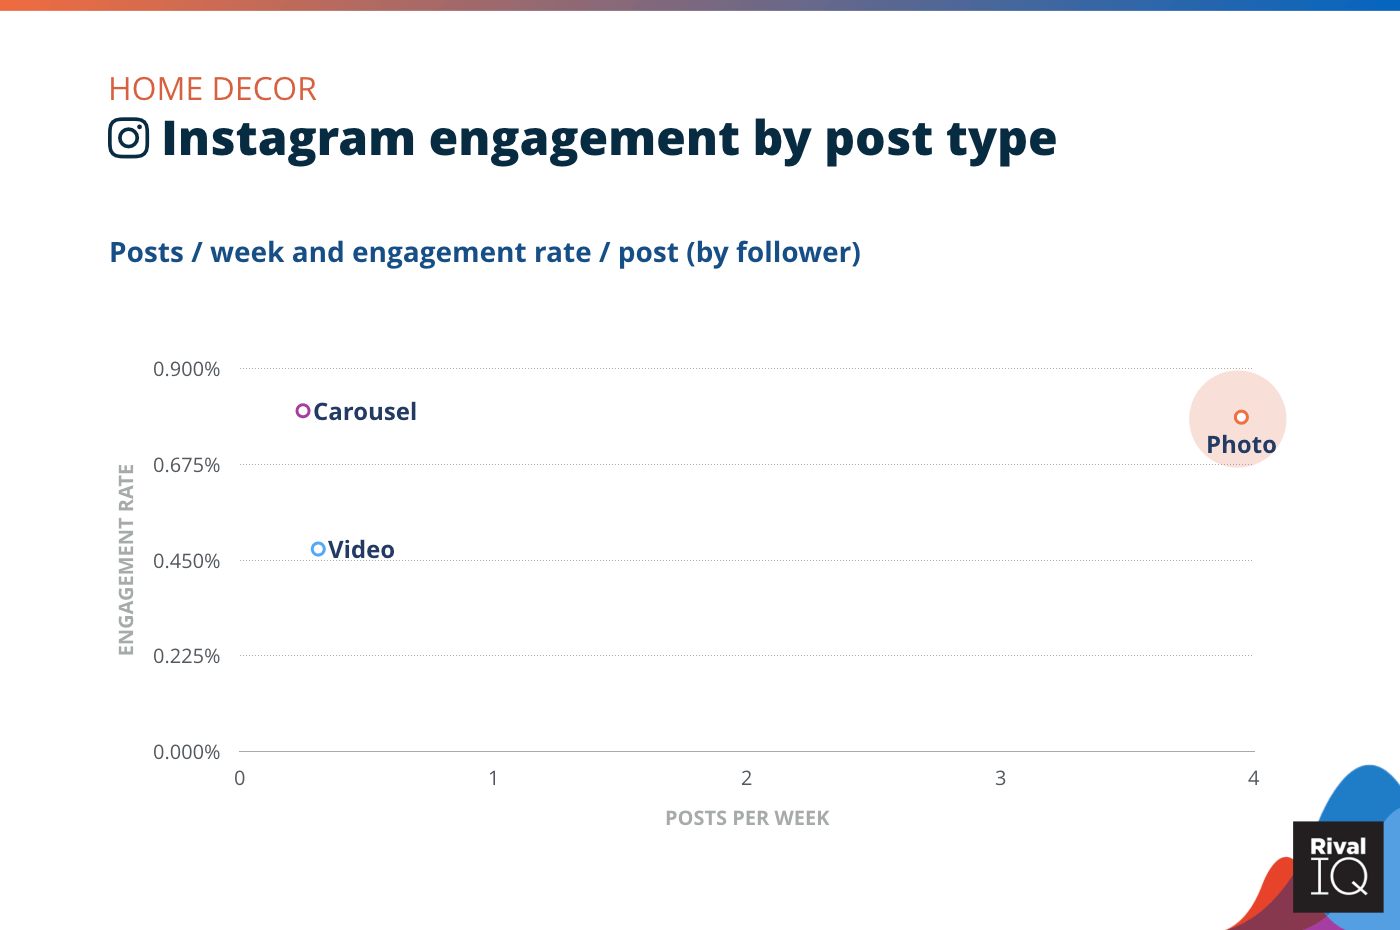
Instagram posts per week and engagement rate by post type, Home Decor
Photos rocked the same engagement as carousels for Home Decor brands but were posted more than 4 times as often. Try to diversify your post types on Instagram.
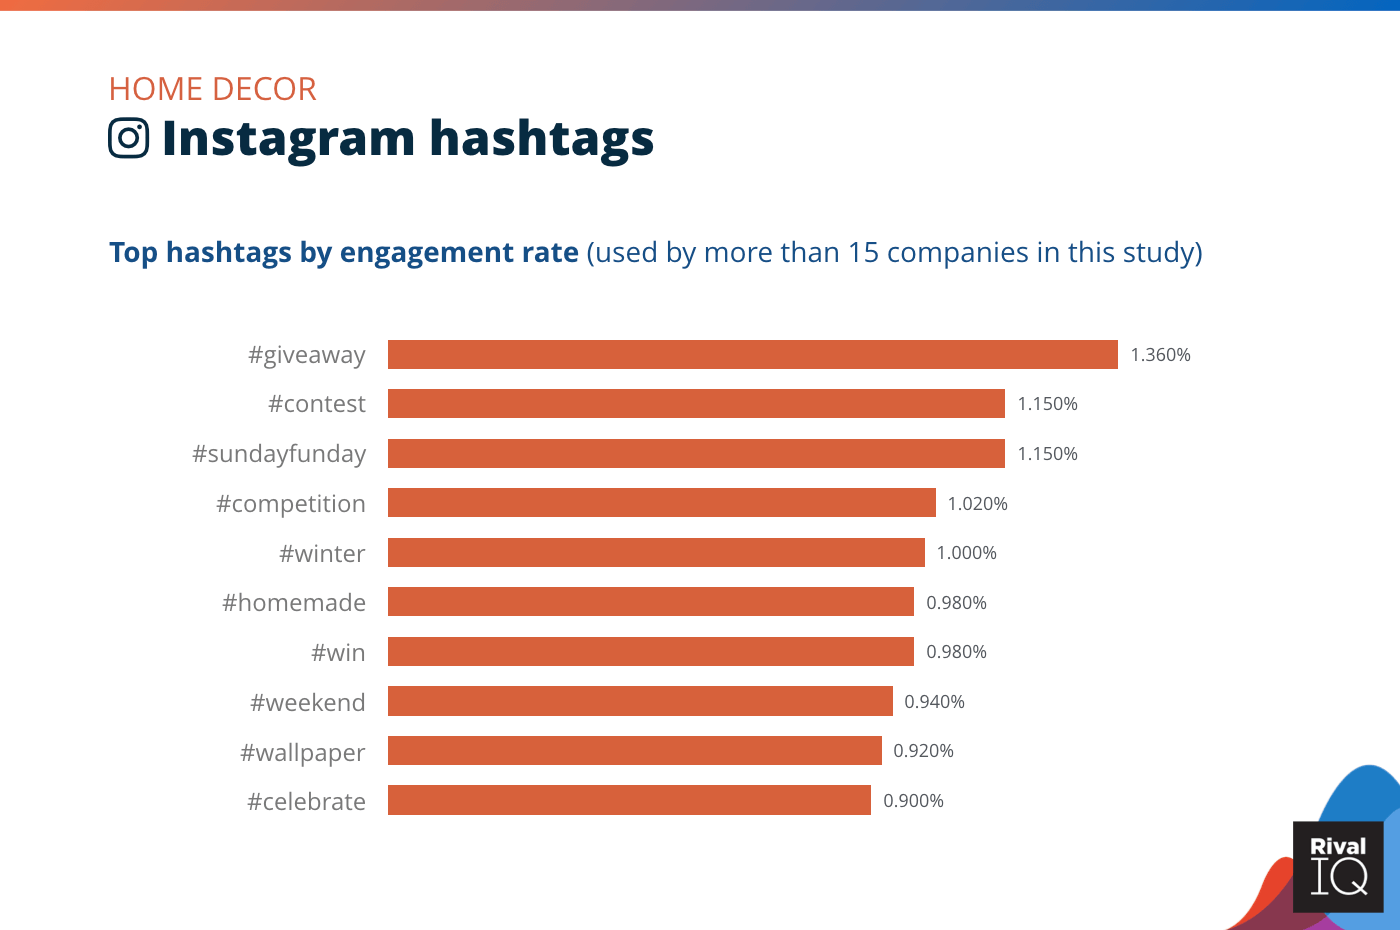
Top Instagram hashtags by engagement rate, Home Decor
Home Decor saw the lowest engagement rates from hashtags on Instagram. Conduct more research to see which hashtags are performing well for competitors, and try to use hashtags that are more specific to Home Decor.
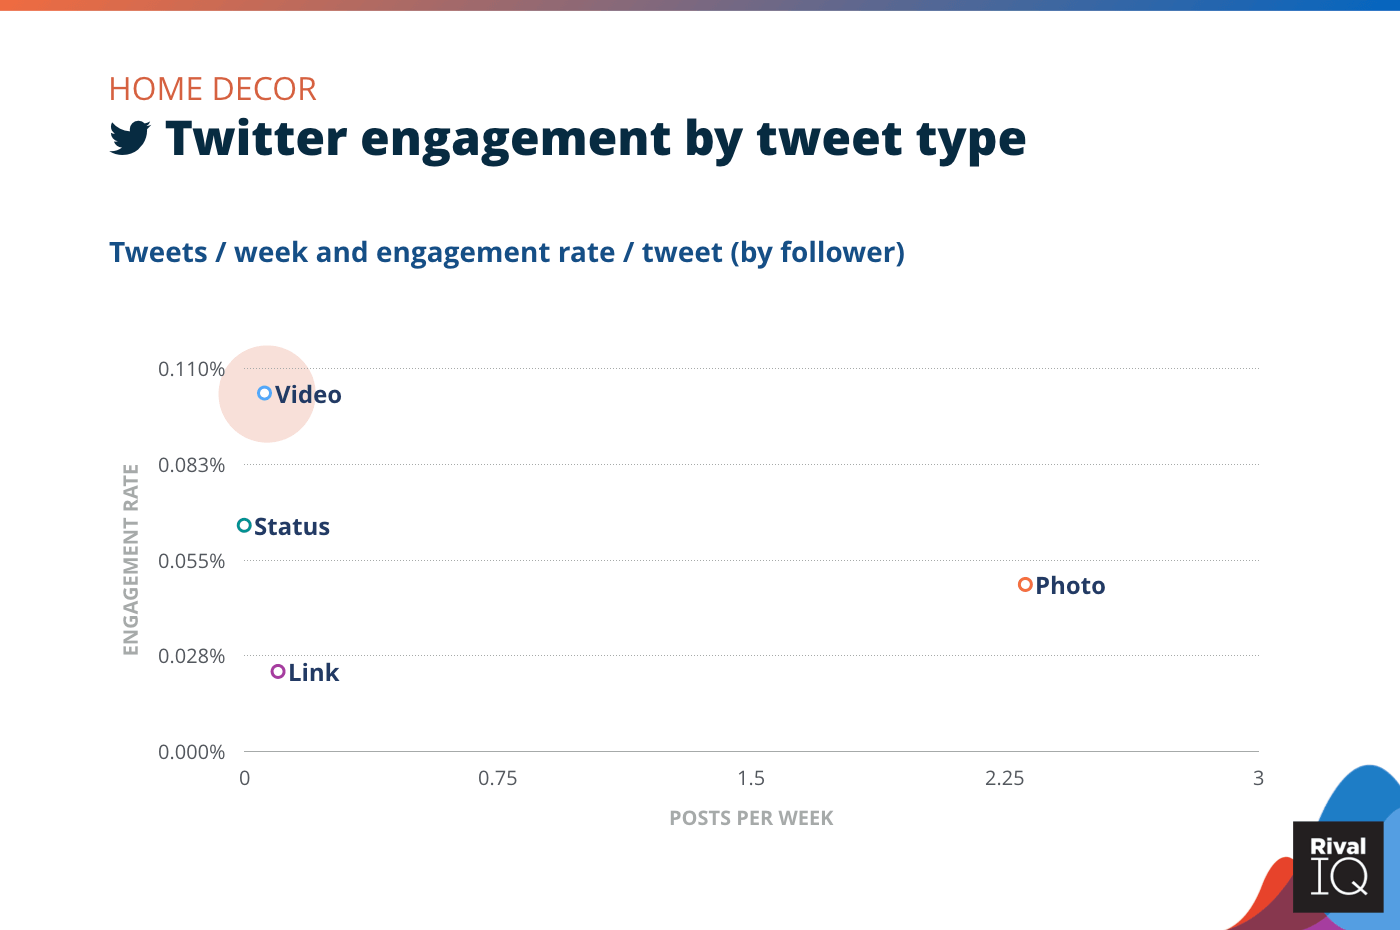
Twitter posts per week and engagement rate by tweet type, Home Decor
Home Decor brands saw an increase in engagement on videos and status updates on Twitter, indicating that there’s an audience on Twitter for all things Home Decor.
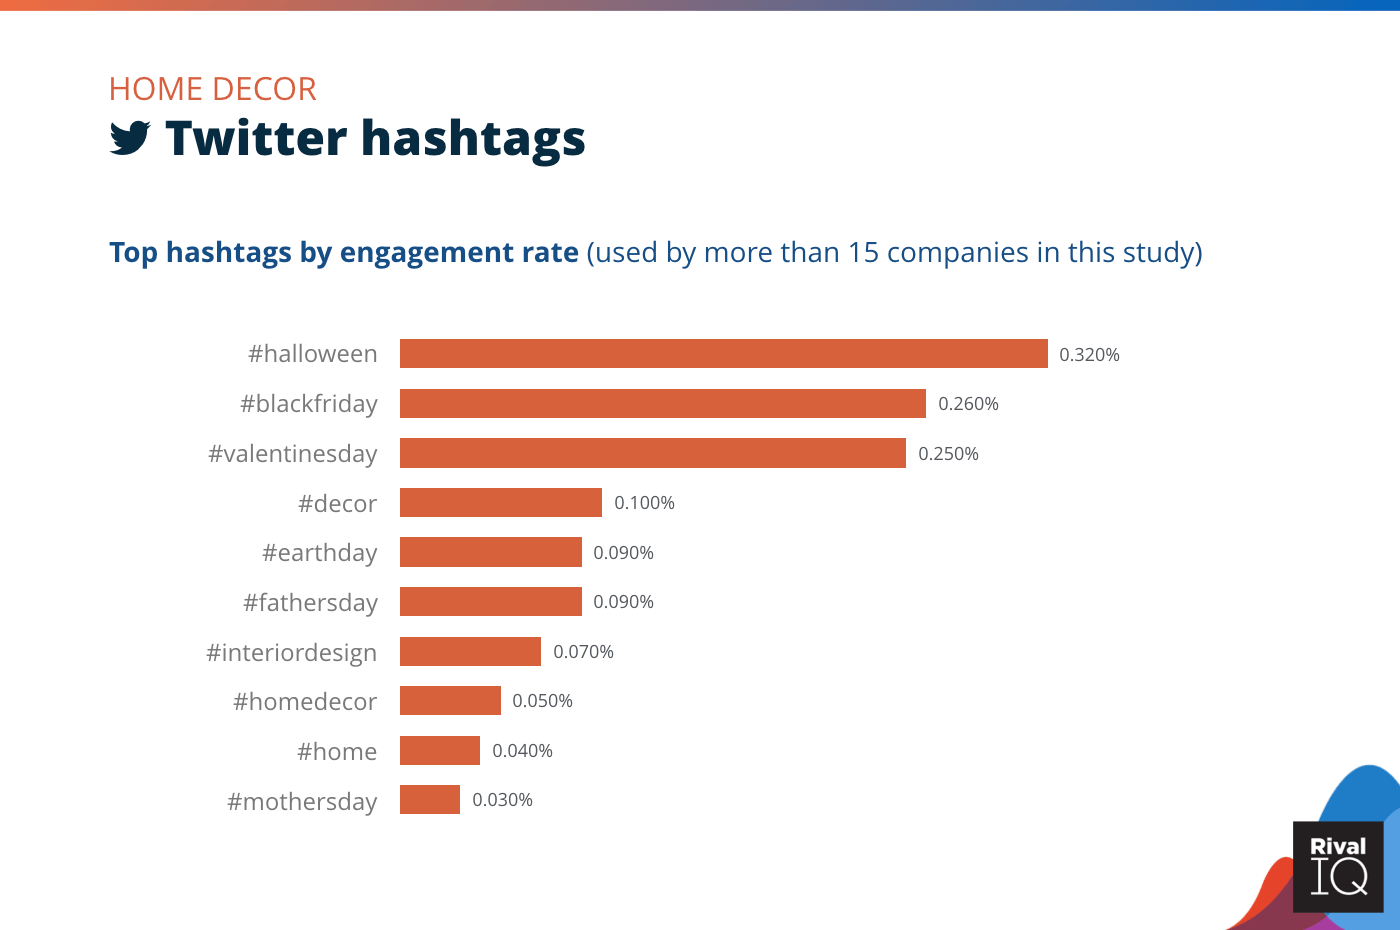
Top Twitter hashtags by engagement rate, Home Decor
No surprises that Home Decor’s top hashtags featured decoration-heavy holidays like Halloween and Valentine’s Day.
Hungry for more benchmarking? We’ve got the definitive guide to all things Instagram Stories.
Get the Instagram Stories Benchmark ReportIndustry Snapshot: Hotels & Resorts
Hotels & Resorts saw great engagement on Facebook this year and sat squarely in the middle of the pack on Instagram and Twitter. They used a wide variety of hashtags to engage followers on social.
A few suggestions to grow engagement:
- Repurpose those high-performing Facebook photos on Twitter and Instagram.
- Keeping pushing your hashtags beyond the contests to really help your followers find exactly what they’re looking for on Instagram and Twitter for their next getaway.
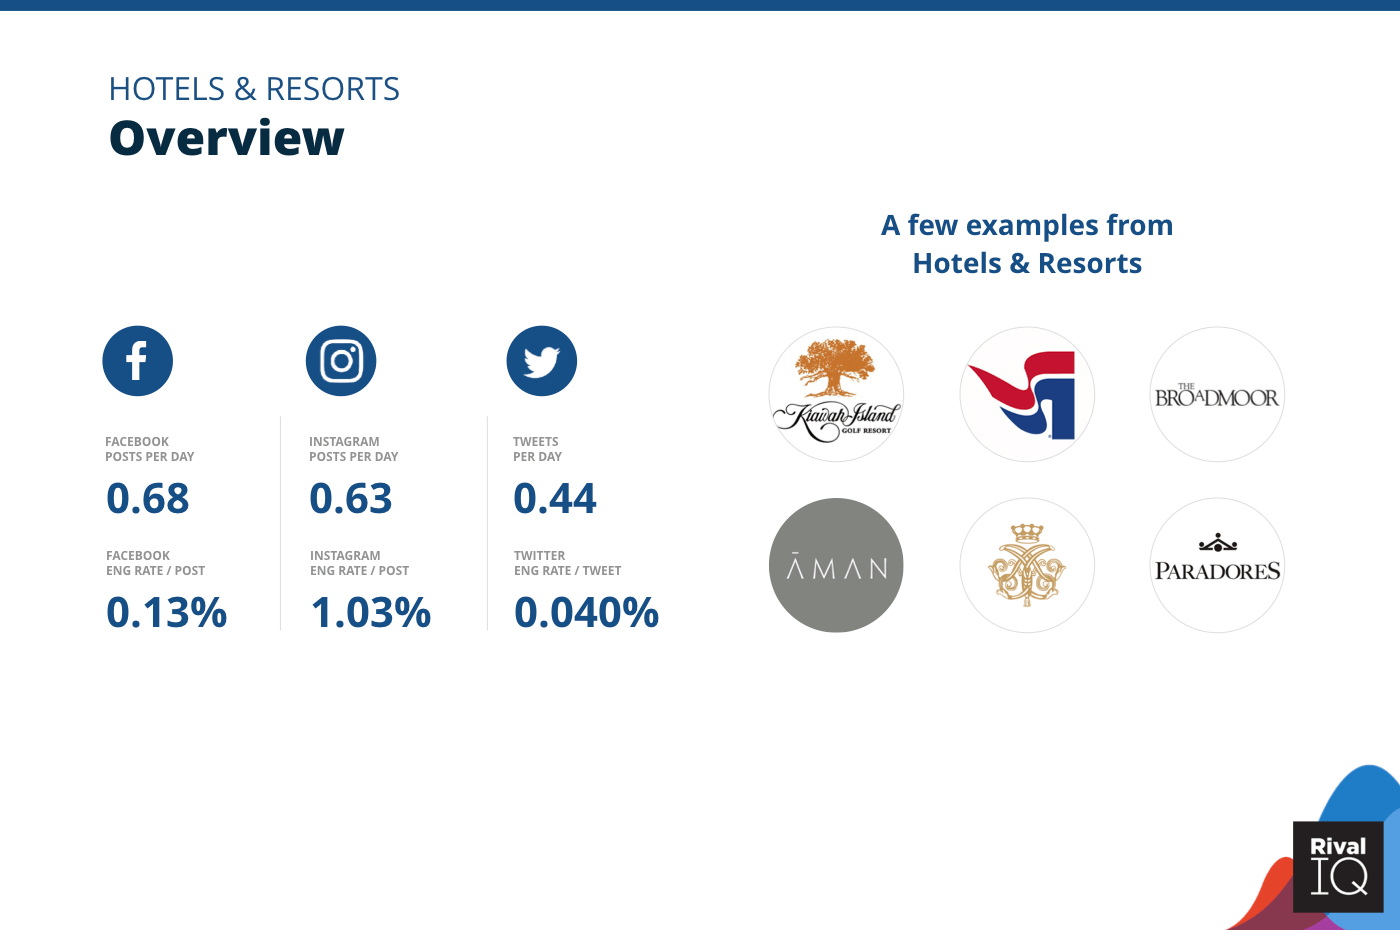
Overview of all benchmarks, Hotels & Resorts
Notable Hotels & Resorts in this year’s report include Kiawah Island Golf Resort, Steamboat, The Broadmoor, Aman Resorts, Ashford Castle, and Paradores.
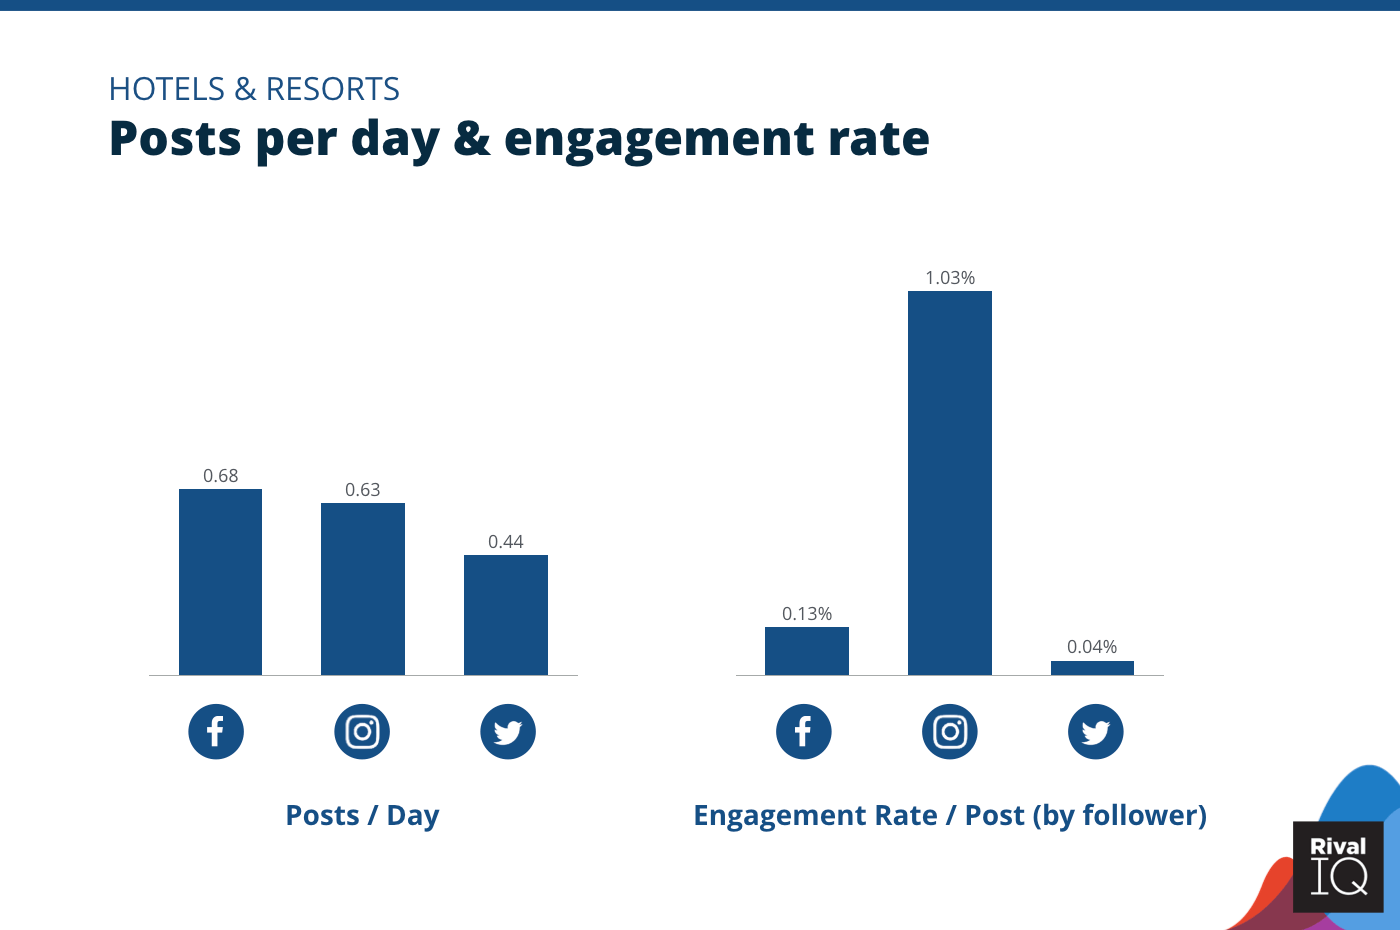
Posts per day and engagement rate per post across all channels, Hotels & Resorts
Hotels & Resorts scored third on Facebook this year thanks to high-performing photos.
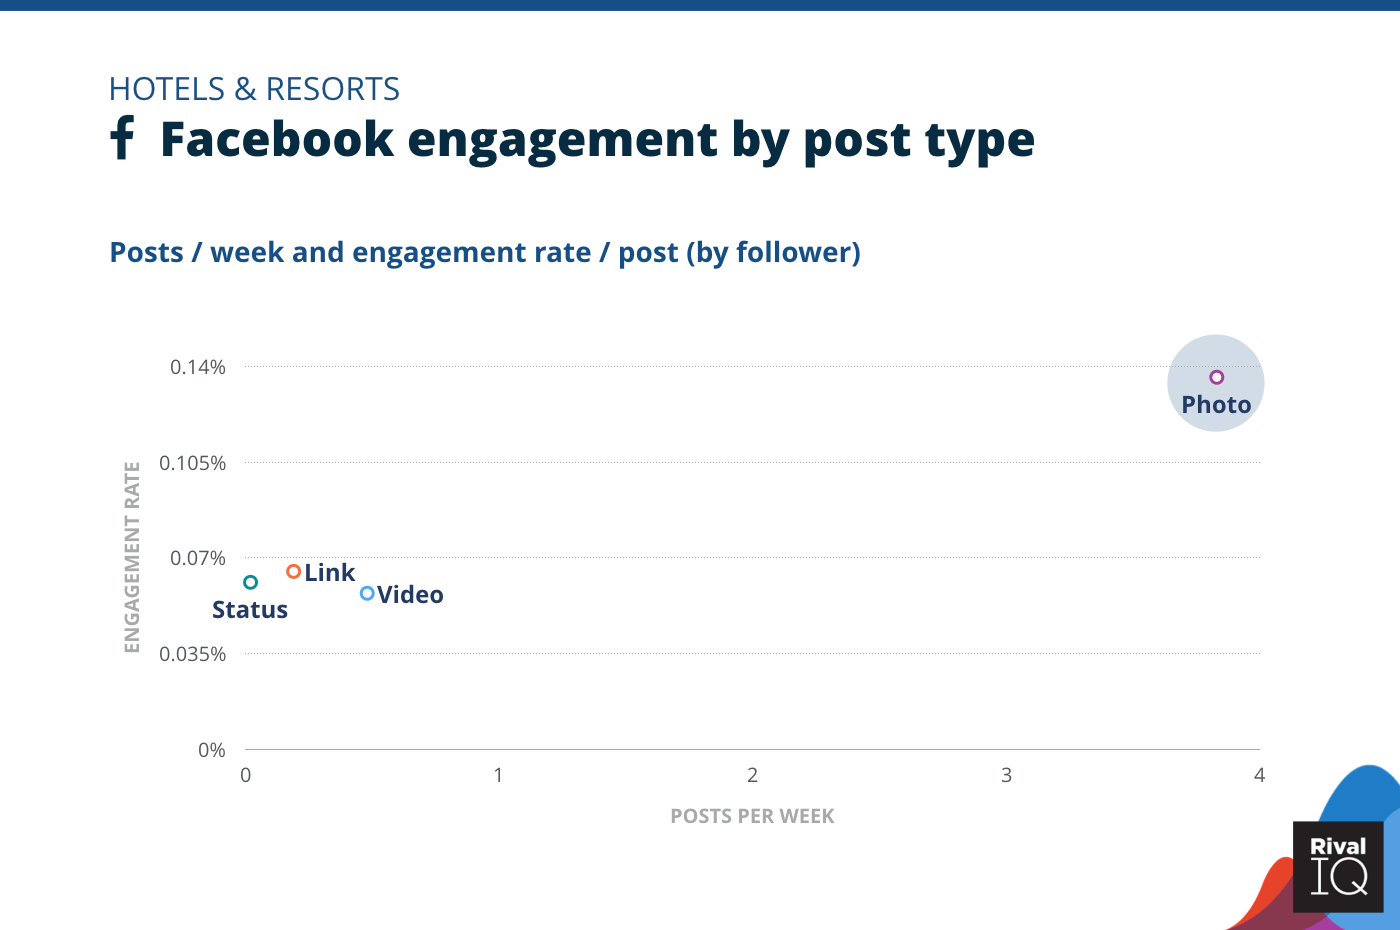
Facebook posts per week and engagement rate by post type, Hotels & Resorts
Photos performed twice as well as any other post type on Facebook for Hotels & Resorts, which is no surprise for an industry that relies on dreamy visuals to inspire followers to book their next vacation.

Instagram posts per week and engagement rate by post type, Hotels & Resorts
Every post type on Instagram took a hit this year, which is consistent with their 40% overall engagement drop on this channel.
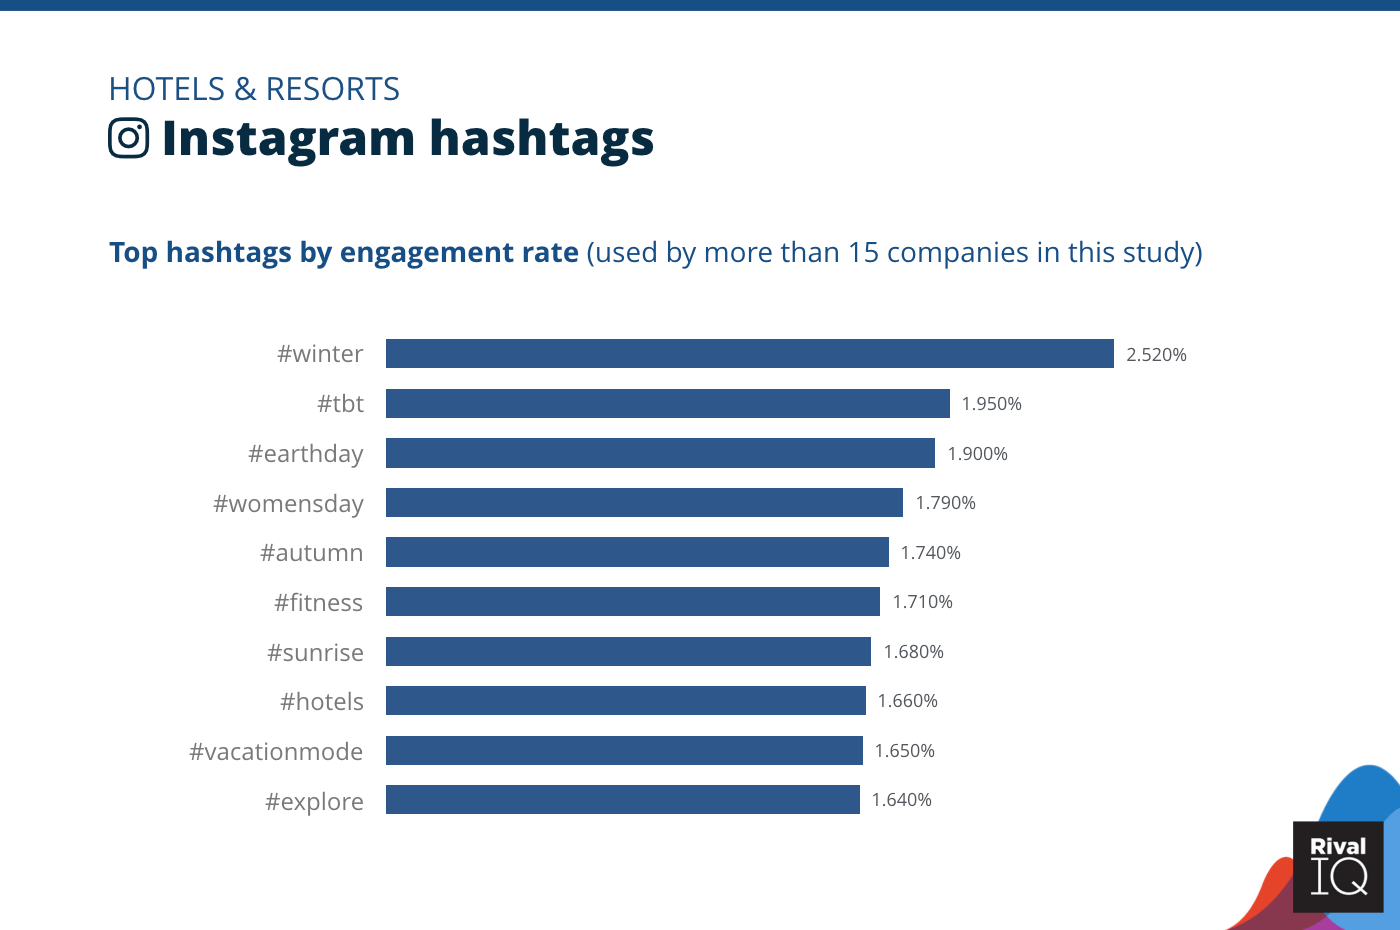
Top Instagram hashtags by engagement rate, Hotels & Resorts
Brrrrr…Hotels & Resorts scored big with the #winter hashtag on Instagram this year, suggesting that followers were more likely to double-tap a snowy getaway than a sandy one.
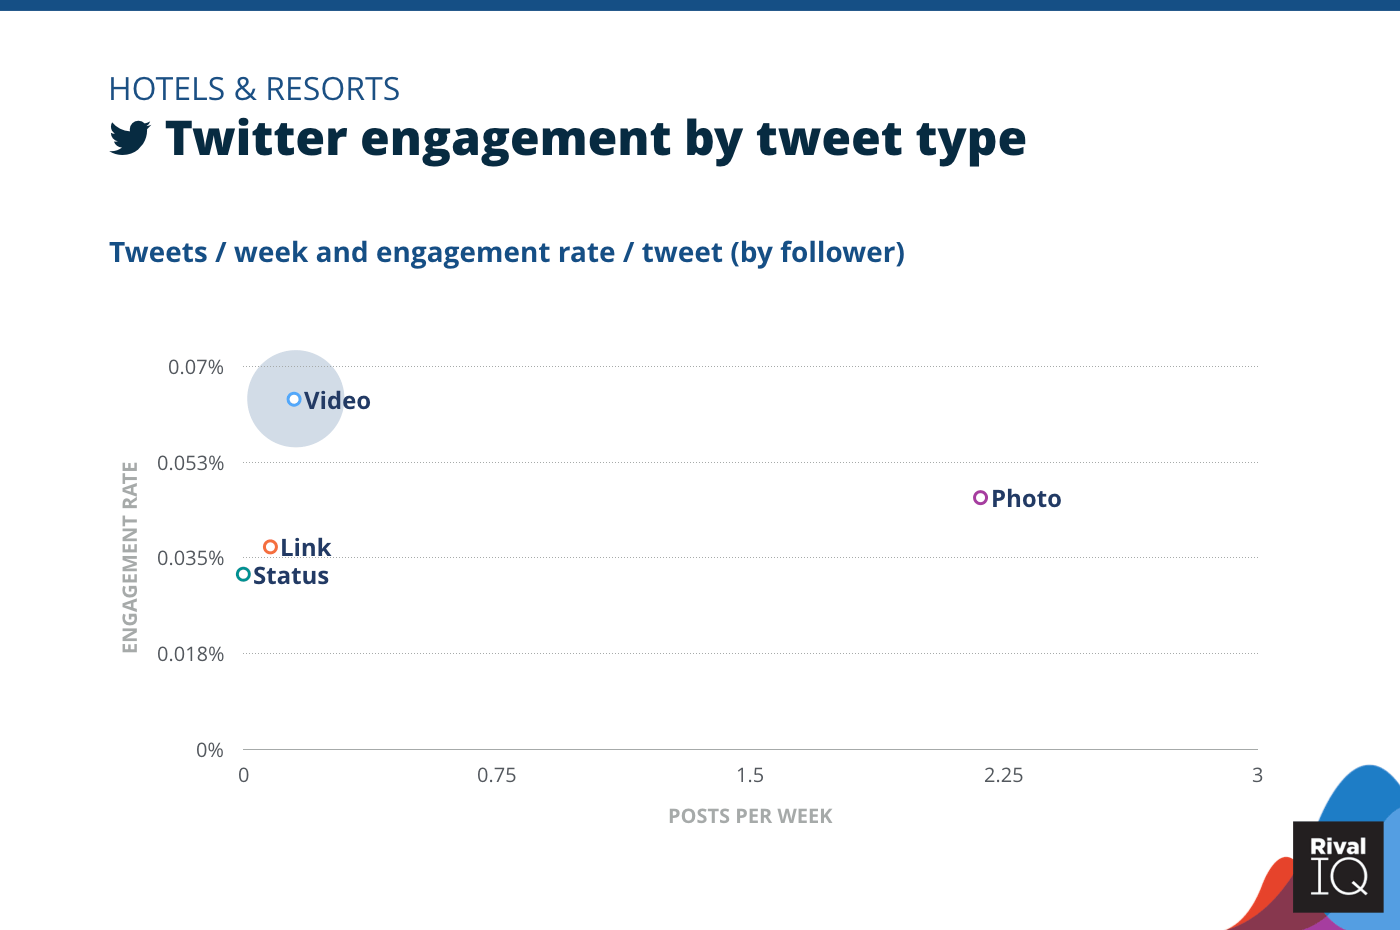
Twitter posts per week and engagement rate by tweet type, Hotels & Resorts
Hotels & Resorts scored less than half the photo engagement rate on Twitter as last year, which contributed to their middle-of-the-pack performance on this channel.
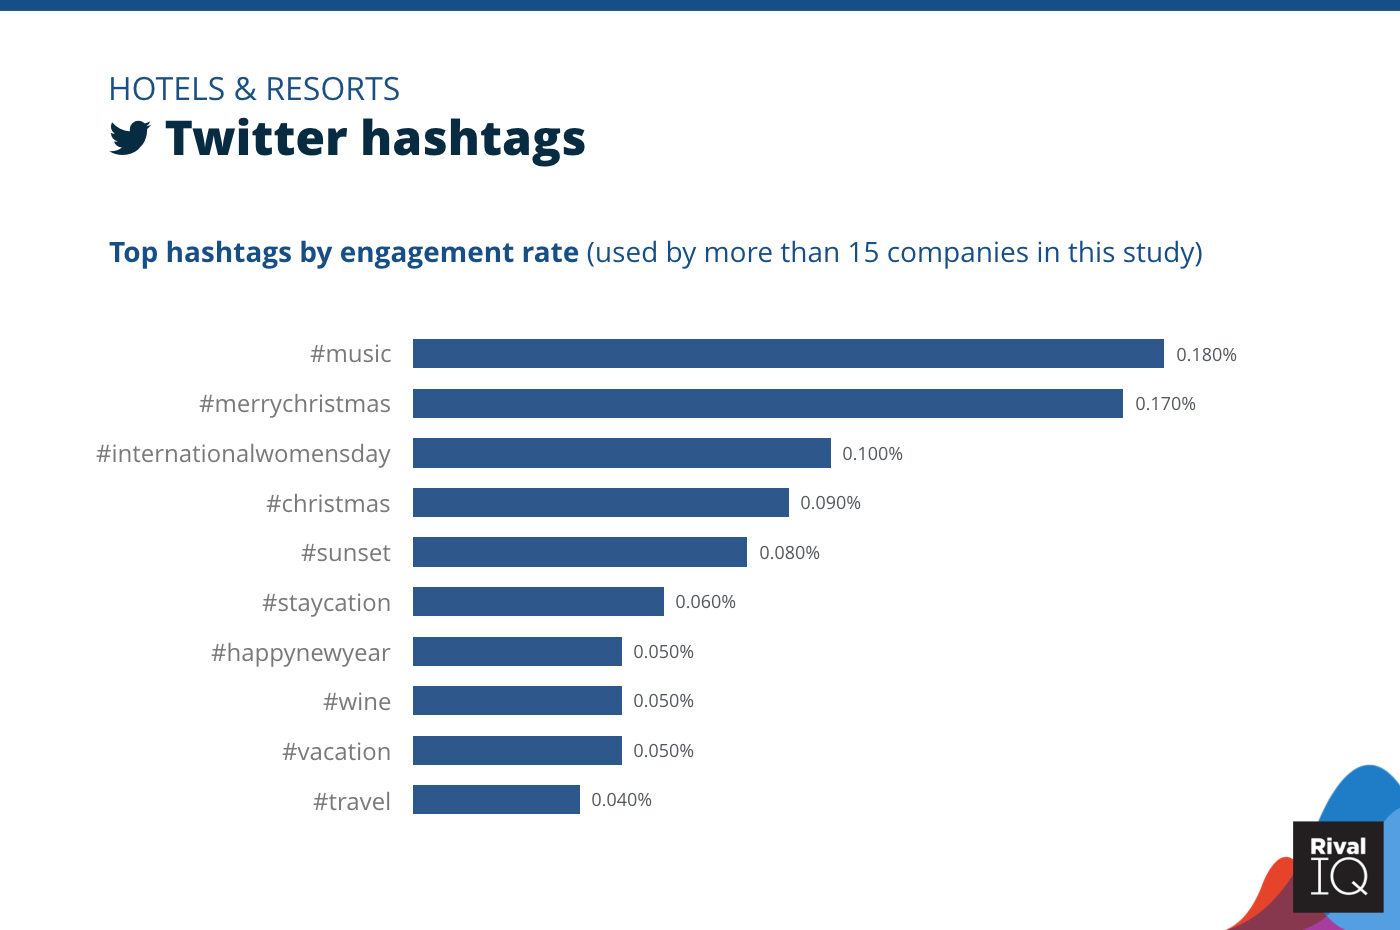
Top Twitter hashtags by engagement rate, Hotels & Resorts
Themed getaways with celebrities like Wyndham Hotels’ NASCAR contest to win a trip with driver Ryan J. Newman stole the hashtag show for Hotels & Resorts on Twitter this year.
Industry Snapshot: Influencers
Influencers grabbed the silver on Facebook and were actually able to increase their engagement on this tricky channel. They also saw above average performance on Instagram despite losing 25% of their engagement on this channel this year.
Some ideas to boost that engagement even more:
- Keep rocking photos on Facebook, and consider combining a few of the winners into Instagram carousels.
- Try to post more videos on Twitter.
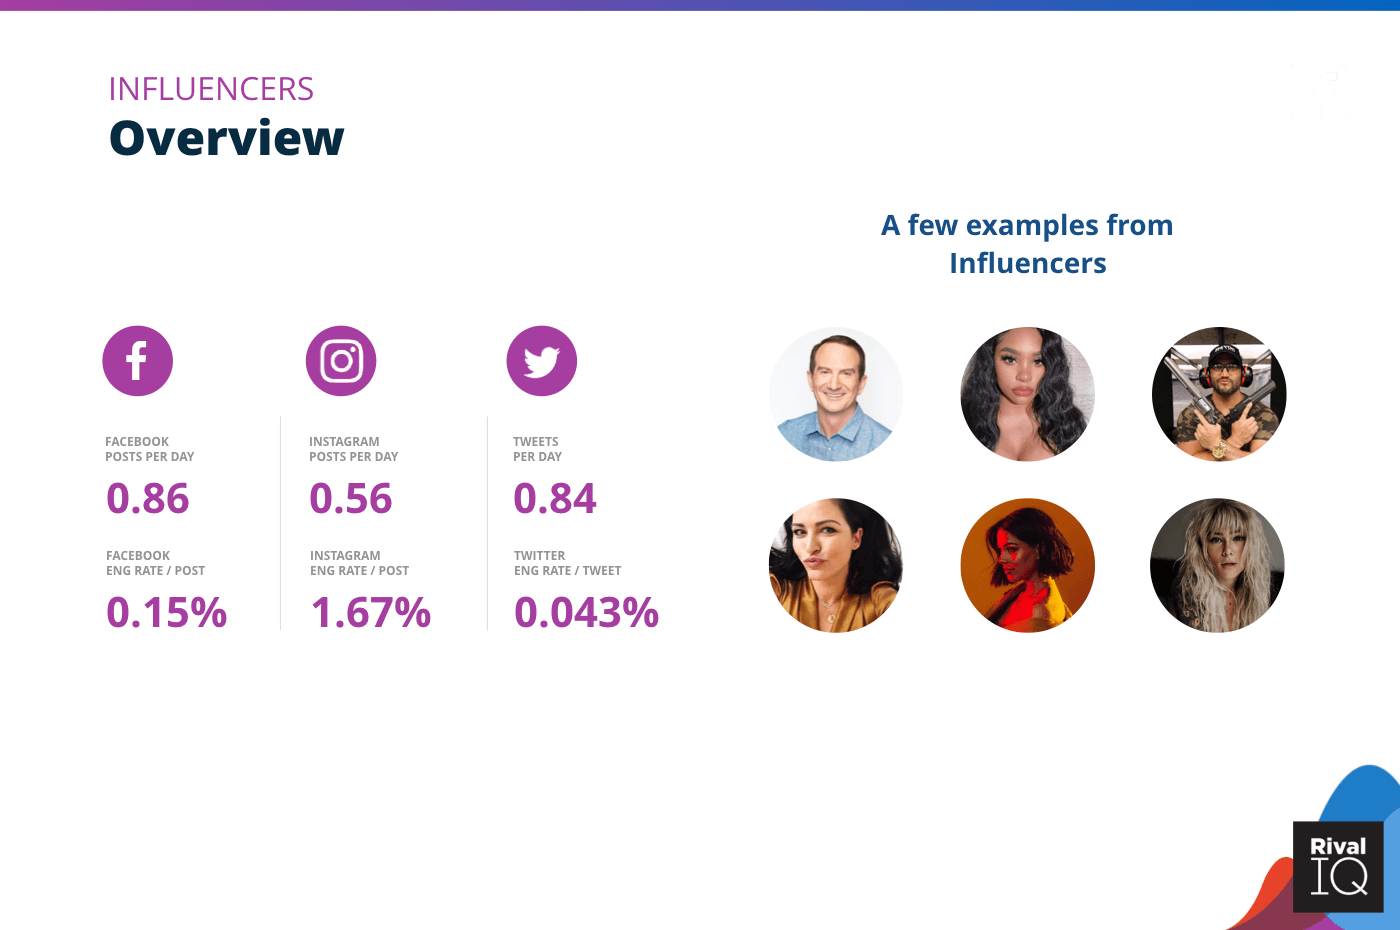
Overview of all benchmarks, Influencers
Notable Influencers in this year’s report include David Bach, ItsMyRayeRaye, MrLEV12, Jayde Donovan, Megan Batoon, and Pame Voguel.
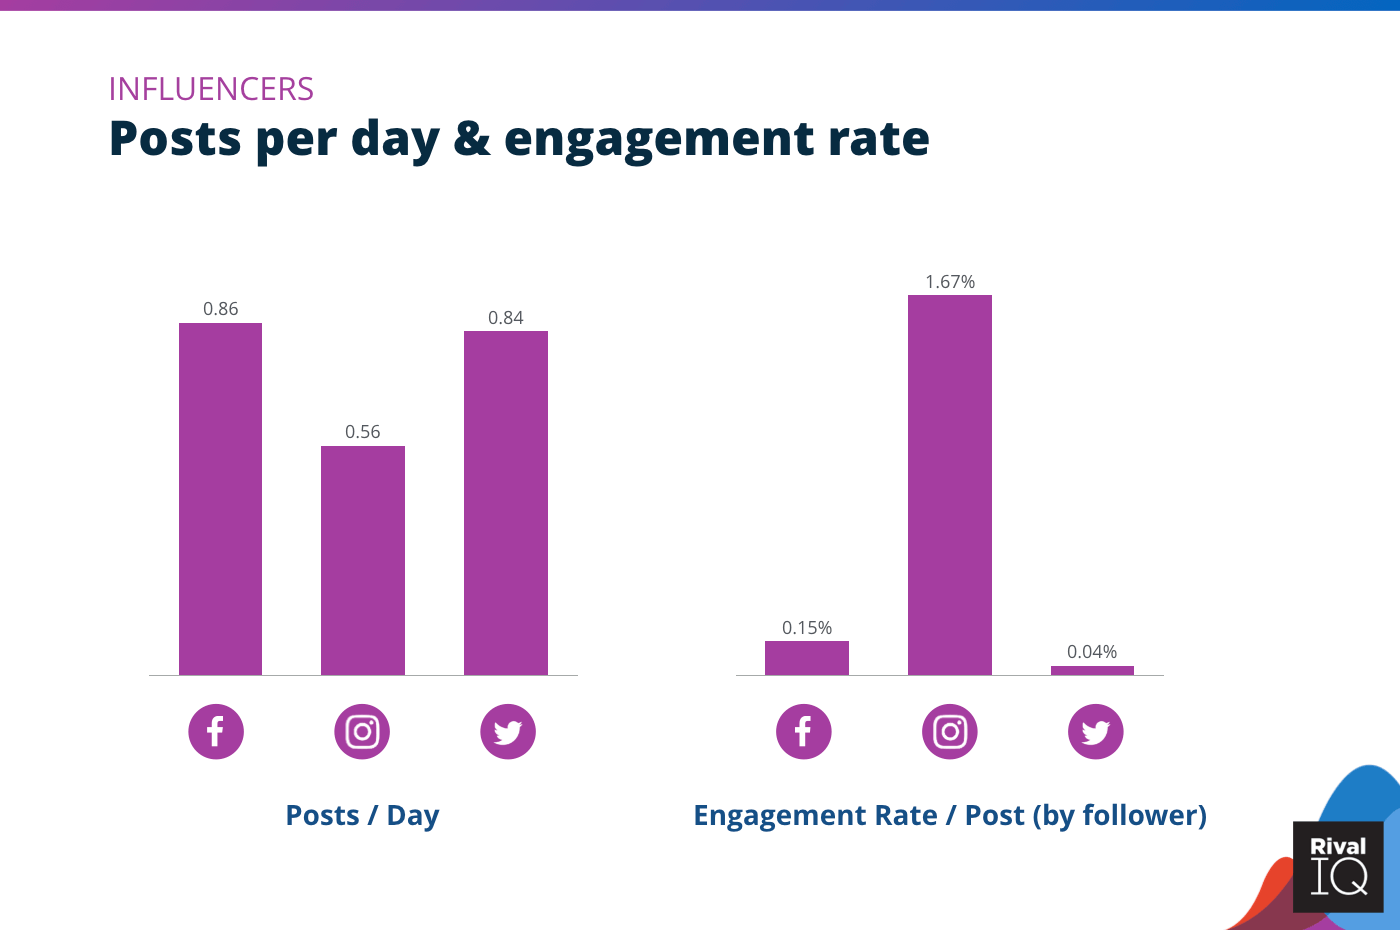
Posts per day and engagement rate per post across all channels, Influencers
Influencers posted less frequently across all three channels this year, but only suffered an engagement decline on Instagram.
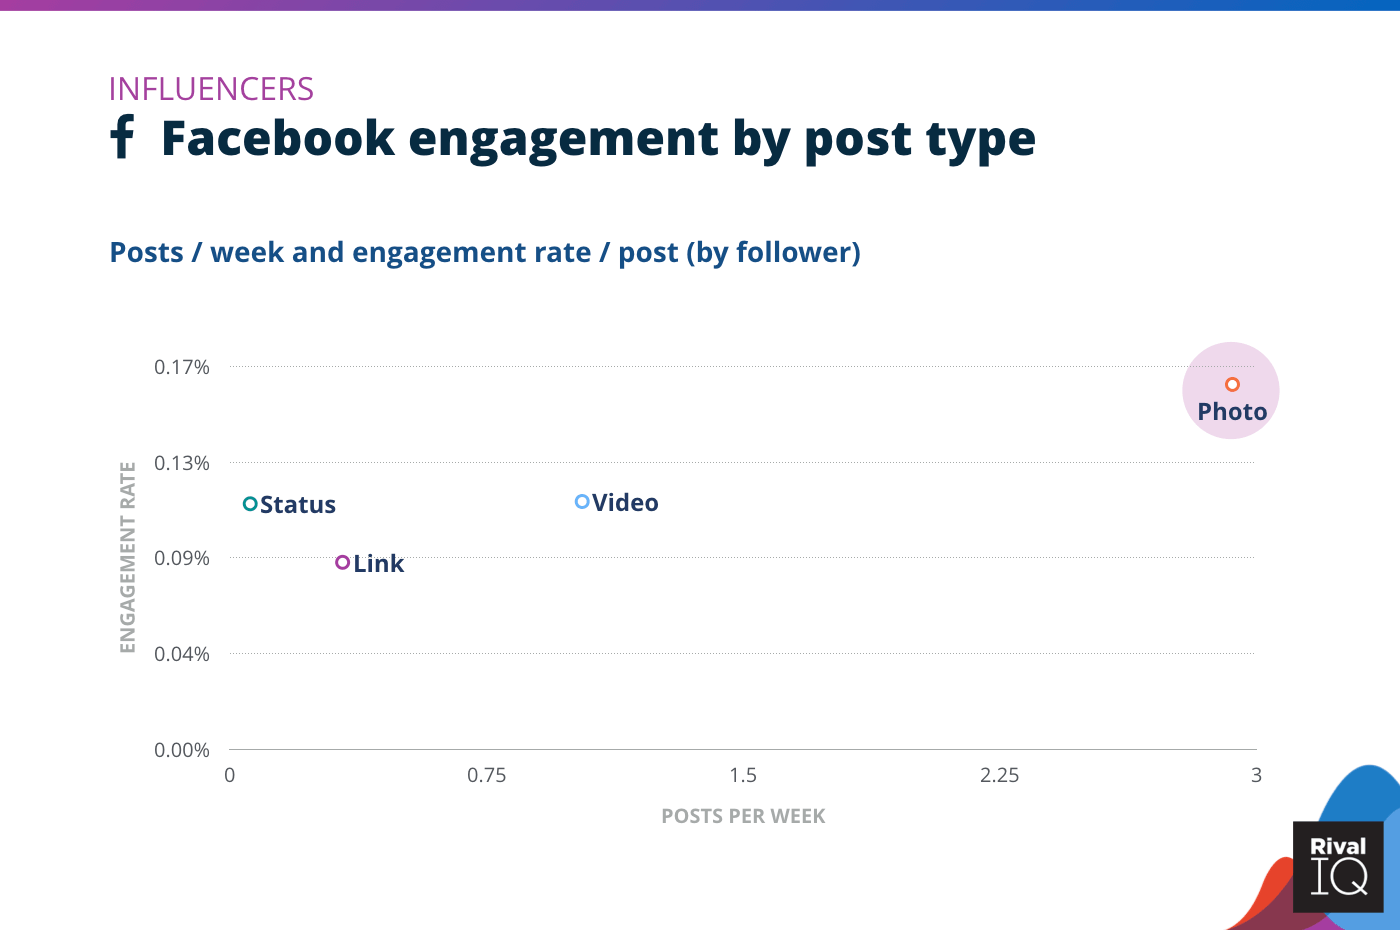
Facebook posts per week and engagement rate by post type, Influencers
Influencers saw increased Facebook engagement this year, thanks especially to a 10% increase in photo engagement.

Instagram posts per week and engagement rate by post type, Influencers
Influencers saw less engagement with every post type on Instagram this year, which helps explain their 25% overall dip on this channel.
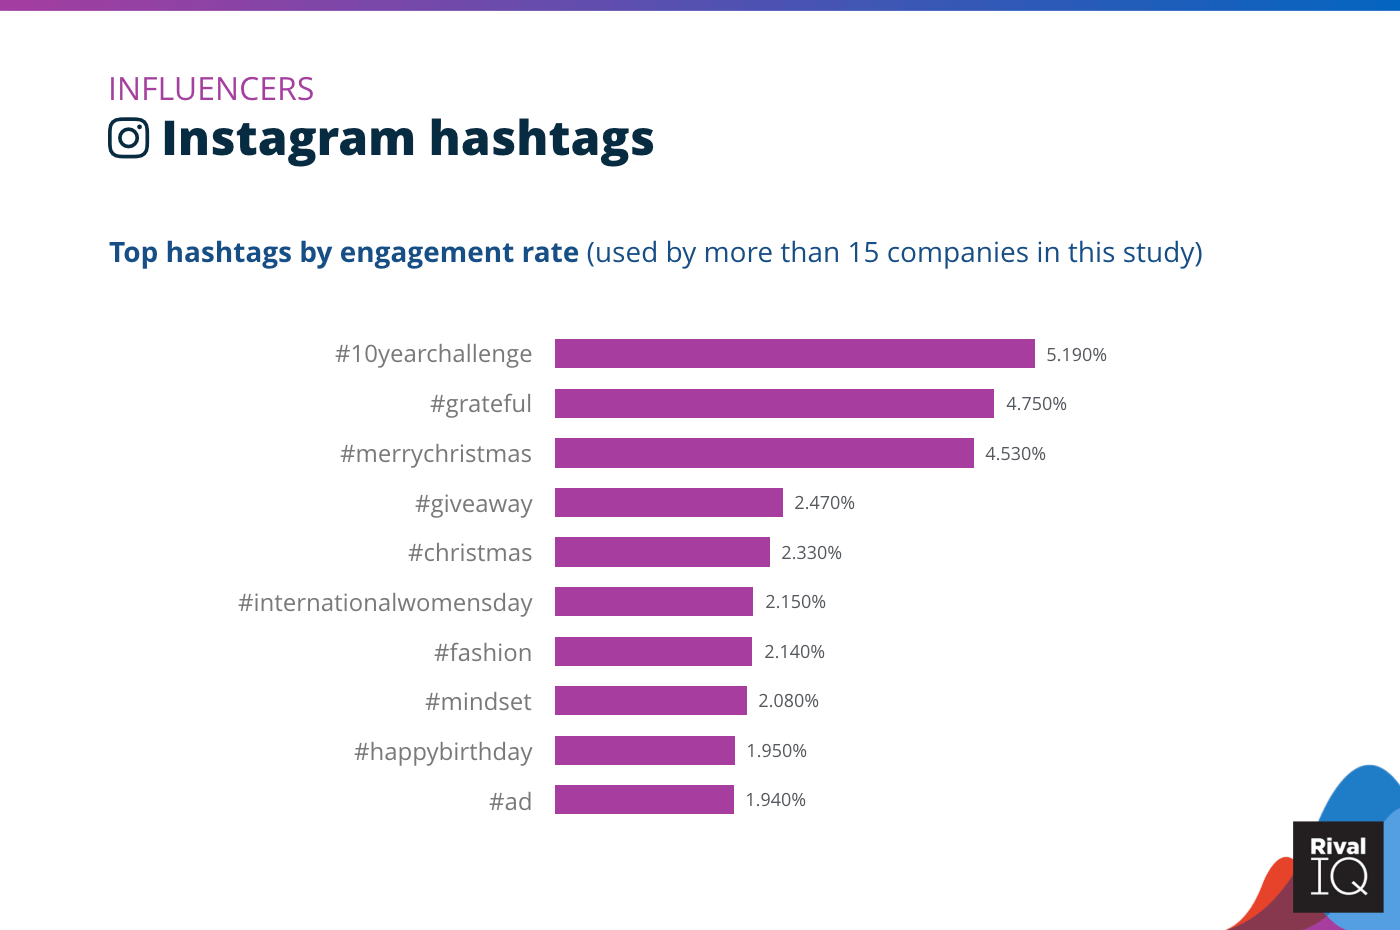
Top Instagram hashtags by engagement rate, Influencers
Keeping up with trending hashtags like #10yearchallenge helped influencers stay current on Instagram this year to the tune of a 5x engagement increase over their average on this channel.
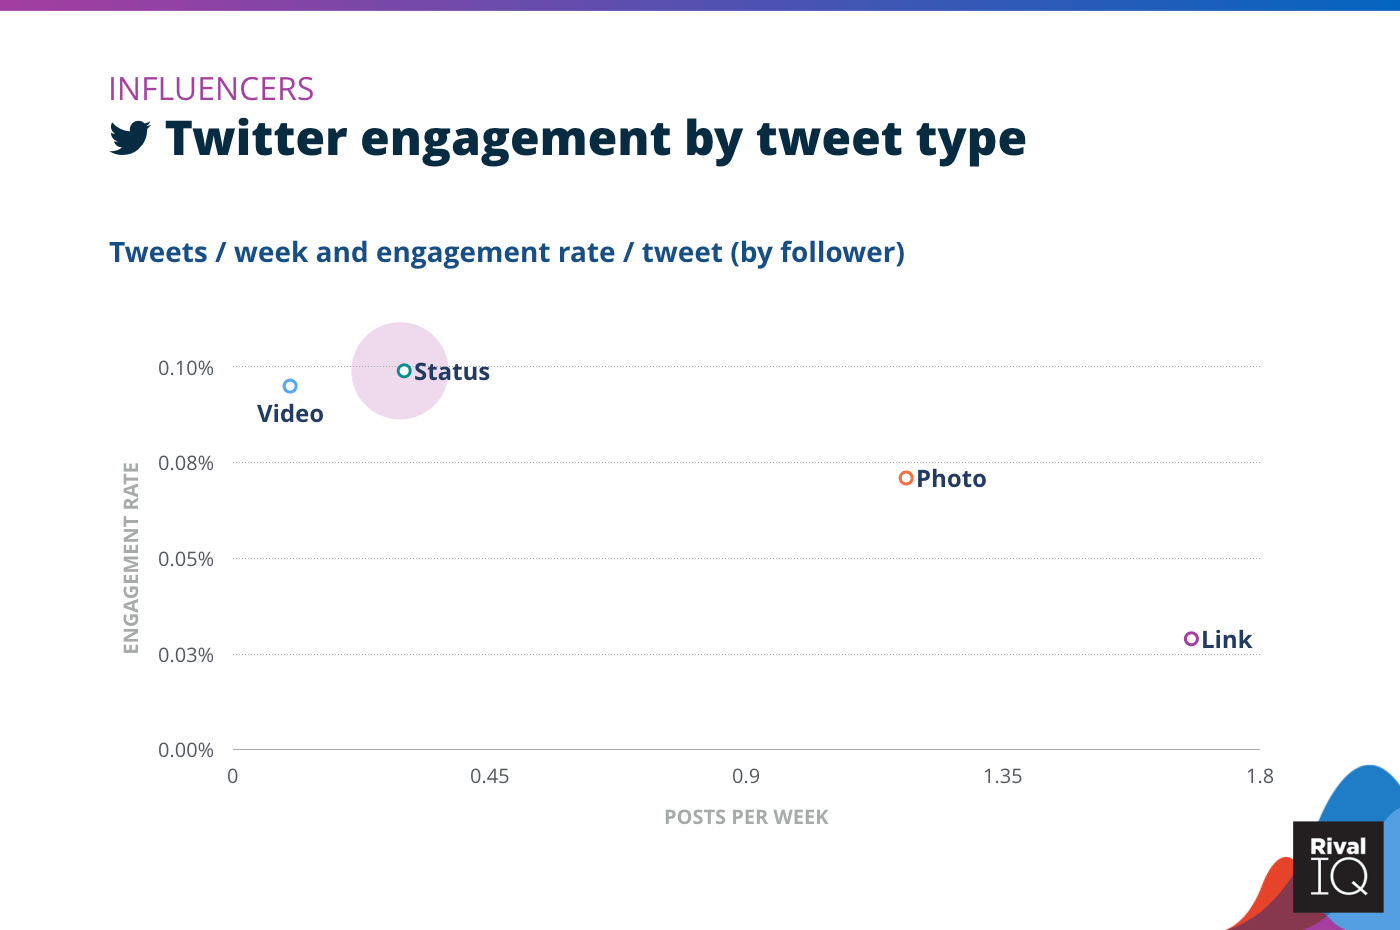
Twitter posts per week and engagement rate by tweet type, Influencers
Influencers continue to post too many low-engagement photos and links and not enough videos and status updates. Flip your tweet type focus for more engagement on Twitter.
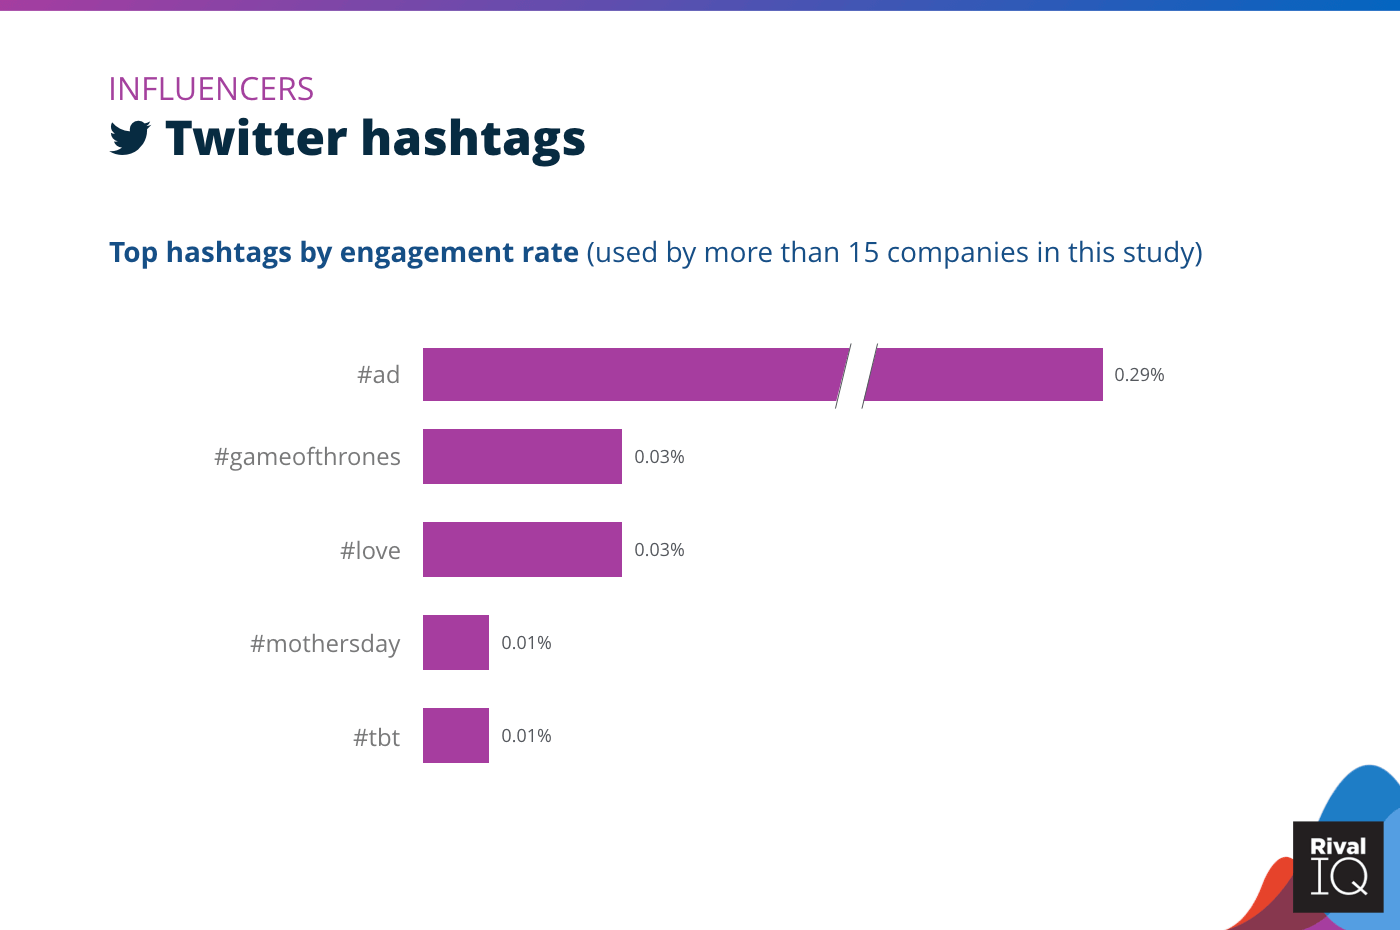
Top Twitter hashtags by engagement rate, Influencers
Ads dominated Influencer tweets this year. Influencers also saw tons of tweet topic variety, with just five hashtags shared between 15 or more influencers on Twitter.

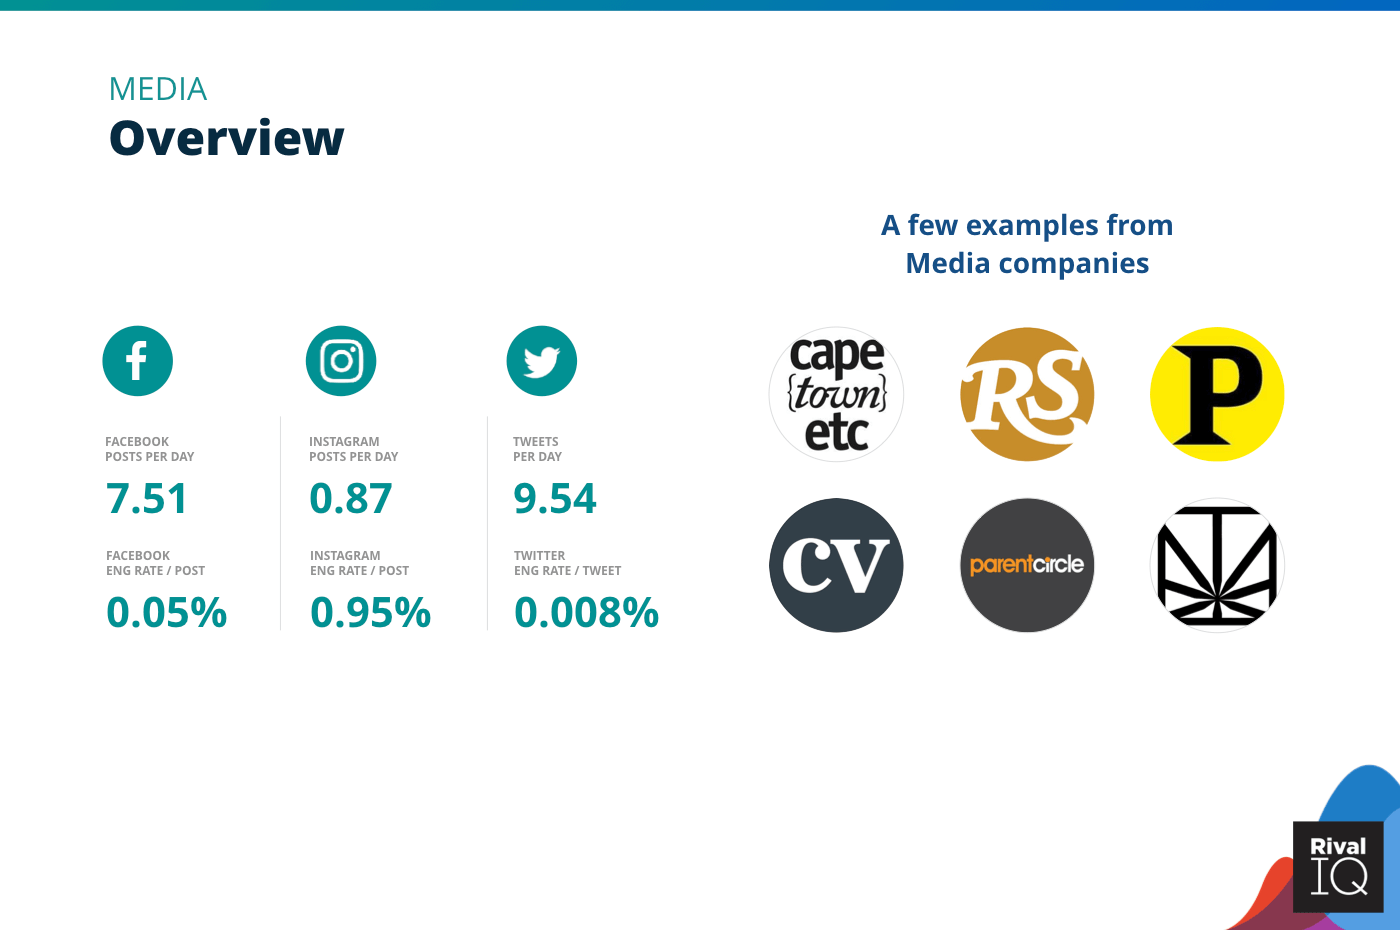
Industry Snapshot: Media
Media blew other industries out of the water with posting frequency again this year, but still lags on engagement on all three channels. Posting so often drives down any industry’s overall engagement rates because there are only so many impressions to go around.
A few ideas to improve engagement rates:
- Continue increasing posting on Instagram–especially carousels.
- Try to go beyond the link with expressive photos or videos that can help tell your story without driving followers off-channel.
Overview of all benchmarks, Media
Notable media brands in this year’s report include CapeTown Etc., Rolling Stone, Playbill, Coaches’ Voice, Parent Circle, and Merry Jane.
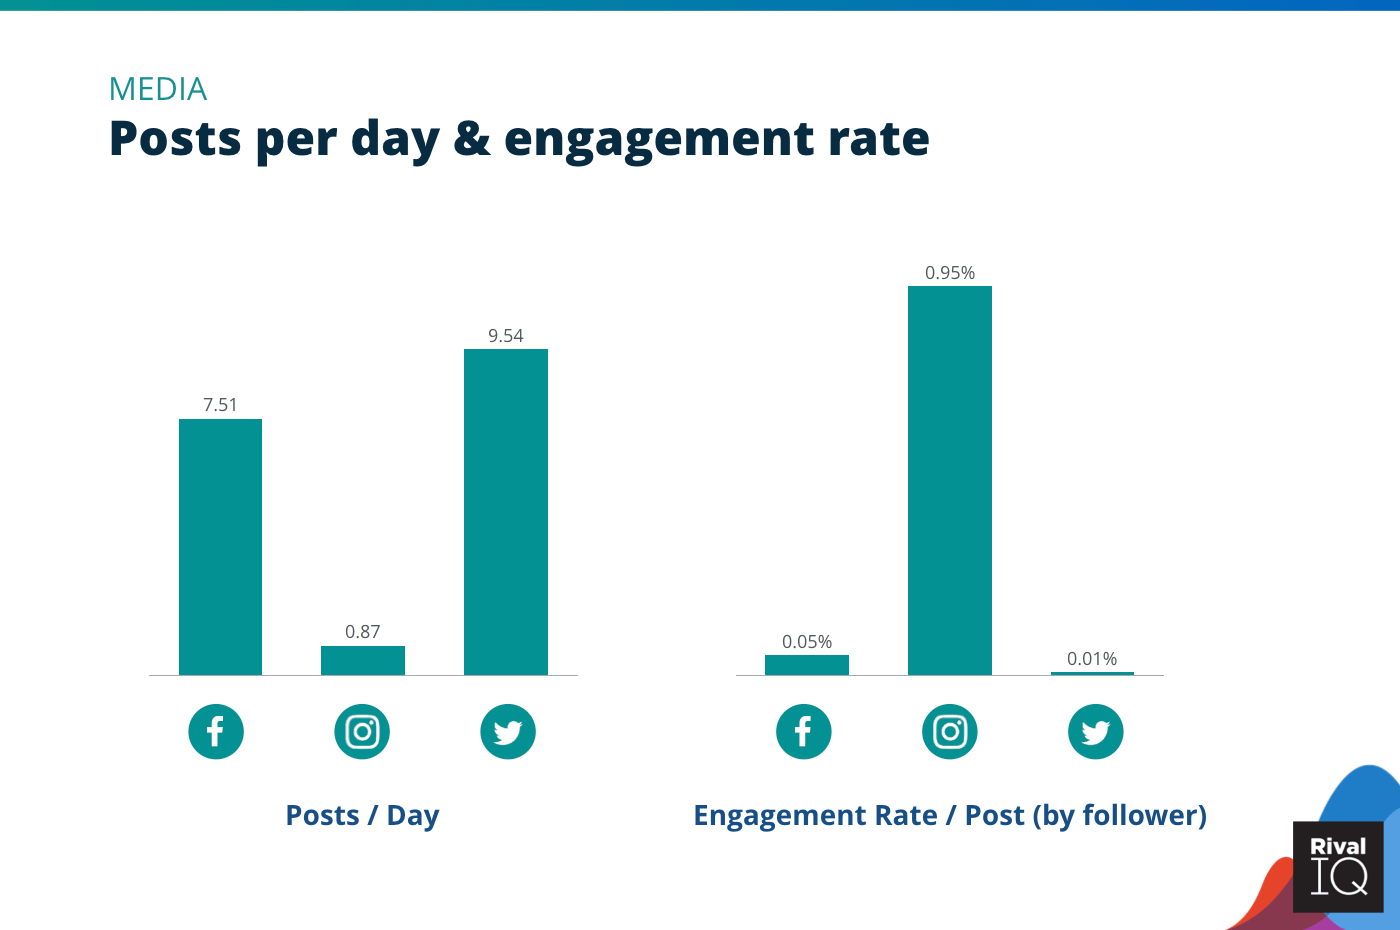
Posts per day and engagement rate per post across all channels, Media
This year, Media brands invested more heavily in posting on Instagram. Smart move, considering Instagram engagement rates beat Facebook by 20x for Media companies.
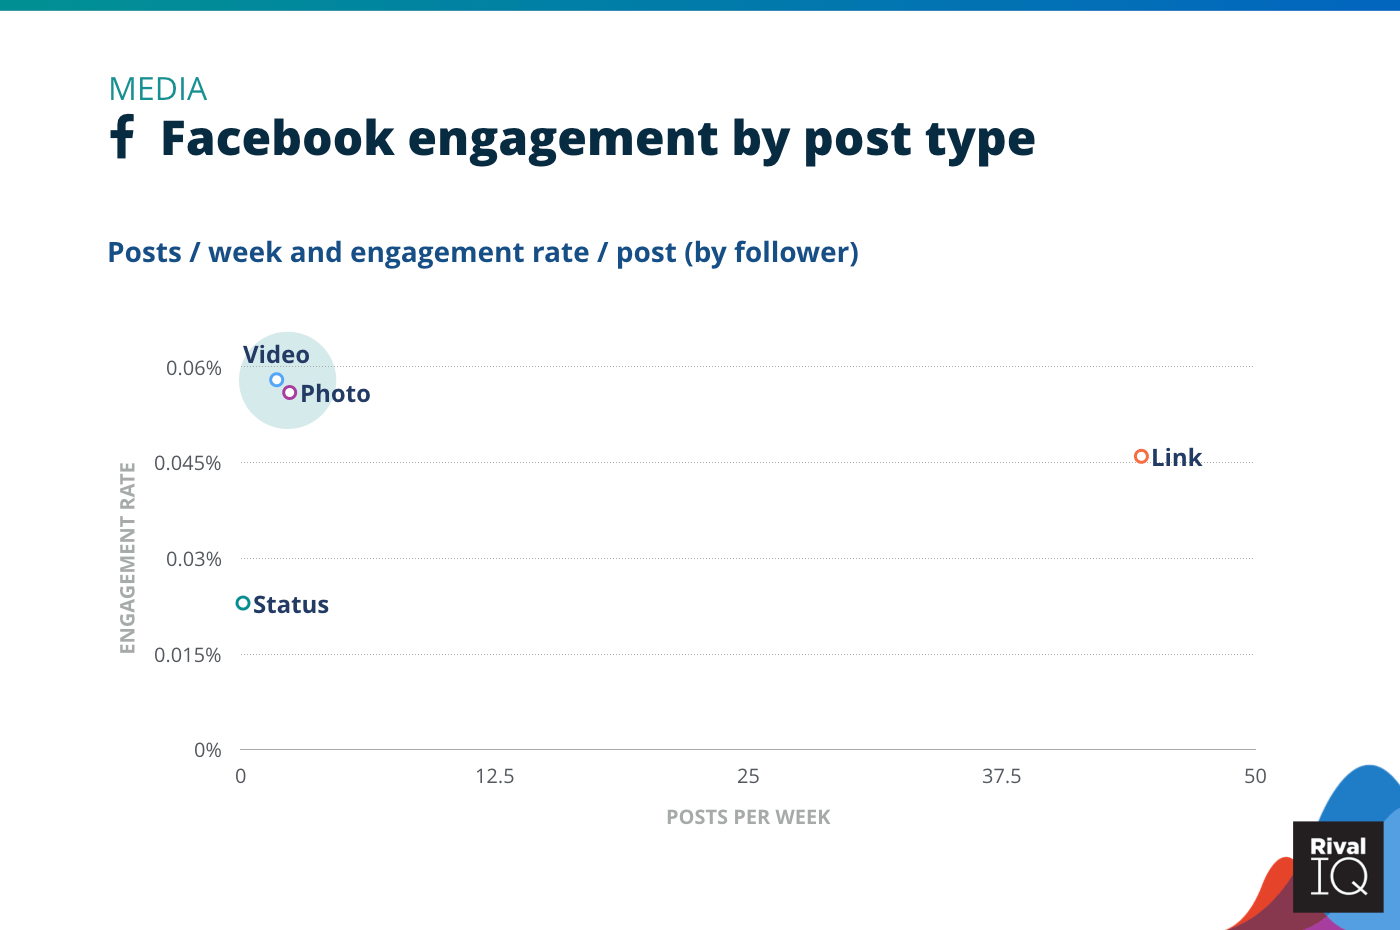
Facebook posts per week and engagement rate by post type, Media
Photos and videos are neck-and-neck for the Facebook engagement gold for Media companies but are posted much less frequently than links. This link frequency isn’t surprising for an industry that makes money by driving you to their websites.
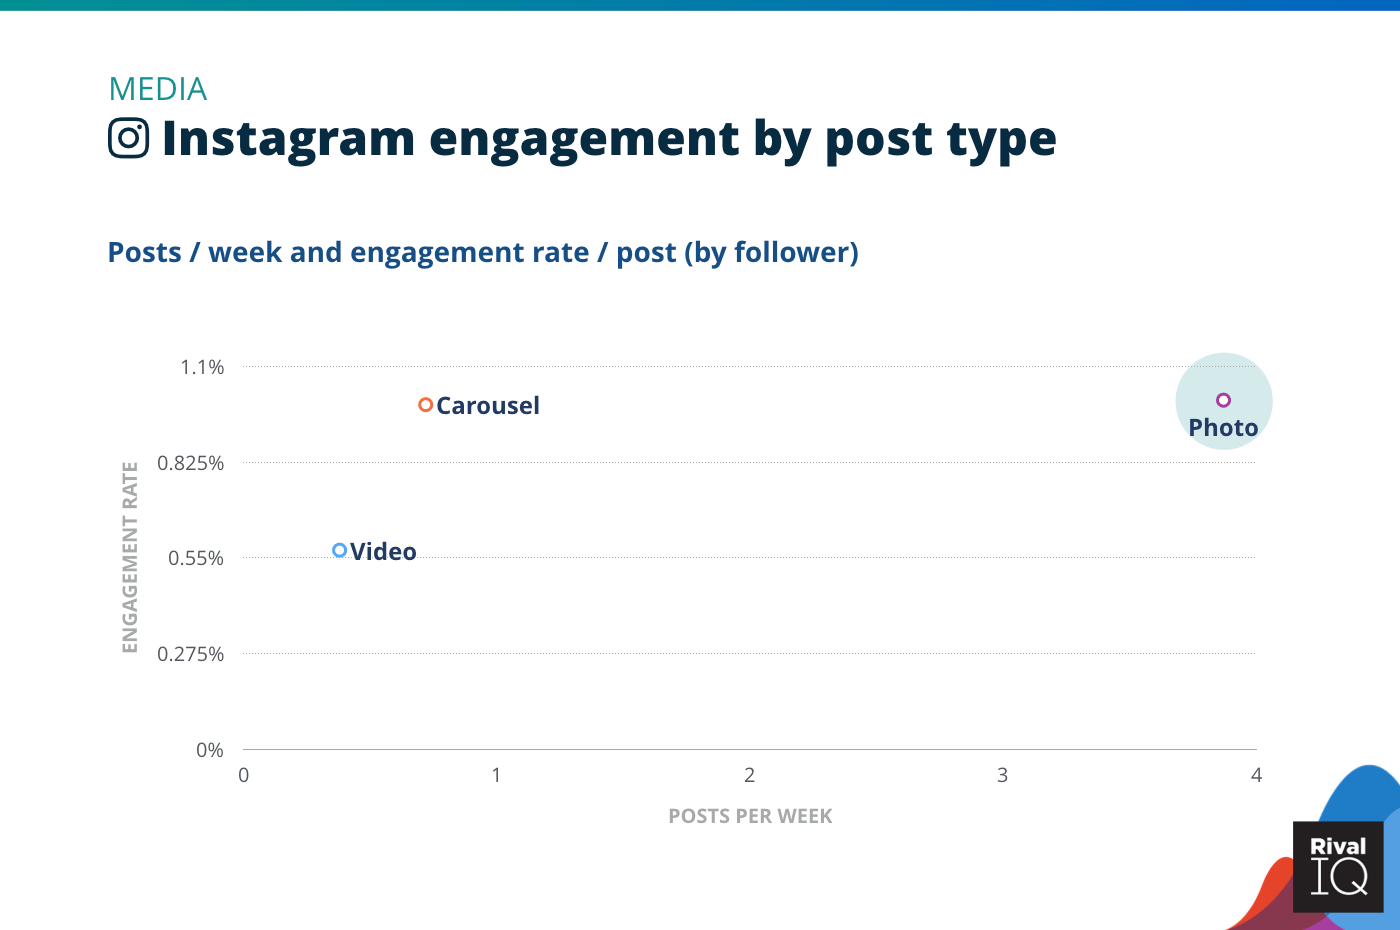
Instagram posts per week and engagement rate by post type, Media
Posting frequency is up across every post type on Instagram this year, suggesting that Media is finally investing more in this channel.
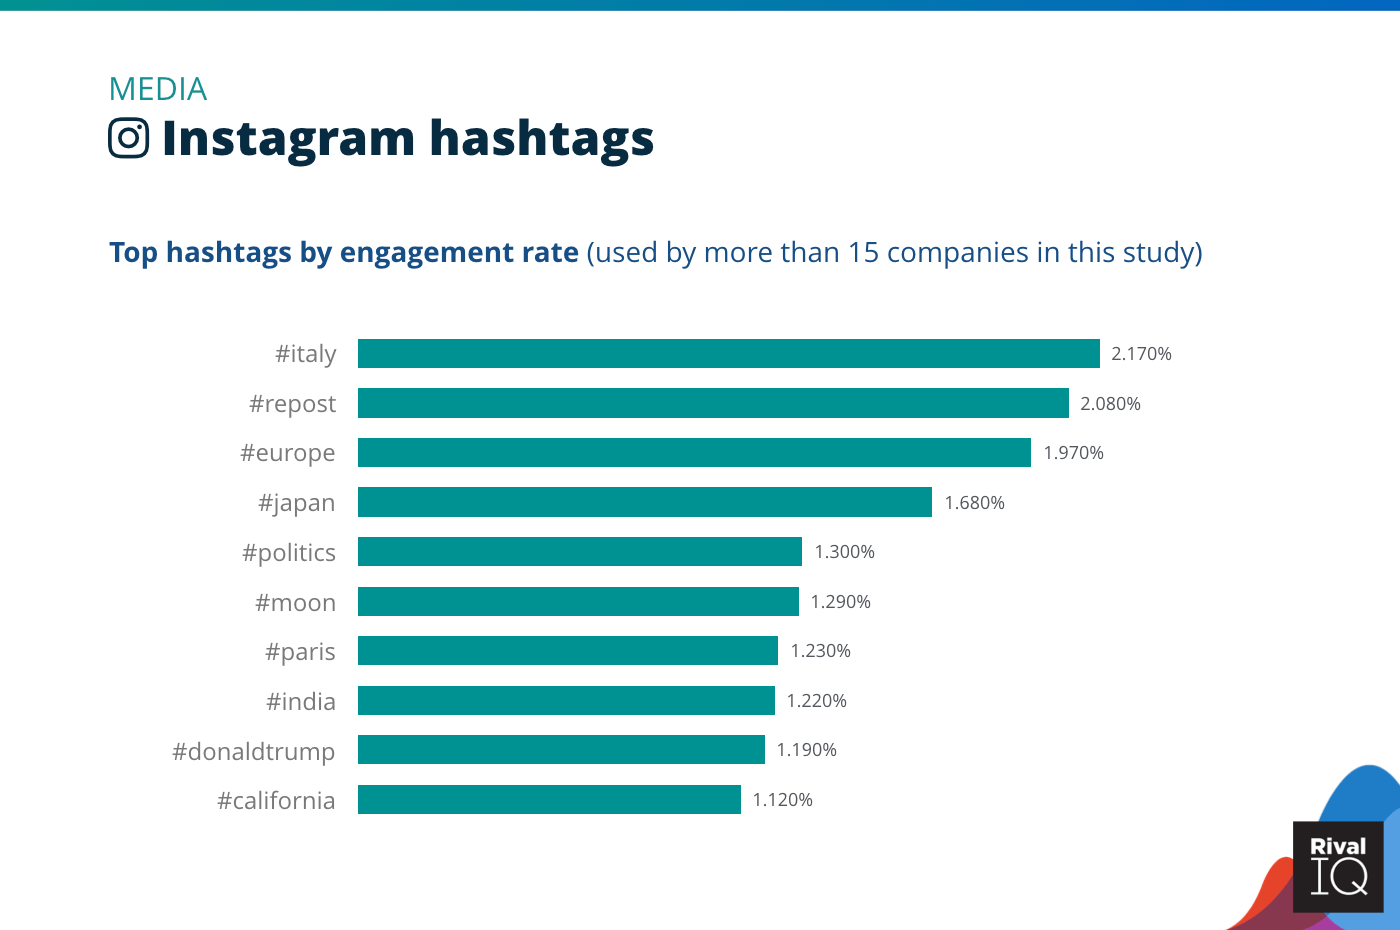
Top Instagram hashtags by engagement rate, Media
The prevalence of geography-themed hashtags on Instagram suggests Media companies are using hashtags to help social media users learn more about their story without leaving the post.

Twitter posts per week and engagement rate by tweet type, Media
Link engagement rates continue to lag on Twitter but remain Media’s favorite tweet type.
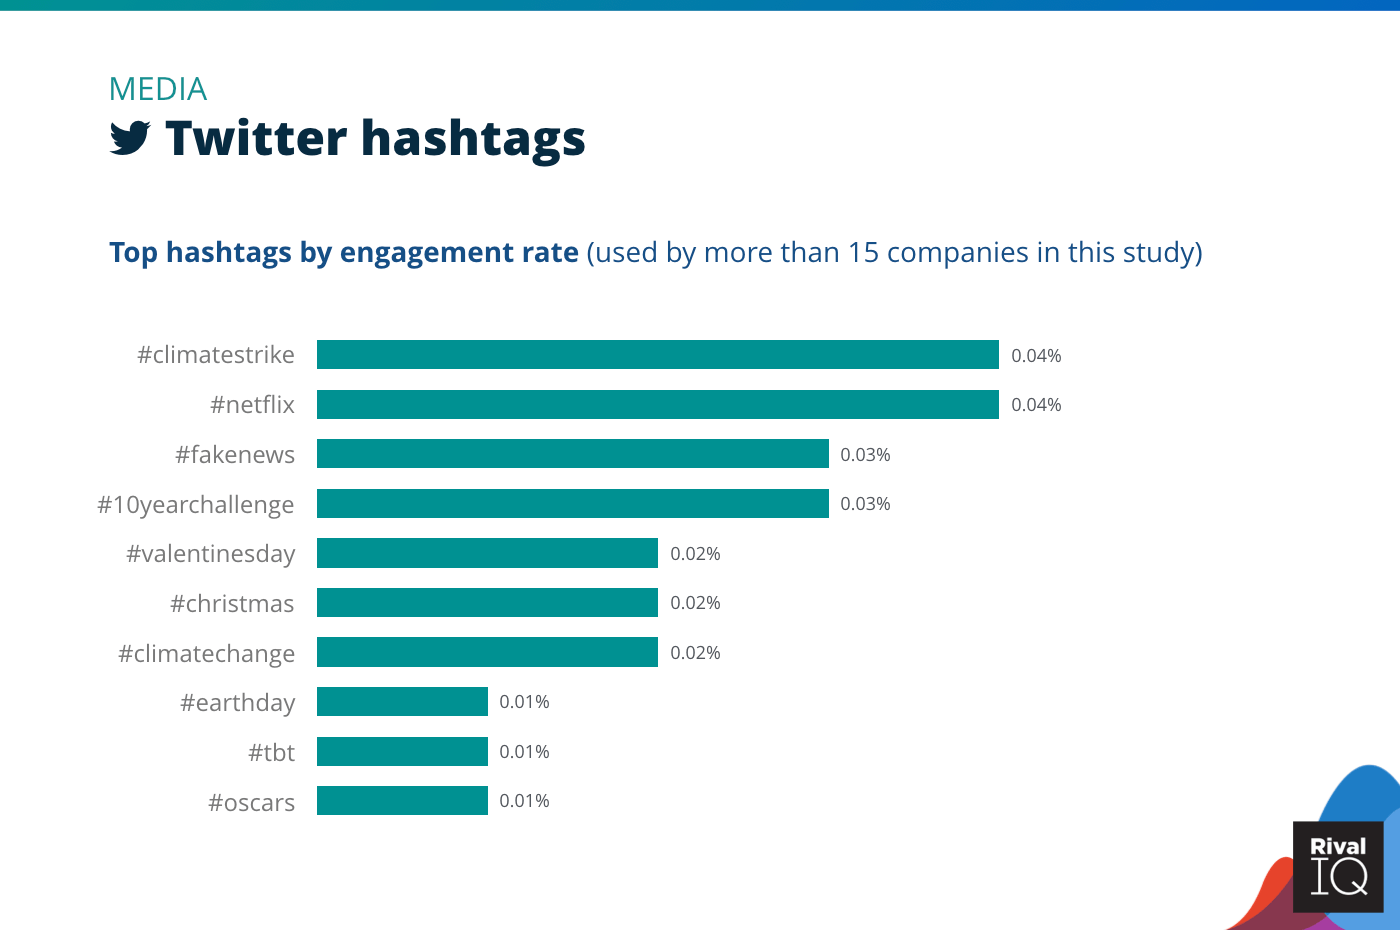
Top Twitter hashtags by engagement rate, Media
Media companies tried to keep current with trending hashtags this year, but they still saw some of the lowest overall hashtag performance on Twitter.
Industry Snapshot: Nonprofits
Nonprofits performed above the median on Facebook, Instagram, and Twitter, and posted more than the average brand on Facebook and Twitter. They also saw a small increase in Twitter engagement.
A few ideas for Nonprofits:
- Continue to increase your Instagram posting frequency to improve engagement.
- Try to tweet more videos on Twitter–they’re a sure bet for engagement.
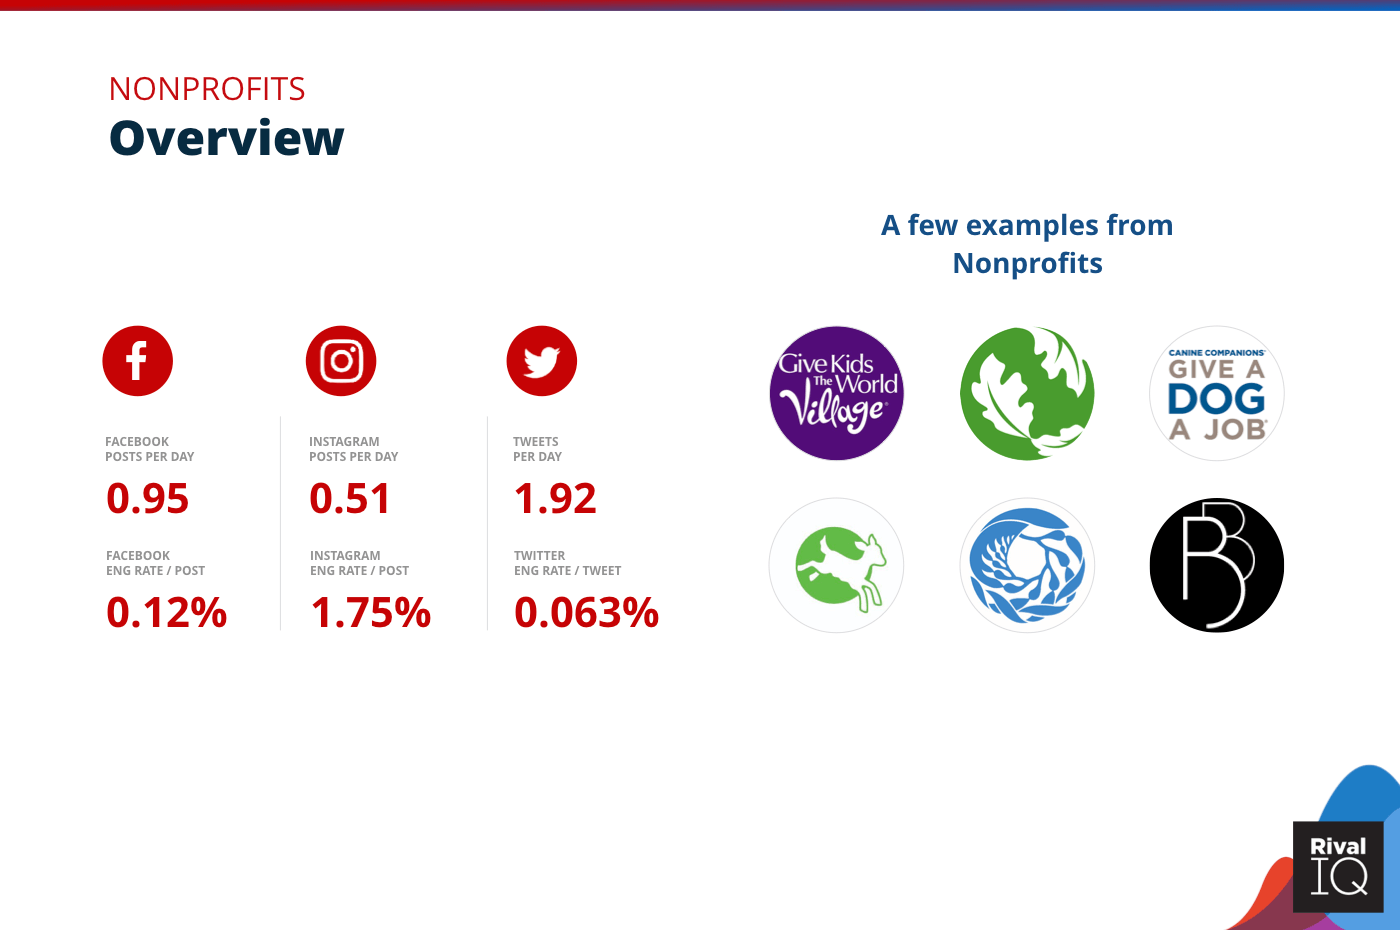
Overview of all benchmarks, Nonprofits
Notable Nonprofits in this year’s report include Give Kids The World Village, Nature Conservancy, Canine Companions for Independence, Compassion in World Farming, Monterey Bay Aquarium, and Boston Ballet.
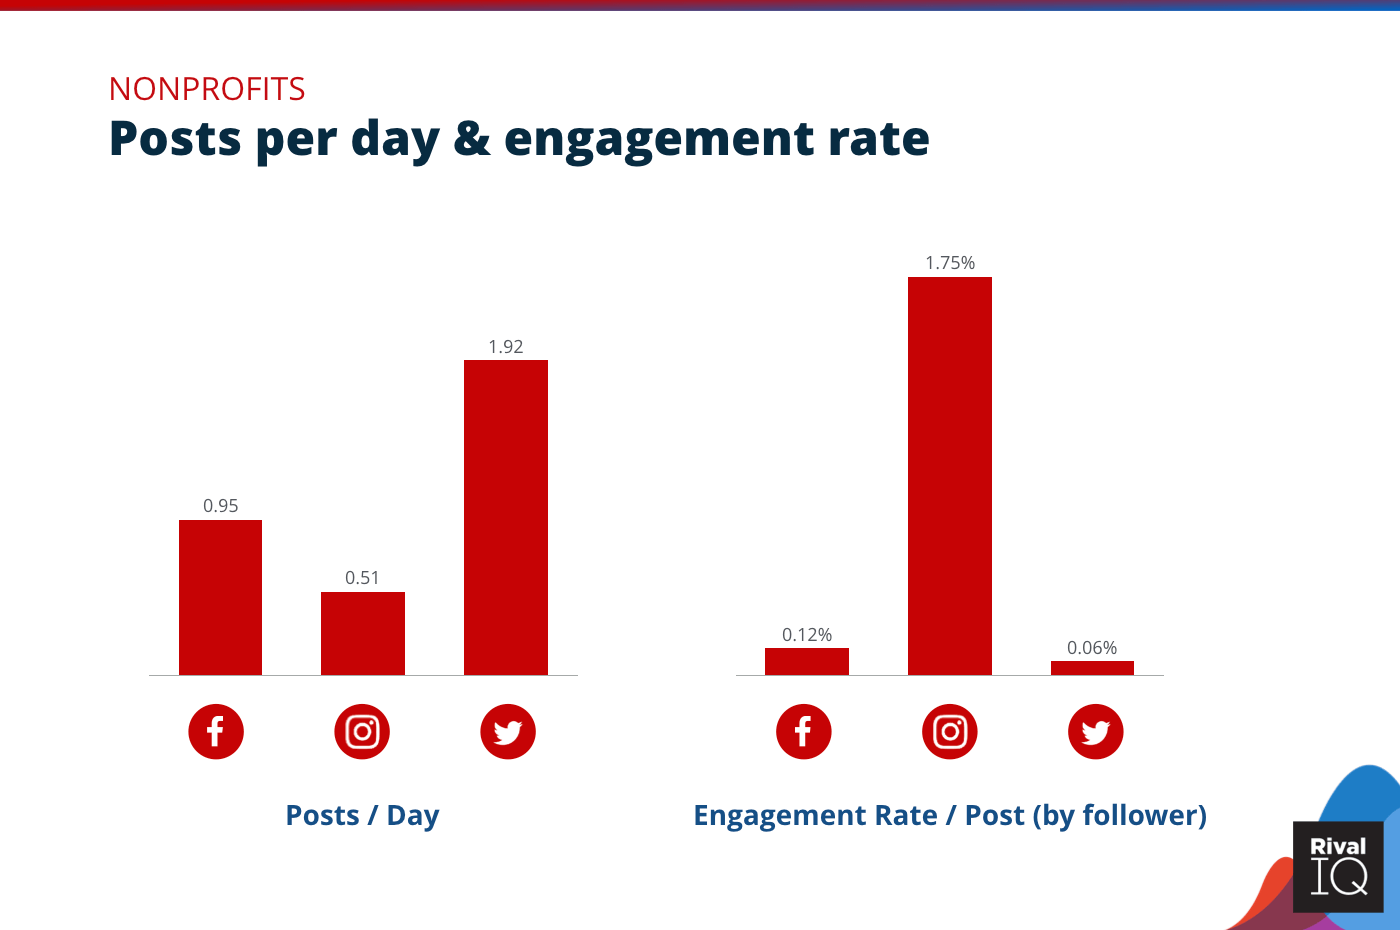
Posts per day and engagement rate per post across all channels, Nonprofits
Nonprofits decreased posting frequency on Facebook and Twitter and upped their Instagram posting to try to grab a bigger bite of the Instagram apple.
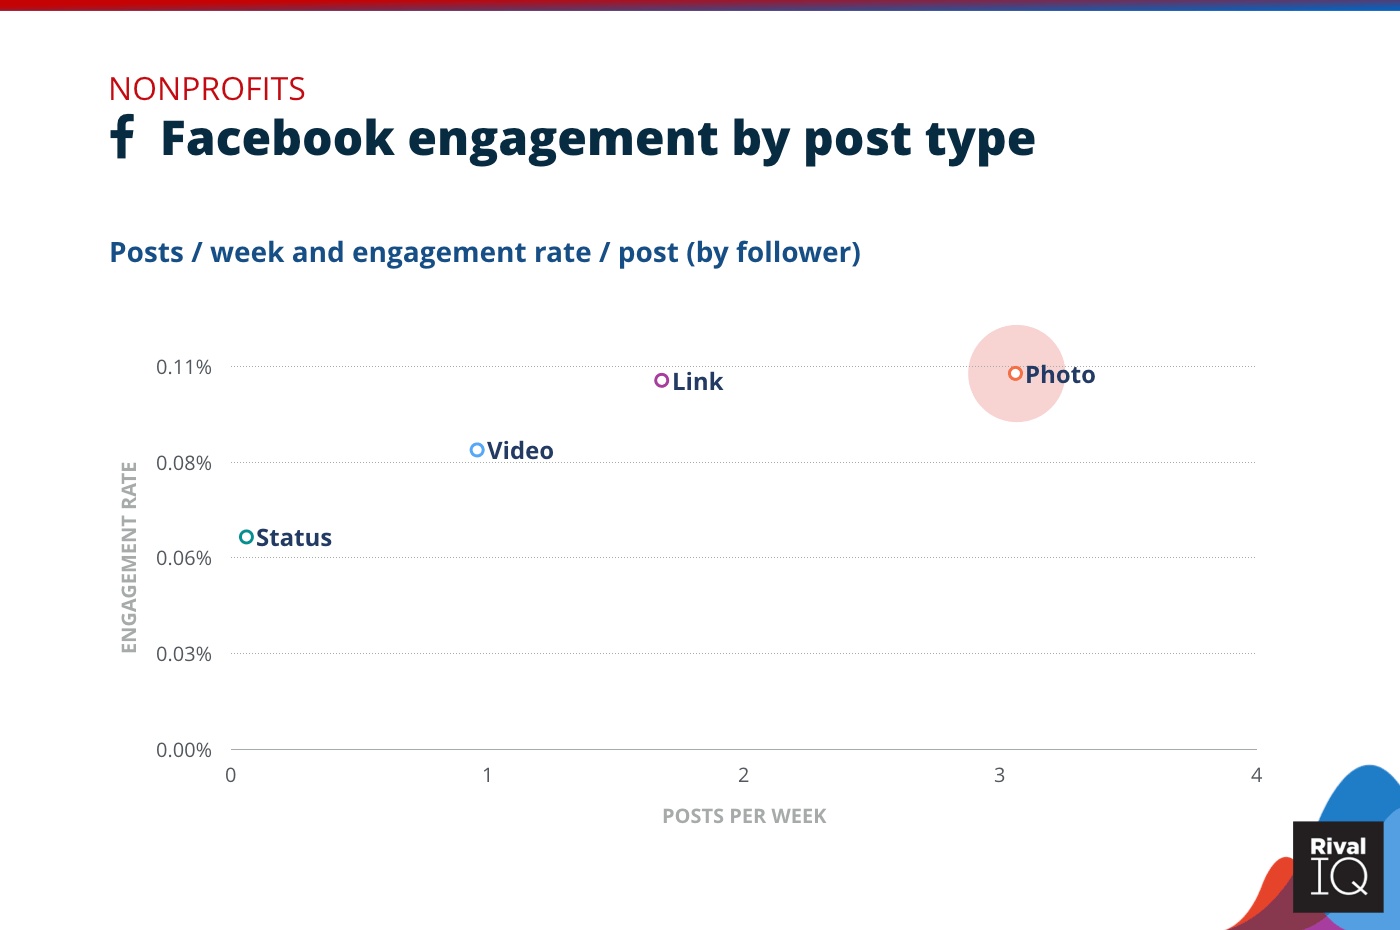
Facebook posts per week and engagement rate by post type, Nonprofits
Nonprofits have their post type frequency dialed–they’re posting least-engaging statuses infrequently and really focusing on links and photos, which perform much better on Facebook.
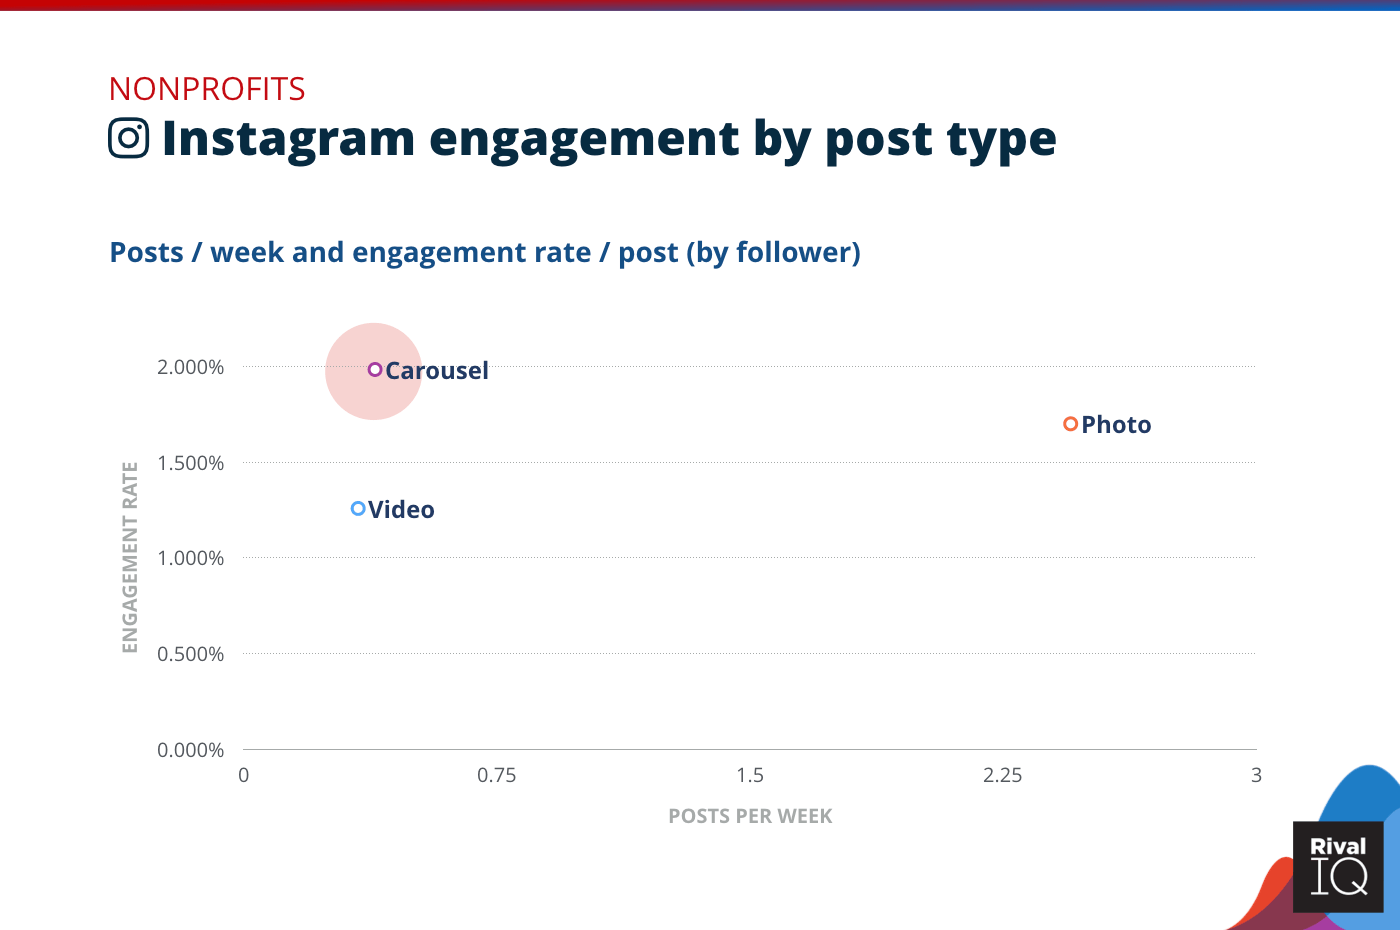
Instagram posts per week and engagement rate by post type, Nonprofits
Top Nonprofit Instagram performer Greenpeace saw record-breaking engagement with fun, meme-style photos, but could make even more of a splash by posting more carousels.
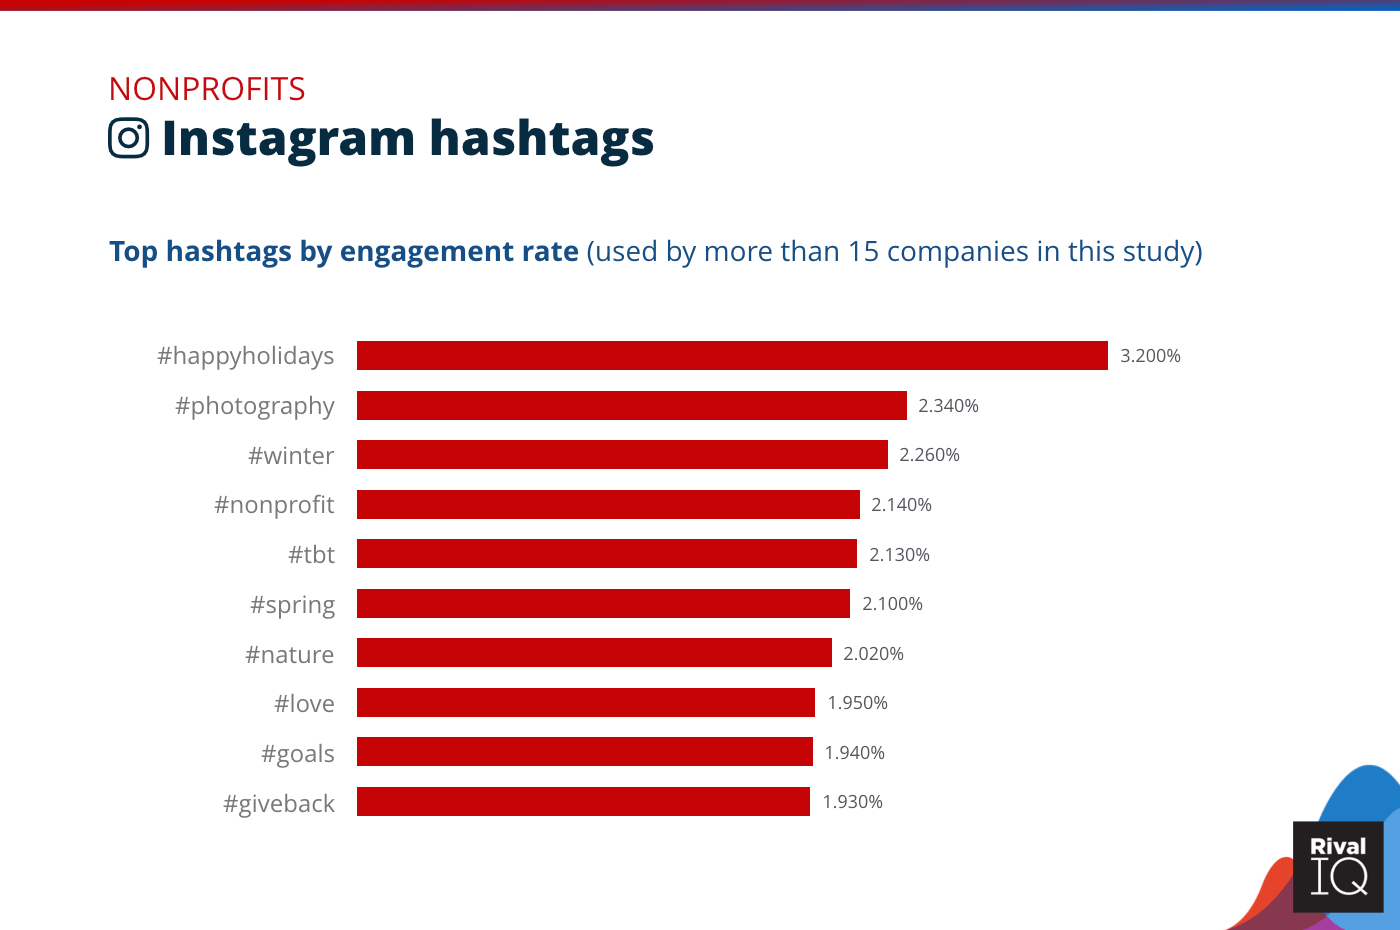
Top Instagram hashtags by engagement rate, Nonprofits
Nonprofits were one of the only industries we studied that didn’t lean on holiday hashtags like #mothersday and #internationalpizzaday. They saw middle-of-the-road Instagram hashtag engagement, and could look into those holidays for more oomph.
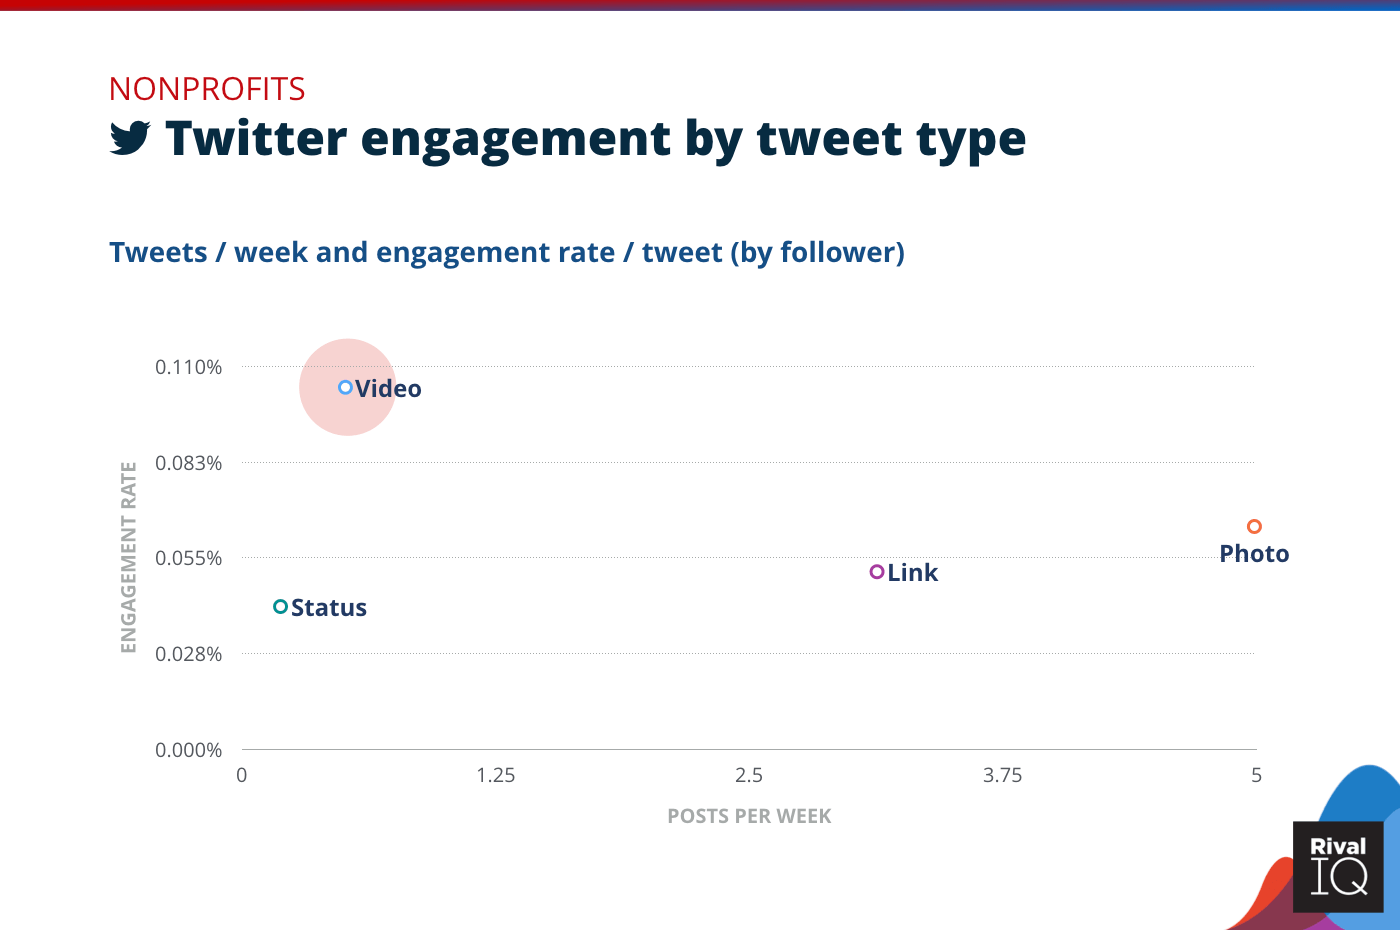
Twitter posts per week and engagement rate by tweet type, Nonprofits
Nonprofits saw a slight increase in Twitter engagement this year thanks especially to increased engagement on videos on this channel.
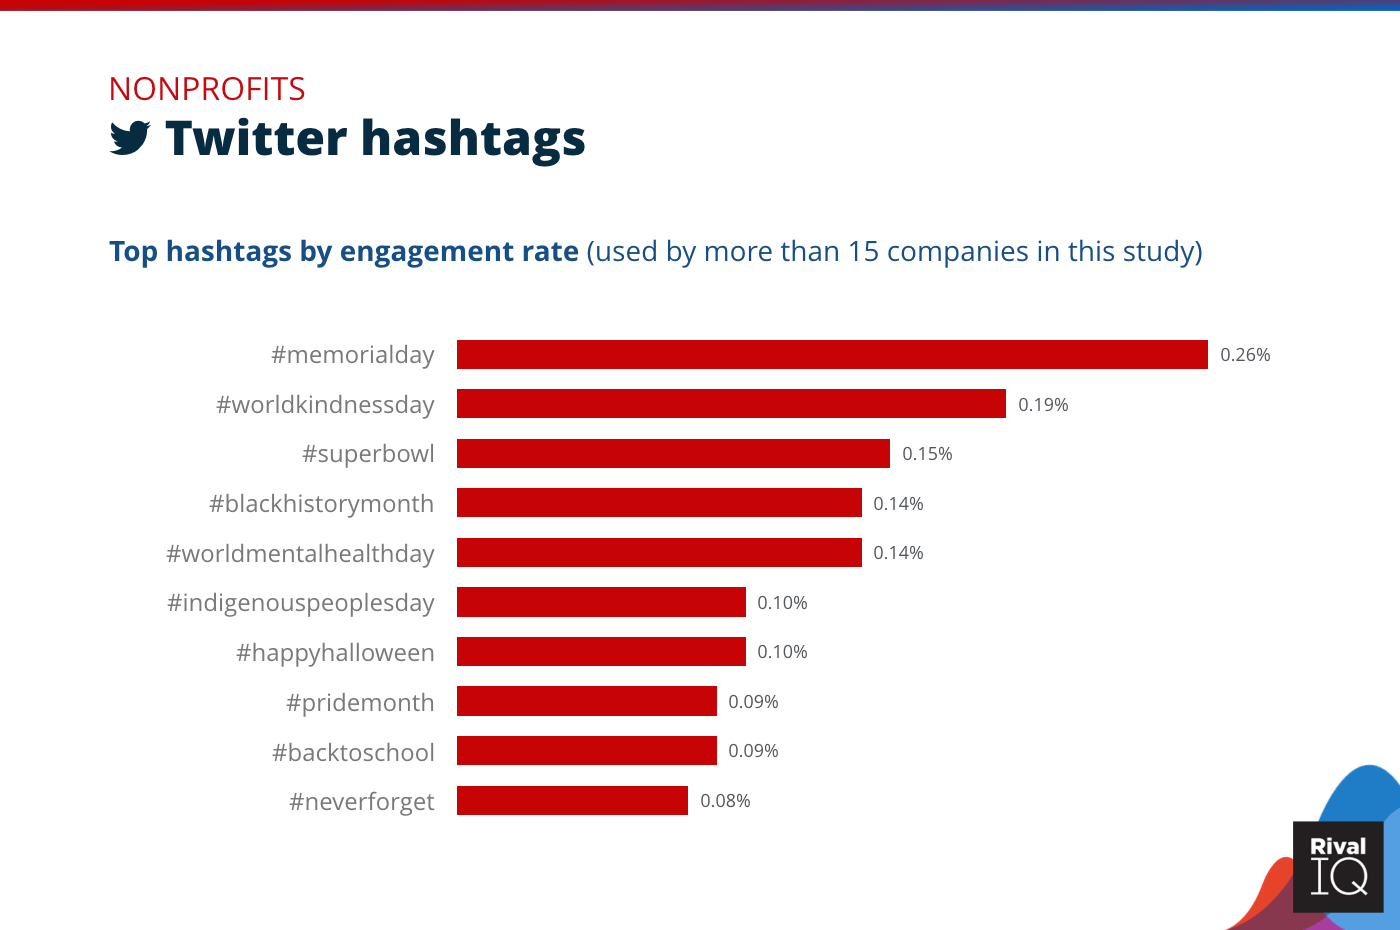
Top Twitter hashtags by engagement rate, Nonprofits
In contrast to their Instagram hashtags, Nonprofits were all about high-performing holidays on Twitter this year.
Industry Snapshot: Retail
Retail brands saw below-average performance on all three channels this year and took the hardest hit on Instagram. Their posting frequency was about average on Facebook and Instagram, but significantly lower on Twitter.
Some ideas for improving social performance this year:
- Focus on keeping your posting frequency up, especially with carousels on Instagram.
- Followers love giveaway-themed hashtags on both Instagram and Twitter, so keep it up.
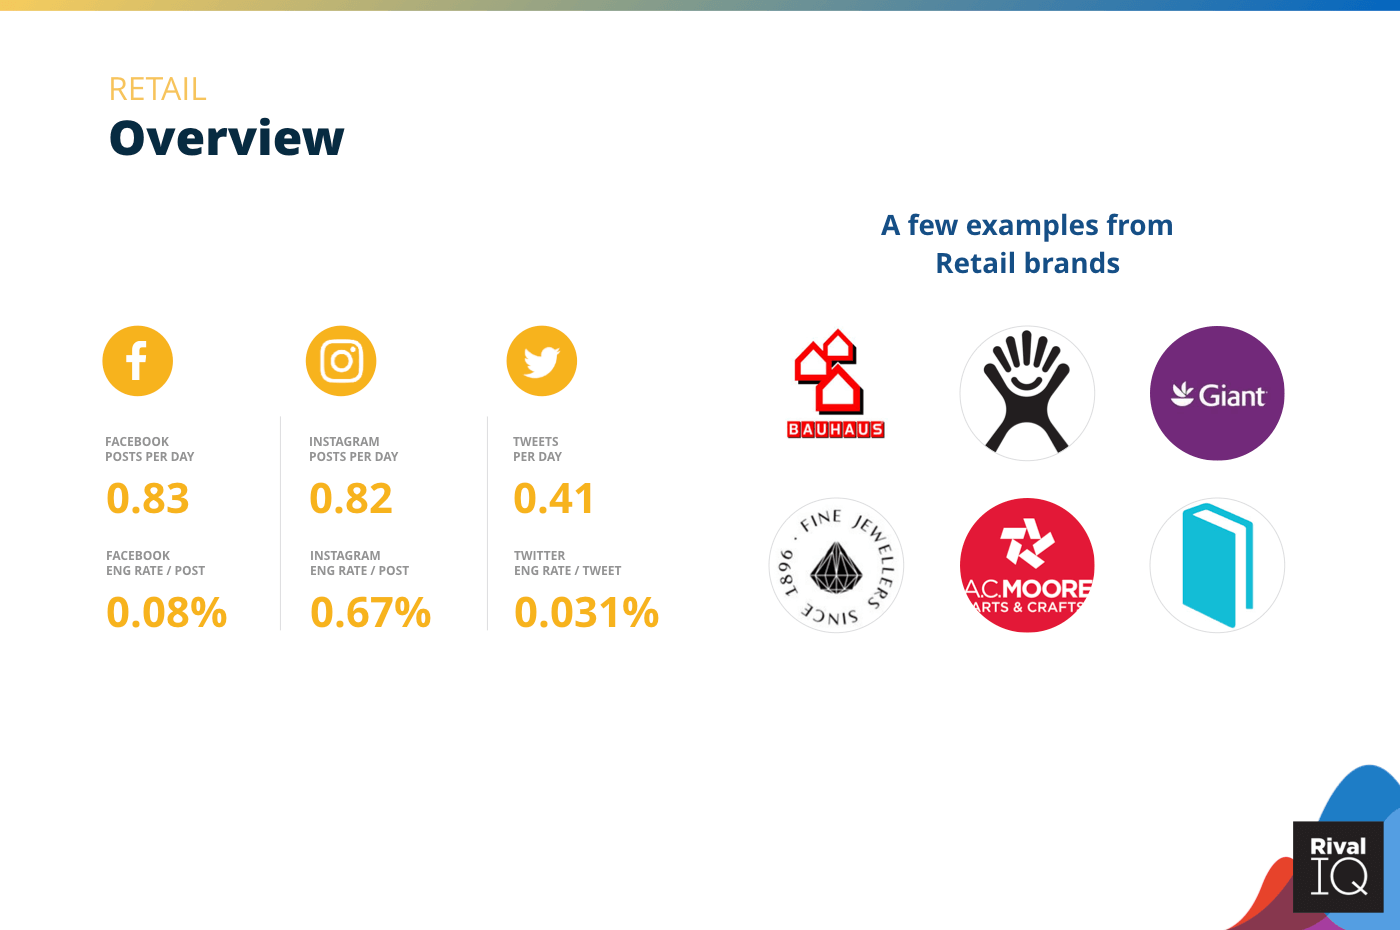
Overview of all benchmarks, Retail
Notable Retail brands in this year’s report include BAUHAUS, Hydro Flask, Giant Food, American Swiss, A.C. Moore, and Book Depository.
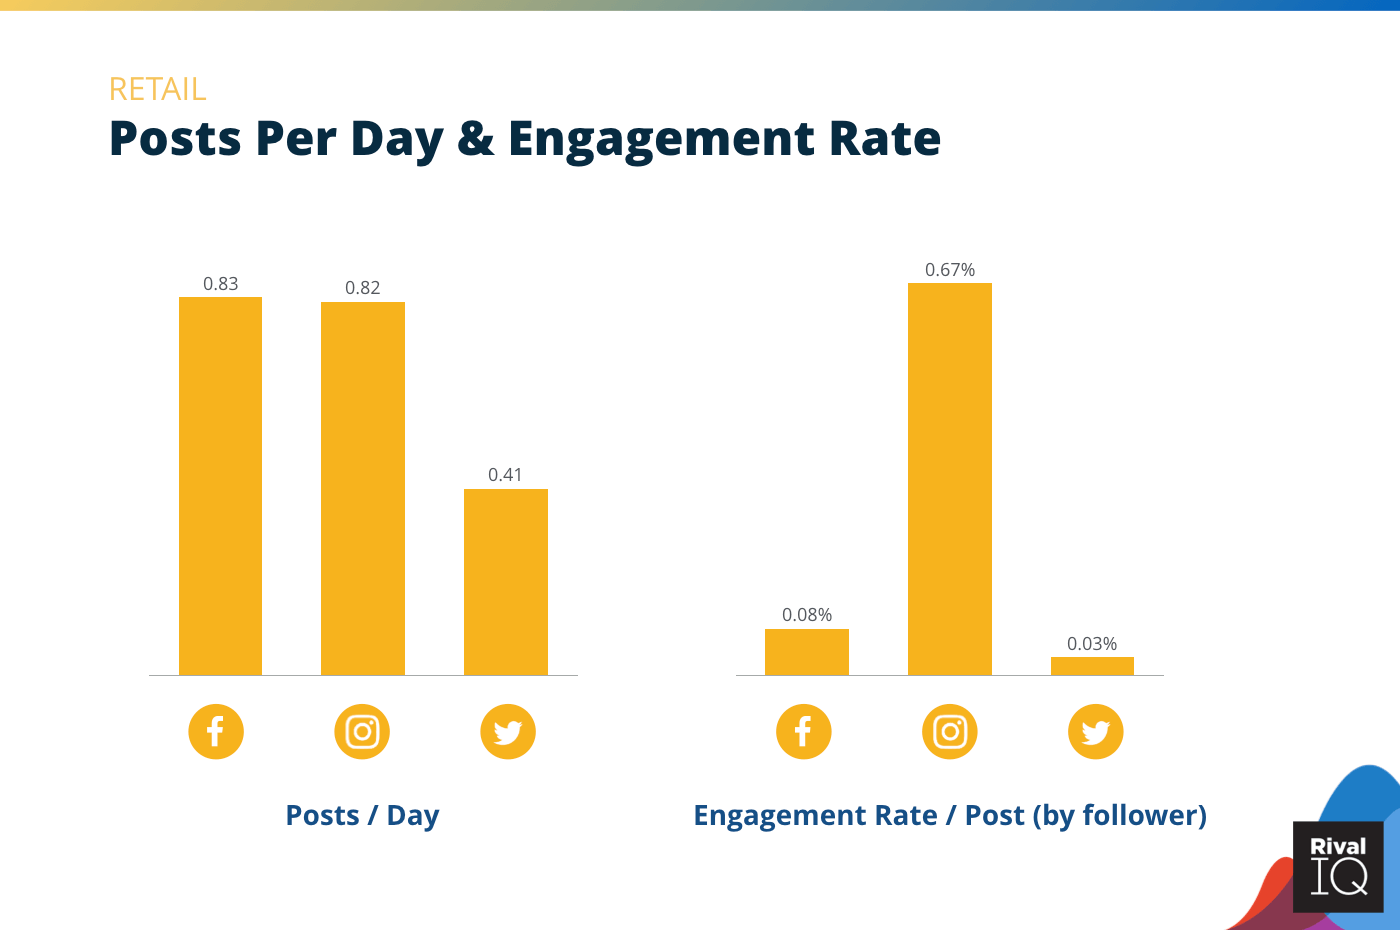
Posts per day and engagement rate per post across all channels, Retail
Retail brands posted photos less often this year than last but rocked the same engagement for that post type on Facebook.
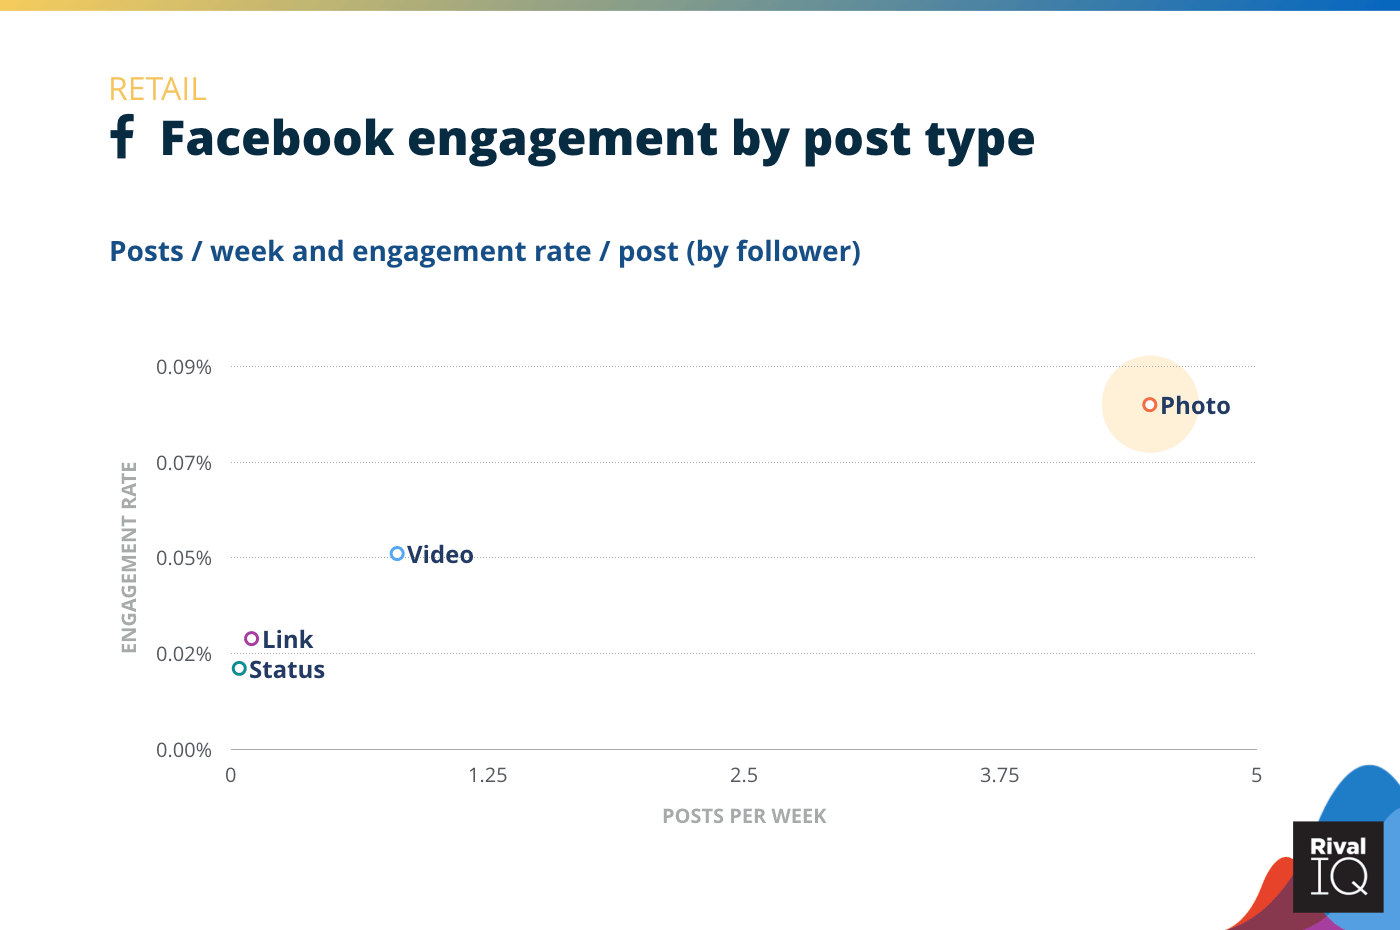
Facebook posts per week and engagement rate by post type, Retail
Overall Retail Instagram winner Hydro Flask went against the industry grain by posting tons of successful carousels, so take a leaf out of their book and get posting.
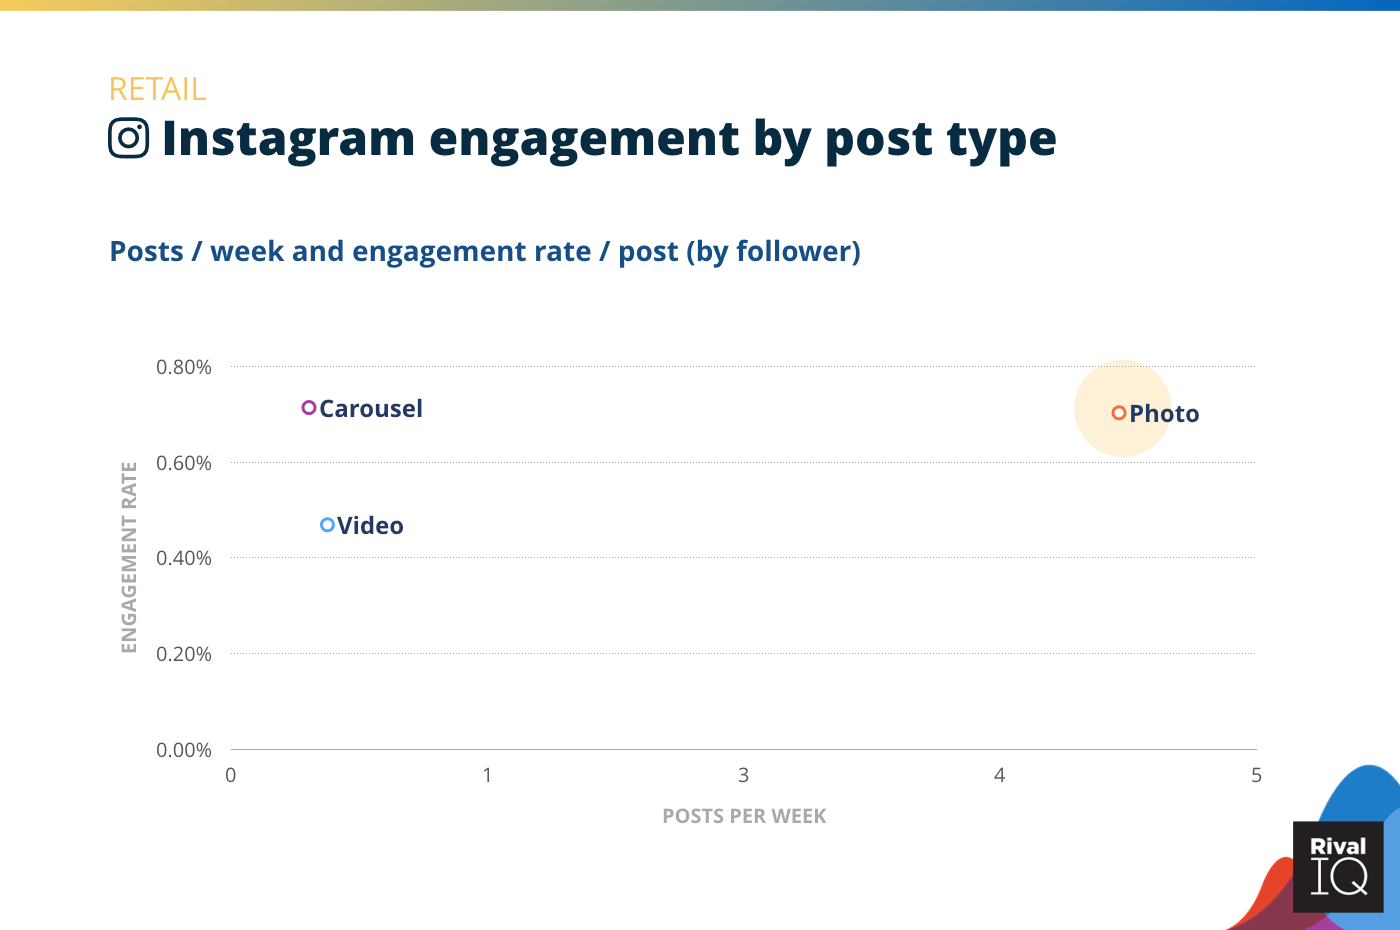
Instagram posts per week and engagement rate by post type, Retail
No surprises here that consumer-focused Retail brands saw lots of Instagram success with hashtags like #competition, #winner, #giveaway, and #win this year.
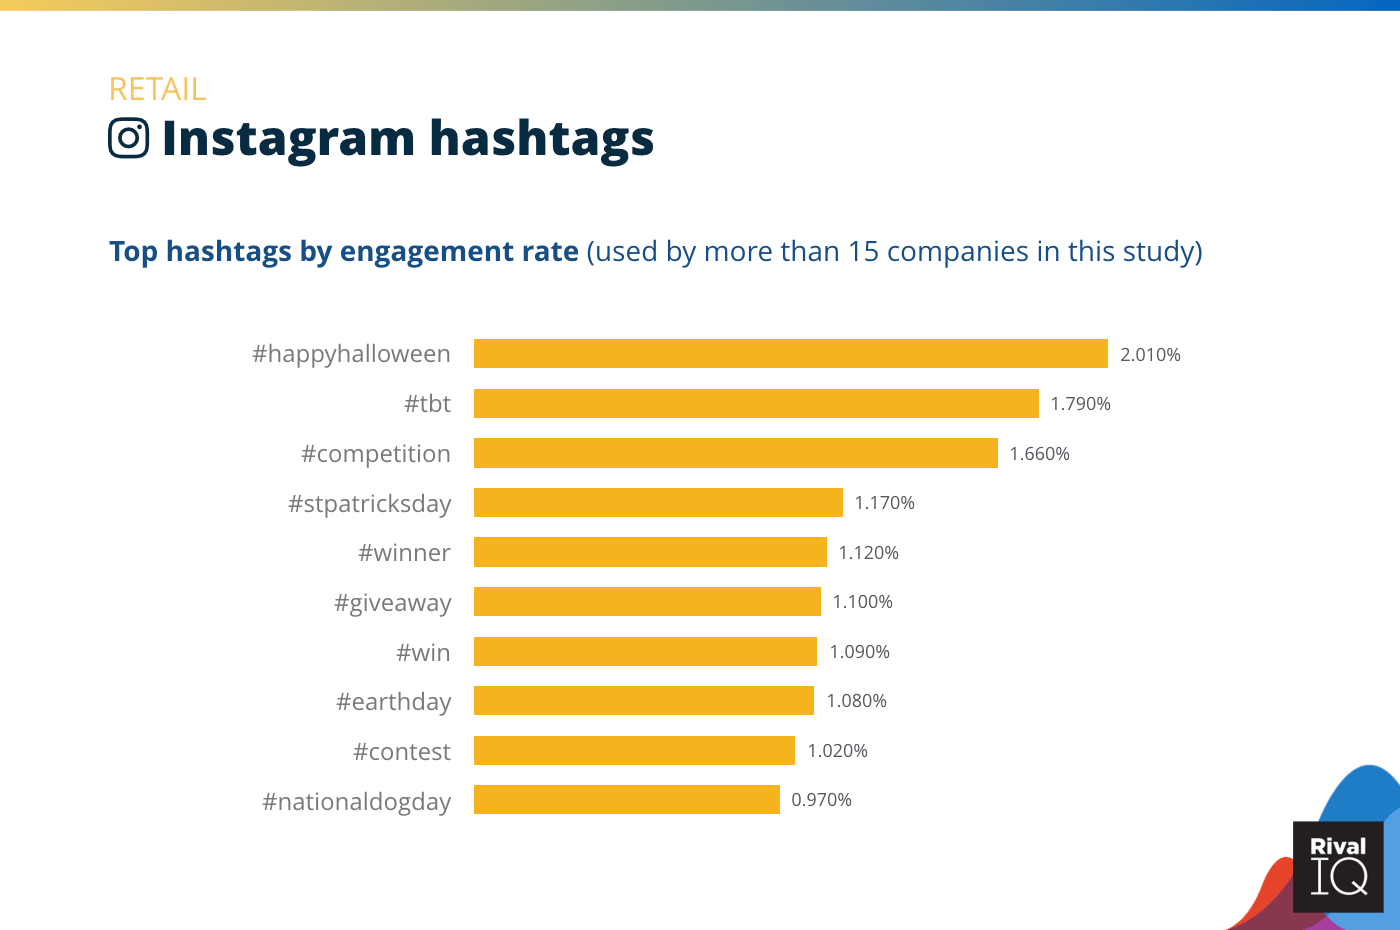
Top Instagram hashtags by engagement rate, Retail
No surprises here that consumer-focused Retail brands saw lots of Instagram success with hashtags like #competition, #winner, #giveaway, and #win this year.
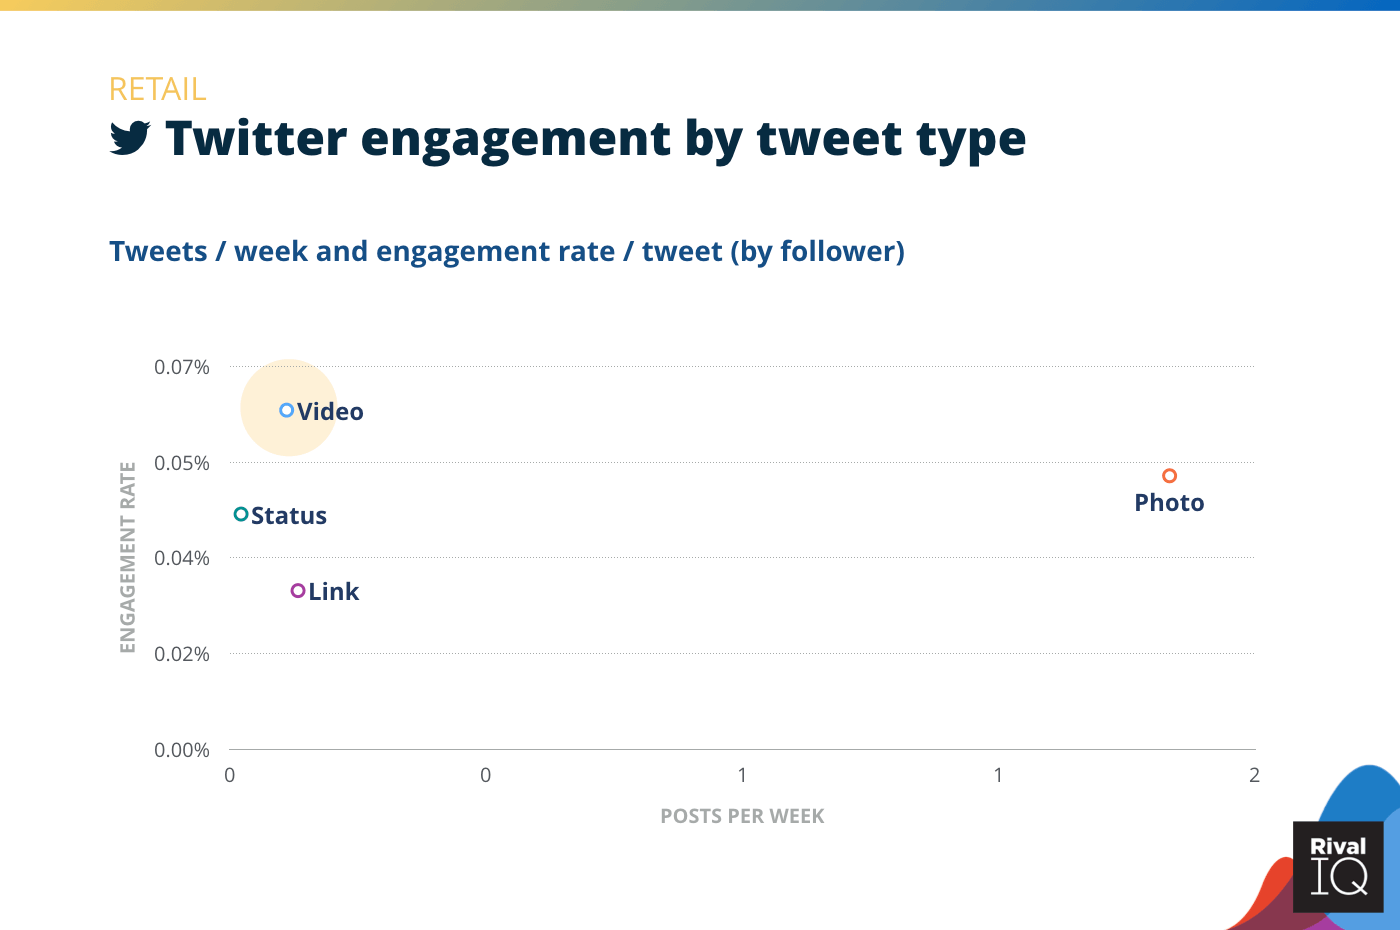
Twitter posts per week and engagement rate by tweet type, Retail
Videos rocked 2x Retail’s median engagement on Twitter, so Retail brands should definitely invest more in video.
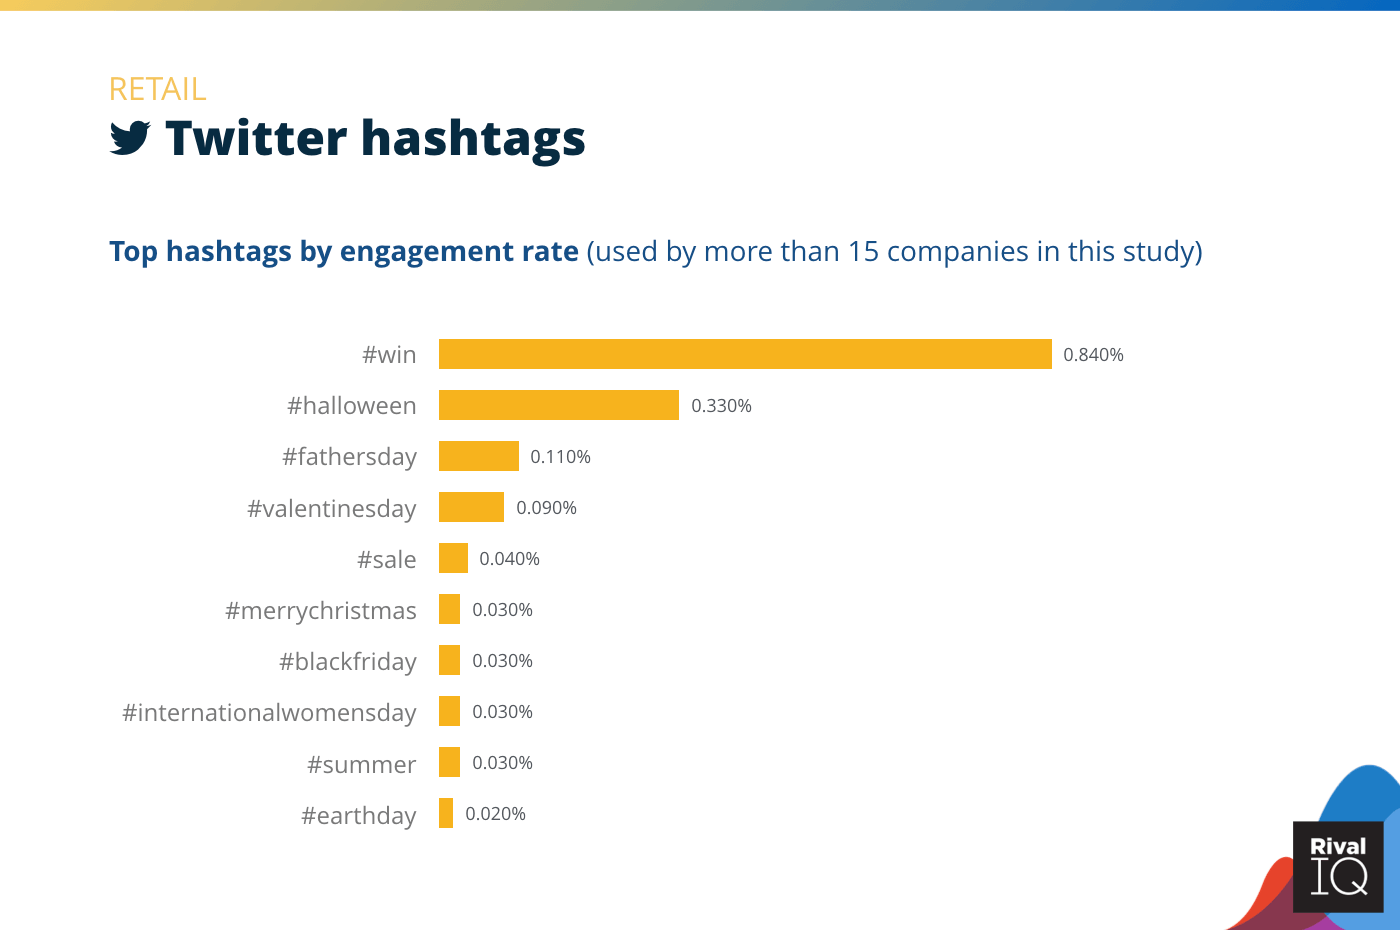
Top Twitter hashtags by engagement rate, Retail
Retail’s Twitter followers were all about the contests this year, with more than 2x the engagement rates compared to their other top performing hashtags.
Industry Snapshot: Sports Teams
Sports Teams won the day with engagement rates and posting frequency on all three channels–especially on Twitter, where they rocked a 50% increase over last year.
Some ways to improve engagement rates even more:
- That high posting frequency is working, so keep it up.
- Videos are a top performer on all three channels, so create more video content and repurpose what’s working.
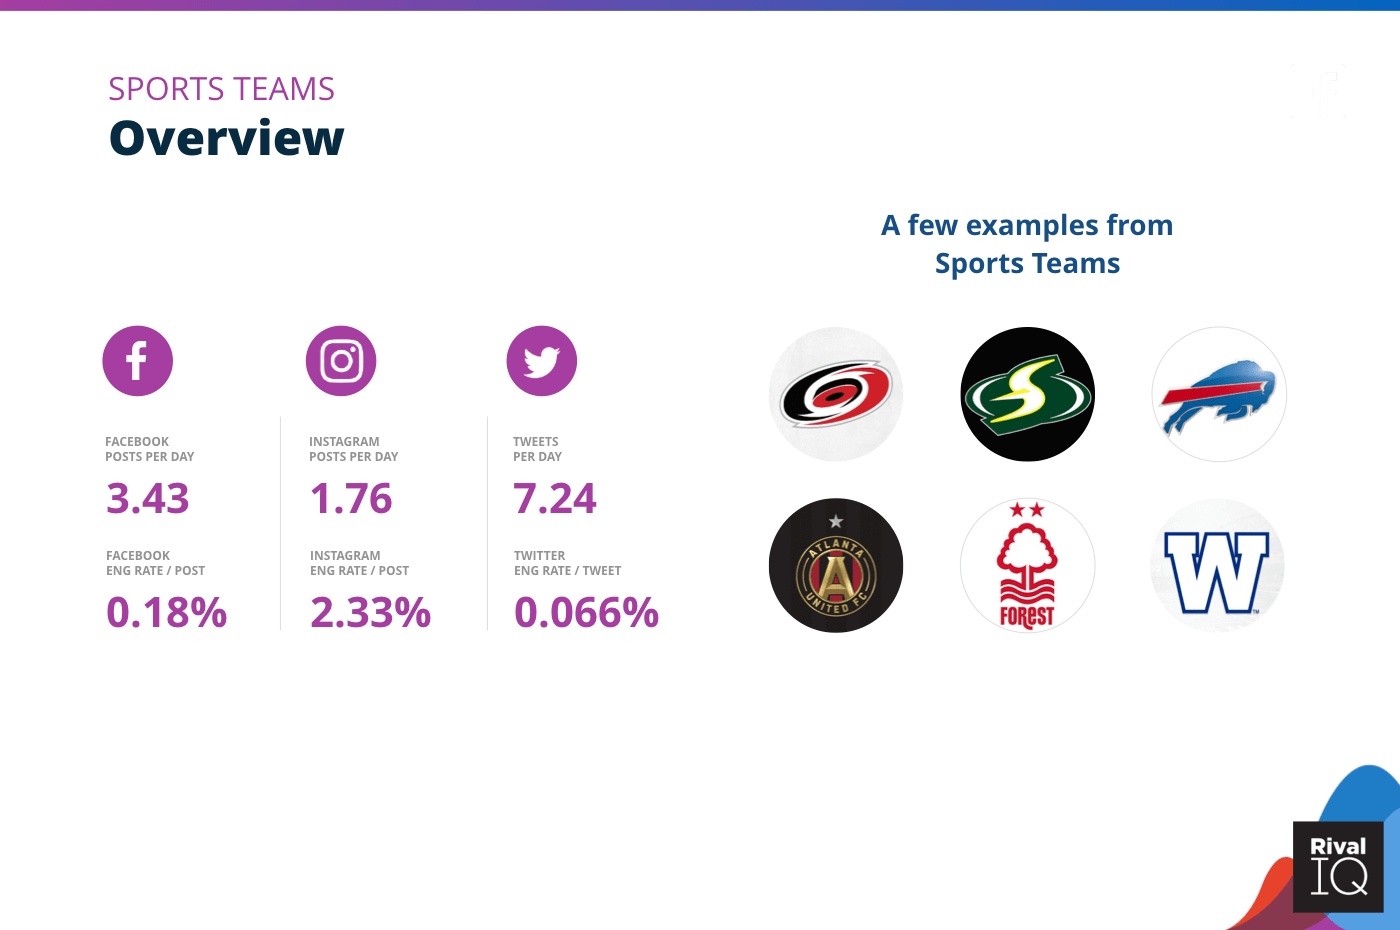
Overview of all benchmarks, Sports Teams
Notable Sports Teams in this year’s report include Carolina Hurricanes, Seattle Storm, Buffalo Bills, Atlanta United FC, Nottingham Forest, and Winnipeg Blue Bombers.
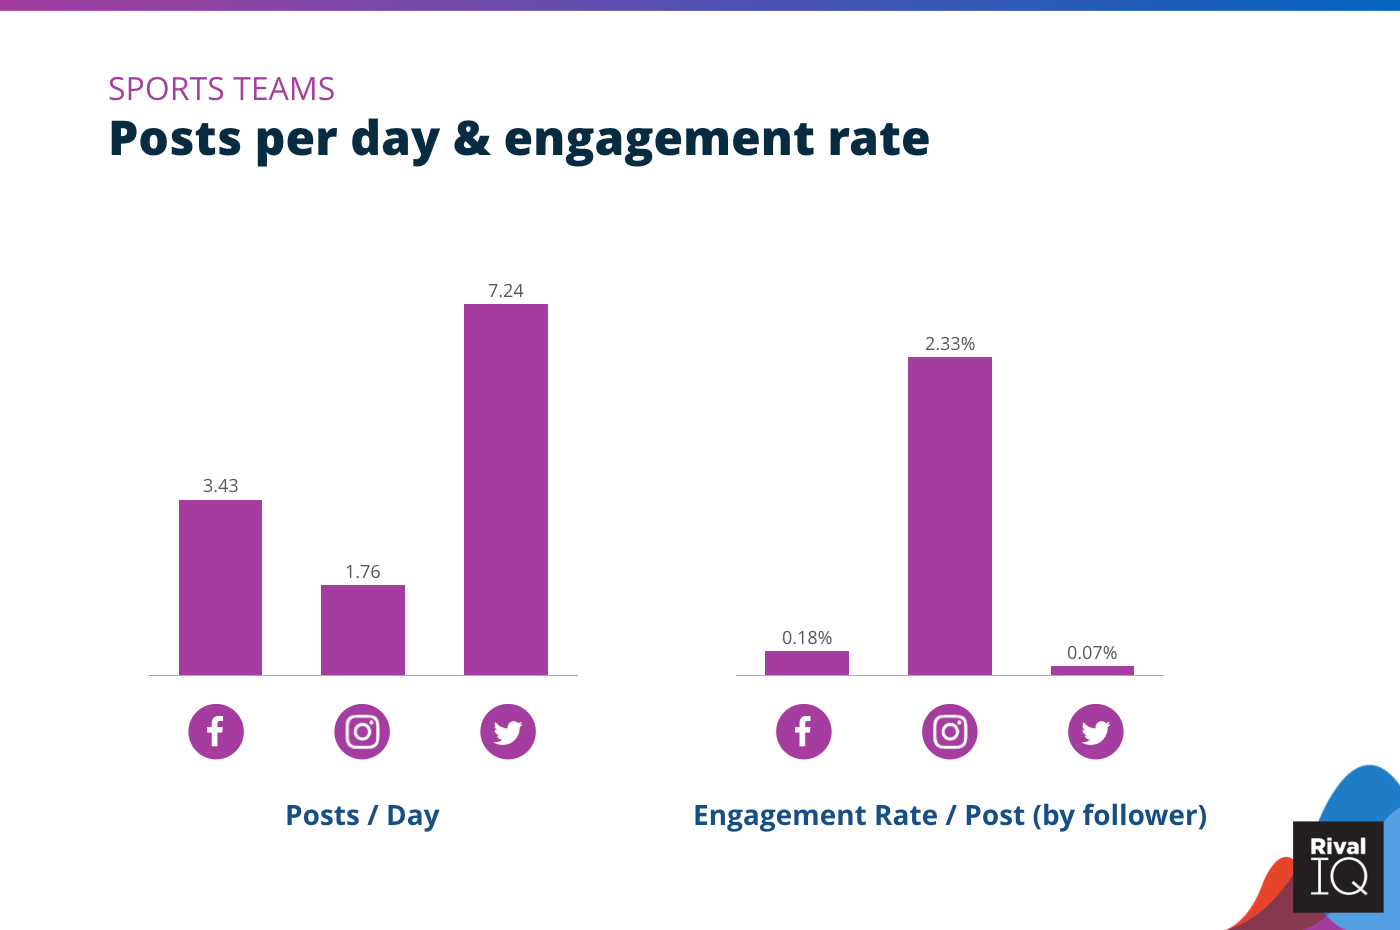
Posts per day and engagement rate per post across all channels, Sports Teams
Sports Teams dominate with sky-high posting frequency and above-median engagement on Facebook, Twitter, and Instagram for the second year in a row.
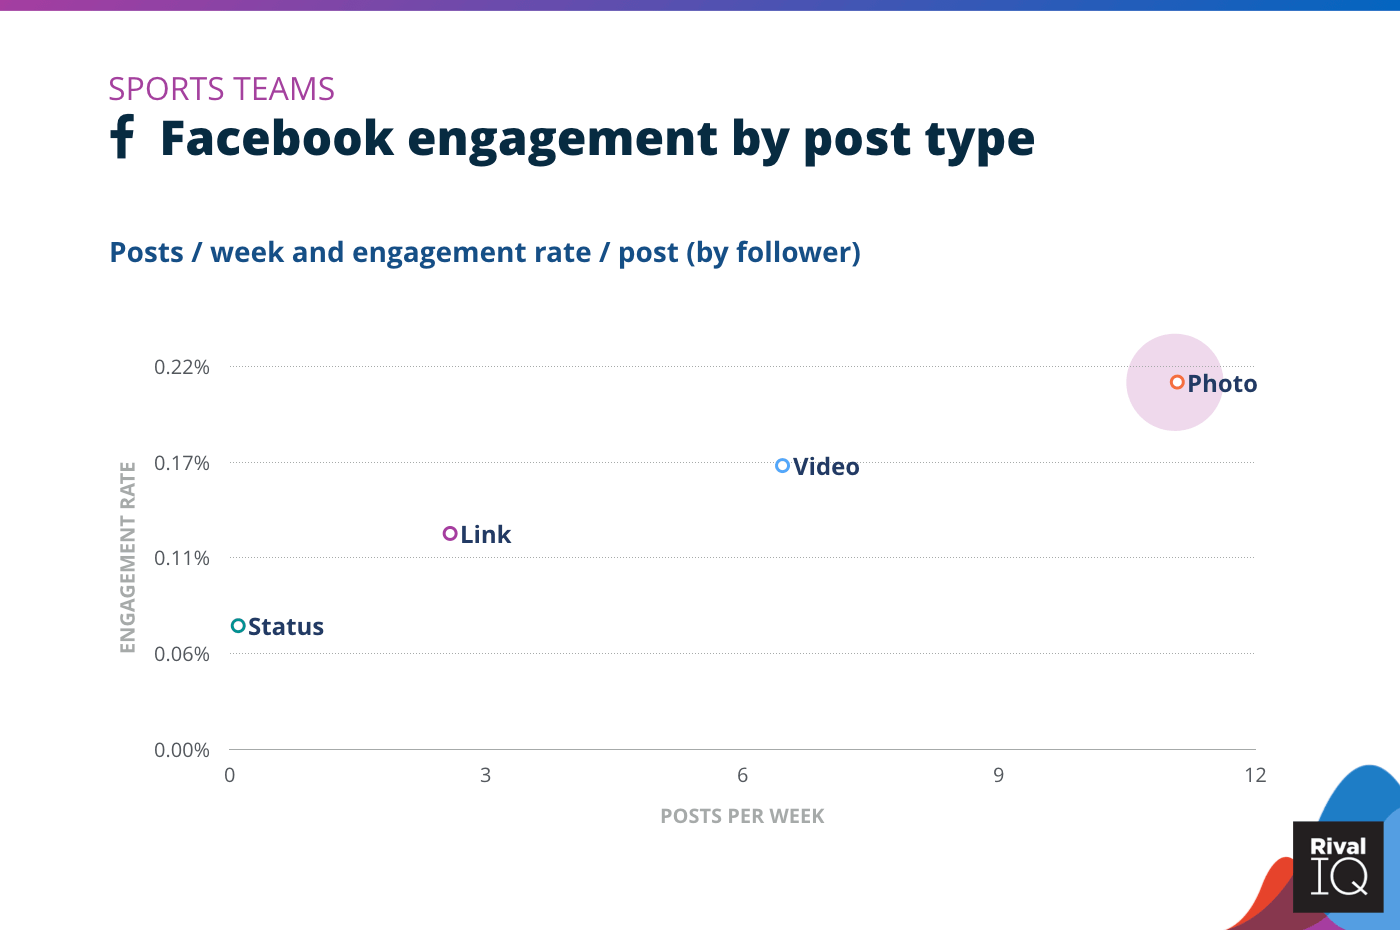
Facebook posts per week and engagement rate by post type, Sports Teams
Sports Teams are enjoying increased engagement across all post types on Facebook, especially with photos, which are seeing nearly 2x the engagement as last year.
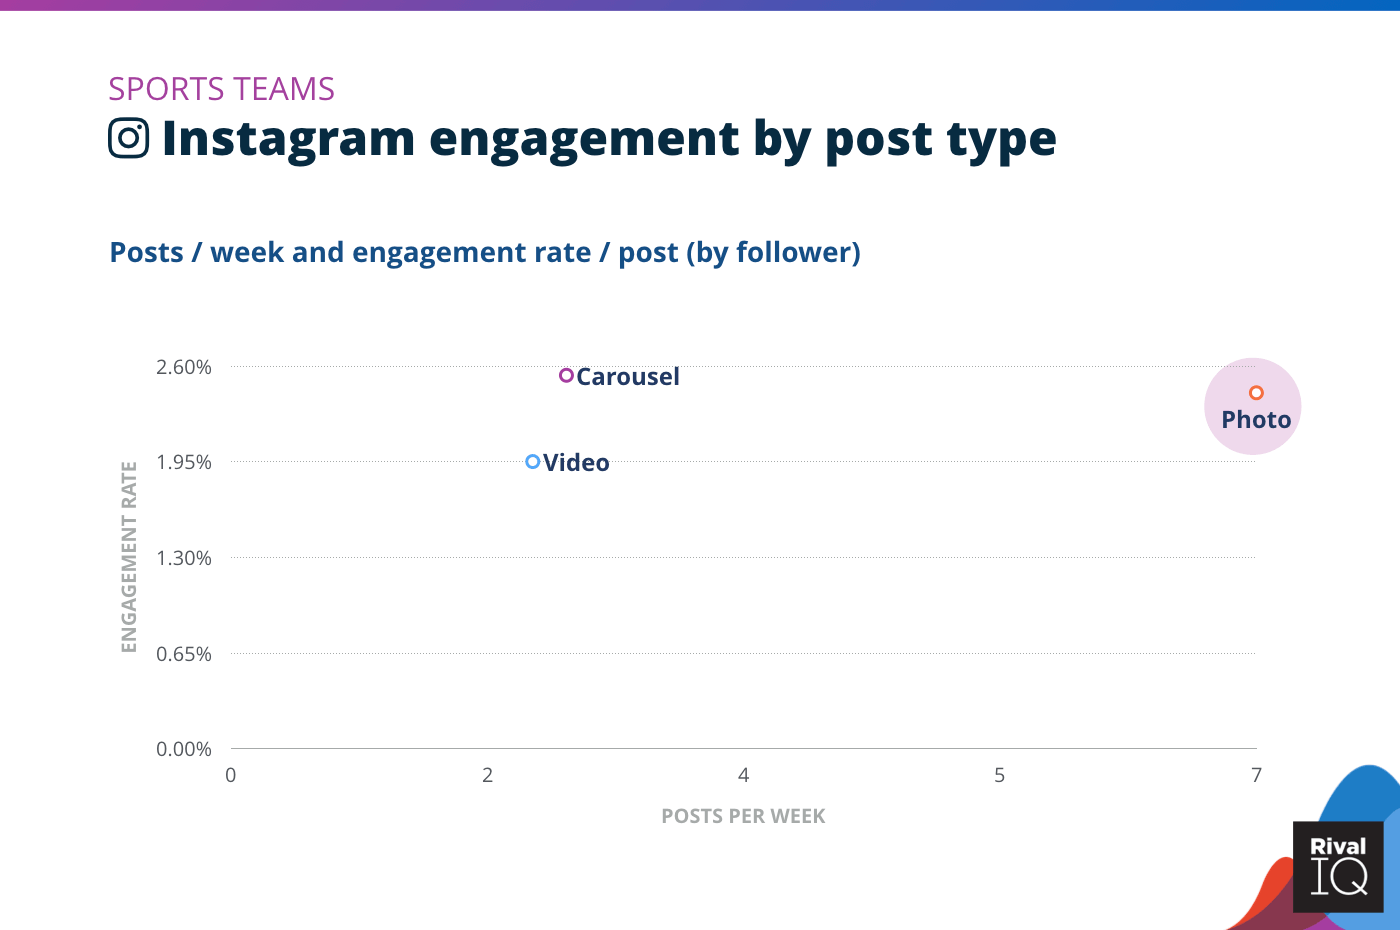
Instagram posts per week and engagement rate by post type, Sports Teams
Sports Teams like overall Instagram winner Toronto FC rocked on this channel by focusing on high-performing carousels and videos.
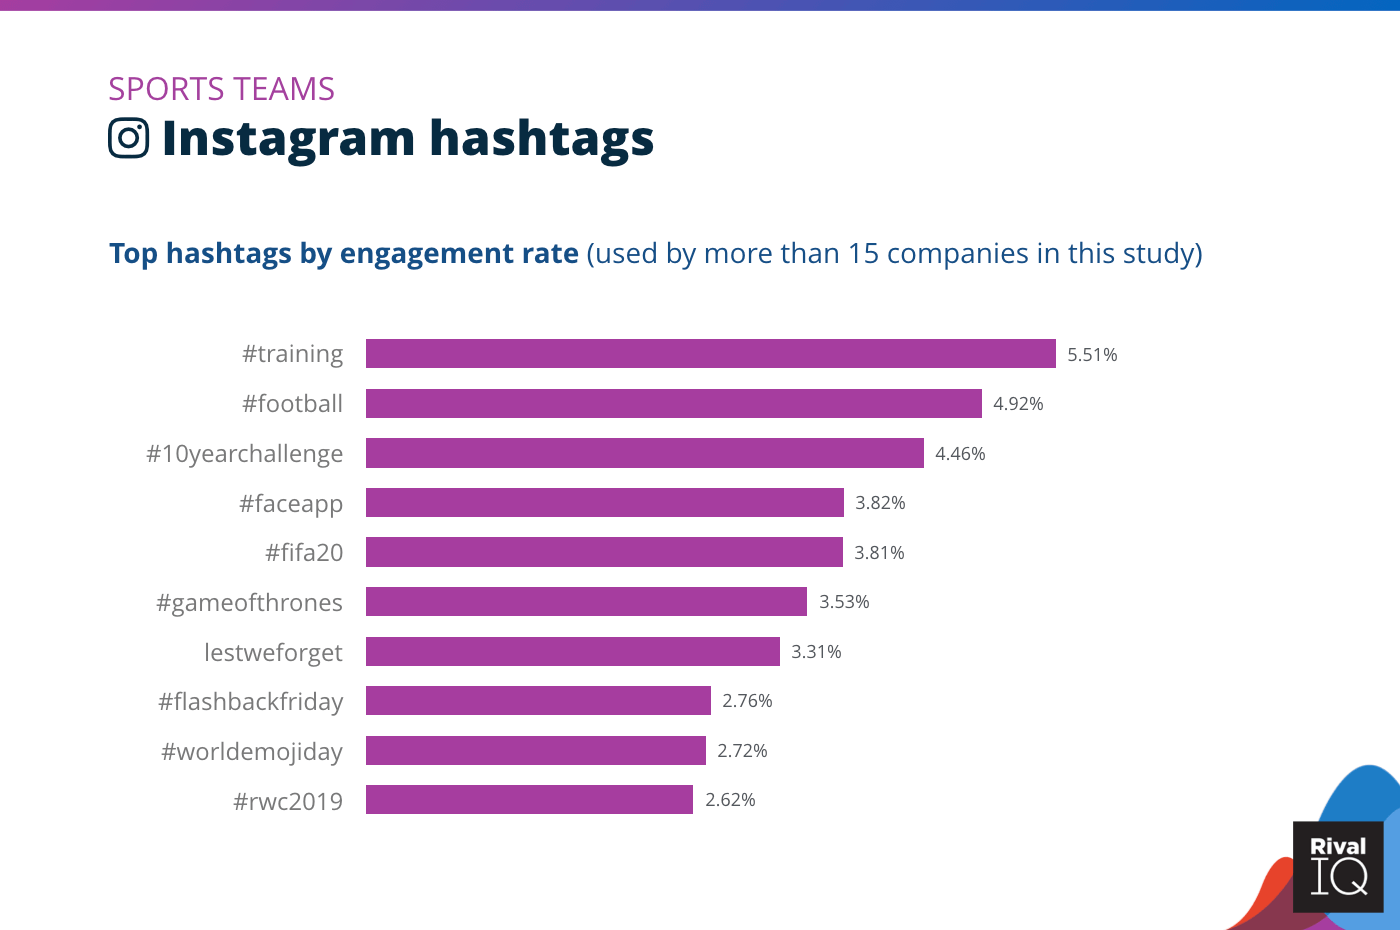
Top Instagram hashtags by engagement rate, Sports Teams
Sports Teams saw high Instagram hashtag performance with sports-themed hashtags, but also kept things current with trending hashtags like #10yearchallenge and #gameofthrones.
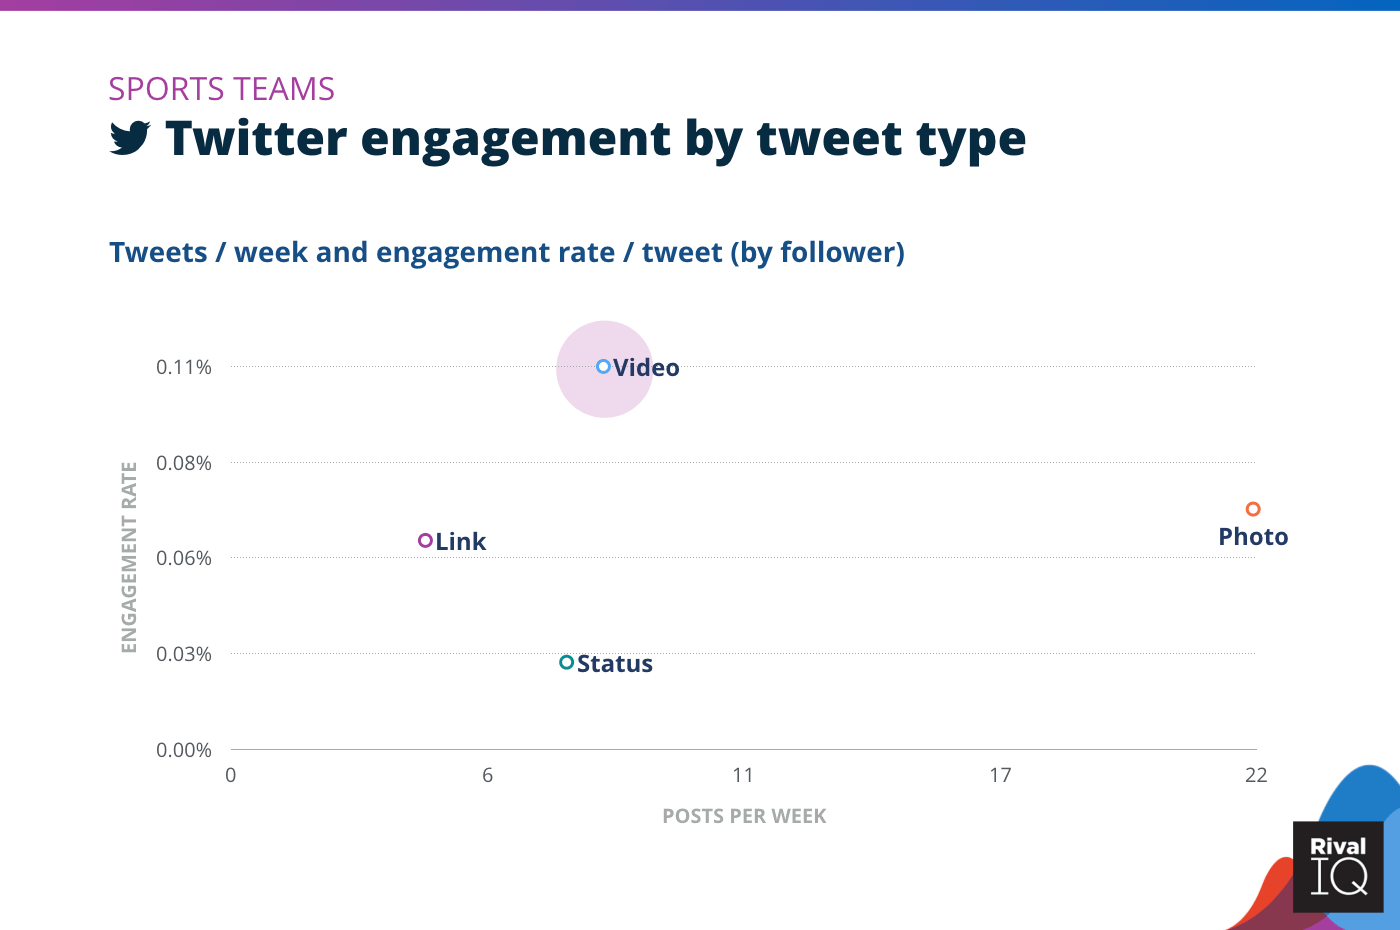
Twitter posts per week and engagement rate by tweet type, Sports Teams
Sports Teams saw a 50% increase in engagement rates for videos on Twitter, which can help explain the industry’s 50% overall increase on Twitter this year.
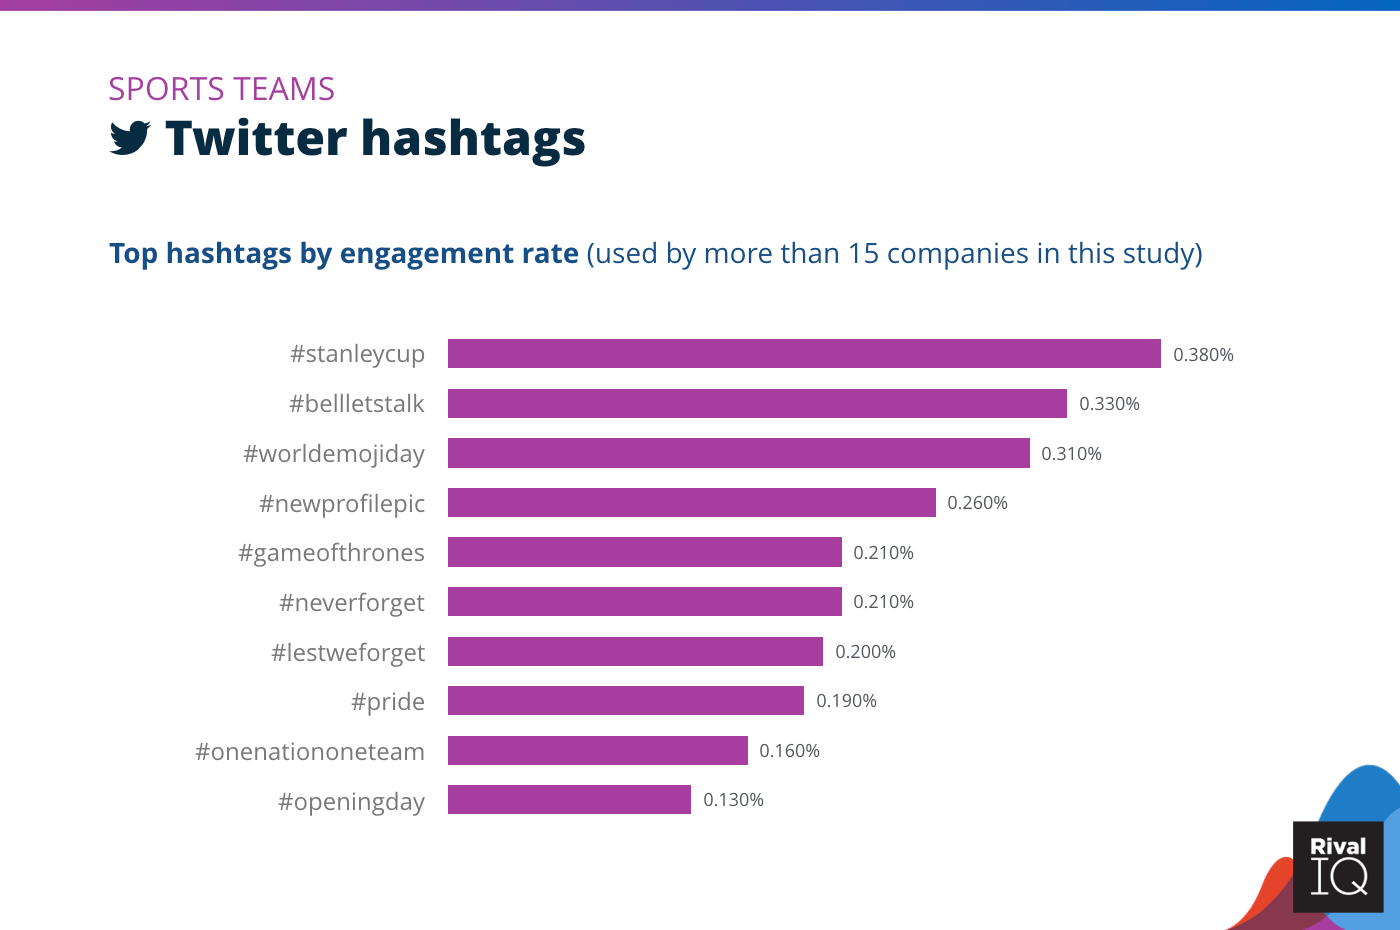
Top Twitter hashtags by engagement rate, Sports Teams
Hockey took the cake for Sports Team hashtags on Twitter this year. Bell Let’s Talk, a Canadian awareness campaign about mental illness was a close second, suggesting Sports Teams were doing good with all their air time on social.
Industry Snapshot: Tech & Software
Despite coming in last on Facebook, Tech & Software brands are fighting to get ahead on Instagram and Twitter.
Based on this study, there are two opportunities that could improve engagement rates:
- Videos perform well on Twitter, so look for more opportunities there.
- Refocus your Facebook energy to Instagram for a larger share of the world’s most engaging social channel.
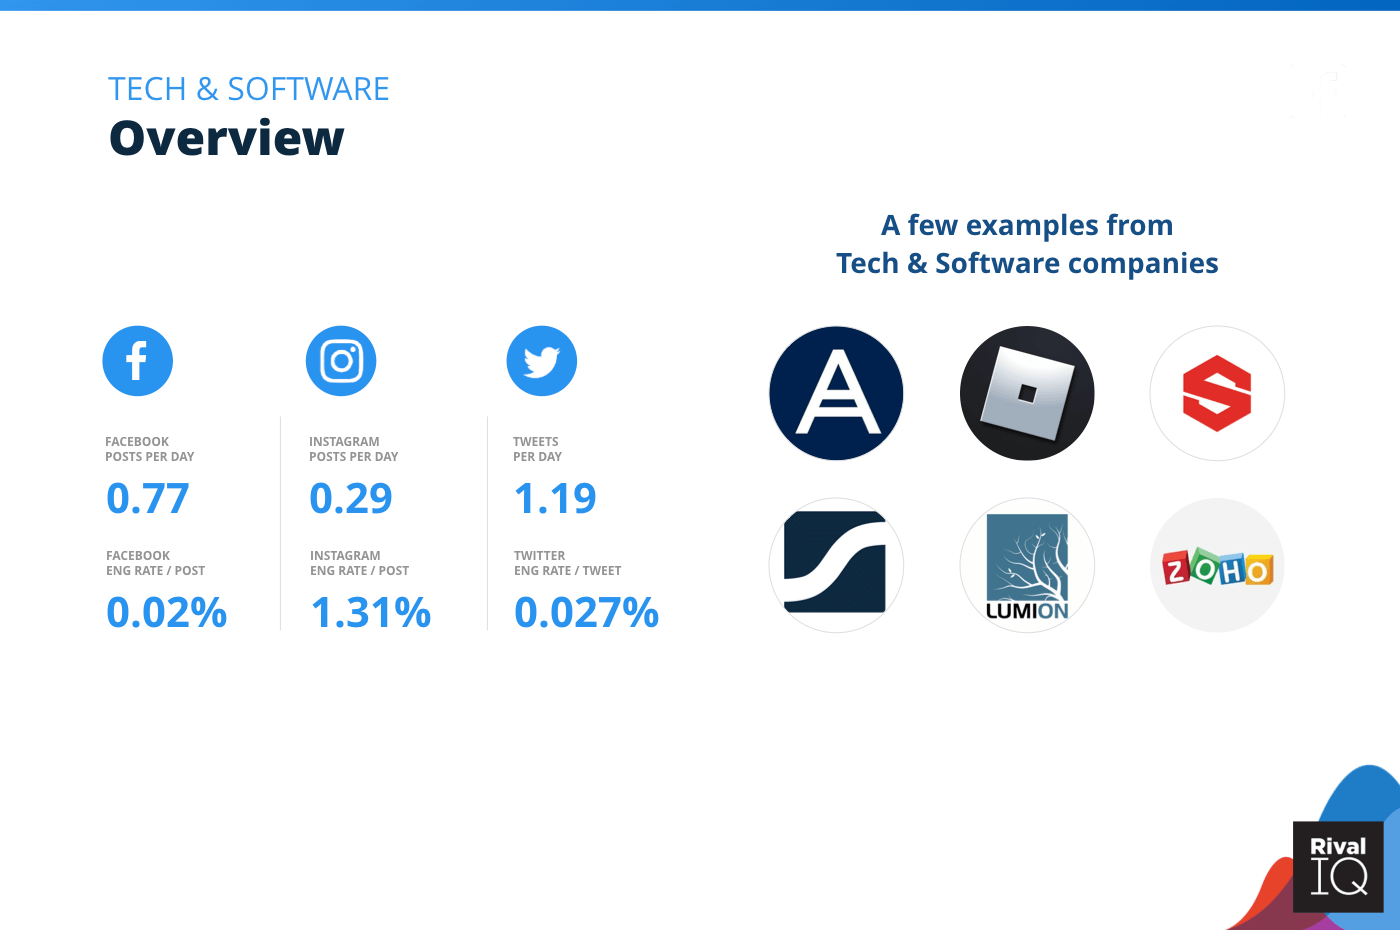
Overview of all benchmarks, Tech & Software
Notable Tech & Software brands in this year’s report include Acronis, Roblox, Allegorithmic, Statista, Lumion, and Zoho.
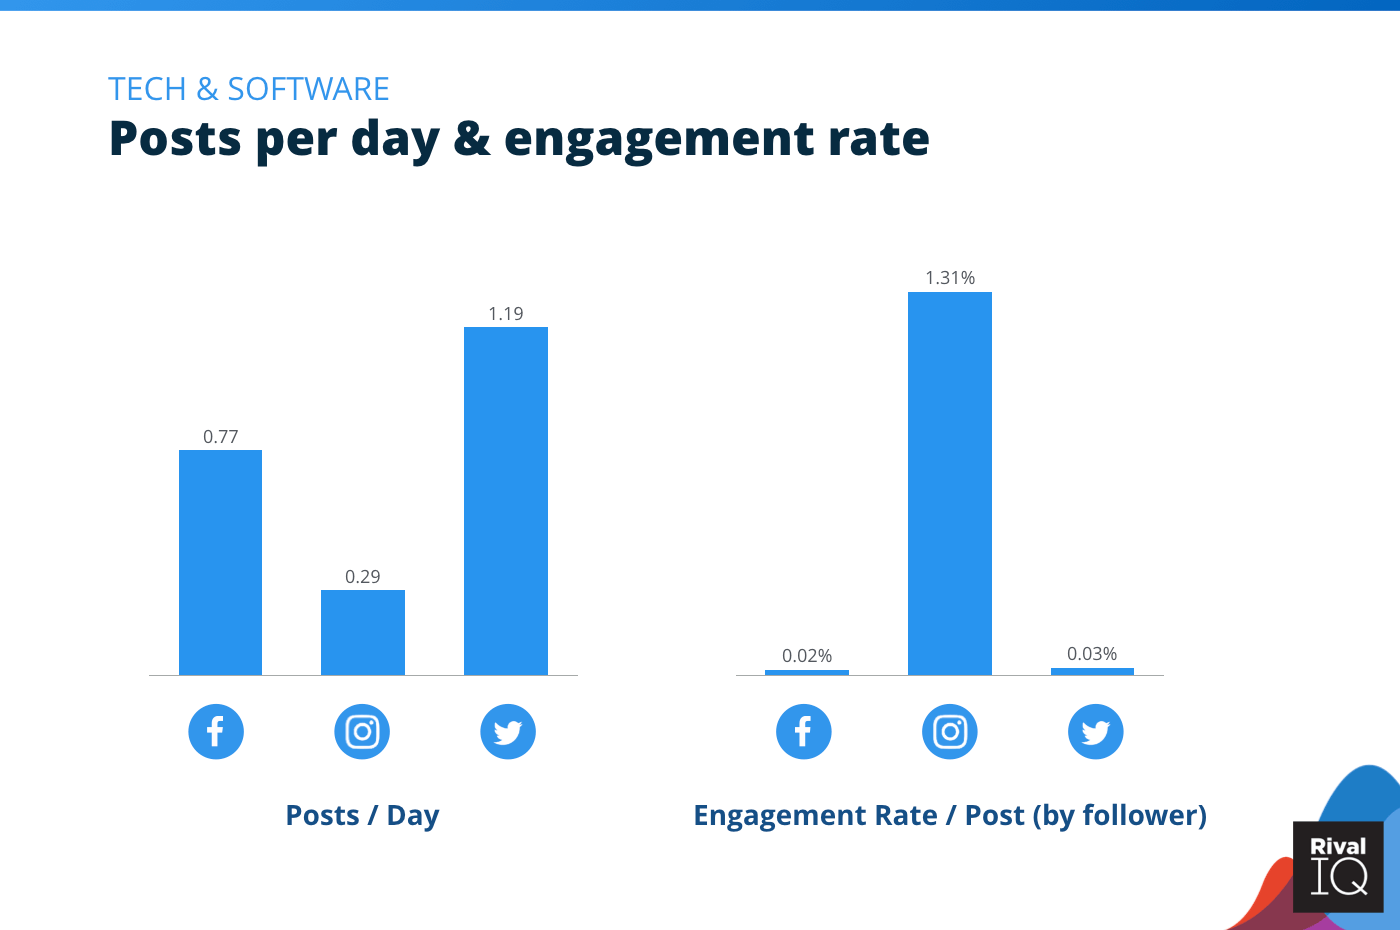
Posts per day and engagement rate per post across all channels, Tech & Software
Tech & Software rode above the median on Instagram but scored last place on Facebook, and tweeted nearly twice as often as the average brand on Twitter.
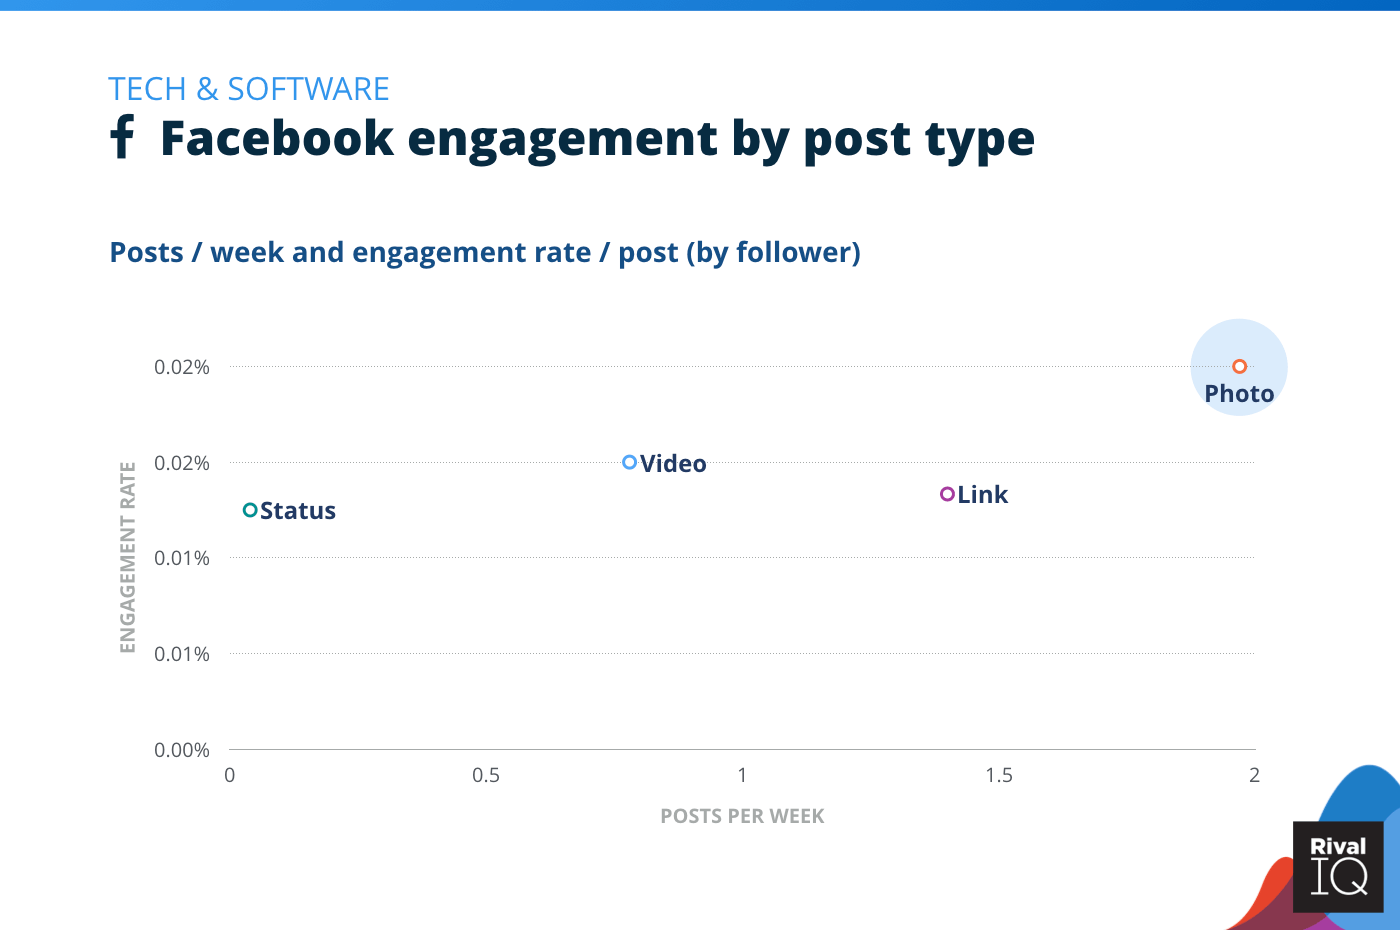
Facebook posts per week and engagement rate by post type, Tech & Software
Post type success on Facebook was neck-and-neck for Tech & Software brands, but photos performed the best and were posted most often.
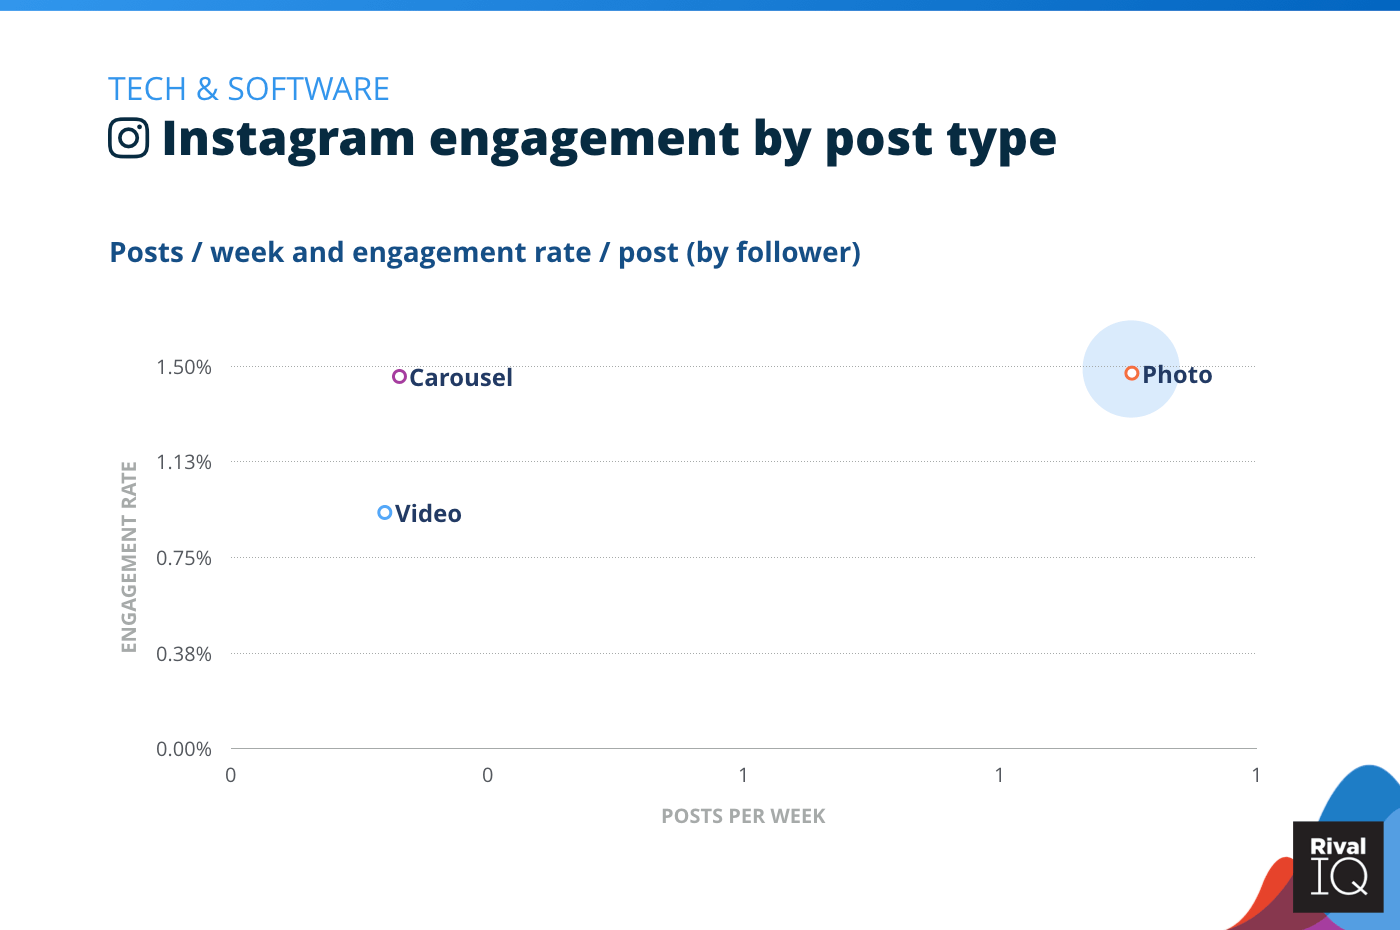
Instagram posts per week and engagement rate by post type, Tech & Software
Unlike many other industries, photos and carousels had very similar engagement on Instagram, while video lagged.
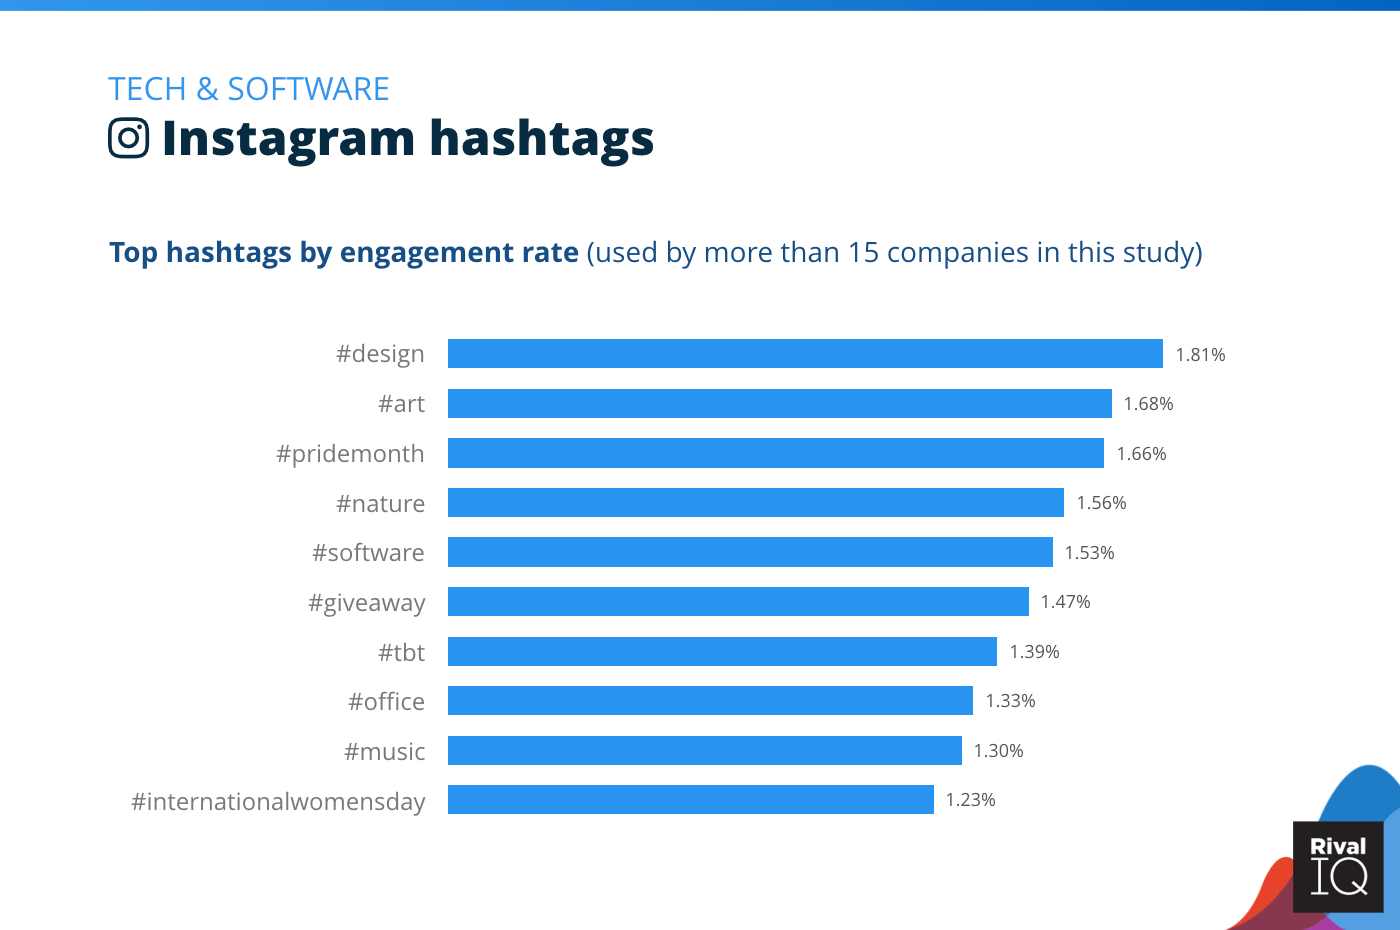
Top Instagram hashtags by engagement rate, Tech & Software
Tech & Software saw a lot of hashtag variety on Instagram this year, with artistic hashtags like #design and #art coming out on top.
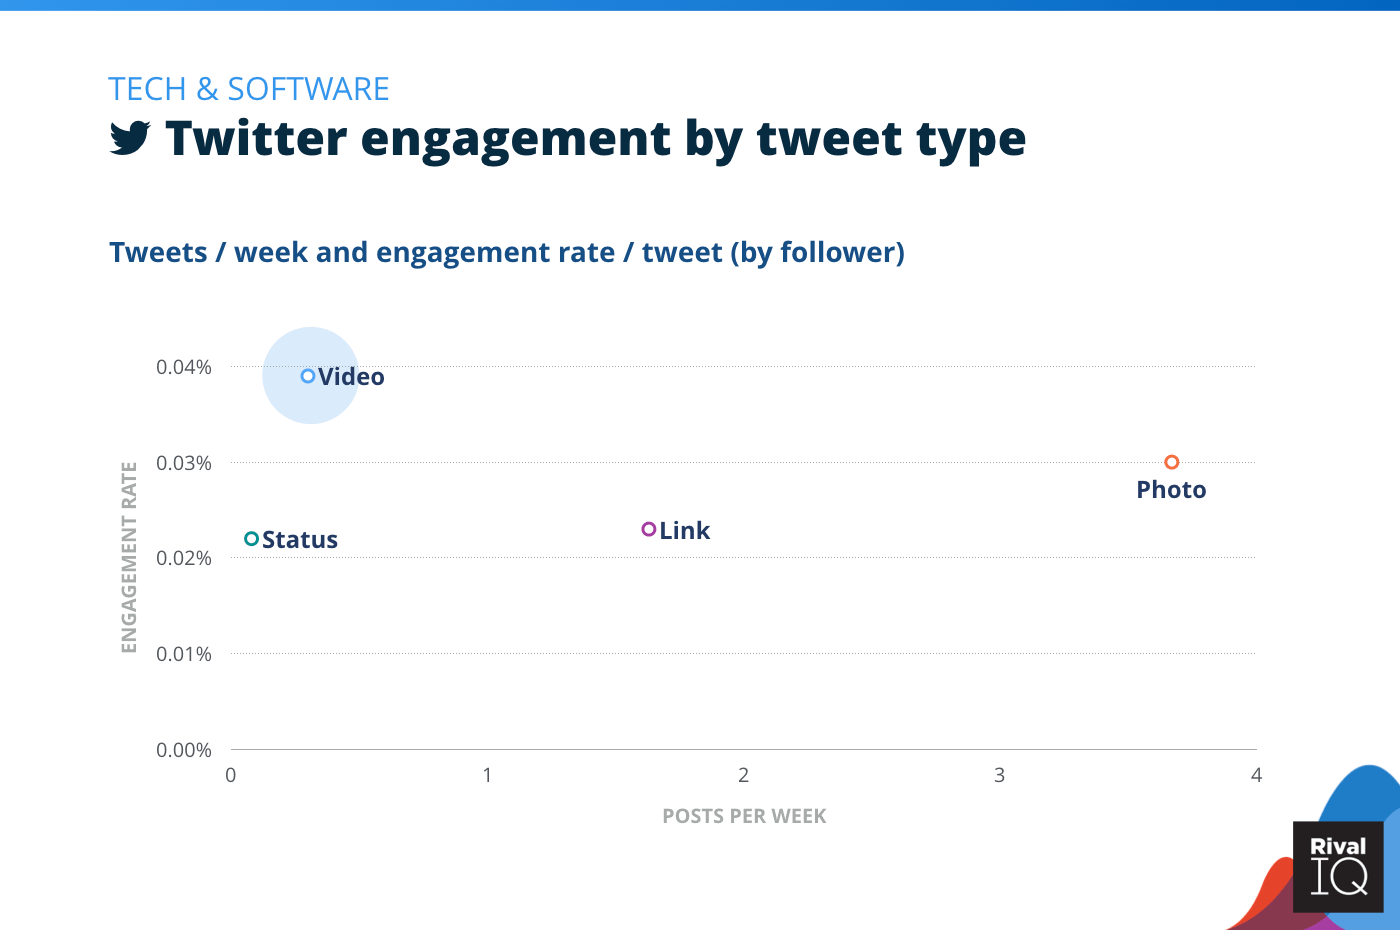
Twitter posts per week and engagement rate by tweet type, Tech & Software
Videos performed well for top Tech & Software Twitter performers like Todoist and HP Careers, but weren’t tweeted very frequently for the industry as a whole.
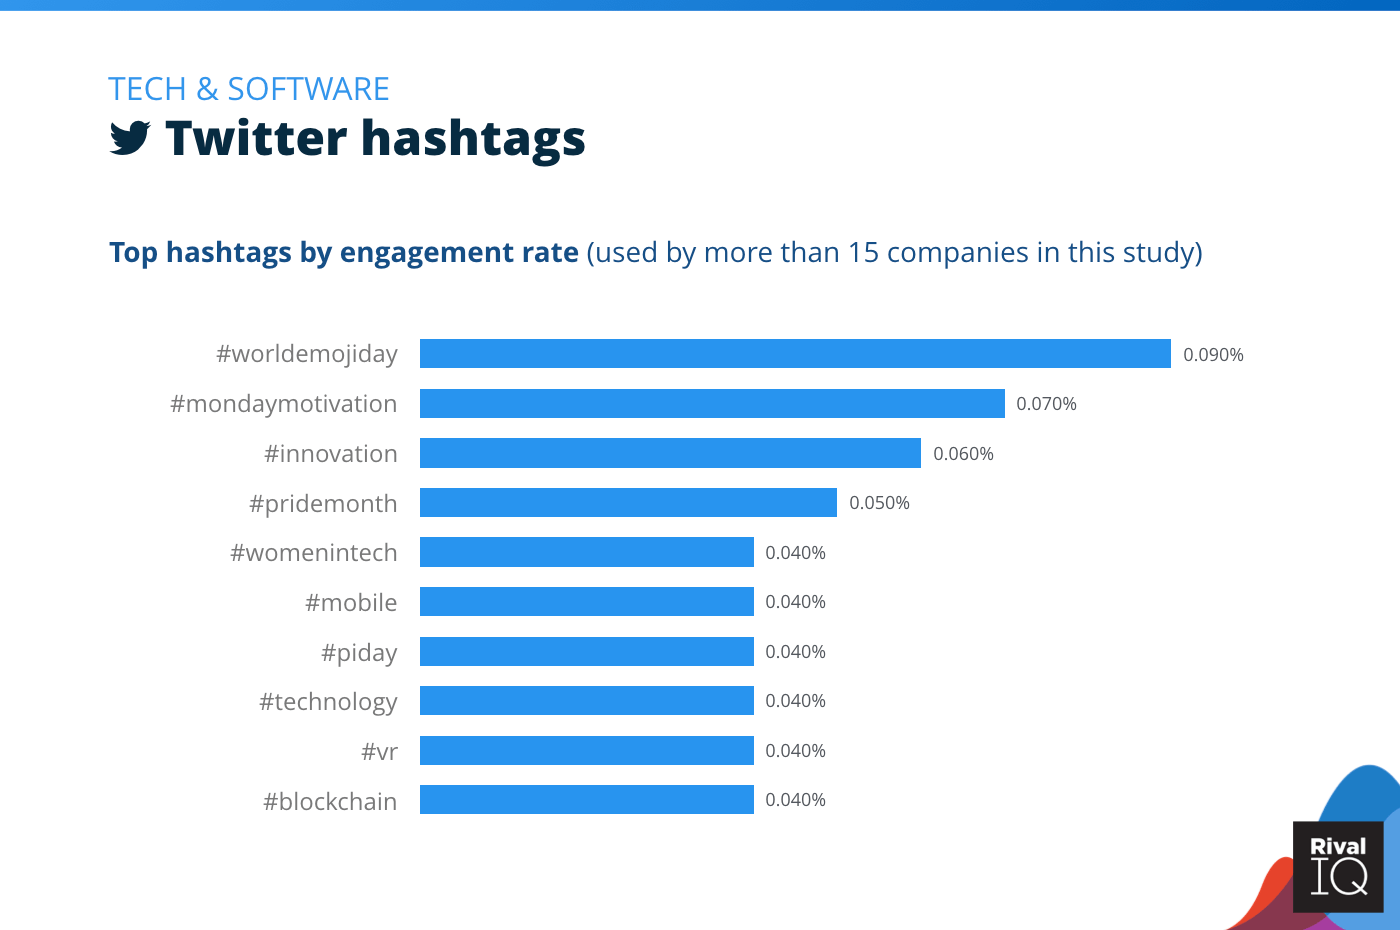
Top Twitter hashtags by engagement rate, Tech & Software
Like many other industries in our study, Tech & Software brands found the most Twitter hashtag success with “holidays” like #worldemojiday, #pridemonth, and #piday.
Methodology
We used Rival IQ to analyze engagement rates, posting frequency, post types, and hashtags on the top three social channels for brands: Facebook, Instagram, and Twitter.
We define engagement as measurable interaction on social media posts, including likes, comments, favorites, retweets, shares, replies, and reactions. Engagement rate is calculated based on all these interactions divided by total follower count.
We expanded our list this year to 14 top industries (industries with an * are new this year):
Within this report, we provide a representative sample of national and international companies in each industry by selecting 150 companies at random from each industry from our database of over 180,000 companies. Companies selected had active presences on Facebook, Instagram, and Twitter as of January 2019, and had Facebook fan counts between 25,000 and 1,000,000 and minimum Instagram and Twitter followers of 1,000 as of the same date.
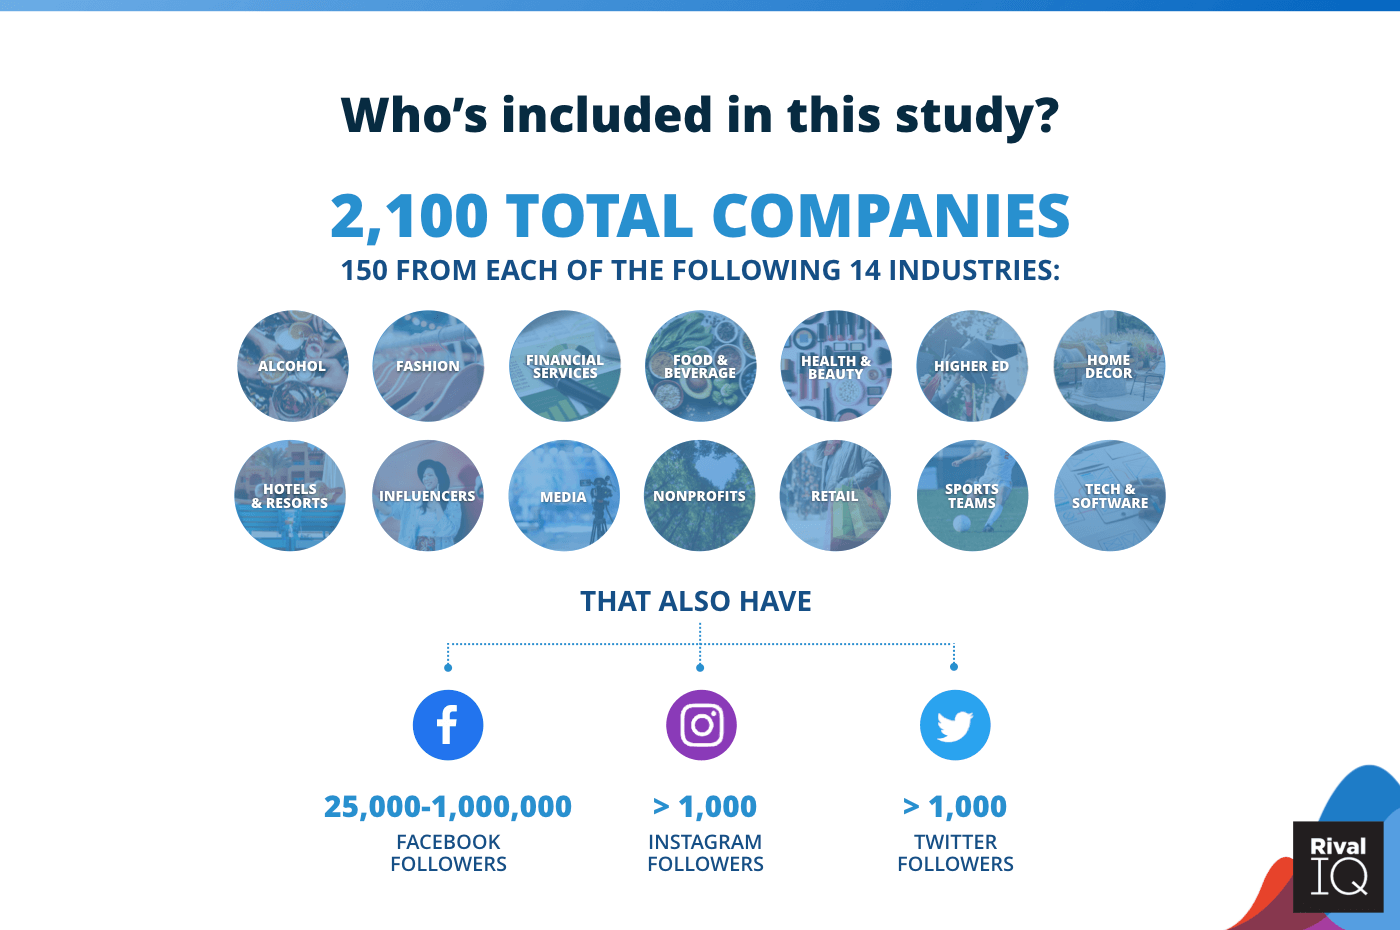
The makeup of the 2020 Social Media Industry Benchmark Report
We used median performance from the companies selected for each industry to compile the data for this report.
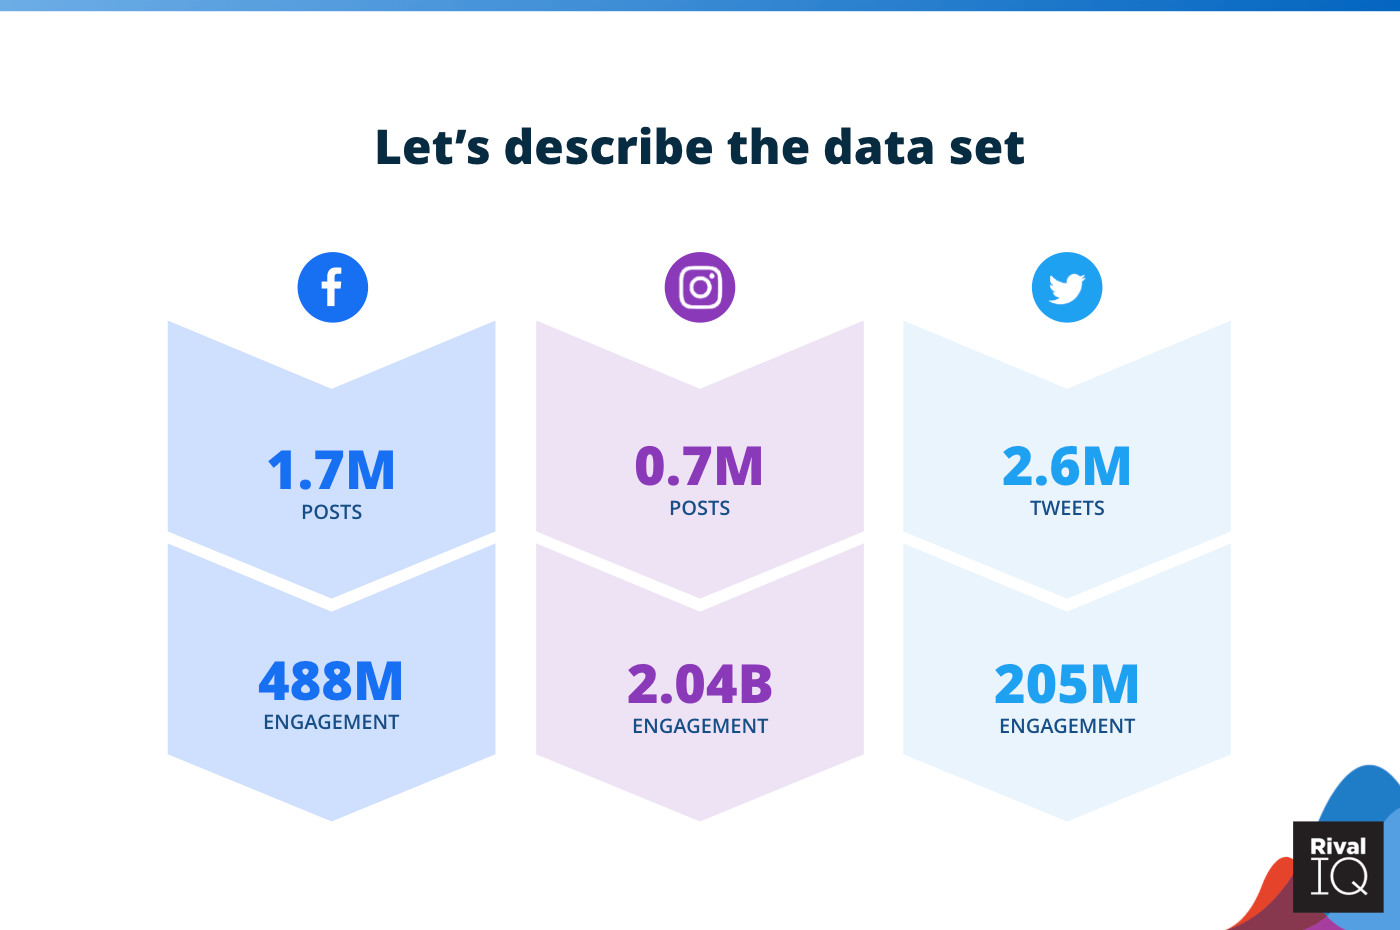
Post and engagement counts for Facebook, Instagram, and Twitter
Why do we benchmark?

Social media success is about so much more than getting the most comments or likes: it’s about increasing engagement while also growing or maintaining the percentage of your audience that engages as you expand your audience.
We focus this study on engagement rate instead of “vanity metrics” like follower counts because we know savvy social marketers want to know how they’re doing in relation to their competitors. Why? Because benchmarks are relative.
Why can’t you gauge success on likes alone? Because audience size is hugely important: 1,000 likes makes a huge difference to a brand with 2,000 followers, but is a drop in the bucket to a brand with 100,000 followers.
The metrics that matter
To us, engagement rate per post is the metric because it controls for post volume and audience size, and because this metric is relied on across the marketing world as the one to beat. With that core metric in mind, we include a detailed look at each industry’s engagement rate alongside posting frequency, post media types, hashtags, and so much more for a true sense of social performance.
Here are a few of the other social metrics covered in this study:
- Posts per day
- Posts per week
- Engagement rate
- Top hashtags by engagement rate on Instagram and Twitter
In addition to our social media industry breakdowns, we also compare all the industries together so you can see how things shake out across the board.
Quick note: the truest measure of your social content’s resonance would be engagement divided by unique reach (the count of unique people who saw your content) or impressions (the number of times your content was displayed). Unfortunately, due to Facebook, Instagram, and Twitter API restrictions, we aren’t able to include this particular stat.
Live Social Media Benchmarks
Ready to compare your social media performance live? Check out our Live Benchmark landscapes, where we feature live social media metrics from a sample of companies from each industry represented in this study. These landscapes feature hashtag performance, top post types, and so much more on Facebook, Instagram, and Twitter.
Live Social Media Benchmarks
Or, run a free Head-to-Head report against your biggest rival to see how you measure up to both your competition and against industry benchmarks represented in this study.
Free Head-to-Head Reports for Twitter, Instagram, and Facebook
(Oh, and if you’re a Rival IQ customer or in a trial, you can add those stats directly into your Rival IQ account for even more comparisons.)
Wrapping It Up
Whew! We made it to the end of another year of social media benchmarking. Here are a few high-level ideas to keep in mind as you plan your social strategy in 2020 and beyond:
Instagram still reigns supreme. While this channel’s engagement dipped for the first time, its engagement rates are still exponentially higher than Facebook and Twitter. Pay attention to industries like Higher Ed and Sports Teams to see how it’s done. To get ahead of this engagement decline, focus on carousels and tried-and-true engagement strategies like contests, and get your posting frequency up here. And don’t forget about Instagram Stories.
Steady engagement isn’t bad. In a world of algorithms and news cycles competing for attention, the fact that Facebook and Twitter were able to hold steady is a good thing. Strategic posting on these channels is key–poor Media brings up the caboose year over year because their constant posting dilutes their staying power on social.
If you’re not posting video, it’s time to start. Video dominated on all three channels across almost all our industries, so it’s time for brands to focus more on video. Remember: video doesn’t have to be slick or expensive to make a splash on social, so start experimenting.
Did we miss an industry or a channel you’d like to see in next year’s report? How did you measure up to your industry’s benchmarks? Let us know on Twitter!
