Welcome to our biggest and best Instagram Stories Benchmark Report yet!
We’ve updated all your favorite metrics like retention rate, exit rate, replies, and so much more. We’ve also taken posts and Stories head to head so you can see exactly how your engagement measures up on these very different media types, and threw in some Reels data for good measure.
We included more handles, Stories, and frames than ever for a complete look at Instagram Stories to help your 2023 Stories planning.
Download the free PDF and follow along with all the greatest Instagram Stories hits.

Key Instagram Stories Takeaways
Story frequency is pretty flat this year
For the first time in our reporting history, brands posted about as many Stories as in 2021. Flat isn’t bad, but it’s not growth either.
Reach Rate continues to fall
Your Stories (and posts!) are reaching a smaller percentage of your followers compared to last year. Stories are competing with Instagram posts as well as YouTube and TikTok for eyeballs.
Retention Rates are flat
Higher tap-back rates helped boost retention, but flat reply rates and increased exit rates balanced those successes to keep this critical metric flat for brands across the board.
Posts reach more than Stories
Instagram posts continue to see a much higher reach rate than Stories. Hook viewers with posts and deepen their engagement with Stories.
Days with an Instagram Story
Are more Stories better than fewer? The best answer to this age-old question starts with benchmarking how often the average brand publishes a Story in a month.
A quick note on how to read these graphics: we’ve included median performance as well as metrics from the top and bottom 25% of brands so you can understand the full range for the Instagram Stories metrics that matter.
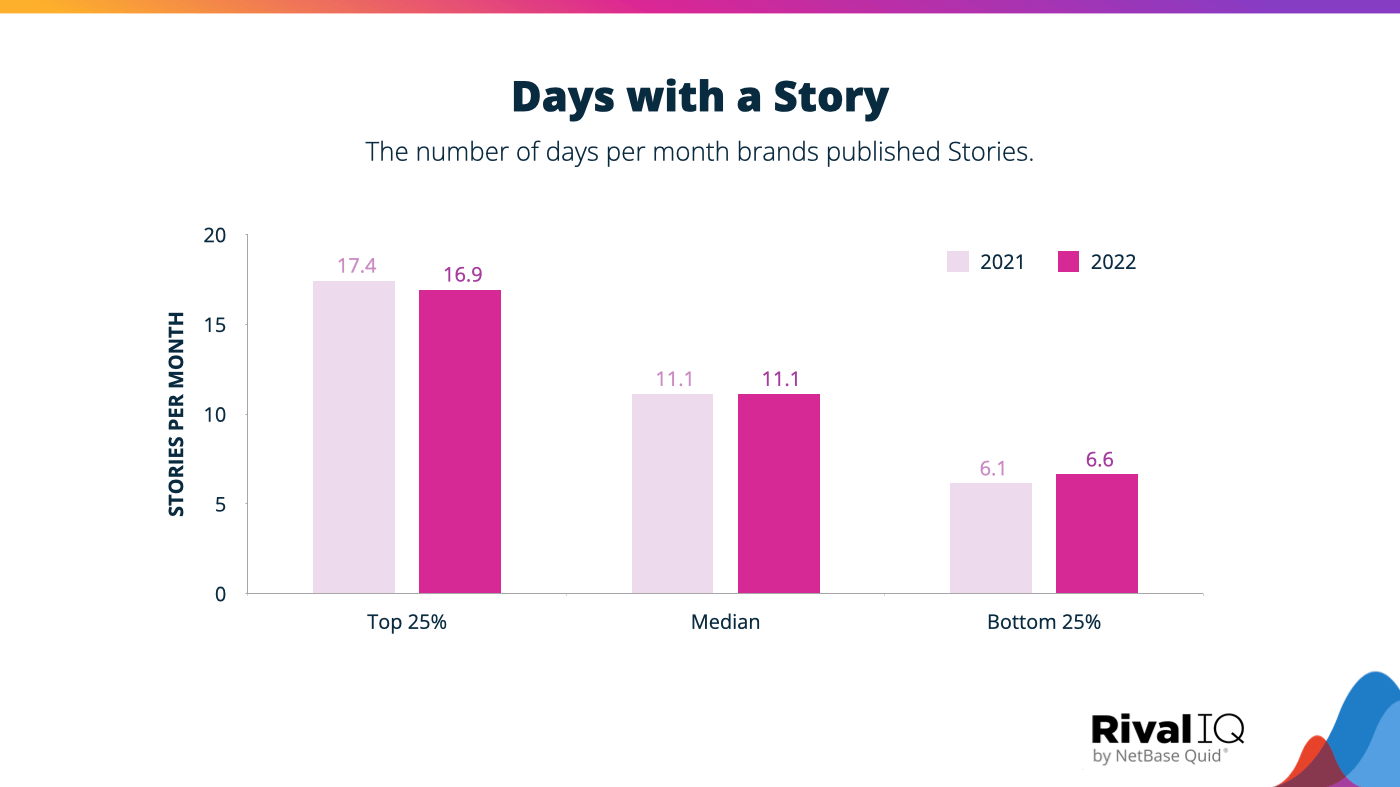
Story frequency is pretty flat, with the average brand posting an Instagram Story 11 times per month.
- The top 25% most active brands publish Stories about 17 times a month—roughly every other day.
- The least active 25% of brands publish just over 1 Story per week.
Story posting per month hasn’t changed much over the last few years: everyone is posting about as often as last year. This consistency means the majority of brands still post Stories just over twice per week.
Frames Per Day
Let’s talk Stories terminology: in our book, Stories represent a 24-hour period, while frames per day denote the number of individual photos or videos posted within a Story. Finding the “right” number of frames per day for your brand is just as important as figuring out how many Stories you should be posting in a given time period.
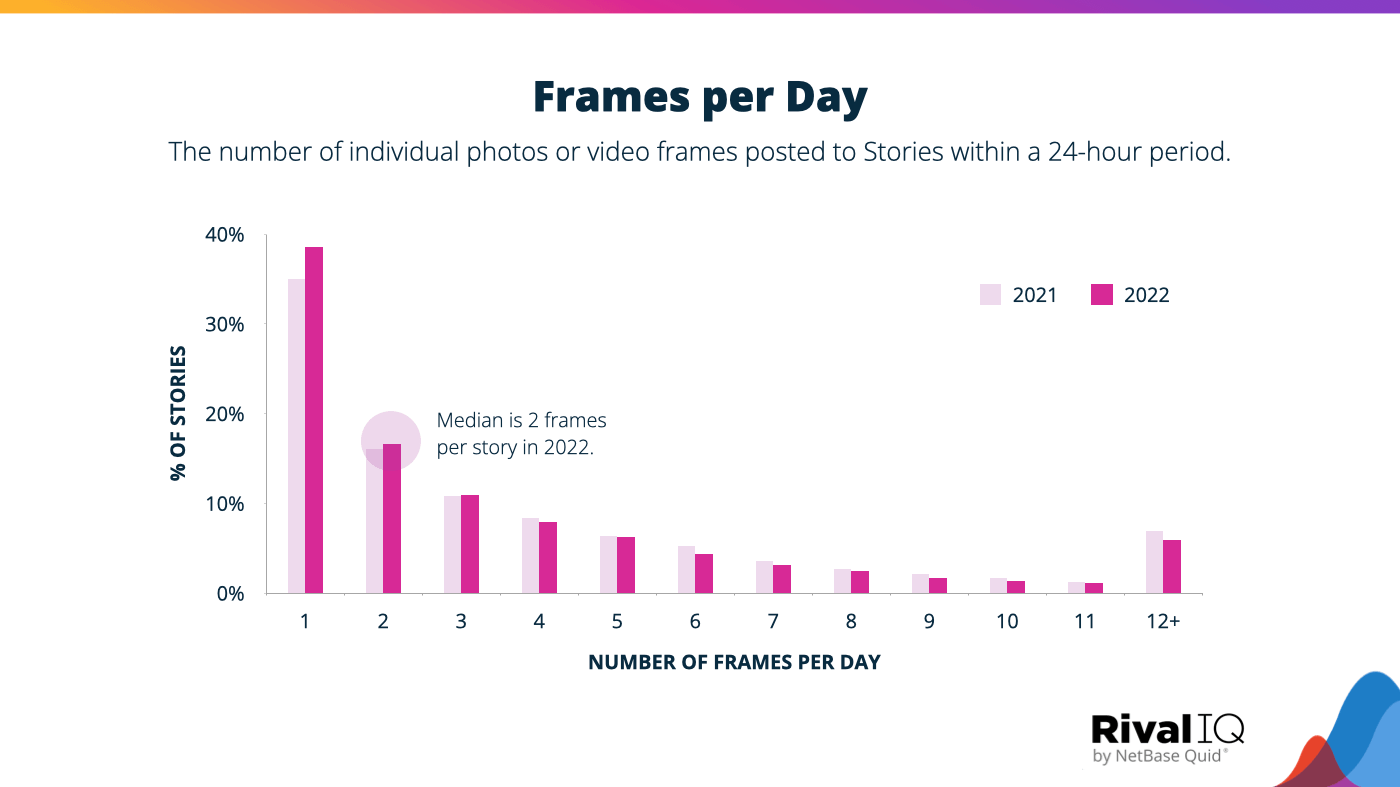
As you can see on the graph above, Stories with just a few frames are more common than Stories with more frames.
- About 40% of Story activity comprises days with only one frame.
- 1-3 frames account for about 65% of brand activity.
- About 15% of Stories have 7 or more frames.
More brands are using Stories in their marketing, but they’re not posting significantly higher frame counts. Finding your own brand’s average number of frames per day and factors that increase your retention rate can help fine-tune your frame frequency strategy.
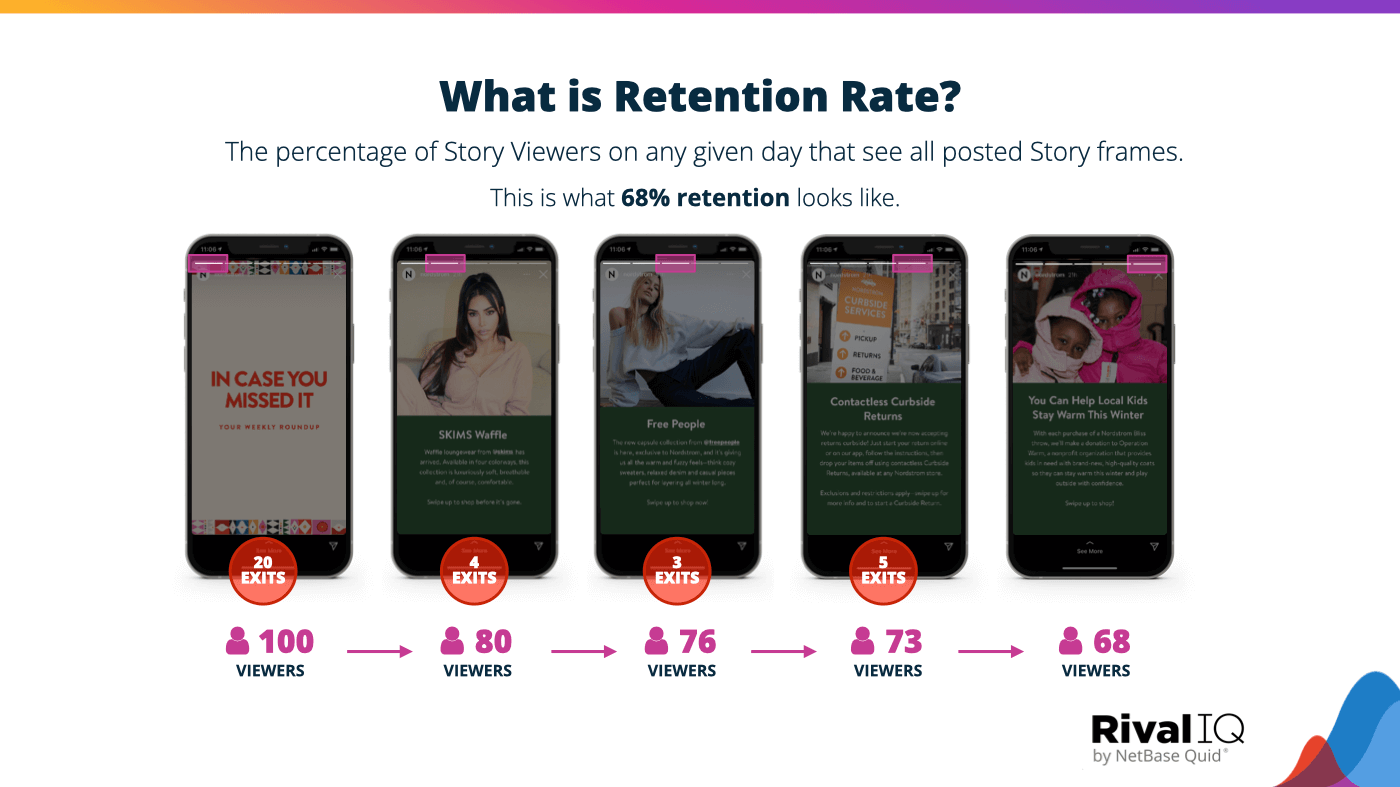
Retention Rate
Retention rate by frame is one of the most important metrics for understanding how your Instagram Stories are landing with your audience. Why? Sticking around for your frames means you’ve grabbed attention and created a fan, instead of just a follower flitting through. This metric represents the percentage of viewers that have stuck around through any given frame of a Story.
- The more frames you publish, the lower your retention rate.
- Average retention rate was pretty flat this year.
- As always, the biggest dip is from 1 to 2 frames a day as users swipe past the Story.
- After that big initial drop-off, the retention decline slows down and stays above 75% through 6 frames per day.
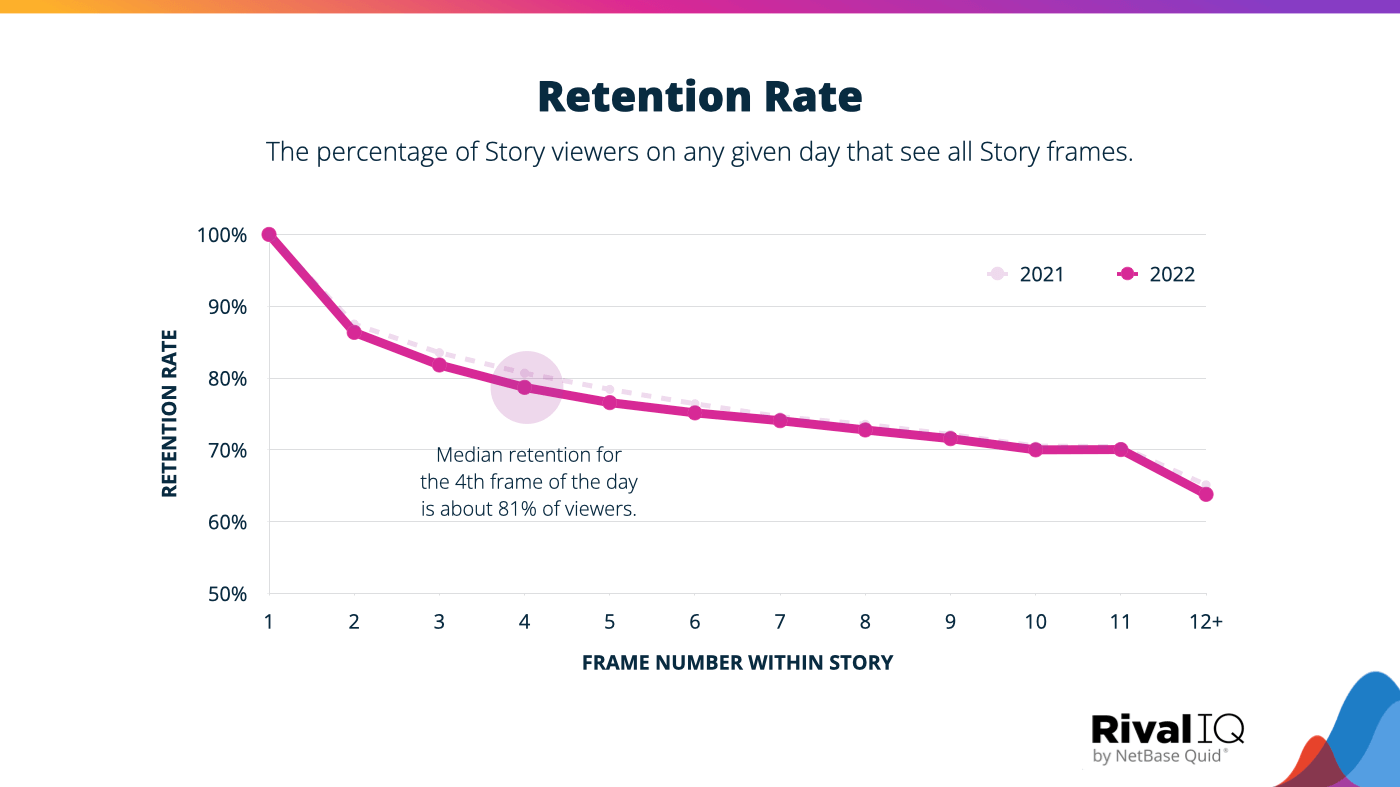
This metric is one of the truest ways to measure the strength and resonance of your content: retention isn’t influenced by Instagram’s algorithm or in competition with another brand. It’s just your content, your viewer, and whether or not you can keep them tapping forward instead of exiting and moving on to the next Story. Focus on a first frame that hooks viewers, and then don’t be afraid to say everything you need to say: retention drops but doesn’t flatline with more frames.
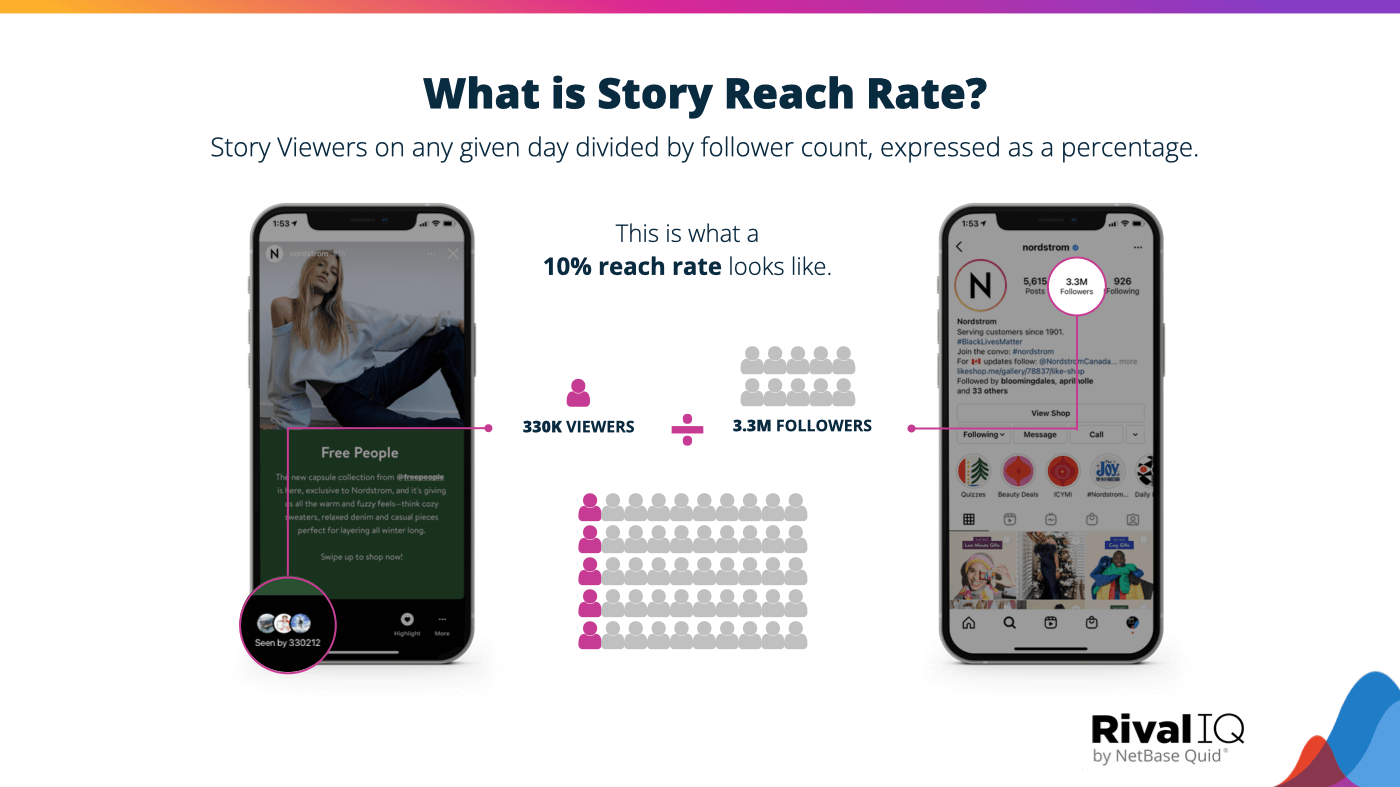
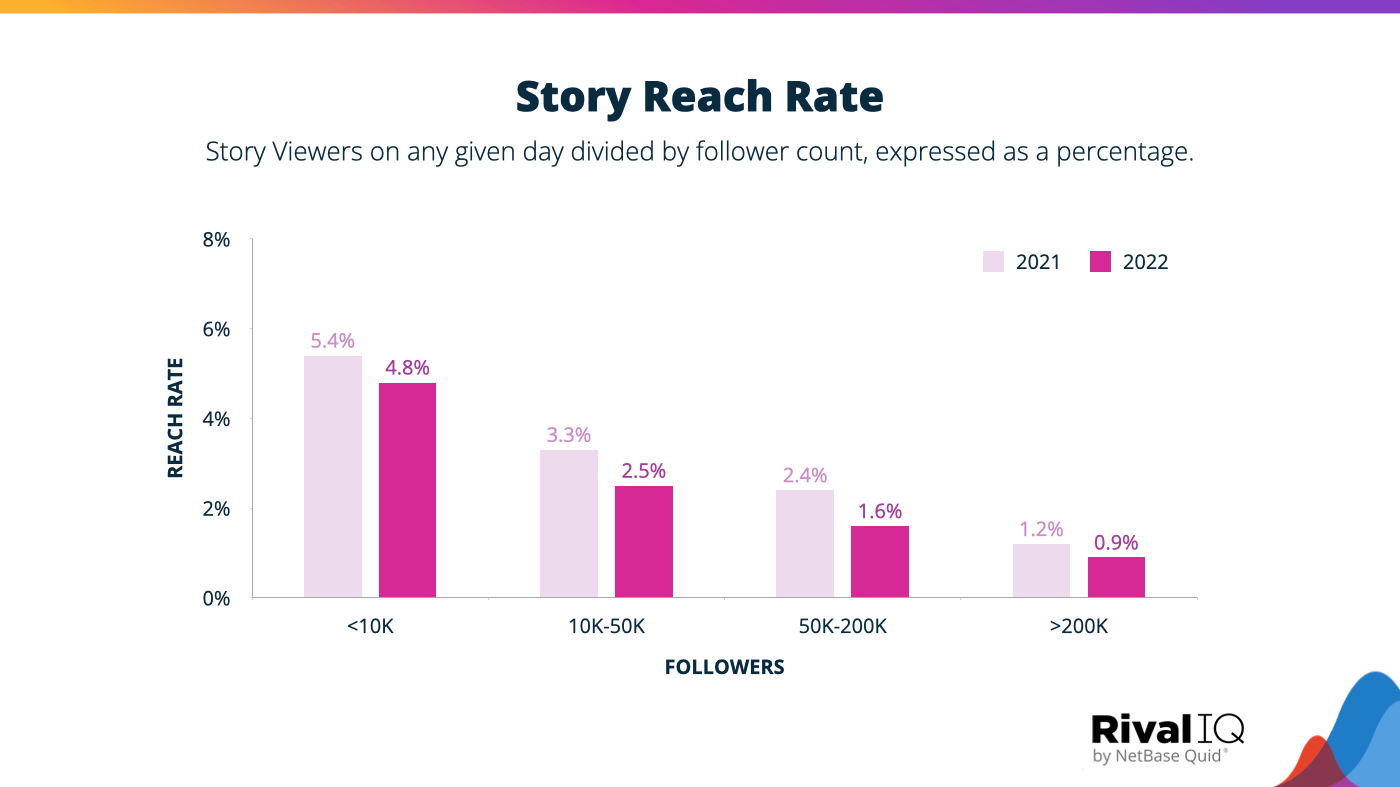
Story Reach Rate
Story reach rate represents the percentage of your followers who are actually seeing your Stories. These reach rates are on the decline year over year, but don’t get discouraged—Stories are still an effective tool for many brands.
Brands saw reach rates decline in 2022 no matter their follower count.
- Mid-size brands between 50K-200K followers endured the biggest reach declines this year.
- Smaller brands with under 10K followers lost the least this year but still saw declines.
With more creators making Stories and competition from channels like YouTube and TikTok, there’s more competition for every pair of eyeballs that comes across your Story. If you made one change to increase your reach rate, it’s focusing your efforts on creating eye-catching and engaging first frames.
Another tool in your reach toolkit? Story Highlights pin your favorite frames to your profile page and help viewers discover your content long after its 24-hour expiration date in Stories.
Interactive sticker elements like links, shoppable posts, questions, and quizzes can also increase reach.
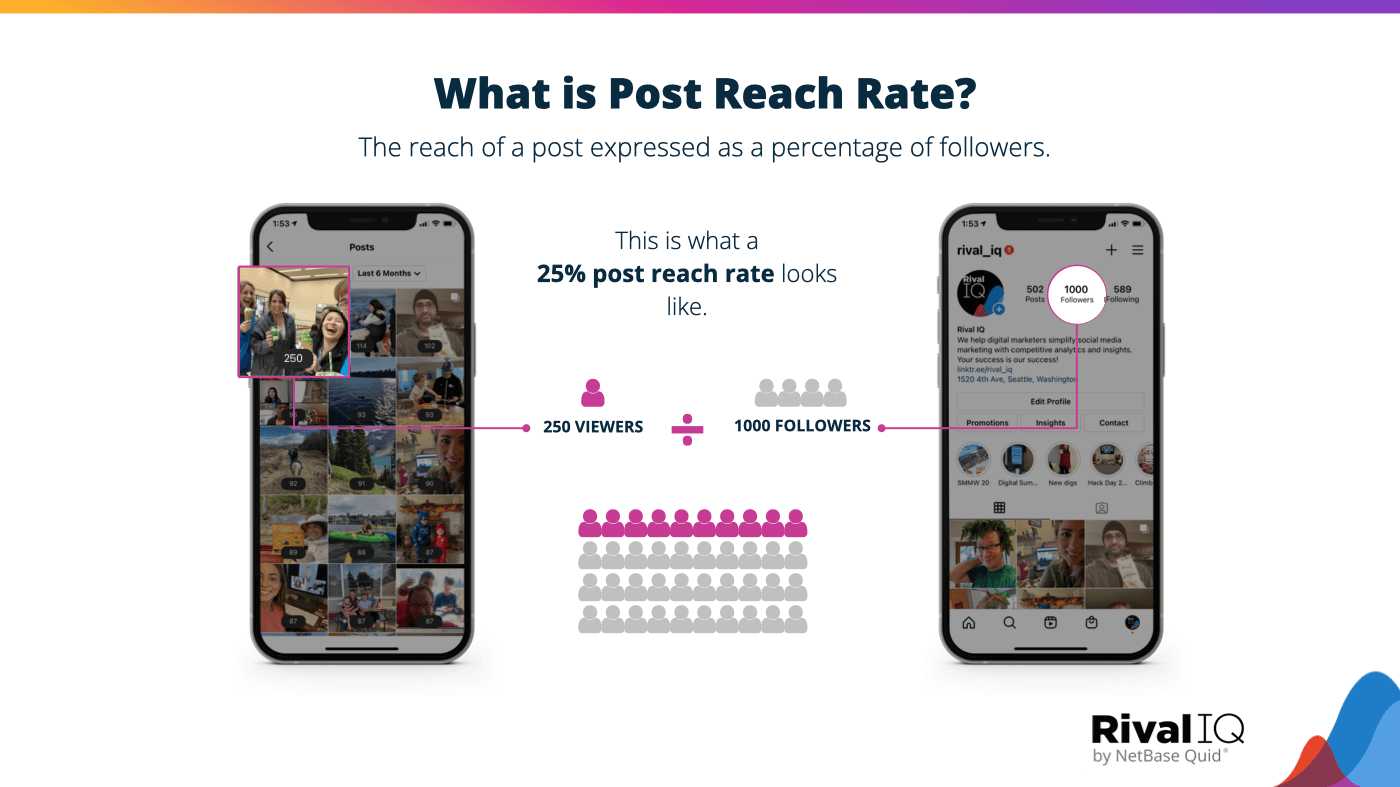
Post Reach Rate
Post reach rate, which is the percentage of your followers that saw one of your posts, declined again this year.
Handles with more than 200K followers saw the sharpest post reach rate declines in 2022. As usual, the larger your follower count, the smaller your reach rate.
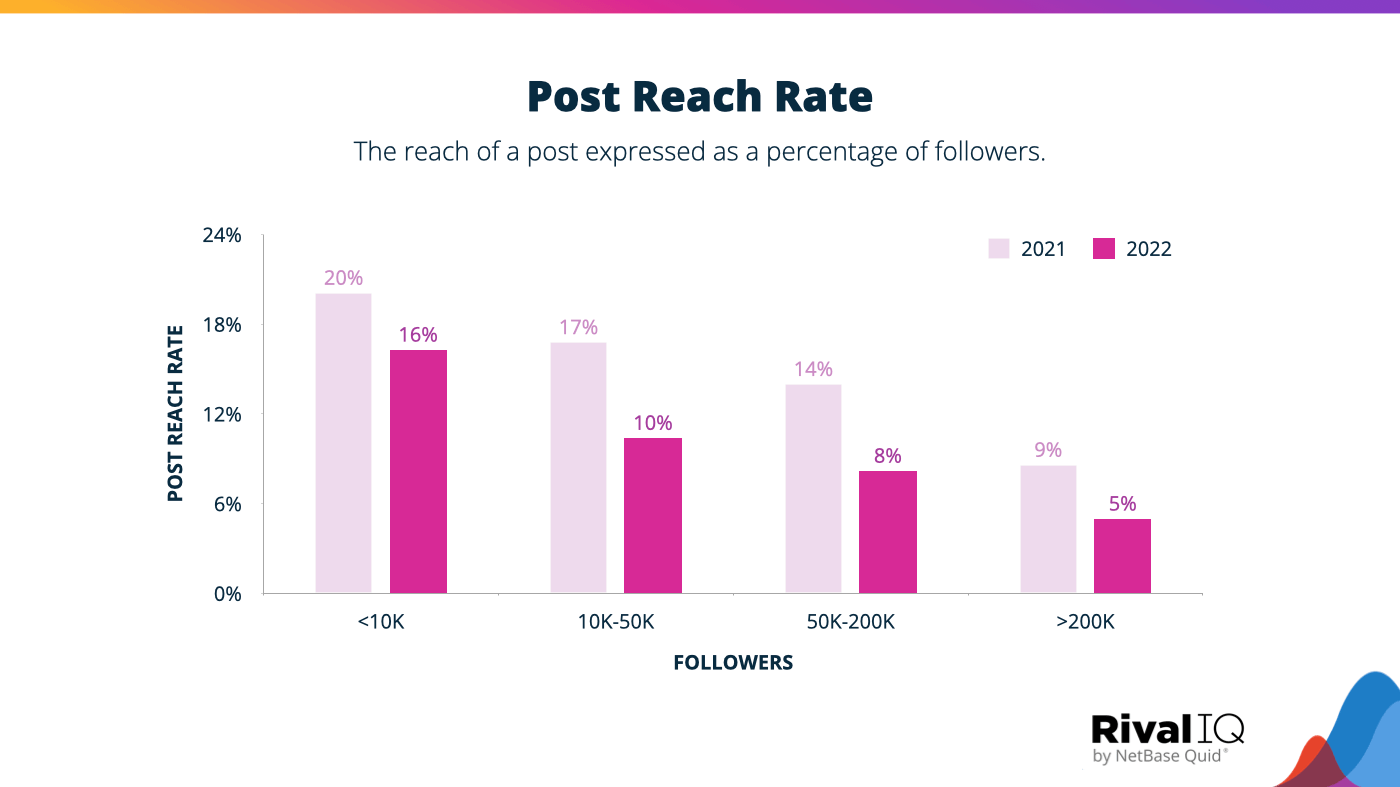
Post reach rate has declined every year we’ve studied it as Instagram adds more ways for users to consume content (like Lives and Reels) and therefore further divides attention.
Post Reach Rate by Media Type
This metric helps brands understand the reach of a post expressed as a percentage of followers by media type, AKA carousel, image, video, or Reel.
- Brands saw their post reach rates decline for every media type in 2022.
- Images were hit especially hard with a 40% decline in reach rate.
- Video posts saw the smallest declines in reach this year but still suffered.
- Even Reels saw a decreased reach rate by about 25% this year.
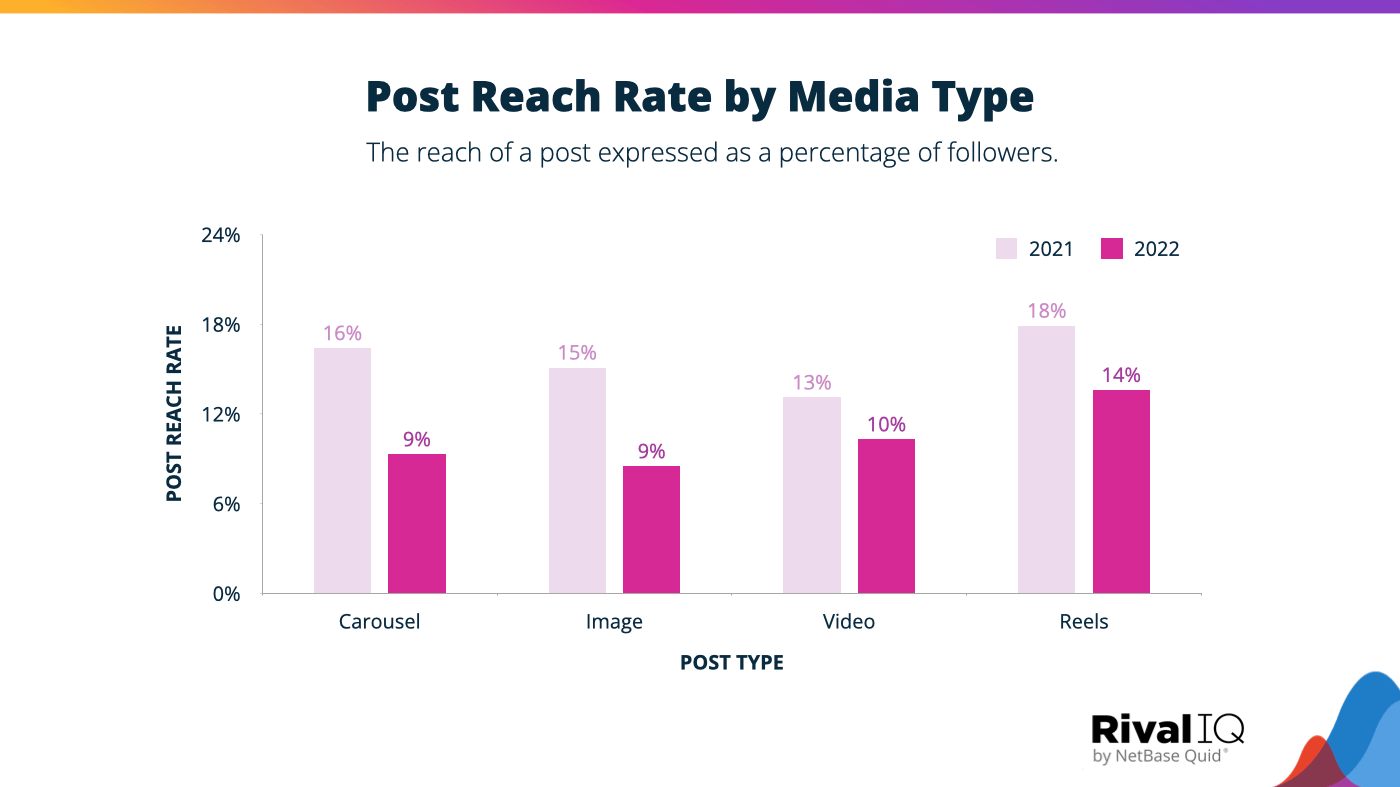
Instagram is working hard to incentivize more video content to compete with YouTube and TikTok, so this is a good area to invest in in 2023 to engage both followers and the algorithm.
Reach Rate: Instagram Stories vs. Posts
Anyone who manages an Instagram account will tell you Stories earn reach that’s dramatically different from posts, so let’s compare the two side by side.
Small brands with follower counts up to 10K can expect around 4x more of their followers to see their posts than their Stories, with brands with larger follower counts seeing a disparity between the two at 5x or larger.
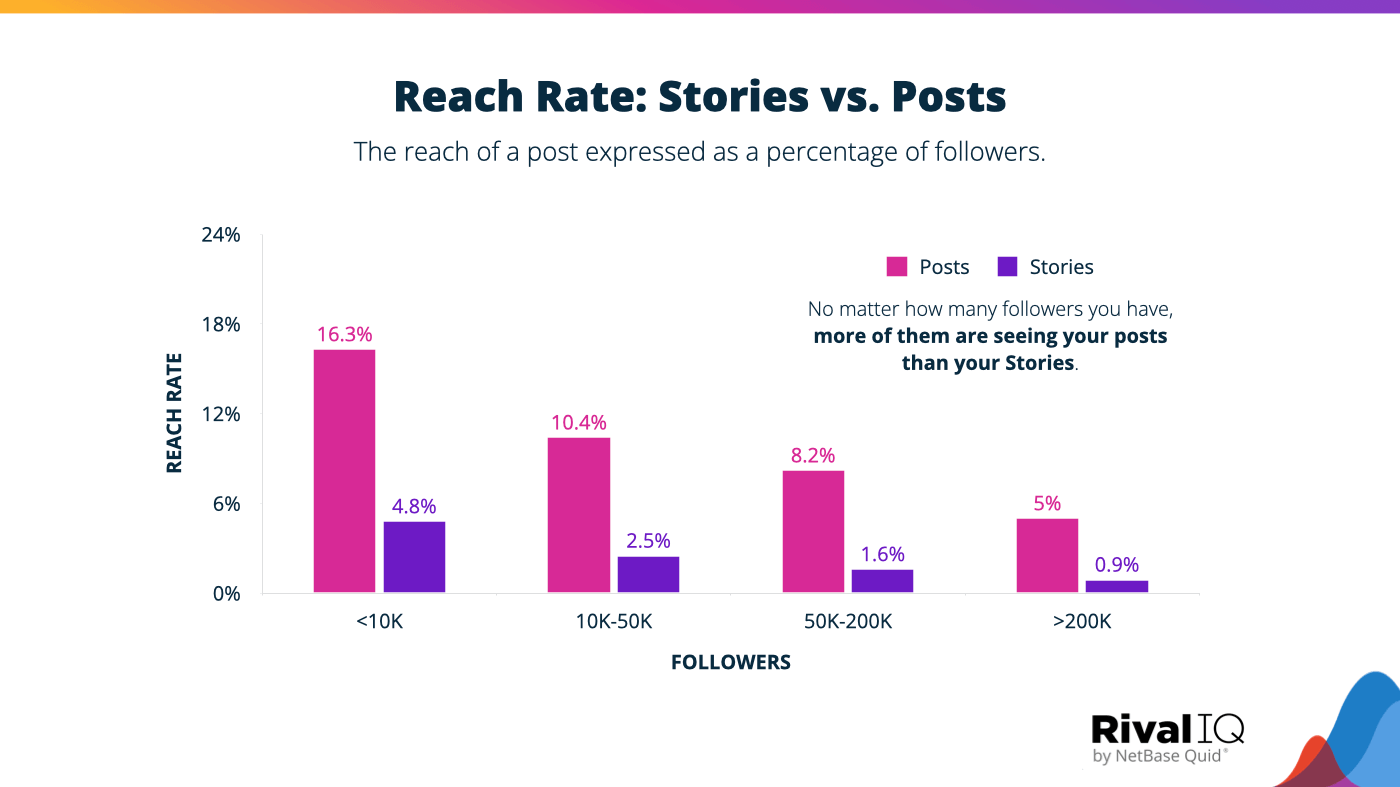
Stories continue to have a lower reach rate than posts for brands, but does that mean your brand should stop creating Stories? The short answer is no: Story impressions can be a great tool for engaging with followers and developing relationships over time.
Posts and Stories engage your followers differently and should be treated as two different tools in a marketer’s toolbox. Posts are great for a quick scroll, but if you hook viewers, Stories can really draw your audience in and keep them engaged.
By the way, if you’re wondering if there’s a right time to post on Instagram or an ideal posting frequency, we’ve got you covered.
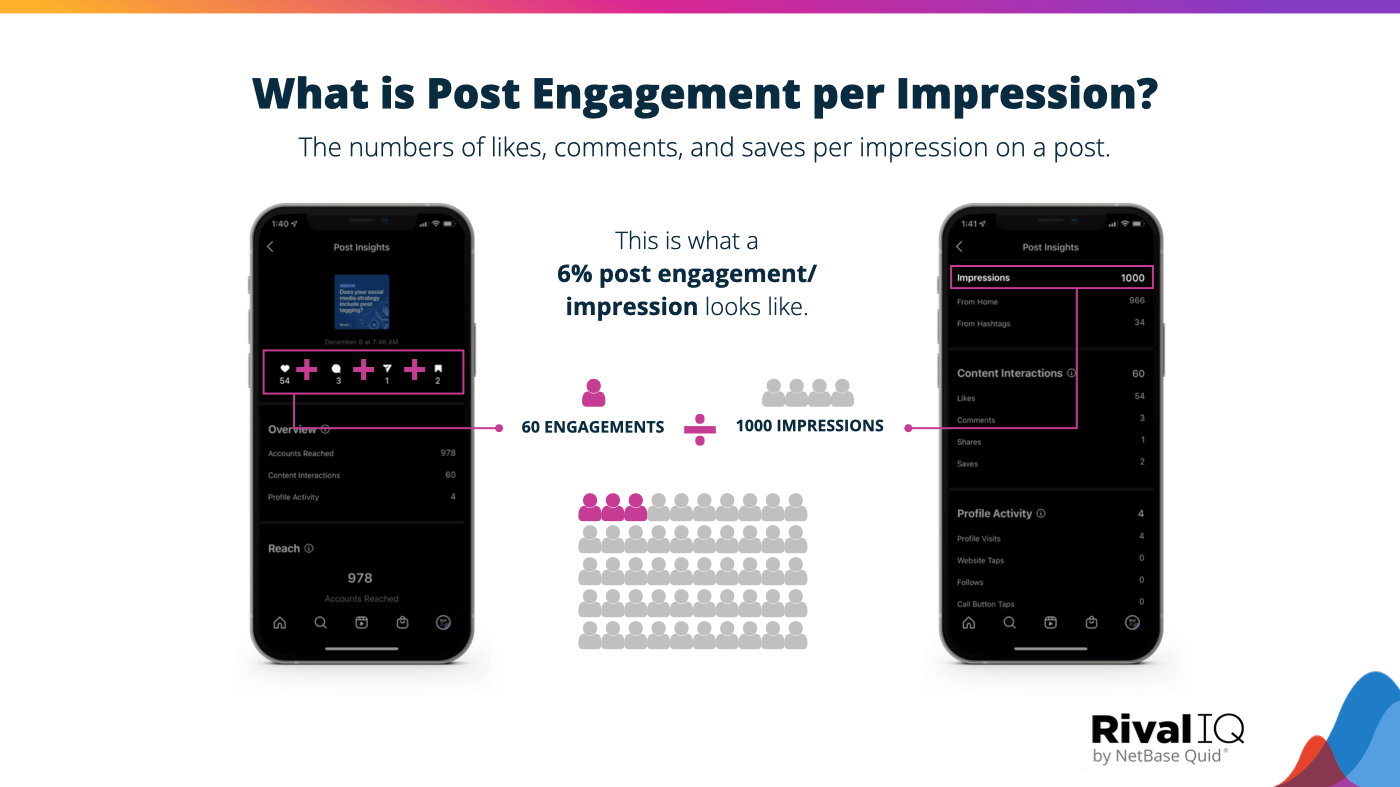
Post Engagement per Impression
This metric represents the number of likes, comments, and saves per impression on a post.
Selecting the right denominator in your social media metrics really matters: defining engagement rate as engagements divided by followers will give you a different number than engagements divided by impressions. Whatever your preference, we’ve got you covered with this metric.
It’s worth noting that Post Engagement per Impression is usually available only for brands whose handles you manage–it’s hard to find this metric competitively (unless you’re a Rival IQ Engage Pro customer, because we’ve got estimated impressions right in our app).
Post engagements per impression declined regardless of follower counts this year.
- Mid-sized handles with between 50K-200K followers retained post engagement per impression best this year.
- The smallest and largest brands fared worse, with handles in both groups seeing about a 25% drop.
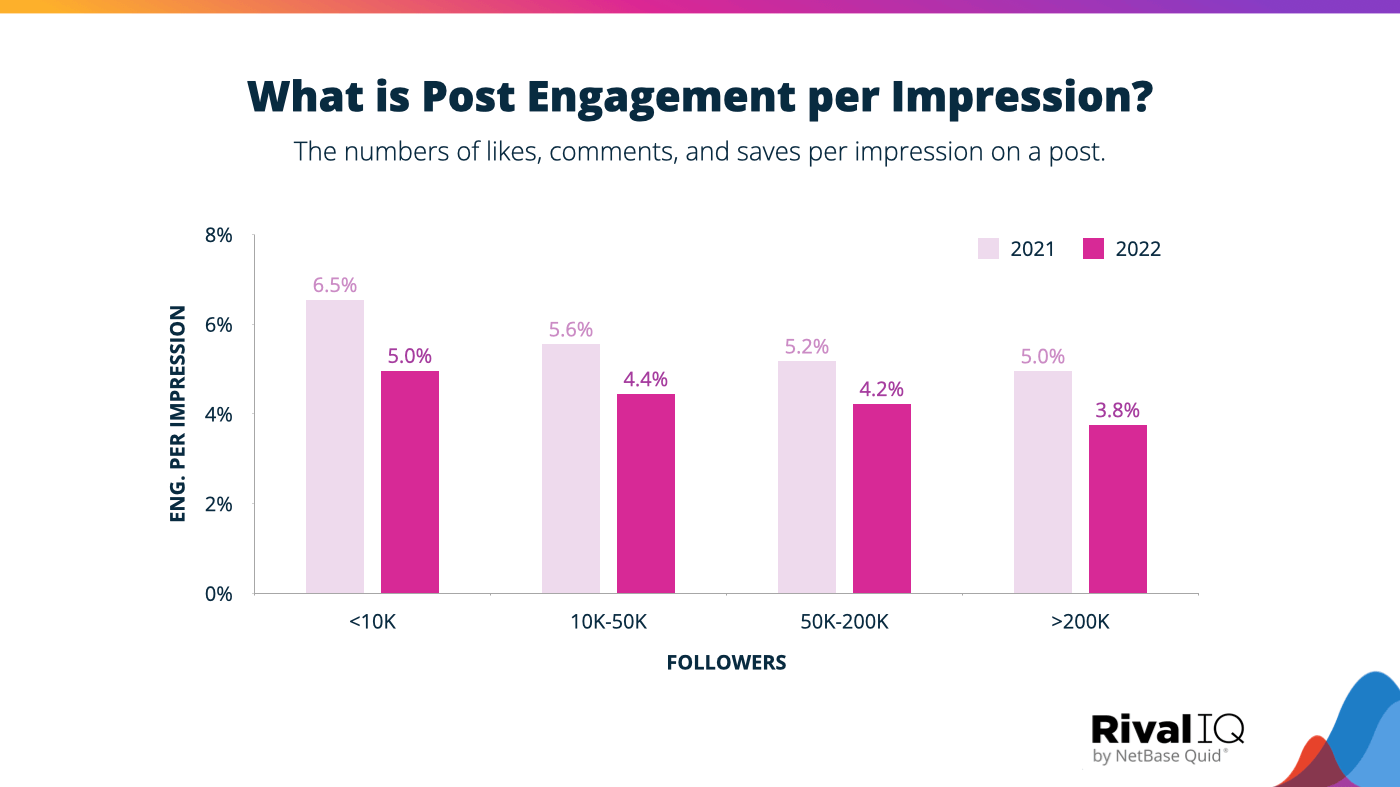
These drops in post engagement rate per impression are part of a larger trend of decreased engagement on Instagram as the platform battles for attention in the era of YouTube and TikTok.
Post Engagement per Impression by Media Type
Post Engagement per Impression gets even more interesting when you break it down by Instagram post type.
- Post engagement per impression decreased across every media type in 2022.
- Video posts saw post engagement per impression drop by more than 20%.
- Reels fared better than other post types, losing just 5% engagement per impression from 2021.
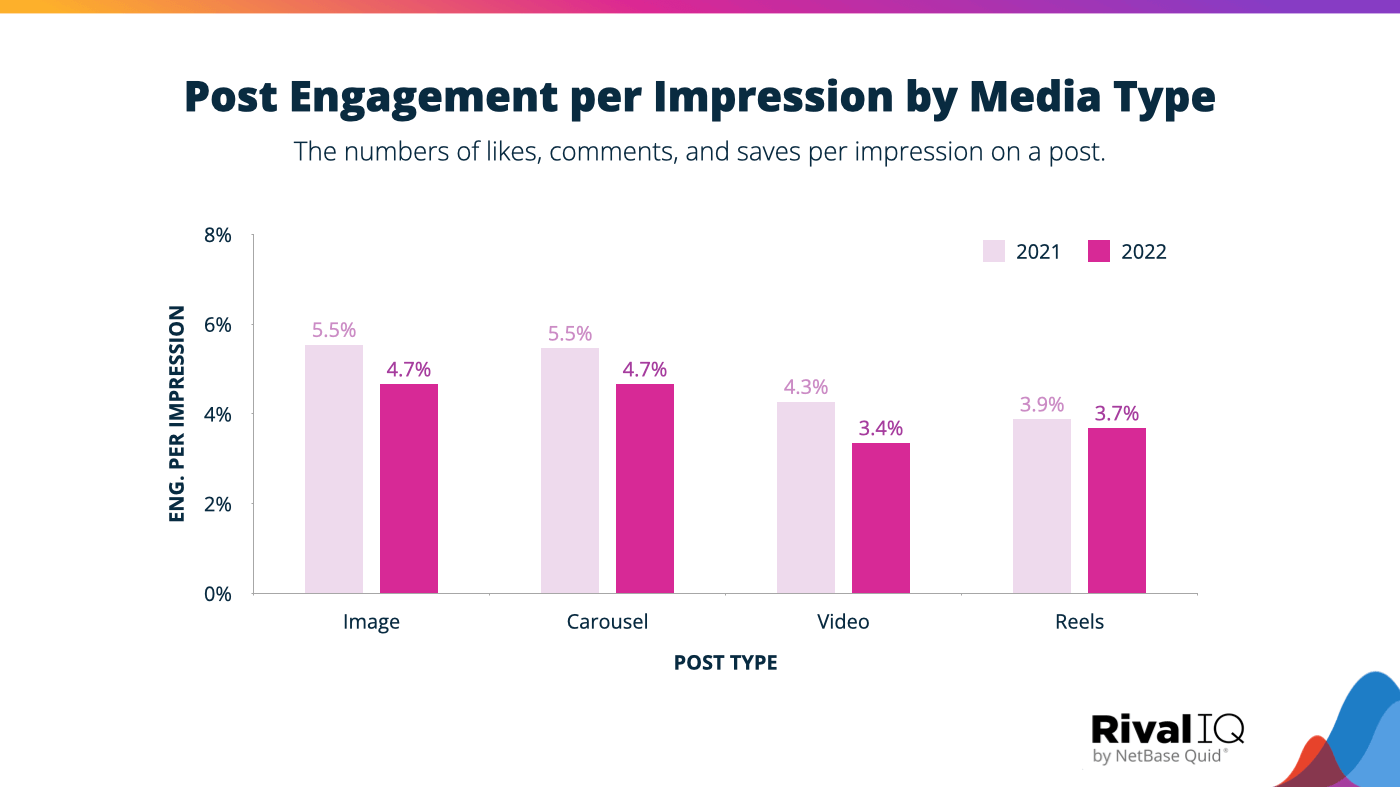
For those keeping score at home, static post types like images and carousels are still outpacing videos and Reels despite Instagram’s big investments in video this year.
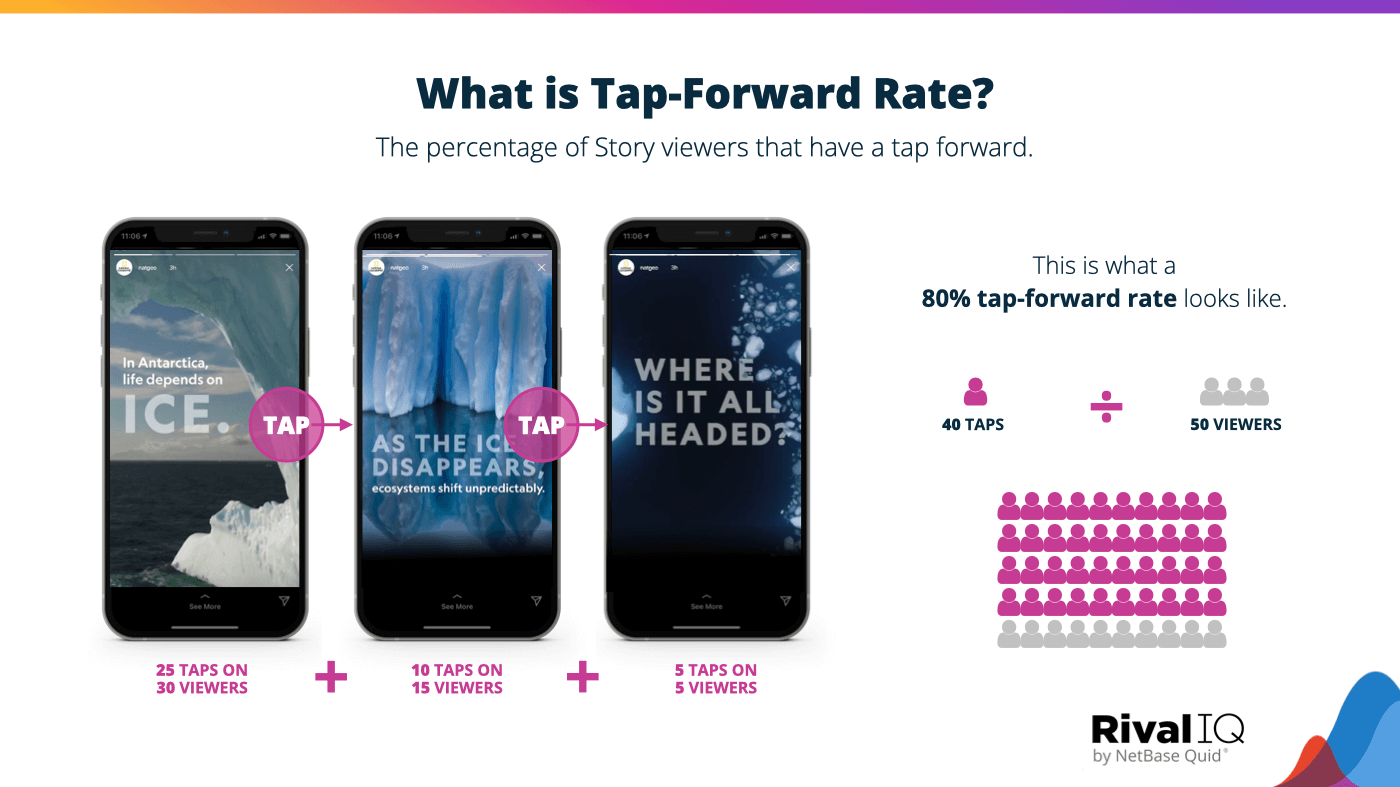
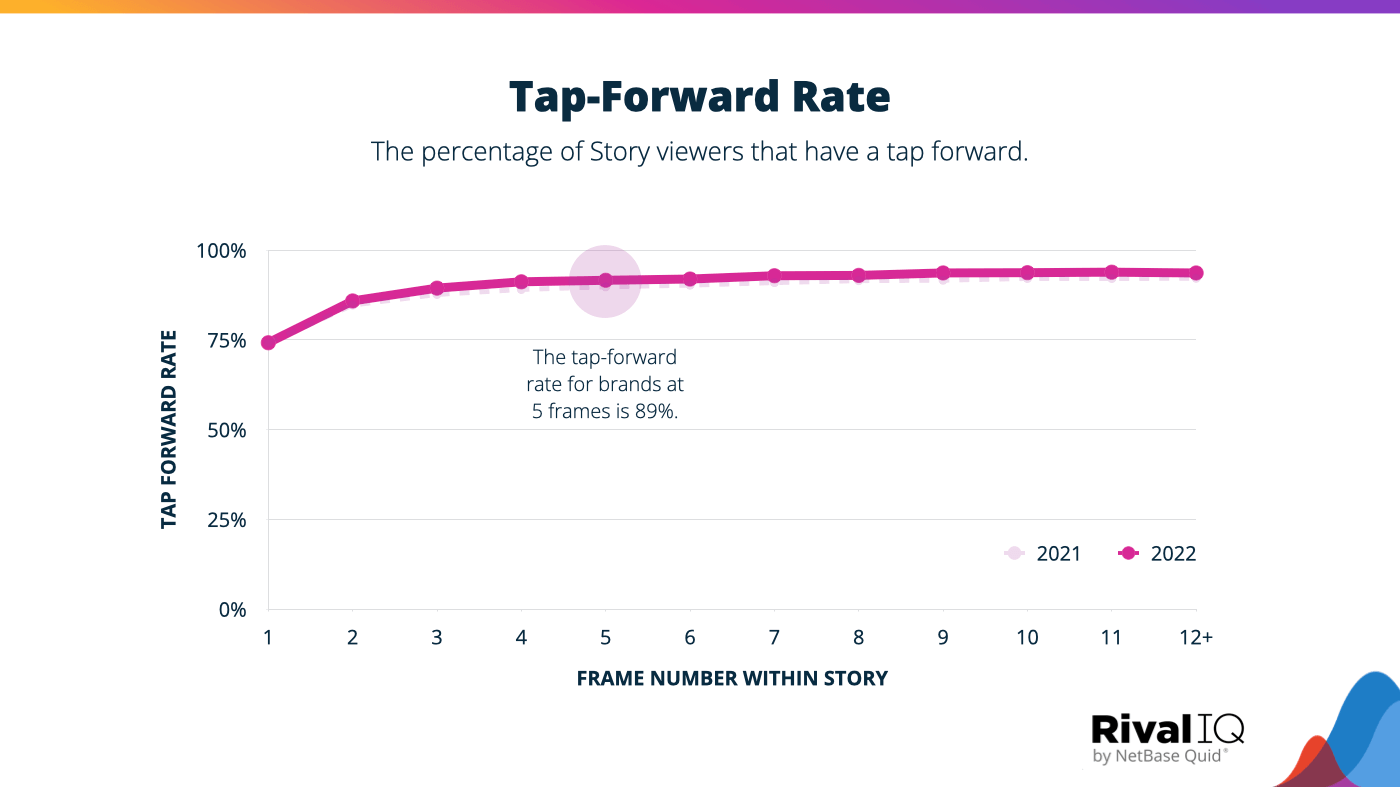
Tap-Forward Rate
Tap-Forward Rate measures the percentage of your Story impressions that have a tap forward. It’s an interesting Stories metric because it can indicate both positive and negative attention: either the viewer has had enough of your content, or can’t wait another second to hit the next frame.
The more frames in your Story, the more likely it is that followers will tap forward. A few other key tap-forward stats:
- The median tap-forward rate at 5 frames per day is nearly 90%.
- Tap-forward rates stayed flat this year, suggesting attention spans haven’t decreased too much.
- If your Story contains more than 4 frames, more than 90% of your viewers are tapping forward to advance to the next frame.
Tapping forward isn’t necessarily a bad thing, but it does indicate that the viewer has either seen enough of the content or wasn’t interested in the first place. Keep your frames engaging and experiment with video to maintain your viewers throughout the entire Story.
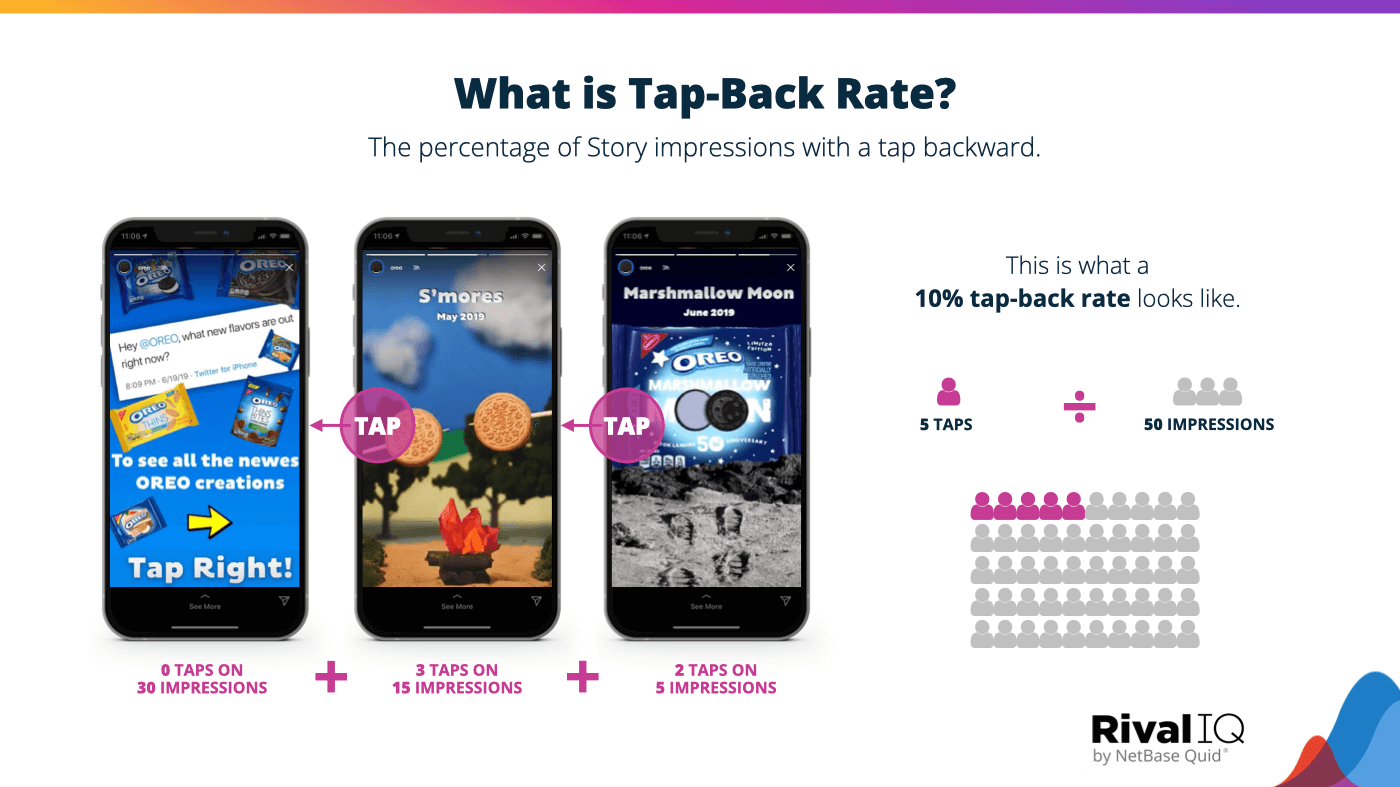
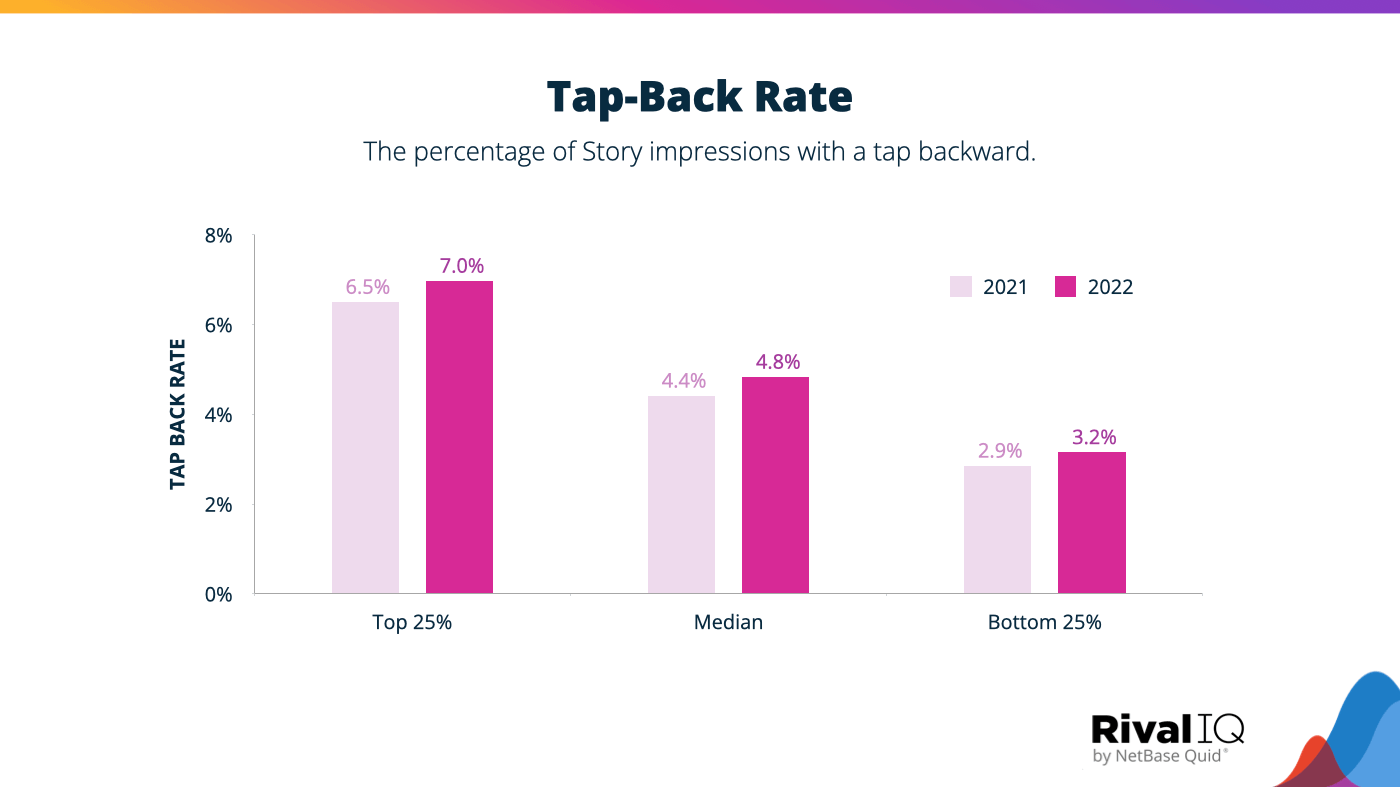
Tap-Back Rate
Taps back indicate that a viewer wanted a closer look or to re-engage with a brand’s content, AKA every marketer’s dream. This rate represents the percentage of Story impressions with a tap back.
This year’s tap-back rate increased across the board, which is always good news. Stronger tap-back rates indicate that brands are creating content that’s just a little stickier and more engaging than last year.
- The median tap-back rate is 4.8%, but the top 25% of brands see tap-back rates closer to 7%.
- Taps back are a great indication of content that your followers want to consume more of.
When reviewing your Instagram Story performance this year, take a look at the Stories or frames that received the most taps back. Were they videos? Did they have a lot of text in them? Be sure to replicate those strategies or other Instagram Story best practices in your content planning.
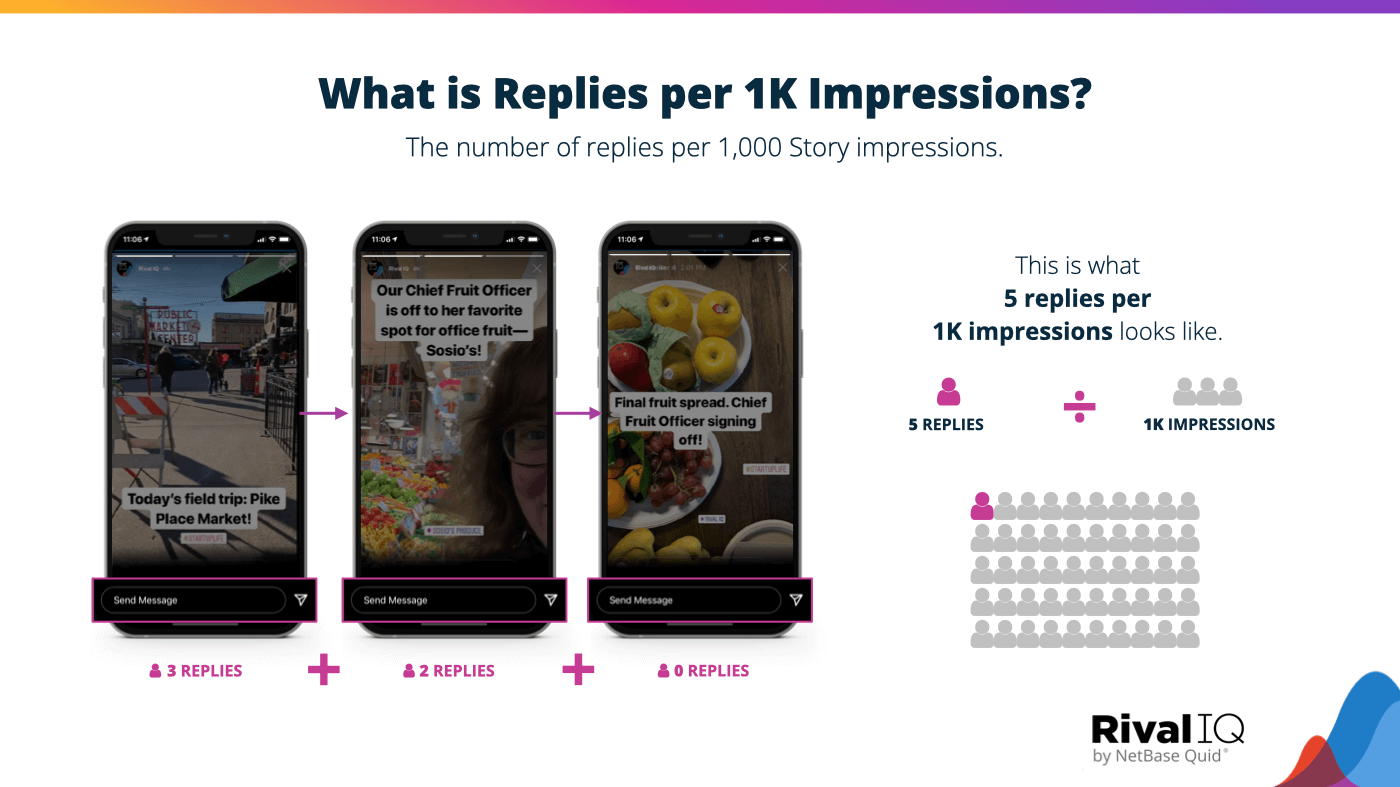
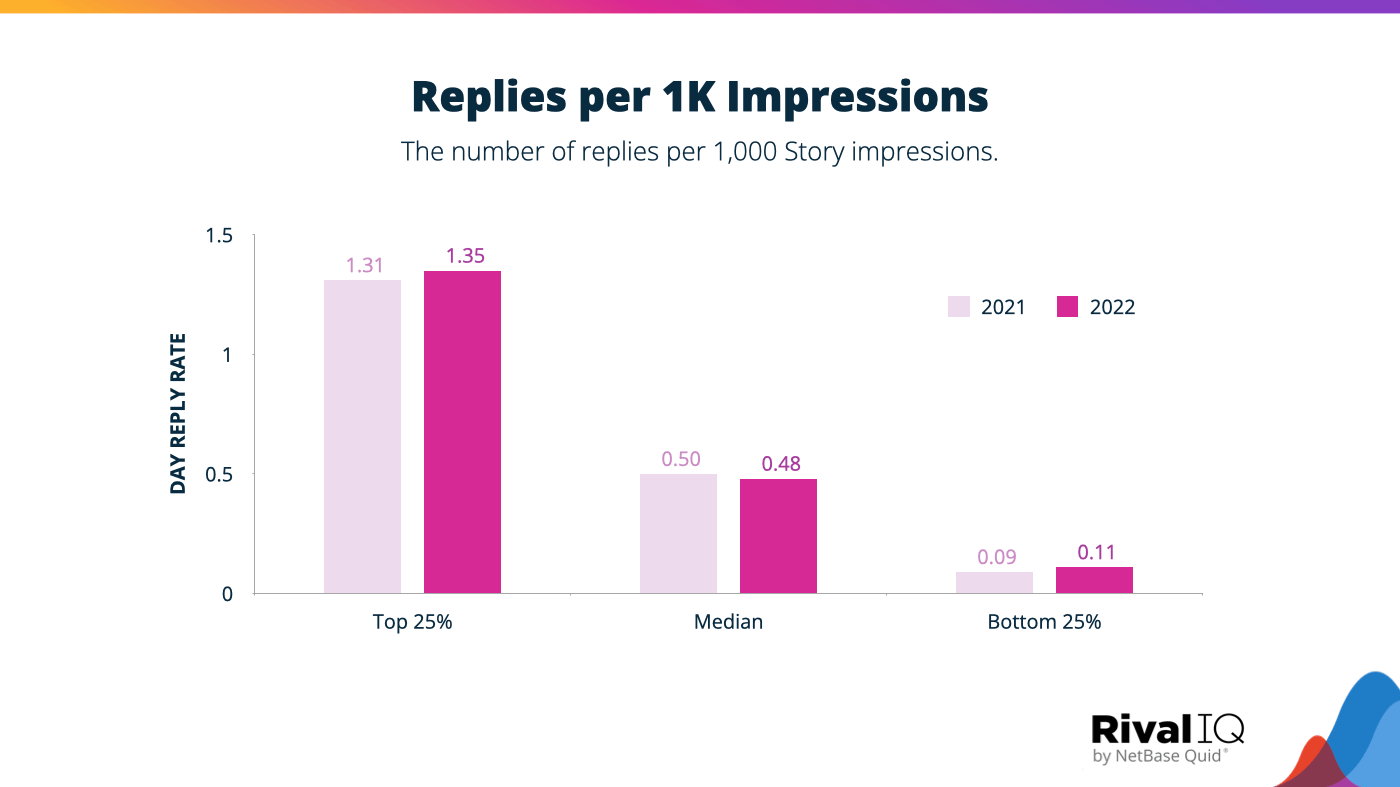
Replies per 1K Impressions
Replies aren’t the easiest engagement to earn in Instagram Stories, but they indicate serious engagement from a fan or follower. Replies per 1K impressions expresses the number of replies per 1K impressions as a percentage.
Replies per 1K Impressions increased for most brands in 2022.
- Median reply rates were pretty flat this year–people have about as much to say to brands as they did last year.
- These reply rates are tiny because users mostly don’t reply—particularly in the bottom 25%, which has a teeny average reply rate close to 0%.
The best way to score an elusive reply is to ask for one by asking a question. Unfortunately, Instagram’s API continues to limit data from in-frame engagement stickers like polls and quizzes, so it’s tough to measure the impacts of these interactive elements on your engagement and reply rates.
Exit Rate
Exit rates measure the percentage of impressions that exit your Story before it ends.
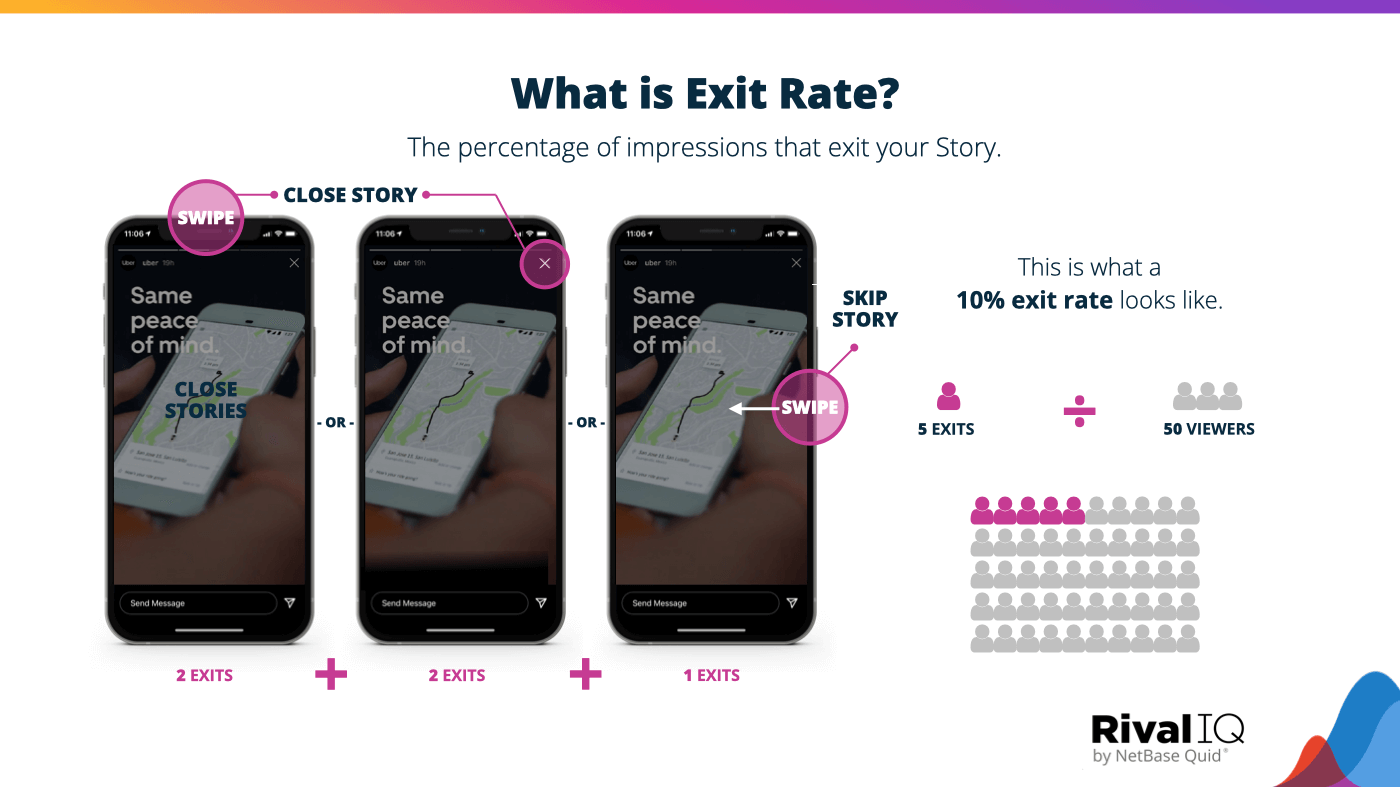
Brands saw exit rates increase just slightly this year, which means viewers were about as likely to bail on a Story as they were last year.
- Exit rates start at about 12% for Stories with a single frame.
- The rate begins to really tail off at 5 frames per day and flattens out in the 4% range.
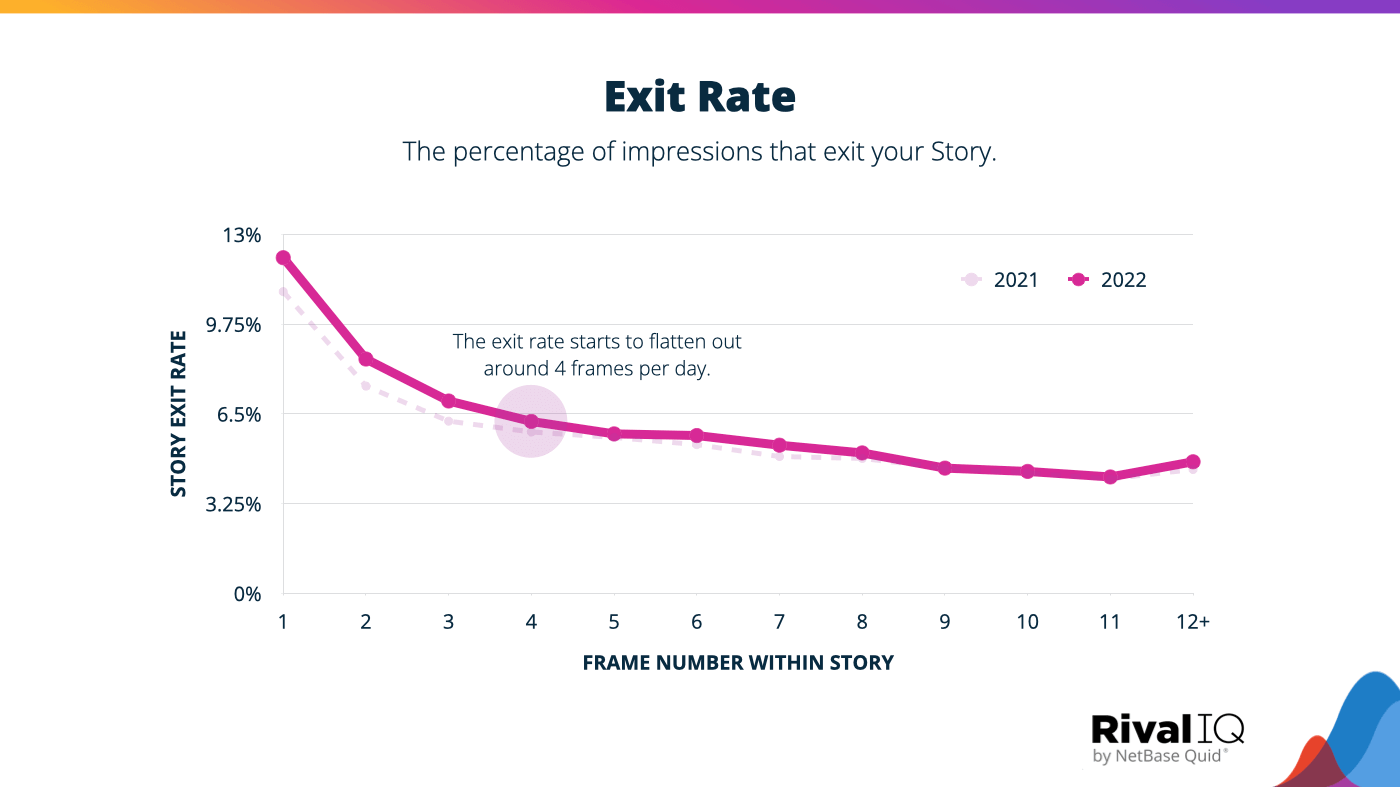
These numbers are small, and therefore nothing to panic about. Focus on strategic and engaging content, and try to do more of what worked for you in 2022 next year.
Wrapping It Up
Instagram Stories are still a critical tool in any marketer’s toolbox, and we loved seeing brands invest in Stories and get seriously creative in grabbing and keeping the attention of their followers. While posts are still reaching more eyeballs than Stories, it’s easy to see that many brands are still using Stories to deepen engagement with followers while taking them behind the scenes or getting playful.
What’s on your Instagram Stories agenda for 2023? Let us know on Twitter (or Instagram!).
How to Find your Instagram Stories Data
Follow these simple(-ish) steps to find up to 90 days of Stories data natively in Instagram. Remember that these stats are available only for business profiles, creator accounts, or verified handles.
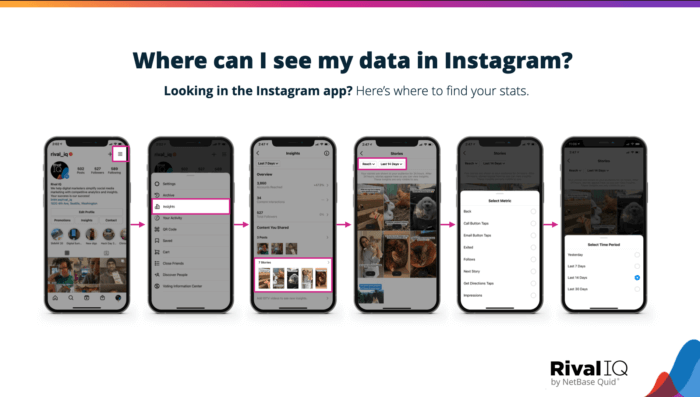
If you’re looking for more than 90 days of Story stats and the ability to view all your Story metrics in one place, you could always start a free trial of Rival IQ or access Instagram Insights in your existing account. Once you connect an Instagram business profile to Rival IQ, you’ll start capturing all your new Instagram Story data (alongside Facebook, Instagram, Twitter, LinkedIn, YouTube, and TikTok stats, of course).
Methodology
Rival IQ analyzed over 72K Instagram Stories (and 281K+ frames!) posted between June and November 2022 to bring you insights for your 2023 marketing strategy.
We included 965 Instagram handles that had at least one Story published during each month of the time frame, and we only included handles with a reach of at least 100 views for each frame and a 1K total follower minimum. Handles were included only if we had all of their data for the entire time period, regardless of how frequently or infrequently they published Stories. These handles reached across multiple industries, including beauty, media, influencers, outdoor/adventure, marketing, and more.
Instagram Stories Metrics: Glossary
Instagram Story terms don’t have to be confusing, so here’s a glossary of all the important Story metrics used in this report and their definitions.
Engagement: Measurable interaction on Instagram Stories and posts, including likes, comments, replies, and shares.
Exit Rate: The percentage of your impressions that exit your Stories by swiping right, swiping down, or closing Stories.
Frame: A single photo or video posted to your Instagram Story.
Impressions: The total number of views of a frame in your Story.
Post Engagement per Impression: The number of likes, comments, and saves per impression on a post.
Post Reach Rate: The reach of a post expressed as a percentage of your followers.
Reach: The total number of unique people that saw a frame in your Story or your post.
Reply Rate: The percentage of your Story Viewers that replied to your Story on any given day.
Replies per 1K Impressions: The number of replies per 1,000 story impressions.
Retention Rate: The percentage of your Story Viewers on any given day that see all your frames.
Stories Reach Rate: Your Story Viewers on any given day divided by your follower count, expressed as a percentage.
Story: The set of frames posted to your Story within a single 24-hour day.
Story Viewers: The number of people who saw your Story on a given day.
Tap-Back Rate: The percentage of your impressions that have a tap backward to see the previous photo or video again.
Tap-Forward Rate: The percentage of your impressions that have a tap forward to see the next photo or video.