TikTok’s algorithm may be elusive, but your TikTok metrics don’t have to be.
Having clear insight into your brand’s performance and success on TikTok starts with tracking and analyzing the right TikTok metrics — ones that go beyond follower count, likes, and comments.
When your TikTok analytics are measured through the lens of engagement and competitive context, these metrics can help guide your strategy by letting you know what’s performing well, who’s watching your videos, and how much reach your brand has.
If you’re ready to refine your TikTok strategy and increase your brand’s chances of landing on the FYP, here are eight TikTok metrics social media marketers need to know and how to measure them.
8 TikTok Metrics Marketers Need to Know
While there are many TikTok metrics available in the app, these are the ones worth tracking if you want to better understand and improve your brand’s engagement.
Engagement Rate by View
Engagement rate by view is the average number of engagements per view.
On a platform with incredible reach, measuring your engagement rate by view can provide great insight into how your content is performing with both followers and users who discover it on the For You Page.
By counting the number of times a viewer liked, commented on, or shared your video, and dividing it by the total number of views, you can measure just how compelling your content was. If your video wasn’t high-quality, thought-provoking, or even controversial, viewers will be less likely to engage with it, and therefore you’ll earn a smaller engagement rate per view. If your video was attention-grabbing, viewers will be more likely to take the extra step of engagement before swiping to the next video.
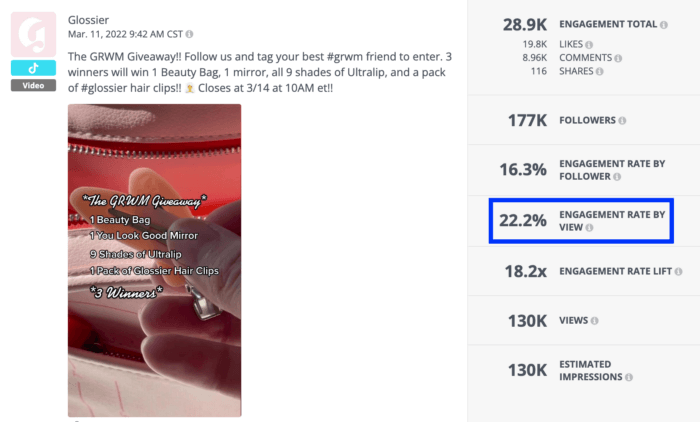
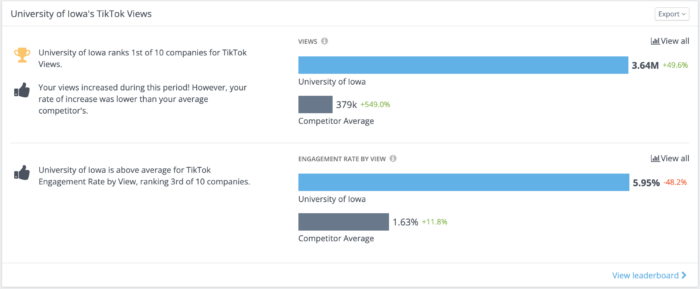
According to our 2022 TikTok Benchmark Report, the average brand on TikTok earns an engagement rate by view of 5.8%. The engagement rate also tends to skew higher for accounts with more followers, but don’t let that deter you if your brand has a smaller follower count.
Engagement Rate by Follower
If you’ve read one of our many industry benchmark reports, then you know that engagement rate by follower is our go-to metric for measuring engagement.
On TikTok, engagement rate by follower is the average number of engagements per follower on a per-video basis. So, why is this a TikTok metric marketers need to track?
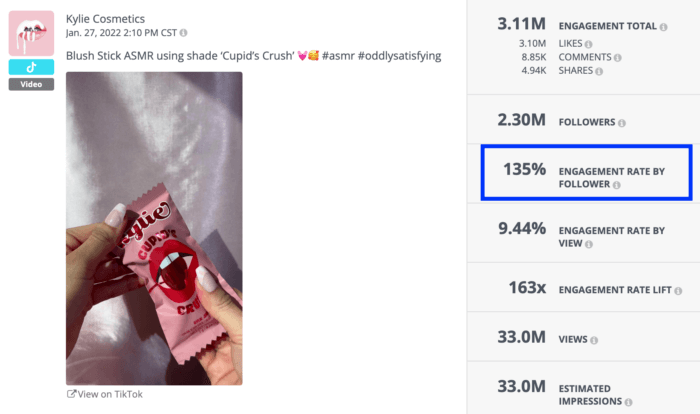
It’s easy to take the engagement total at face value when comparing your metrics with the competition. But to really gauge whether or not your content is performing well, it’s important to understand engagement as it relates to your audience size — and that’s where this metric comes into play. Let’s take a look at a couple of videos from beauty brands to see this TikTok metric in action.
The video below from Kylie Cosmetics received 33 million views and had an engagement total of 3.11 million. The brand has 2.3 million followers on the platform and the engagement rate by follower for this video is 135% — well above the average of 4.1% for all brands on TikTok, according to our recent report.
Now let’s take a look at a video from Beautycounter to compare. The video below received 2.2 million views and garnered a total of 109K engagements. Plus, Beautycounter’s audience is much smaller than Kylie Cosmetics’ at 28K followers.
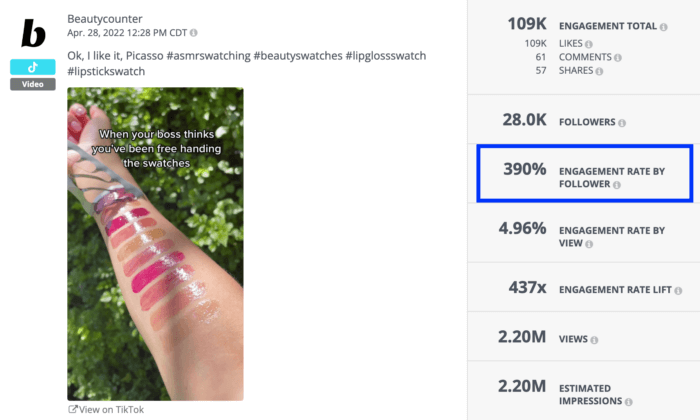
However, the engagement rate by follower for this video is 390% — more than double the rate for the Kylie Cosmetics video.
If you compare the number of engagement totals, three million sounds a lot better than 109K. But once you take the audience sizes into consideration, Beautycounter’s video clearly performed much better than Kylie Cosmetics’. This is just one example of why this metric is essential for your TikTok strategy.
Engagement Total
Engagement total is a pretty straightforward metric: it’s the total number of interactions on a video. Interactions include likes, comments, and shares.
Of these interactions, comments and shares will provide the most insight into how your videos are performing with users and followers.
A high number of comments or shares on a video could indicate that your content resonated with your audience and triggered enough emotion — whether that’s from being entertained, excited, or informed — for them to comment and let others know.
If your videos are receiving likes but not many comments or shares, it’s worth brainstorming how you can encourage responses and conversations to get your followers more engaged.
Hashtags per Video
Hashtags per video is the average number of hashtags on a per-video basis.
On TikTok, brands appear to be more intentional about their hashtag usage than on other platforms. The median number of hashtags per video is four, according to our benchmark report.
If you choose to use just a few hashtags, experiment with a mix of niche tags to reach a specific audience and popular topics to increase discoverability.
For example, the top-performing video on TikTok for the WNBA team Seattle Storm included five hashtags. The hashtags were a mix of team-related tags like #TakeCover and #Seattle, but also broader ones like #SportsTikTok which currently has 4.8 billion views, and #Basketball, which has a whopping 132 billion views.
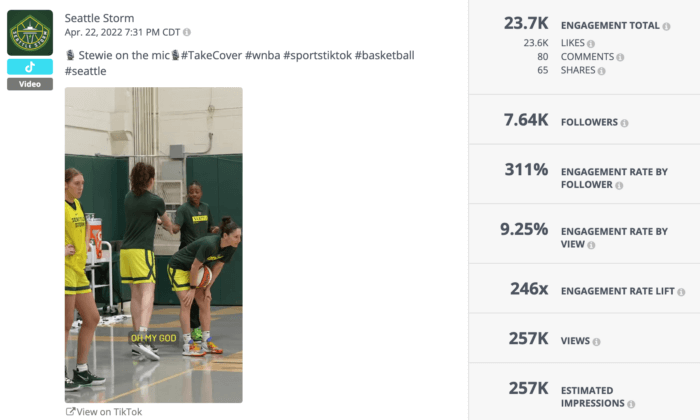
Hashtags are a discoverability tool. When you select popular hashtags, they can help land your content on the FYP and beyond. Plus, users can also search for a specific hashtag and see all of the videos that have used that hashtag, further emphasizing the discoverability element.
Monthly Follower Growth Rate
This metric is the average monthly growth rate over a selected time period.
While your total number of followers is always a metric to keep an eye on, monthly follower growth rate can help you understand if your content is consistently reaching the right audience and resonating with users.
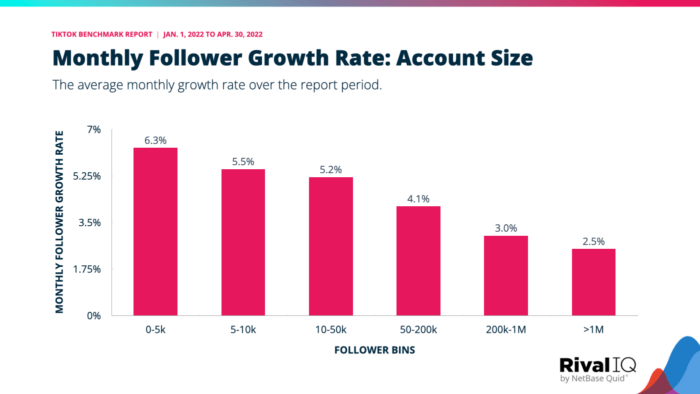
Take note of any spikes or dips in your growth rate and try to identify what could be the reason for the change. If your growth rate is stagnant, experiment with a TikTok trend to spice up your typical content and give your follower count a boost.
Videos with Mentions
This TikTok metric is the percentage of a brand’s videos that include at least one mention of another account.
In our benchmark report, we found that brands mention another account about 14.5% of the time. However, mentioning another account in your video can help broaden your reach by getting your content in front of another brand’s audience.
It’s also a good way to engage and build a connection with your followers. The University of Iowa offers a great example of this in the video below.
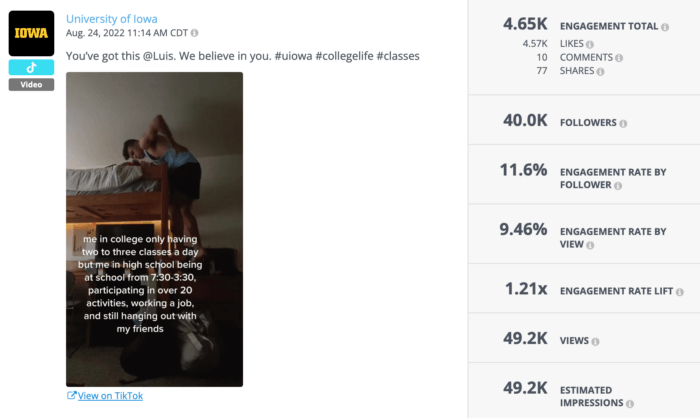
A University of Iowa student posted a video that generated hundreds of thousands of views. Naturally, this grabbed the attention of the school who then reposted it on their own account and mentioned the original creator in the caption.
While we’ve found that brands tend to gravitate toward original content on TikTok, there are plenty of opportunities to mention another account if you want to reach a new audience or repost relevant UGC.
Videos per Week
This metric represents the average number of videos a brand publishes per week.
According to our research, brands post less frequently on TikTok than they do on other platforms, posting about 1.8 times per week. But the most active brands can be found making and sharing videos at least five times per week.
To better understand how often you should be posting, analyze your competitors’ posting frequency. Getting an idea of how your videos per week stack up against similar brands will provide insight into whether you should post more often or maintain your current frequency.
Views per Follower
Another TikTok metric marketers need to track is views per follower, the average number of views per follower on a per-video basis.
Thanks to TikTok’s algorithm-driven FYP, your videos reach far beyond your followers. While other platforms focus on showing your content to existing followers, TikTok serves your videos to people it thinks will engage with your content. With this capability, it’s important to understand how your content is performing among followers and viewers who don’t follow you, and that’s where this metric comes into play. Views per Follower helps you narrow down how many of your views come from people who follow you.
Let’s use this video from Pixi Beauty as an example. We can see that it received about 92K views, as highlighted in the blue box, and the brand has 27K followers, as outlined in the black box.
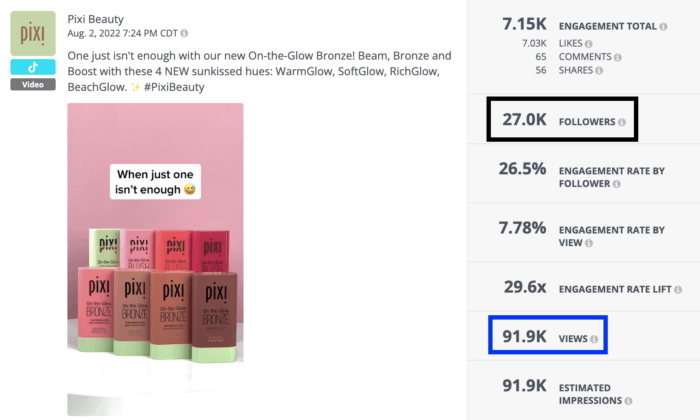
Using our calculation for Views per Follower (the number of views divided by the number of followers), we can determine that this video received about 3.4 views per follower.
On a video platform like TikTok, the more insights into views you can get, the better.

How to Analyze TikTok Metrics Using Creator Tools
To track your TikTok analytics within the app, head to TikTok’s Creator tools.
In the Overview tab, you’ll get a glance at several key metrics over a set period of time — this can be 7 days, 28 days, 60 days, or a custom date range.
From there, you can review the data for your followers, content, and engagement on TikTok.
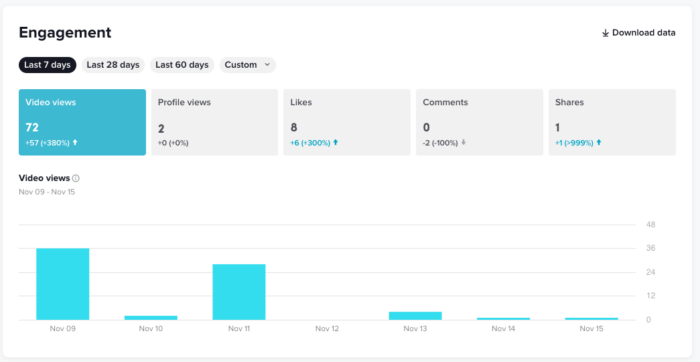
Engagement
- Video Views: The total number of views your videos have received over a selected time period.
- Profile Views: The total number views your profile has received over a selected time period.
- Likes: The total number of likes your videos have received.
- Comments: The total number of comments your videos have received
- Shares: The total number of shares your videos have received.
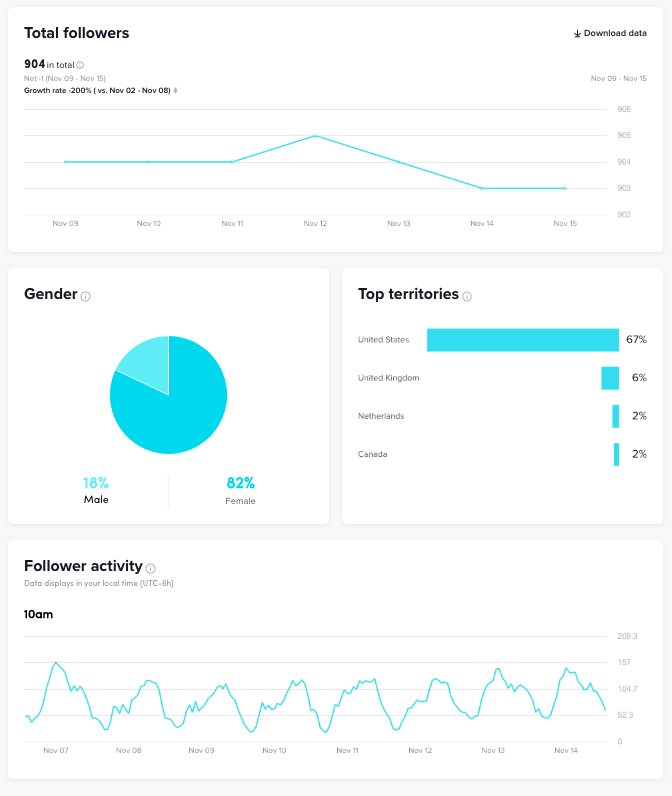
Followers
- Total Followers: The total number of followers you have and the growth rate for the selected time period. Keep an eye on spikes or dips in followers to identify which of your posts could have contributed to the change. From there, you can figure out what’s working or what may need improvement.
- Gender: Insights into your followers’ gender distribution.
- Top Territories: Insights into which countries your followers are located.
- Follower Activity: An overview of the times your followers are most active.
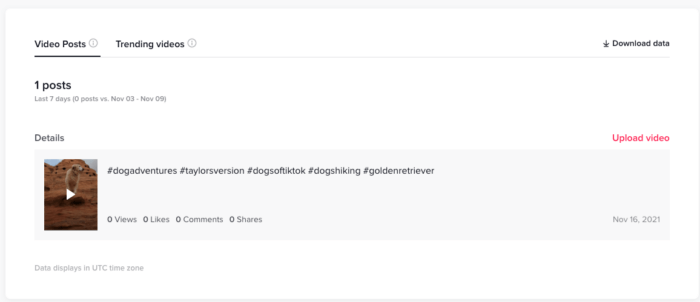
Content
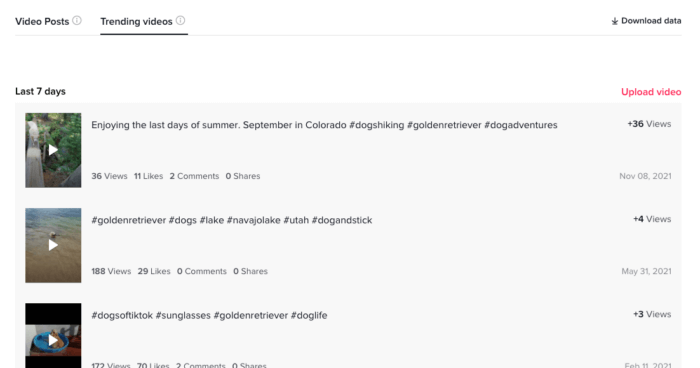
- Video Posts: An overview of the videos you’ve posted in the last 7 days.
- Trending Videos: An overview of your top 9 videos with the fastest growth in views over the last 7 days.
It’s important to note that Content metrics are only available for the last 7 days and you cannot change the date range.
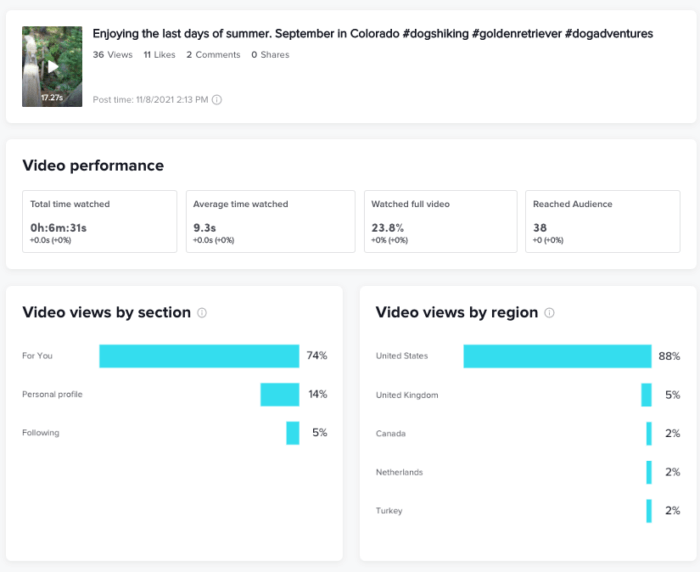
Video Details
- Total Time Watched: The total amount of time your video has been watched.
- Average Time Watched: The average amount of time viewers spent watching your video.
- Watched Full Video: The percentage of viewers who watched the entire video. This metric can give you insight into how well your content retains a viewer’s attention.
- Reached Audience: The total number of users who watched your video.
- Video Views by Section: A breakdown of where your video traffic comes from (For Your Page, Profile, Following).
- Video Views by Region: The distribution of viewers by territory or country.
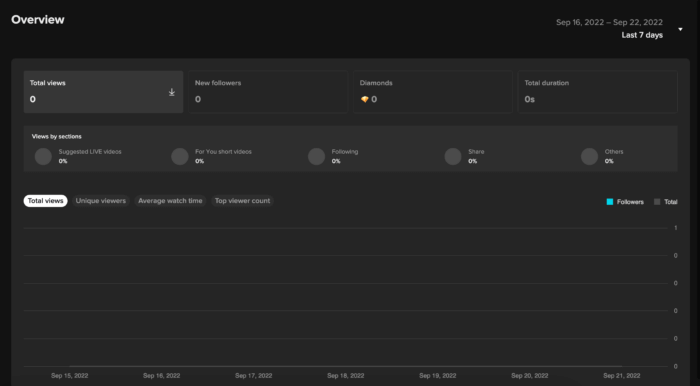
Live
If you currently publish or plan to publish Live content, TikTok now has a dedicated Live Center to track and understand Live video analytics. Here are the metrics you can find there:
- Total Views: The total number of views your Lives received during the selected time period. Your selected time period can be from the last 7 days, 28 days, 60 days, or a custom date.
- New Followers: The total number of followers gained during your Lives. This metric can help you understand if Live videos are something that users want to see from your brand or not.
- Diamonds: The total number of Diamonds earned during your Lives. Diamonds are a virtual gift that are available for creators who are eligible for TikTok’s monetization program.
- Total Duration: The total time your brand has spent hosting Lives.
- Unique Viewers: The total number of users who viewed your Live at least once (this metric doesn’t count replays).
- Top Viewer Count: An overview of the users who have viewed your Lives the most during the selected time period.
How to Find and Measure TikTok Metrics Using Rival IQ
To get the most out of your brand’s TikTok strategy, it’s important to not only track and measure these essential TikTok metrics, but also analyze them in a competitive context.
You can find all of these TikTok metrics and compare them with similar brands using our TikTok analytics tool.
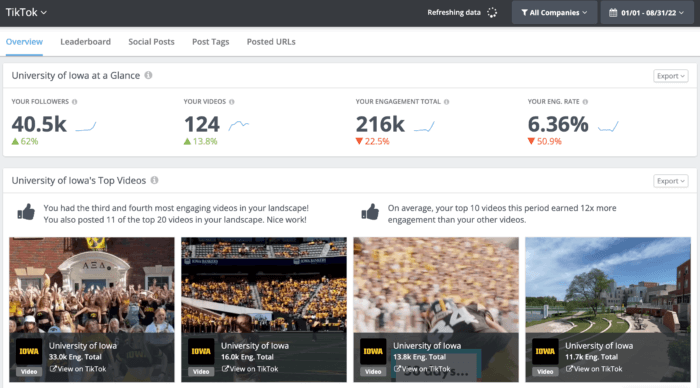
In the Rival IQ dashboard, head to the TikTok analytics tab. Once there, you’ll see an overview of your TikTok performance and stats including followers, number of videos for the selected time period, engagement total, and engagement rate by follower.
You can also get a glance at your top-performing TikTok videos for the reporting period and see how they stack up to the other companies in your competitive landscape.
From there, you can check out the leaderboard to get an overview of your ranking among similar brands when it comes to your number of followers, engagement rates, posting frequency, and video views.
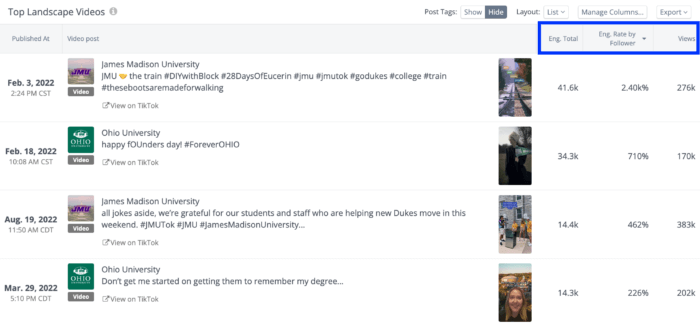
You can also dive deeper into your and your competitors’ TikTok performance by analyzing the top videos from the reporting period, organized by engagement rates and views, as shown in the blue box in the top right corner below.
Wrapping it Up
TikTok’s dynamic presence in the social media landscape doesn’t show signs of slowing down anytime soon. As TikTok continues to drive more brands and users alike to the platform, marketers must find ways to refine their marketing strategy and measure success.
To stay on top of your TikTok performance — not to mention, see how you rank among the competition — tracking and measuring the right metrics for engagement, views, growth rate, and posting frequency can help guide your actions on the most downloaded social media app.
And with access to TikTok metrics that matter, you can ensure your videos are tailored to your brand’s needs and created with your followers and the FYP in mind.