TikTok Analytics are now live in Rival IQ!
Stay on the cutting edge of the world’s most downloaded social media app with tons of critical metrics and the competitive context you need to get ahead of your competition and stay there. Tailor your TikTok analysis to the needs of your brand with fully customizable dashboards, automated insights, TikTok post tagging, alerts, and more.
The best part? These features are available for all customers and plans starting *right now*, so don’t hesitate to jump into your Rival IQ account or sign up for a free trial to start analyzing.
New TikTok metrics now available to help you stay competitive
Let’s start by reviewing the oodles of new TikTok metrics available to analyze in Rival IQ. Longtime Rival IQers will recognize many of these metrics and tables like Top vs. Bottom post view, best times to post on TikTok, and more, since we’ve taken the best of our Instagram, Twitter, and Facebook analytics for the new TikTok section of our app. And don’t forget to view your TikTok Analytics within our Cross-Channel leaderboards to see how your social audience, activity, and engagement metrics measure up against your performance on other channels.
TikTok audience metrics
Keep an eye on your TikTok follower counts and net changes in the Leaderboard, or customize your analysis in Custom Dashboards to track your follower trends over time against your competitors.
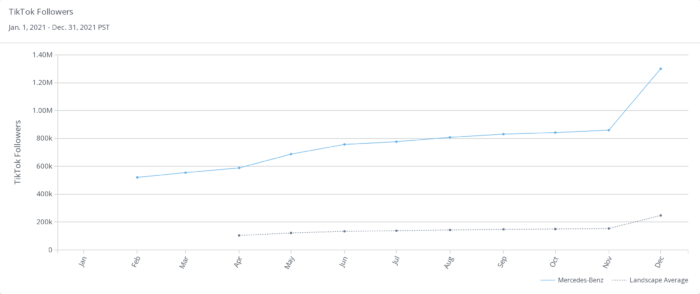
TikTok analytics follower graph comparing Mercedez-Benz to its competitive landscape
In this time series of Mercedes-Benz’s TikTok follower activity in 2021, it’s easy to see the brand has steadily seen follower counts 3x the landscape average and that things really started to take off for the brand in December.
TikTok activity metrics
Is more really more when it comes to TikTok posting frequency? It depends on how often your competitors are posting on TikTok, which you can monitor easily in Rival IQ.
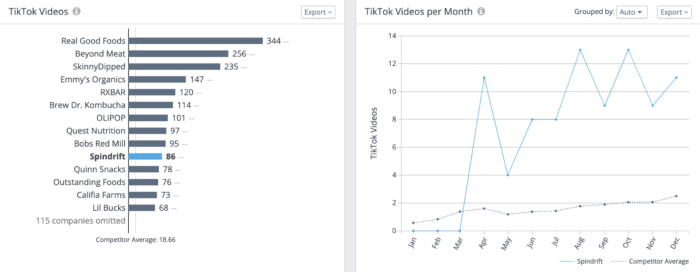
TikTok analytics video leaderboard for health food brands
Use the Leaderboard to track TikTok videos in a given time period, and don’t forget to keep an eye on posting trends over time. One of our newest features will help you slice and dice that data by day, week, or month for the right level of granularity to help you optimize your TikTok posting frequency.
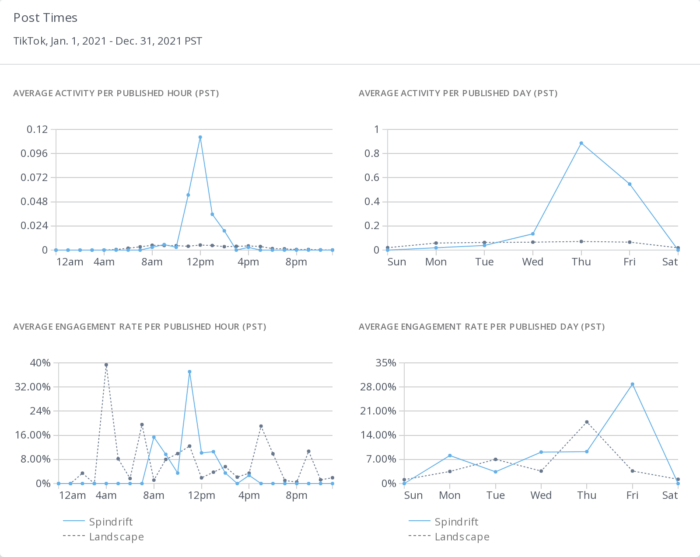
Best times to post on TikTok for Spindrift
Looking for the best time and day of the week to post your TikTok videos? We’ve got you covered with our optimal post time analytics, which track your posting and engagement over the course of a week and a 24-hour hour period to pull out especially promising times for posting. In the example above, the top left graph tells us Spindrift is concentrating all of its posting around the noon hour, but in the graph below we can see that other health food brands are seeing lots of success at other times of day.
TikTok engagement metrics
Keep track of likes, comments, shares, and views for both you and your competitors for a full picture of what’s working and what’s not. And don’t bother digging out your calculator–we’ve got all your metrics aggregated for your channels and for your competitors with Engagement Total, Engagement Rate by Follower, Engagement Rate by View, and more.
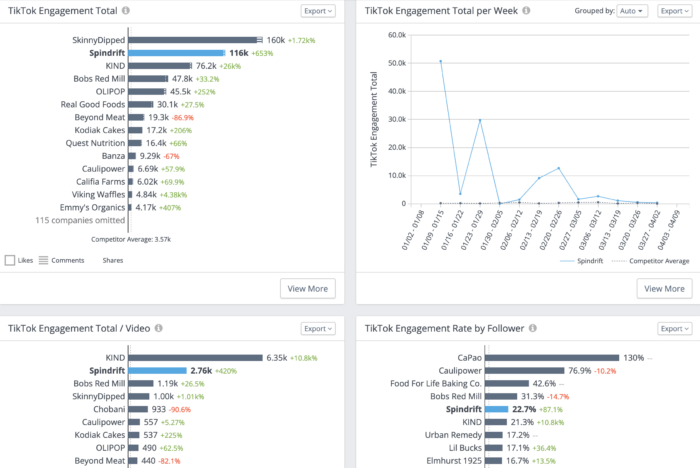
TikTok engagement totals and rates for Spindrift against a competitive health food brand landscape
TikTok can feel like the Wild West for brands just starting out, with major differences in style, tone, and of course post type from more traditional channels like Instagram and Facebook, which is why it’s more important than ever to track your engagement to see how you’re doing.
Our Leaderboard contains tons of engagement metrics as seen above to help track engagement rate and engagement total and also help you see how these metrics are evolving over time. In the above example, focus company Spindrift is already rocking a killer engagement total (that is, likes, comments, and shares) and saw some big engagement spikes last summer. While they’re not topping the engagement charts everywhere just yet, these big increases are important to track and ideally integrate into this year’s content strategy.
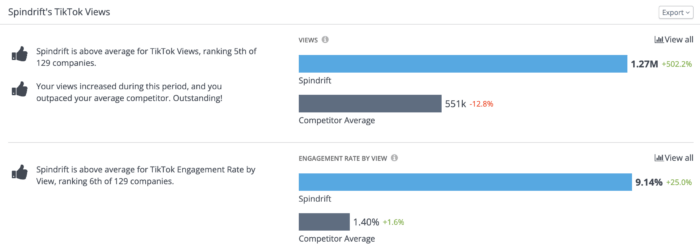
Spindrift’s TikTok views compared to averages from a health food brands competitive landscape
On TikTok, likes, comments, and shares are just one part of the engagement story, with views playing a bigger than ever role when so many users interact with brands via whatever TikTok’s magical and mysterious algorithm brings them on their FYP instead of searching out brands to follow. Use the Overview or Leaderboard to keep an eye on what’s happening with your views, and even access must-see insights (more on that later) to help you make sense of what you’re seeing.
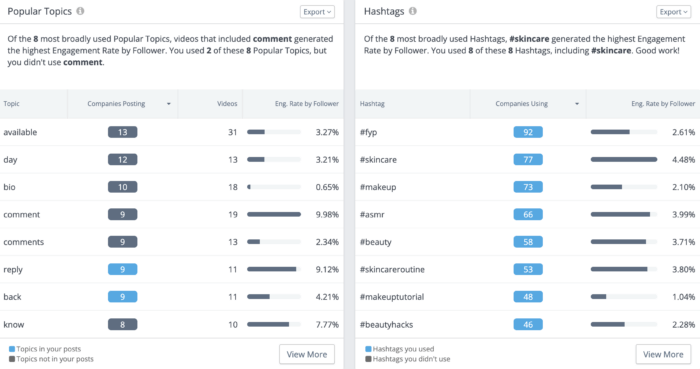
Popular Topics and hashtags in TikTok analytics for beauty brands
No TikTok analysis would be complete without tracking the hashtags that are working well for your brand *and* the hashtags your competitors are using that you should, uh, borrow. Use our Hashtags panel to pull out top hashtags by Engagement Rate by Follower, or smash that View More button for tons of additional hashtag analysis options. No surprise here that beauty brands using the #fyp hashtag are doing well, but these brands might want to invest a little more in #skincare-themed posts to take engagement rates from good to great.
And don’t forget about Popular Topics, which uses Natural Language Processing (NLP) to pull out the words and phrases that are most commonly used in TikTok captions for a true picture of the topics and themes that are prevalent in your competitive landscape. These beauty brands are seeing way more engagement with posts that encourage users to comment or reply than with posts that mention their bios, which might bring about a second look at “link in bio” video posting strategy.
See how your TikTok views and engagements stack up against the competition
Every TikTok metric in our app can be viewed in a competitive context. That’s right: every TikTok metric. From engagement rates to totals to views to followers and beyond, it’s never been easier to track your brand’s TikTok performance alongside your competitors’ so you know how you’re really doing.
Why does competitive context matter? With so many brands competing for eyeballs on the For You Page, it’s more important than ever to understand just how impressive your engagement on TikTok really is by pitting it against your rivals’ social media performance. 1,000 engagements on a video is great, unless your competitors earned 100,000 engagements.
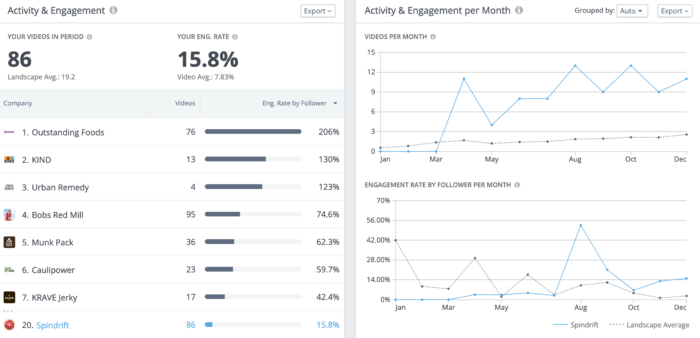
Competitive activity and engagement for health food brands on TikTok
In the case of our health food brand landscape, Spindrift’s 15.8% engagement rate sounds like any marketer’s dream until you see that the top performers in this industry are seeing two and three times that and beyond. (But they should also be proud of getting twice the industry average!)
There are also lots of places to track performance over time against your competitors, as seen on the graph on the right. Spindrift’s engagement rate (solid blue line) was below the landscape average (dashed gray line) for much of last year until some major successes in the summer, which has helped the brand earn above average engagement compared to the rest of the landscape in the latter half of 2021.
If your brand is considering dipping its toes in the waters of TikTok, it can be really helpful to see the kind of engagement other brands in your industry are seeing before taking the plunge. You don’t need to be active on TikTok to use these metrics to keep an eye on your competitors, so don’t be afraid to get snooping.
Fine tune your TikTok Analytics with custom dashboards and post tagging
We’ve tried to make TikTok analysis easy right out of the box, but if you’re itching to customize, we see you.
TikTok custom dashboards in Rival IQ
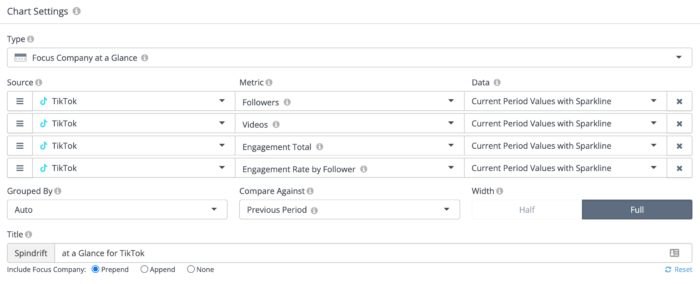
Use Custom Dashboards to build custom charts and tables that’ll help you go as granular or global as you please with your TikTok Analytics. We’ve got metrics and dropdowns galore for ultimate configuration, and we also have a ready-made TikTok Analytics summary dashboard to give you a starting point.
Don’t forget to toggle the Compare Against dropdown to benchmark your TikTok performance against your previous time period or averages and medians from your competitors.
Or if you’re dying to track campaigns, links in bio, UGC, or just about any other way you can slice and dice your TikTok videos, try Post Tagging.
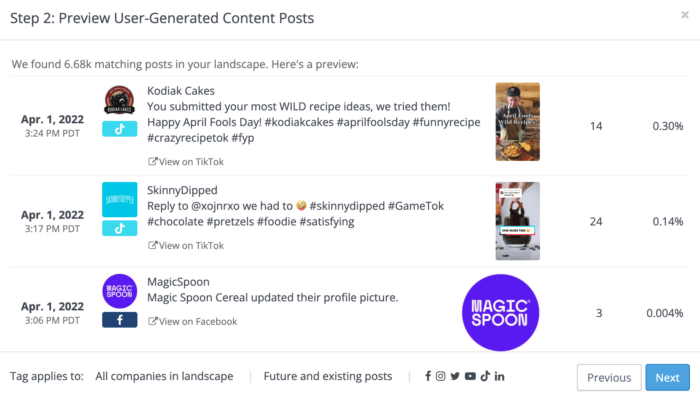
Post tagging in TikTok analytics featuring UGC posts for health food brands
Spend a few minutes tagging posts in just about any way you can think of using our automated recipes or your own logic and we’ll handle the rest.
In the above example from our Post Tag Manager, you can see two instances of UGC TikTok videos for health food brands Kodiak Cakes and SkinnyDipped. Once you set up your Auto-Tag, we’ll use your criteria to tag future and existing posts on all major social channels including TikTok so your posts are always aggregated and ready for analysis.

Custom post tag analysis for health food brands on TikTok
Speaking of analysis, we can now see in Post Tags Analytics that those UGC TikTok videos we just tagged perform about 3x better than the average post in this landscape in the selected time period. Not bad! This table also draws attention to how well contests and new releases are working on TikTok for brands in this landscape.
Automation to help you spot patterns in your TikTok Analytics
When analyzing multiple channels, it can be hard to know where to look for the most important tidbits of info, which is why we have tons of automated insights and alerts to make sure you don’t miss a thing.
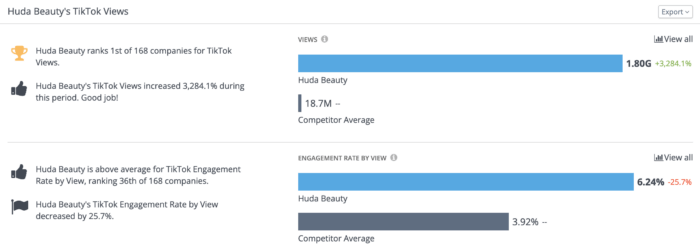
Huda Beauty’s TikTok views alongside automated observations and competitive context
First up are dynamic automated observations in your Overview to help you easily spot patterns and flag important changes in your TikTok performance. These insights change anytime you change your analysis parameters by, say, updating your landscape or toggling your date range for the freshest takeaways you can immediately integrate into your TikTok strategy.
TikTok alerts for health food brands
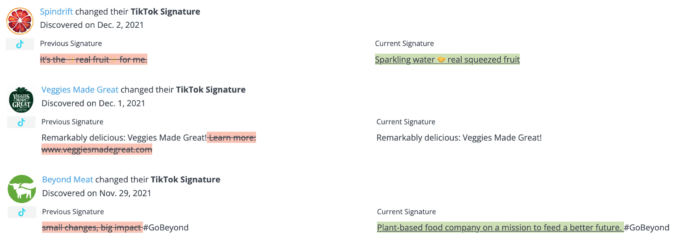
Best of all, you don’t even have to be logged into your Rival IQ account to receive important updates about what your competitors are up to on TikTok. We’ll send an email alert to you anytime a competitor changes their handle or bio information so you can note any rebranding efforts or messaging updates. We’ll also send an alert when a company in your landscape has a Breakout Video Post so you can keep tabs on what’s going viral in your space.
As with all of our other alerts, you can configure your alert settings so you’re getting notifications that matter most to you on your schedule. Don’t forget you can add as many email addresses you want to these alerts, in case you want to keep your team in the loop as well.
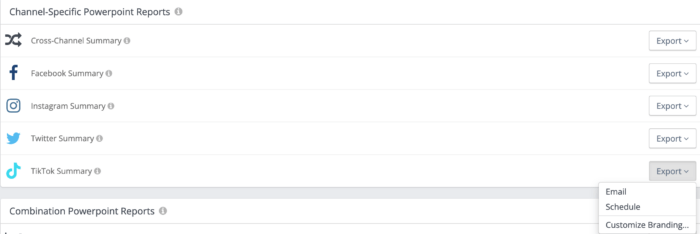
Downloadable Powerpoint reports for all major social media channels
Looking for even more ways to stay on top of your TikTok performance? Don’t forget about our slew of ready-made exportable slide decks you can easily schedule to run on, say, the first of the month so you can review your TikTok performance without lifting a finger.
Wrapping It Up
We hope you’re as excited as we are to see TikTok Analytics in Rival IQ. TikTok Analytics are now live in all Rival IQ accounts and trials, so start crunching those numbers already.
See you on the FYP!