If there’s one part of your TikTok marketing strategy that deserves extra attention, it’s your brand’s TikTok analytics.
TikTok analytics encompasses all of the metrics and data about your content, audience, performance, and even industry trends. For brands that want to make an impression and reach their target audiences on TikTok, it’s important to not only track and measure key metrics but also use this data to create actionable strategies and get the most out of the social media platform.
Below, let’s dive into why you need to review your TikTok analytics regularly, which metrics to track, and how to measure your performance using TikTok analytics tools.
Why it’s Important to Measure Your Performance on TikTok
Marketers know how important it is to monitor and track how your brand is performing on every social channel. But keeping an eye on your analytics goes far beyond counting how many followers and likes your videos get.
When you track the right metrics and understand how you’re performing in relation to other brands on TikTok (by referencing TikTok Benchmark Report, for starters), you can get much more out of the platform.
Here are the benefits you gain when you monitor and measure your TikTok analytics.
Data-driven insight
If you follow the SMART goals framework (which stands for Specific, Measurable, Achievable, Relevant, and Time-Bound), then tracking your TikTok data is essential for the “M” or “measurable” part.
Whether your goal is to increase your engagement rate by 5% or double your audience size in the next three months, your specific goals need to be measurable if you want to achieve them.
Quantifiable metrics like engagement rate and number of video views let you know how your videos are performing on the platform and with your specific audience. When you know what is and isn’t working, you’ll better understand if you’re on track to meet your goals or what you need to adjust to achieve them.
Competitive context
It’s important to understand what the overall landscape looks like for brands on TikTok, but every industry is different. Nonprofits perform differently than Sports Teams who also have different engagement rates and goals than Beauty brands, for example.
This is why it’s important to benchmark your data against similar brands. Industry-specific data helps you understand how similar brands are performing on TikTok and puts your brand into a competitive context.
When you can see what your competitors are doing successfully on TikTok, you can experiment with similar tactics. Conversely, you may notice a gap in your industry and can stay ahead of the curve by trying it out before your competitors do.
Connect with your target audience
Ask any marketer who’s had one of their videos go viral on TikTok: seeing your views and engagement metrics spike can give you a jolt of excitement. But when the dust settles, how many of those engagements actually turned into quality followers?
You may have a goal of reaching more people or increasing your followers, but those goals are only successful if you reach the right audience. To do that, you have to know which metrics to track. TikTok metrics like engagement rate by follower, for instance, help you understand which videos are resonating with your audience.
The better you understand your target audience and what they like, the more you can tailor your TikTok content strategy to them.
Every TikTok metric you need to maximize your engagement
Download the reportUnderstanding Your TikTok Analytics: Key Metrics to Track
TikTok analytics includes several helpful metrics, many of which are different from the other platforms. While we’ve covered a full list of the top TikTok metrics to track, here’s a refresher:
- Engagement rate by view
- Engagement rate by follower
- Engagement total
- Hashtags per video
- Monthly follower growth rate
- Videos with mentions
- Videos per week
- Views per follower
Let’s go over a few of these metrics in more detail and break down some examples of brands with impressive performance.
Engagement rate by view
Engagement rate by view is one of the most telling metrics for how attention-grabbing your content is. When you take a video’s total engagements and divide that by the number of views, you can see what percentage of viewers stopped to not only watch your video but like, comment, or share it. The average brand on TikTok earns an engagement rate by view of 4.15%.
This metric is important to track if you want to measure how interesting your videos are and whether or not they’re helping boost your visibility, awareness, and interest.
A low engagement rate by view tells you that while people may have seen your video pop up on their FYP, the content of the video didn’t resonate with them. This could mean that you’re not reaching the right audience or that your videos aren’t encouraging engagement from your target audience.
A high engagement rate by view lets you know that the people who saw your video were either entertained, informed, or persuaded by the content.
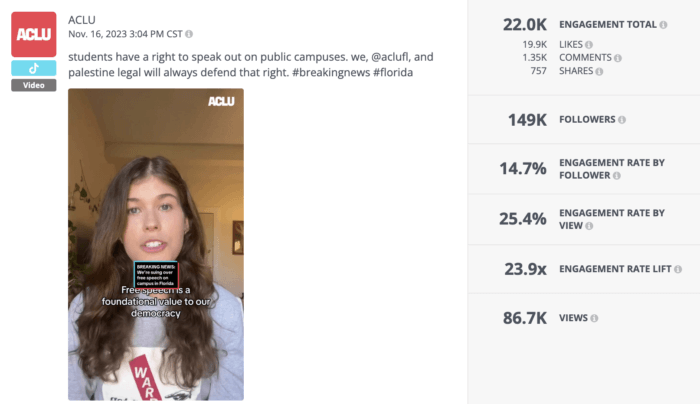
ACLU, for example, consistently generates a high engagement rate by view on TikTok thanks to its informative videos. The civil liberties nonprofit informs, educates, and encourages action in its videos which has no doubt contributed to earning an average engagement rate by view of 13.7%. This is twice as high as the average for nonprofits on TikTok and three times greater than the overall average.
Engagement rate by follower
Reaching thousands or even millions of people on TikTok is great, but ultimately, if your own followers aren’t engaging with your content then it’s all for naught.
If you want to see how your audience feels about your videos, take a look at your engagement rate by follower. This metric indicates how engaging your content is to your followers. To give you a benchmark to measure against, the average engagement rate by follower on TikTok is 5.7%.
Engagement rate by follower is a helpful metric because it puts your videos into context with your audience size. You might have a smaller audience compared to other brands on TikTok, so comparing your engagement rates with theirs wouldn’t be fair.
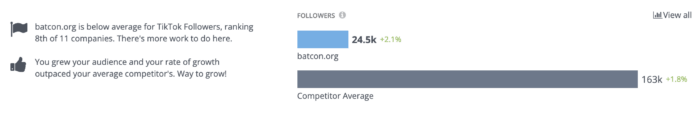
Take Bat Conservation International, for example. The top-performing nonprofit has a much smaller audience than its fellow nonprofits on TikTok with about 24,000 compared to the competitor average of 163,000.
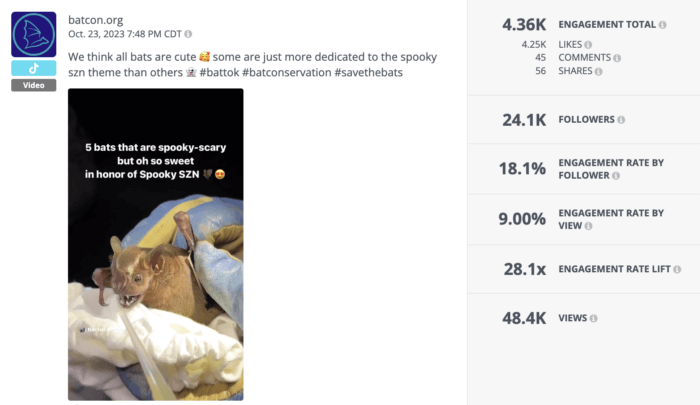
However, the bat conservancy nonprofit isn’t missing out on engagement. The nonprofit regularly earns an engagement rate by follower that’s much greater than the average. The video below, for example, generated an engagement rate by follower of 18.1%, which is three times higher than the overall average.
Videos per week
Another important metric to measure when diving into your TikTok analytics is videos per week. Tracking your posting frequency, as well as how often your competitors are posting, and comparing it with your engagement levels helps you understand how active you should be.
Overall, brands tend to post less often on TikTok than on other channels like Instagram. The average brand posts 1.75 times per week, which is about eight videos per month. However, every industry is different, so it’s important to measure this metric against similar brands in your industry to truly understand what frequency you should be aiming for.
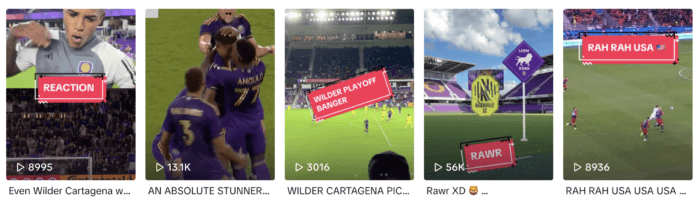
Sports Teams, for instance, are known to be more active across social channels compared to other industries — especially during their playing season. On TikTok, we found that Sports Teams post about twice per week.
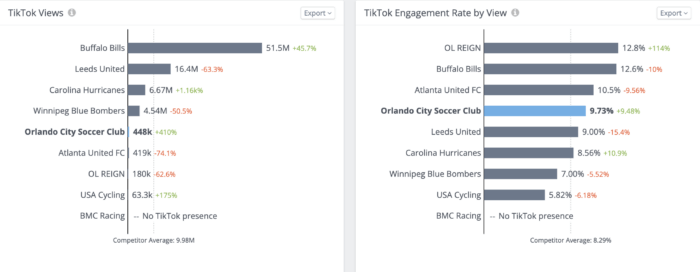
Orlando City Soccer Club is even more active than the average Sports Team, posting about four times per week — and sometimes more. The five videos below were all shared within a seven-day time period during its season.
Posting more often can lead to higher engagement totals since you’re creating more opportunities for people to engage with your content. On the flip side, a few engaging videos per month may be enough for your audience. Every industry and individual brand sees different results which is why this is a key metric to analyze.
Hashtags per video
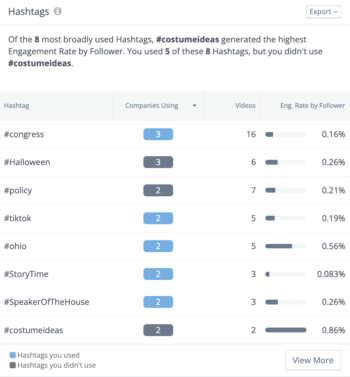
Another important metric to keep an eye on is your brand’s use of hashtags. Not only do hashtags increase your discoverability on the platform, but you can also analyze which specific hashtags generate the most engagement for your brand.
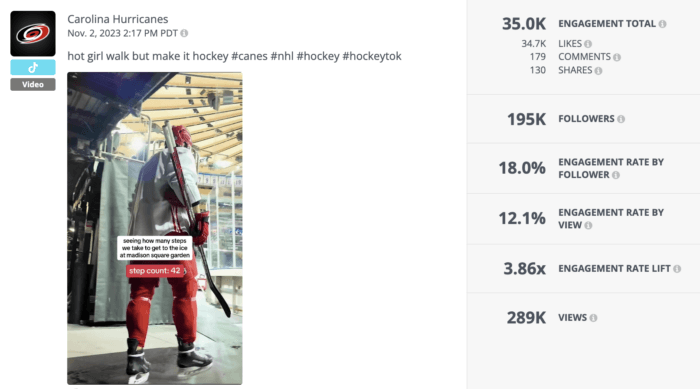
Hockey team Carolina Hurricanes includes hashtags in 100% of its TikTok videos. The team uses industry-specific hashtags like #HockeyTok and #nhl which is a strategic way to get in front of more hockey fans. They also have an average engagement rate by follower of 8.17% and an 8.56% engagement rate by view, so it’s safe to say they’re reaching and engaging with the right audience.
One way to see which hashtags are trending is by scrolling through TikTok or checking out the “For your inspiration” tab (more on that below). Or you can take it a step further by using a third-party tool like Rival IQ’s hashtag analytics.
Our analytics tool helps you discover popular topics and engaging hashtags within your industry so you can see which conversations are driving engagement for your competitors and participate if it’s relevant to your brand.
How to Use TikTok’s Built-In Analytics Tools
TikTok’s built-in Creator tools are a quick and easy way to check in on your videos’ performance in just a few taps. You can navigate to these insights from each video you share or head to the “Creator tools” section from your profile. Social media marketers shouldn’t rely on TikTok’s insights alone, but the data offers a helpful overview of video metrics like average watch time and retention rate.
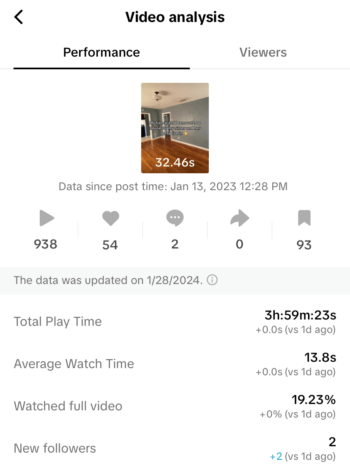
TikTok’s native tools are organized by analytics, monetization, and inspiration. For businesses, you’ll find most of the metrics you’re looking for under Analytics. This includes traffic sources, audience demographics, and viewer types (returning vs. new).
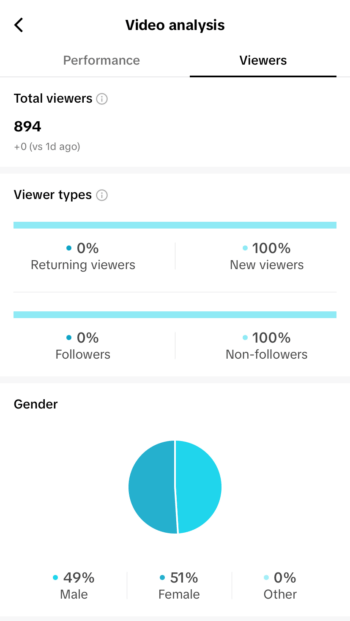
The “For your inspiration” tab can also be helpful to stay in the loop. In this section, you’ll not only see which sounds or stickers are currently trending but also the videos your followers viewed. This helps you understand what your audience likes and engages with.

3 Tools to Track TikTok Analytics
TikTok’s native analytics are helpful in a pinch whether you’re a one-person social team on a budget or just want a quick glimpse at how your latest video is performing.
But if you want to gather more specific insights about your brand’s performance on TikTok, consider using a social media analytics tool to track your data. Here are a few worthwhile tools to add to your social tech stack (and if you’re looking for more, here’s our full list of recommended TikTok analytics tools).
1. Rival IQ
Rival IQ’s social media analytics tool provides a comprehensive, in-depth look at your TikTok performance — as well as your data from Instagram, Twitter, YouTube, LinkedIn, and Facebook — all in one dashboard.
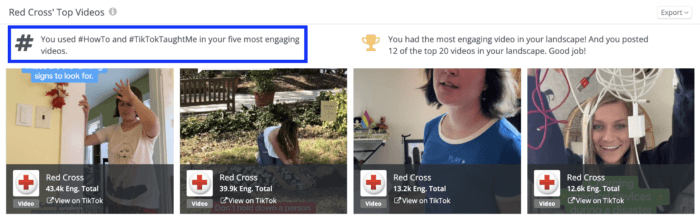
In addition to seeing detailed analytics like engagement rate by view and follower for individual videos, you can also zoom out and see how your videos are performing over a set period. For example, below is a TikTok analysis for the Red Cross’s top videos. In addition to showcasing the nonprofit’s top videos over a three-month period, our tool also highlights key metrics like which hashtags the Red Cross used that were the most engaging.
Another key benefit of using Rival IQ for your TikTok analytics is the competitive analysis tools. It’s no secret that you compare your brand’s social posts to your competitors. But instead of visiting their TikTok to check out their videos and engagement, you can analyze their performance from the same dashboard as your own using Rival IQ.
You can create customizable landscapes that rank your brand’s metrics with the companies you want to compare with. Choose which competitors you want to monitor and the metrics you want to analyze — such as follower count, engagement rate, or views — and instantly get a visual view of where your brand stands in comparison. You can also set up notifications to get real-time updates.
If there’s a particular brand you want to compare your TikTok performance with, you can also run a head-to-head report to see exactly how you stack up.
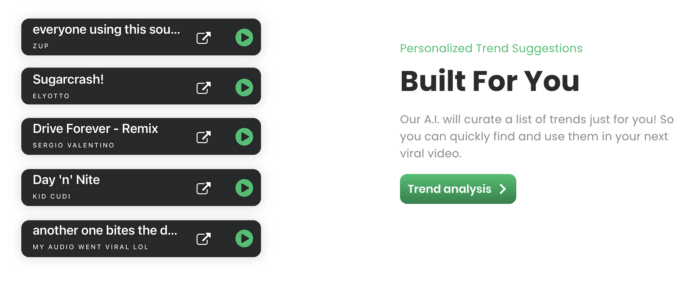
2. TrendTok
TikTok trends pop up seemingly overnight. If you’re looking for an easy way to stay on top of the latest sounds and topics, TrendTok may be the tool for you. TrendTok is similar to TikTok’s native “For your inspiration” tab in that it identifies which sounds and songs are trending in your region, niche, or among similar creators.
The app uses AI to curate suggestions for your profile so you can stay ahead of the curve and create videos that reflect your brand and audience.
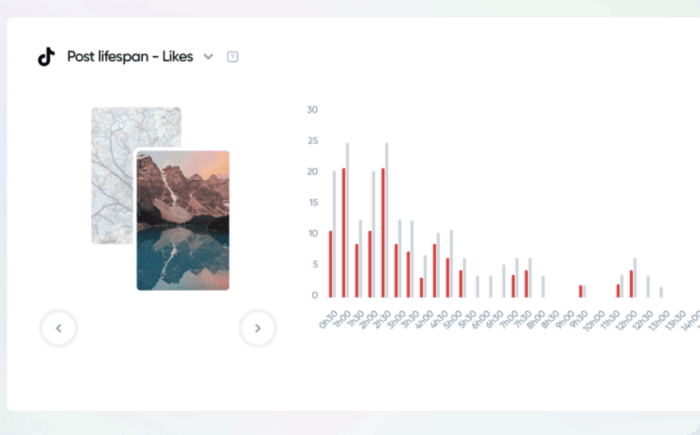
3. Iconosquare
Iconosquare is a social media management and analytics tool that is best for social teams that want to schedule, manage, and analyze their TikTok videos in one place. On the analytics side of things, Iconosquare offers over 100 metrics to track, from follower growth to historical data.
In addition to seeing key TikTok metrics in your dashboard, you can also create detailed, customizable reports so you and your team can see a visual representation of your brand’s performance.
Wrapping it Up
Your TikTok data can tell you a lot about your brand’s videos, audience, and industry. To get the most out of your data, you have to know which metrics are important to your goals and how to analyze them.
To sum it up, some of the top metrics we recommend monitoring when reviewing your TikTok analytics include engagement rate by view and by follower, videos per week, and hashtags per video.
You can also understand your performance better if it’s in a competitive context, so don’t forget to measure your TikTok metrics to your direct competitors. By making a TikTok analytics review a regular part of your social strategy, you’ll be on your way to reaching your brand’s TikTok goals in no time.