Social media has made it easy to publish a steady stream of content and engage with your customers. And yet, measuring and proving your success isn’t always as straightforward.
When it comes to social media, how can you tell how well you’re doing? How do you know your efforts are making a difference? With so many numbers and stats reported by each platform, it can be difficult to know which metrics actually matter to your business and which simply look good on paper.
So, to help you clear through the clutter, we’re breaking down the top 10 social media metrics you need to know. These are the ones that can be tied to business goals, providing you with meaningful insights you can leverage to optimize your social strategy and prove your ROI.
But first, let’s start off by clearly defining what social media metrics are.
What are social media metrics and why are they important?
Essentially, social media metrics are any numbers that tell you something about your social media performance. From how many likes an Instagram post gets to the number of times your LinkedIn update shows up on users’ feeds and anything in between, these all count as social media metrics.
Ready to track your social media metrics?
Paying attention to metrics is essential for understanding what’s working and what’s not so that you can make smart decisions moving forward. Metrics also play a big role in competitive benchmarking. If you want to know how well you’re doing in comparison to your competition, having quantitative data to compare side-by-side is invaluable.
The tricky part, though, is identifying which metrics are the most important ones to track for your brand.
The social media metrics that matter most to your business will depend on your social media goals at that moment in time. Maybe you just launched your account and want to focus on building your follower base. Or perhaps, your main priority is to get your audience more invested in your brand on social. Whatever your goal, you can bet that there are metrics that’ll provide insight into how well you’re doing.
So, to help you identify your brand’s most important metrics, let’s go through the most popular ones to measure and dive into why they’re so useful.
Top 10 social media metrics to know
1. Audience Size and Growth
As you can probably guess, audience size is all about how big your social media audience is. It can be easily identified by looking at the number of followers you have on a particular social platform. (To get your cross-channel audience size, simply add up the number of followers you have on each platform.)
On the other hand, audience growth focuses on how many new followers you’ve gained within a certain period of time. This is often presented as a percent growth rate, but some platforms will simply report your net change in followers.
What’s the difference between the two formats? Net change is a flat number (e.g. you’ve gained 5K followers in the past 30 days), while the growth rate is a percentage that reflects how significant that change is when you consider what your total follower count was. Therefore, if you had 100,000 followers and then gained 5,000 in the past 30 days, then your audience grew 5% during that time.
Audience Growth Rate = (Net Change in Followers / Starting Follower Count) x 100
While having a lot of followers certainly isn’t everything, tracking audience size and growth can be helpful if your goals for social are focused on:
- Brand awareness and perception. Positive audience growth could suggest that more consumers are becoming aware of your brand and are interested in what you have to share on social.
- Community building. There’s nothing quite as powerful as having a community of supporters behind your brand. Each follower gained is an opportunity to develop and strengthen the relationship between you and a potential or current customer.
Want to know how you measure up against your competition? Compare your audience size and growth to industry peers for more context on your performance. You can track the growth of your competitor’s audience manually or have social analytics platforms do it for you automatically. As an example, check out how Rival IQ displays the audience size and growth of popular coffee brands.
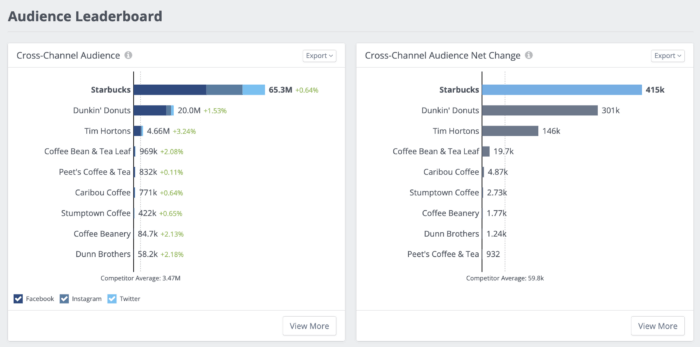
By seeing your numbers alongside your competition’s, you can get a clearer picture of how well you’re doing, as well as establish appropriate goals based on industry standards.
2. Impressions
Impressions refer to the number of times your post has appeared on a user’s feed, regardless of whether they actually interact with it. It also includes multiple appearances: if a tweet is shown 20 times to just one person, the impressions of that tweet would still be 20.
While your impressions are largely dependent on a social media platform’s distribution algorithm, impressions can also go up if users keep going back to look at it or share it with others.
As a metric, impressions are most useful when you observe it in relation to other metrics like follower count, reach, or engagement.
For example, a level of impressions that corresponds with or exceeds your follower count is a good sign that your brand’s content is being well-distributed to and seen by your followers. Drops in impressions could suggest that the platform no longer shares your posts as frequently as before or that your audience is no longer actively seeking out your posts.
3. Reach
Reach is a metric that measures the number of unique users (i.e., individual people) who have seen your post.
Like impressions, reach is dependent on the social media algorithm feeding your post to users on the platform, as well as organic sharing from user to user. Unlike impressions, though, reach does not count multiple views by the same user. So, if your LinkedIn status was seen 100 times by 80 users, then its reach would simply be 80.
Considering one of the primary uses of social media is to connect with your audience, reach is essential to track. Compared to impressions, reach is a more accurate measure of how many people have encountered your brand’s content, which is especially helpful if you’re focused on boosting awareness.
Additionally, since your reach can change based on when and what you post, you can track this metric in order to figure out when are the most optimal times to reach your audience and what kinds of content they enjoy most.
4. Mentions
Mentions refer to the number of times a particular brand (or product, topic, industry, etc.) is mentioned on social media.
Keeping track of this metric is a critical part of social listening, which is when you monitor and analyze online conversations that are relevant to your brand. After all, the impact of social media goes beyond what your brand posts. It includes user-generated content (UGC) where consumers mention you.
Mentions are important to track if you want to boost the visibility of and conversation around your business on social media. Generally, the more people talk about you in a positive light, the better. Most brands dream of regularly seeing a high volume of positive mentions.
Of course, what’s considered “high” is relative. If your mentions have consistently been at zero and then suddenly bumped up to one, then that’s a big deal! If you saw 100K mentions in the last 30 days while your competitors had more than 500K, then you clearly have room for improvement.
That’s why it’s important to establish benchmarks against which you can compare your own data. Keep track of your past performance to see if your numbers are improving. Assess how large your share of the conversation is by observing your competitors’ mentions with social analytics tools.
5. Potential Reach from Mentions
Beyond mentions, you can also take a look at your potential reach from mentions. As the name suggests, this refers to the potential number of people that your brand could have reached because of posts that mentioned you.
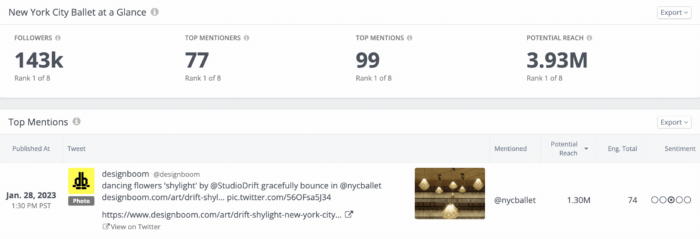
The simplest way to calculate potential reach from mentions is by adding up the follower count of each account that mentioned your brand. For the New York City Ballet below, its potential reach from Twitter mentions within the last 30 days was a whopping 3.99M, which was notably bolstered by a mention from Design Boom, which has 1.3M followers.
Think of this metric as an extension of your own reach, which isn’t limited to just what you put out online but includes activity from the countless other users on social.
6. Engagements
If you asked us what makes social media so special compared to other marketing channels, the answer would have to be engagements. Without the social interaction aspect, these social media platforms would consist of just one-way communication like TV ads or billboards.
Engagements, which are social media interactions such as likes, comments, shares, etc., validate that your audience is actually paying attention to what you post. They provide insight into how your audience feels about your brand and content, as well as strengthen the relationship between you and your customers.
To get a better idea of what kind of insights engagements can provide, let’s look at the three subsets of engagements: Applause, Conversation, and Amplification.
Applause Engagement (Likes and Reactions)
The first type of engagement to know is applause engagements, which are interactions such as likes and reactions. Applause can tell you about the quality of your content. For the most part, a user liking your post is a show of support and positive interest.
You can compare the likes of each post you publish to get an idea of what resonates most with your audience. Is a particular TikTok racking up more likes than all of your other videos? Maybe it’s time to lean into that type of content more!
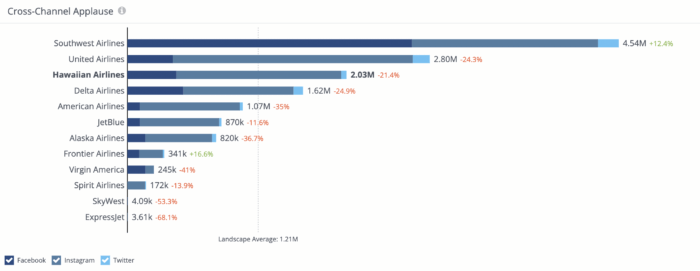
You should also benchmark your applause engagements against your competitors. How do you stack up against similar brands? Are you at least earning as much as the average of your industry peers? Competitive benchmarking data, like in the chart below, can provide you with more context on how well you’re doing on social and give you goals to reach for in the future.
Conversation Engagement (Replies, Comments, Quote Tweets, etc.)
Conversation engagements are the replies or comments that you get on your post. These are meaningful because they indicate a higher level of engagement (it takes more effort to comment than simply like) and clarifies whether the sentiment behind the engagement is positive or negative.
While conversation engagement is typically more difficult to rack up than applause, there’s no doubt that it’s an invaluable metric. Not only can you better understand how people feel about your brand and its content, but comments and replies present an opportunity to actively engage with your audience and build that customer relationship.
Want to boost the amount of conversation engagement you’re getting? Create content that encourages active responses, such as by asking your viewers questions or for them to share their own stories. Look to your competitors and observe what the brands with the highest level of positive conversation engagements are doing.
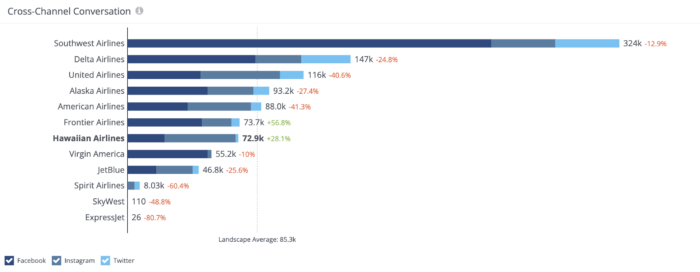
Conversation and applause are not directly tied so don’t assume the rankings will be identical. Hawaiian Airlines, for example, garnered impressive levels of applause compared to industry peers in the chart above but ranked lower when it comes to conversation engagements (below).
Amplification Engagement (Shares, Retweets, Reposts, etc.)
Finally, amplification engagements are when a user shares, retweets, or reposts your content. This type of engagement is powerful because it boosts your brand exposure. Your audience isn’t simply liking or commenting on your post. They’re actively sharing it with their own network of followers, initiating a snowball effect in which your reach is amplified.
While most social platforms will report how much amplification a post gets in the native app, you can use your social analytics platform to get a total number based on all of your posts within a given period of time. With some platforms, like Rival IQ, you can even contrast your data with the competition’s to see how you stack up.
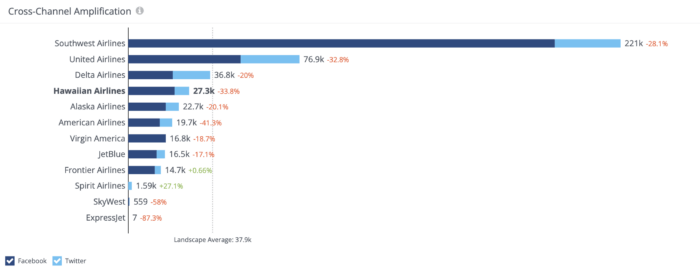
Additionally, you can use your amplification engagement data to see what types of posts are resonating most with your customers and tailor content around those topics. Do your followers tend to share tutorials? Article links? Infographics? Let your audience’s actions influence and shape your strategy.
7. Engagement Rate by Follower
Engagement rate by follower is a metric that measures the number of people who have engaged with your brand’s posts. Expressed as a percentage, it’s calculated by dividing the total number of engagements on your post(s) by the number of followers you have and then multiplying that by 100.
Engagement Rate by Follower = (Total Engagement / Follower Count) x 100
Engagement rate by follower is important for competitive benchmarking since it takes into account how many followers each account has. In other words, it’s a much more comparable metric than just total engagement.
For instance, if you simply compared your 10K monthly engagements to a major brand’s 100K monthly engagements, it may seem like you’re doing poorly. When you take into account the fact that you only have 50K followers compared to the other brand’s 1M followers, though, your level of engagement is actually quite high. Your engagements were equal to 20% of your follower count while the major brand’s engagements equated to only 5% of its audience size.
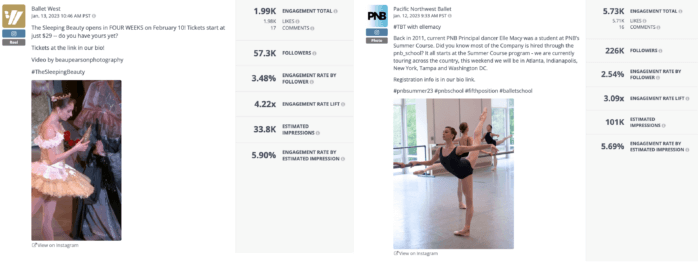
You can see this play out in the below Instagram posts from two ballet companies. While Pacific Northwest Ballet garnered more than double the number of engagements that Ballet West did, the engagement rates by follower suggest a different story. Ballet West’s post seemed to have resonated with a greater percentage of its followers than Pacific Northwest Ballet’s.
Engagement rate by follower can also be used to assess the performances of your own posts. What is your average engagement rate by follower? Which posts have exceeded that? What kind of content trends do you notice among your posts that have performed well? Use those insights to optimize your content strategy moving forward.
8. Social Media Sentiment
Social media sentiment refers to how positive or negative the online conversation surrounding your brand is. Going beyond the number of mentions, replies, and comments, sentiment measures the emotion behind each post or reaction. After all, not all attention is good attention.
Case in point, a paid partnership video from TikTok creator Mikayla Nogueira recently went viral for all the wrong reasons. With 51.8M views — her most-viewed TikTok in the past nine months — and 1.52M engagements, the numbers seemed promising. A dive into the sentiment of the comments, though, revealed that most were accusing the creator of using fake lashes to show off the mascara’s effect.
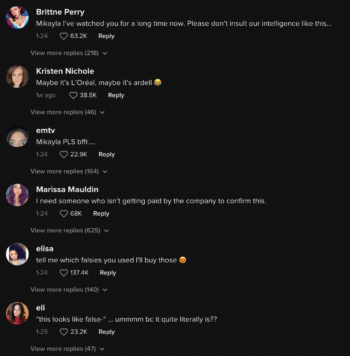
As demonstrated, tracking sentiment gives you insight into how your audience truly feels about what you’re posting. That information can then help guide the types of content you create. It can also reveal how people feel about your brand in general, which is essential knowledge for improving or maintaining your brand reputation and resolving any customer issues.
While you can certainly track sentiment manually, it’s most commonly measured by natural language processing technology used by social analytics platforms. Put simply, these platforms will automatically analyze the words in various posts or comments and give them a sentiment score based on how positive or negative it is.
To get your overall social media sentiment, you can look at the ratio of positive posts to negative posts on social media. When this ratio is high, it means that there are more positive than negative posts about your brand. If this number is low, then it means that there are more negative than positive posts about your brand.
9. Click-Through Rate
Click-through rate (CTR) is a measure of how many people clicked on a link that you share on social media.
Through the use of unique links and tracking tools, you can collect data on the number of clicks a link gets and then use it to calculate your click-through rate. To do this, divide the number of clicks by the number of impressions and multiply by 100. For example, if a LinkedIn update with a link to your website gets 100 impressions and 20 clicks, then your CTR would be 20%.
Click-Through Rate = (Total Clicks / Total Impressions) x 100
Ideally, the links you track are tied to your business goals. In other words, clicking the link leads up to an action that you want your audience to take, which could be making a purchase through your online store, signing up for an event, filling out a survey, or anything else that’s relevant to your goals.
By tracking the CTR of those links, you can measure how effective your social media strategy is at driving traffic from one place to another. If your CTR is low, then it means that the content you’re sharing isn’t compelling enough for people to want to click through. If it’s high, then that means people are interested enough to access the linked page. You can research industry benchmarks and monitor your performance to get an idea of what’s a “good” CTR for you.
10. Conversion Rate
Conversion rate goes beyond a clicked link and looks at the number of people who actually follow through with the action you want them to take. In other words, it’s a measurement of how many people who engage with your brand on social media are converted into customers, subscribers, attendees, etc.
To calculate your conversion rate, take the number of people who took an action, divide it by the total number of visitors who saw that action, and multiply by 100. So, if 1,000 people clicked on the newsletter subscription link that you tweeted and 200 people actually subscribed, your conversion rate would be 20%.
Conversion Rate = (Conversions Total / Unique Visitors) x 100
Whether you’re trying to get people to sign up for your newsletter, download an eBook, or purchase your product, the conversion rate is how you know whether your efforts are paying off and is a key metric for understanding your return on investment (ROI).
Determining a benchmark to compare your conversion rate against can be tricky since there are multiple types of conversions that companies go for. (You can’t exactly compare your conversion rate for newsletter signups to the average conversion rate for eCommerce sales, after all.) Still, doing some research on industry benchmarks can provide helpful context as you track and assess your own performance.
Wrapping It Up
By tracking these top metrics, you can turn the clutter of social media data into actionable insights. Just remember to focus on what matters to your brand and measure your performance against benchmarks that are relevant and appropriate to your business goals. Use the insights you gain from these metrics to optimize your social content, strengthen your relationship with customers, and make data-driven decisions for positioning your company as a leader in your market.