If social media is essential to your business success, you must perform a social media competitive analysis to learn how your competitors market and how your performance compares.
Every social media professional knows that the best social media strategies are rooted in data. Whether you’re looking to improve the ROI of your social media or to earn buy-in from your company leadership, putting in the work to back your plan with data will pay dividends.
Luckily, performing a social media competitive analysis doesn’t have to be complicated. This post will make your job easy, and our reporting template will help you look amazing.

Free social media competitive analysis template
Download nowHow to Perform a Social Media Competitive Analysis in 9 Steps (With Examples)
Before you get started, grab your copy of our free social media competitive analysis template.
We’ll walk through an example of creating an entire social media competitive analysis using our template. Our example brand for this walkthrough will be the beauty brand Laneige, and we’ll use a set of nine other brands from our Beauty landscape as the comparison set for our analysis.
Step 1: Identify your competition
The first step in completing a social media competitor analysis is building a set of competitors. Of course, you probably know your key competitors, but if you don’t, here are a couple of ideas for finding some comparisons:
- Google search your brand name to look for other companies advertising against your brand.
- Google search for your main product to look for other companies.
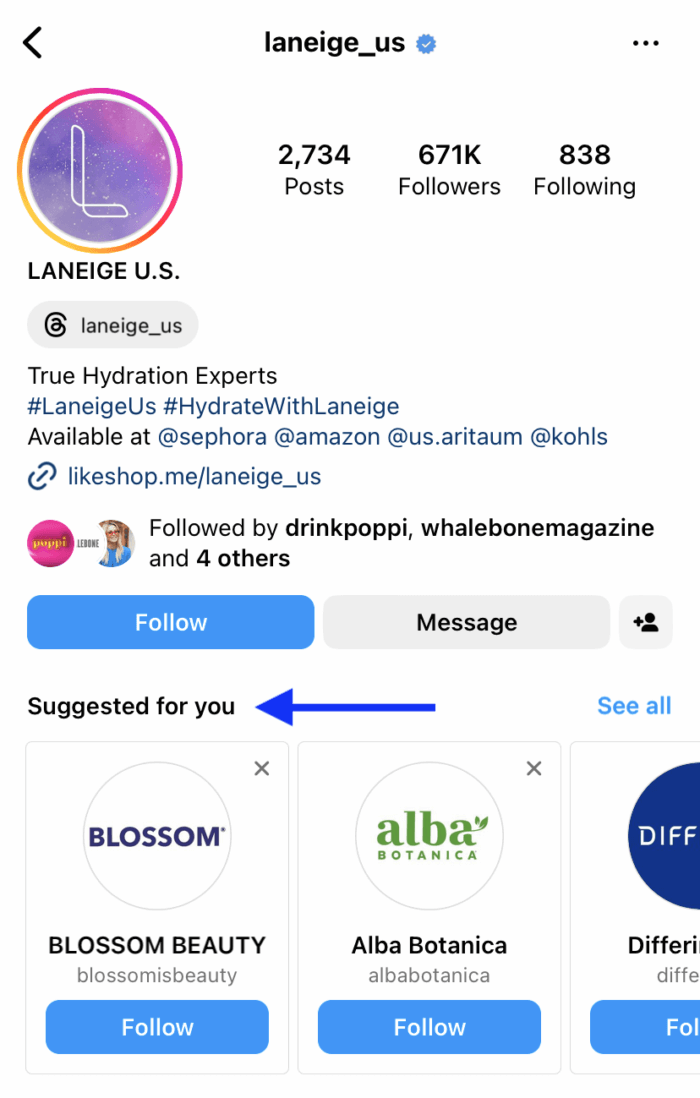
- Use your profile page on Instagram or Twitter (X) to look for recommended other accounts to follow.
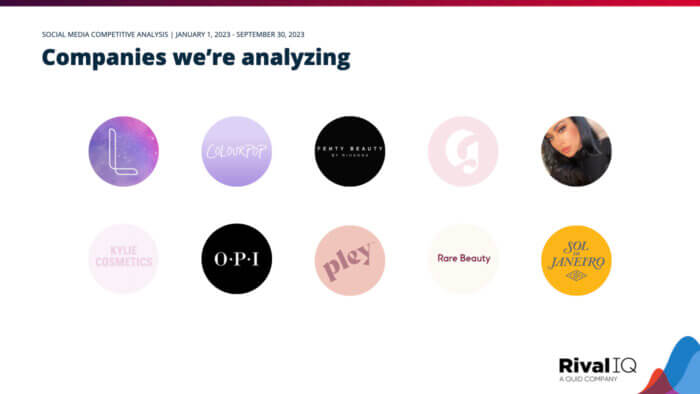
With Laneige as our example brand, we’ve built a competitive landscape using the top 10 beauty brands on social media. The competitive set for this analysis includes nine other beauty brands including Glossier, Rare Beauty, and Sol de Janeiro.
Step 2: Determine active social media channels
Now that we have our competitive set, we need to determine which social media networks to include in our analysis. Using the data from our landscape, we’ll review average performance for audience, activity (posting frequency), and engagement to determine where to focus.
Note: For the rest of this example, we’ll perform our analysis using six months of data. We’d recommend using at least three months of data. Of course, using less will work, too, but keep it to at least 30 days’ worth of data.
Using our analysis of Laneige, we can see that Instagram is the dominant channel for the brand with 631K followers — nearly twice as much as its second-biggest channel, TikTok.
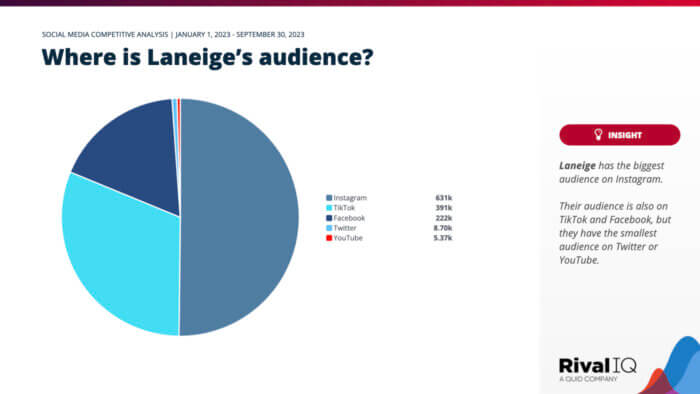
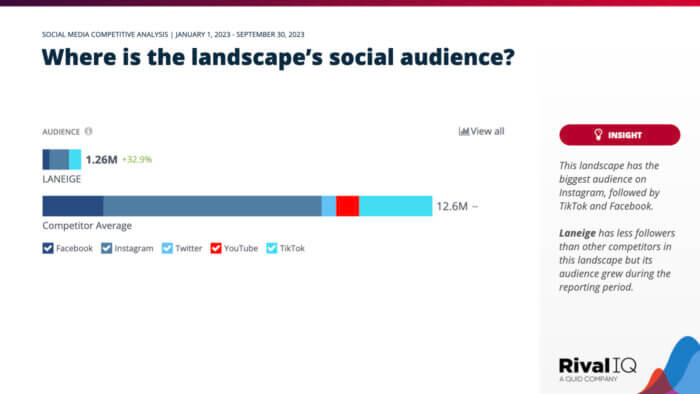
How does that compare to the competition? Instagram is also the channel with the biggest audience for Laneige’s competitors, followed by TikTok and Facebook. While Laneige has fewer followers overall than the competition, its audience grew by over 32% during the six-month reporting period.
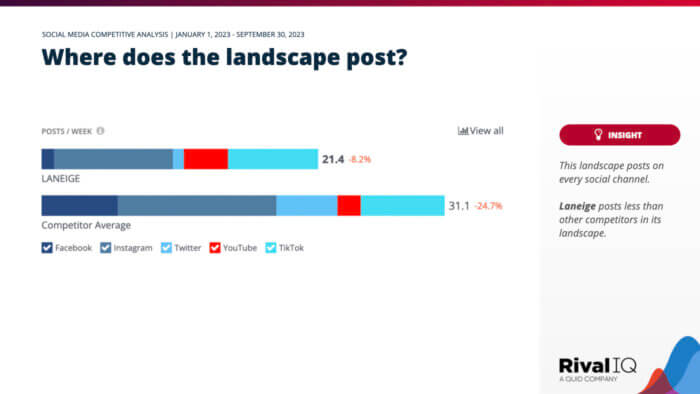
Next, we can use activity metrics to understand where our brands invest their time. This should align with the channel(s) where their audience is most active and engaged.
The slide below shows that the average beauty brand in this landscape is posting about 31 times per week across channels. About 40% of those posts are going on Instagram, followed by TikTok at 20%. Laneige also spends most of its time posting on Instagram at 43% and TikTok at 32%.
Step 3: Conduct positioning analysis
Next is positioning analysis. Positioning analysis helps you understand how competitors position themselves so you can identify any opportunities for your brand to stand out.
Reviewing the language you and your competitors use to describe your brand will inform how you craft and refine that positioning. A good way to do this is by analyzing the social bios of similar brands.
Let’s look at all of the Instagram bios for the competitive landscape we put together:
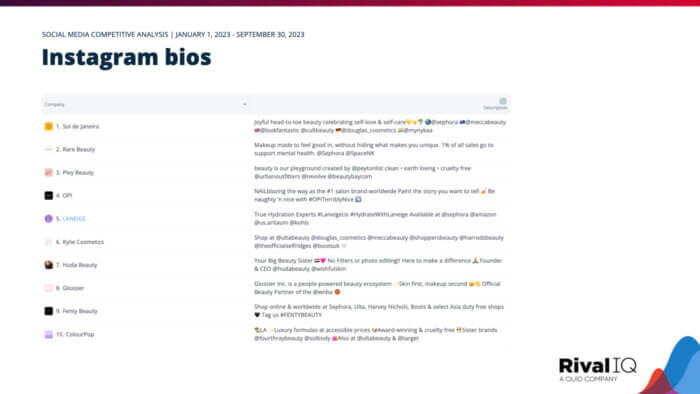
We’ll start by looking for a few key items beyond which words these brands use to describe themselves. Specifically, we’ll examine hashtag usage, emojis, and references to other platforms. If you’re looking for the best tips and tricks for writing your bios, definitely read How to Write an Effective Instagram Bio.
Only three of the brands, Laneige, Fenty, and OPI, use a hashtag in their bio. Typically, brands want users to use their core brand hashtags, and putting them into your bio is an excellent way to let your fans know what to do.
Next, let’s look at emoji usage. Seven of the ten brands we’re examining use emojis, not including Laneige. There isn’t a pattern or common emoji used among these brands — there are varying shades of hearts, a few flags, and a smiley face, to name a few. This could be a good sign that each brand has a unique voice and tone that resonates with its audience. Laneige has an opportunity to add a unique emoji that represents its brand voice and is relatable to its followers.
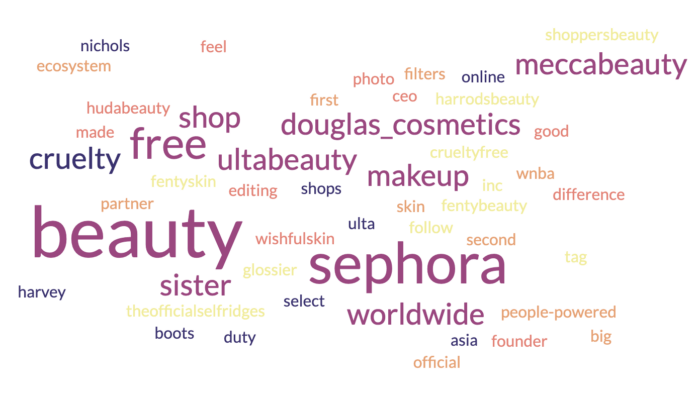
As for references to other platforms and accounts, almost all of the brands reference accounts for retail brands like Sephora, Ulta, and Target. Using a free word cloud generator, we can confirm that specific stores are some of the most used terms in these beauty brand bios. Many of these beauty brands, including Laneige, mention in their bios where people can buy their products so followers instantly have that information.
Step 4: Gather channel-specific metrics
To understand how your brand compares to similar brands on social, let’s dig into various benchmarks and metrics around social audience, activity, and engagement.
Each social network has its own feel and required strategy, so when conducting your competitive analysis, go channel-by-channel in this section to get the broadest picture possible of their social performance.
For each channel, review followers, posting frequency, engagement totals, and engagement rates.
Let’s start by taking a look at the key Instagram metrics for our example brand, Laneige. In the slide below, we’ve included three key pieces of information: Laneige’s performance on these key metrics, how Laneige’s performance has changed over time, and competitive benchmarks for each of these metrics.
As we mentioned earlier, we can see that Laneige has a smaller following than the other beauty brands in this competitive set. On a positive note, their following is growing at a 31% rate.
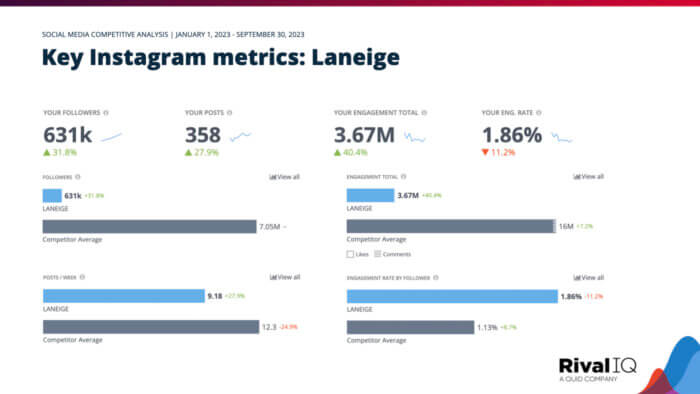
With posting about nine times a week, Laneige comes in a little less than the landscape average of about 12 times per week. Notably, in addition to increasing their posting frequency by nearly 28%, Laneige also saw a 40% increase in total engagement.
For engagement rates, the landscape average increased by about 8.7%, while Laneige’s engagement rate dropped by a little over 11%. Noting these differences in performance between your brand and the landscape benchmarks is precisely why we do these types of analyses.
After examining Laneige’s social performance against the landscape in Rival IQ’s Custom Dashboards section, we can use competitor-level metrics to see exactly how Laneige ranks and to find examples of brands that are worth studying more because they’re outperforming the rest.
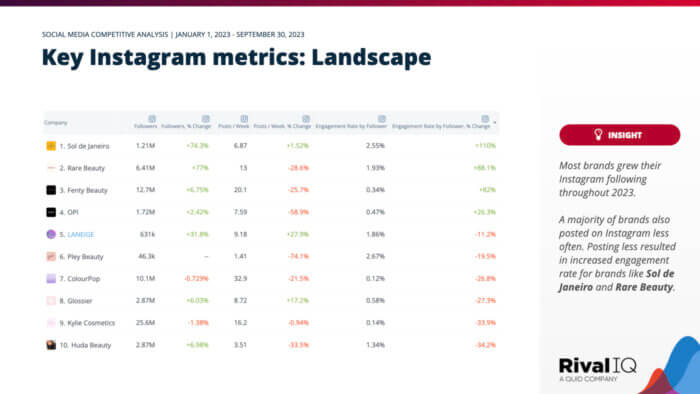
In the slide above, we’ve included follower, posting, and engagement rate metrics, along with the relative change on a brand-by-brand basis. This chart is sorted by the percentage change in engagement rate, from highest to lowest. You could choose to include other metrics, like engagement totals, comments, or more.
There is a tradeoff on having too many or too few metrics, so remember to try and keep things focused.
Step 5: Review best and worst-performing content
Now that we’ve reviewed metrics and hashtags, let’s focus on some of the creative in the actual posts that drive the numbers. This step is where you’ll take a look at your brand’s top-performing posts on each channel, as well as the worst-performing posts.
To look at the top-performing posts from a competitive perspective, it is easier to see what a brand is working toward if you analyze the posts one company at a time. Of course, we all know it helps to have on-brand, thumb-stopping shots to drive engagement on Instagram. Researching a brand’s best and worst-performing content will give you insights into what works well, regardless of brand.
Ready to start your analysis?
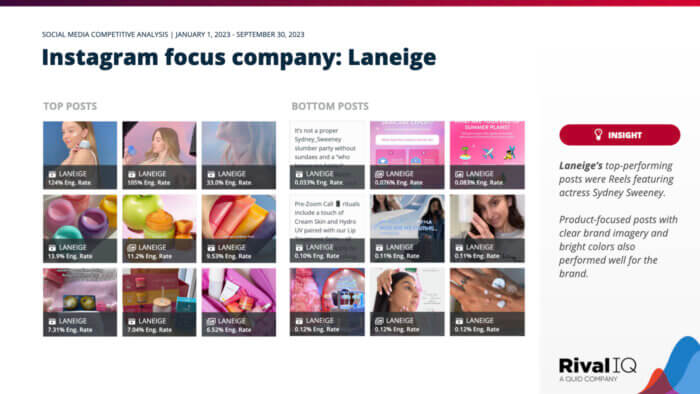
To begin, let’s start with our focus brand, Laneige. Below, we’ll see their top and bottom nine Instagram posts during the reporting period.
Laneige’s top three posts were Reels featuring actress and brand partner Sydney Sweeney. Star-studded content always stands out on Instagram, so it’s no surprise that these posts’ engagement rate was well above the brand’s average of 1.86%. Two of those Reels were also the top two posts for the entire competitive landscape, which is worth noting in the analysis.
The rest of the brand’s top-performing posts had cohesive brand imagery and showcased clean visuals of the product. Bright brand colors also made it easy to stand out and be recognizable in the feed. A majority of the top posts were also Reels. Post type is something to make note of, which we’ll go into in more detail below.
Looking at top-performing content is only half of the story. Finding patterns in the content that doesn’t get engagement also yields clues as to campaigns that could be improved.
We see Laneige’s nine lowest-engagement posts on Instagram have a different feel than their best-performing content. These all performed below the brand’s average of 1.86% and even below the median engagement rate of 0.19% on Instagram for beauty brands.
There are no clear visuals of the product and the imagery and text overlays don’t match the rest of the brand’s content, making it difficult to identify in a busy feed.
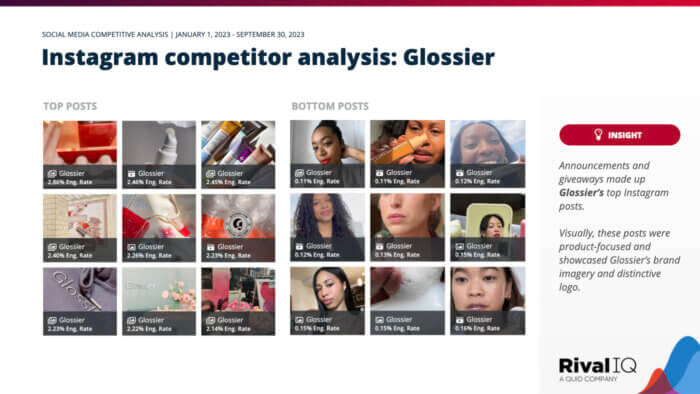
You can do the same content analysis for as many brands in the competitive set as you’d like. Here’s an analysis of one of Laneige’s competitors, Glossier.
Step 6: Identify popular topics
Though the images in our posts are a huge factor in determining their success, the words that we use to connect with our audience matter, too.
Staying with our trend of examining social engagement on Instagram, let’s look at how to reveal high-engagement topics by reviewing the most popular phrases within this beauty brand landscape. This step is to help you identify which topics your brand and your competitors not only used the most but were the most engaging.
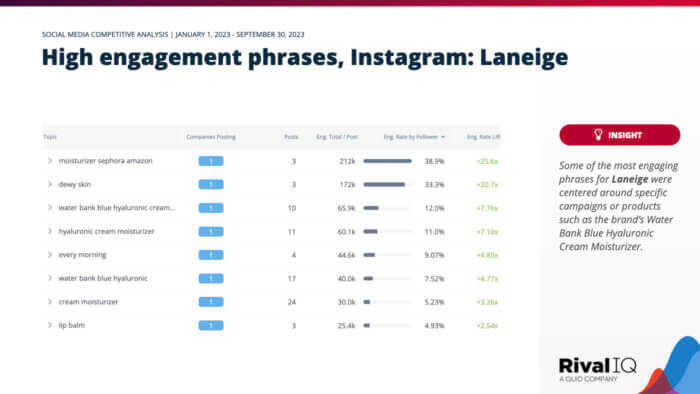
We’ll start out looking at the words Laneige is using in their posts using Popular Topics within Rival IQ.
For Laneige, these were the topics that generated the most engagement for the brand on Instagram. We can see that one of the brand’s specific products, the Water Bank Blue Hyaluronic Cream Moisturizer, generated the most buzz which makes sense since it was part of a major brand campaign this year.
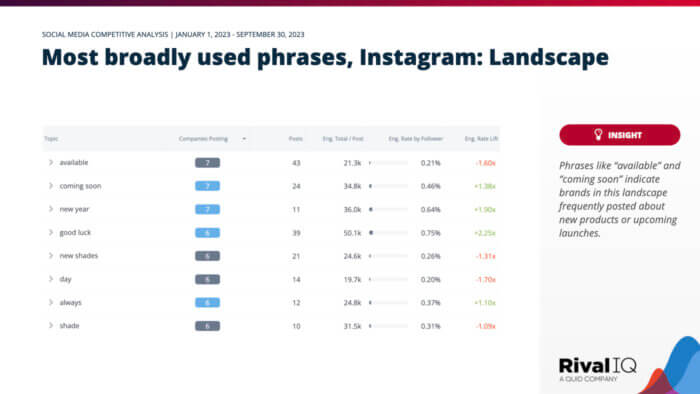
If you’re looking for trends and tactics in your competitor analysis, one easy way to find them is to look at phrases and topics that several brands are using.
These were the topics beauty brands used the most on Instagram for the reporting period. Words like “available” and “coming soon” indicate these brands often posted about new products.
Step 7: Analyze hashtag engagement
Similar to analyzing popular topics, you’ll also want to take a look at frequently used hashtags among your competitors.
Hashtags help users on social media find content related to a specific topic or theme. Brands also use hashtags to help users show their affection or affinity for a particular campaign. Using the right hashtags also is vital for helping users who aren’t in your audience discover your brand.
In performing a competitive hashtag review, we’re looking to understand how content using different hashtags performs and to learn if there are hashtag opportunities we’re missing. Also, studying hashtags can reveal competitive insights about our competitors’ campaigns.
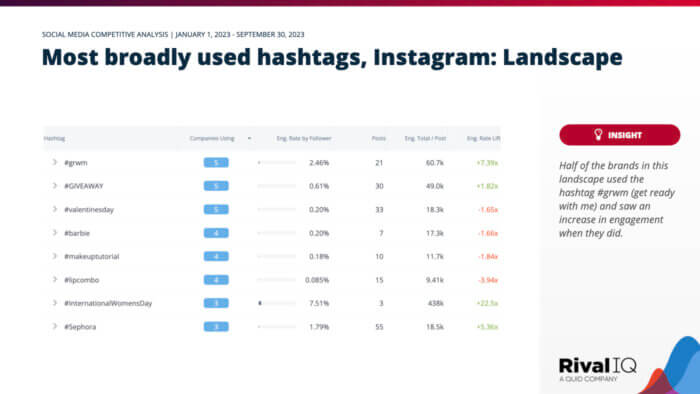
To start, let’s look at the most broadly used hashtags on Instagram by the top beauty brands on Instagram. Some of the most frequently used hashtags include #grwm (get ready with me), #giveaway, and #valentinesday. The hashtag #InternationalWomensDay earned a 7.51% engagement rate, yet only three companies used it.
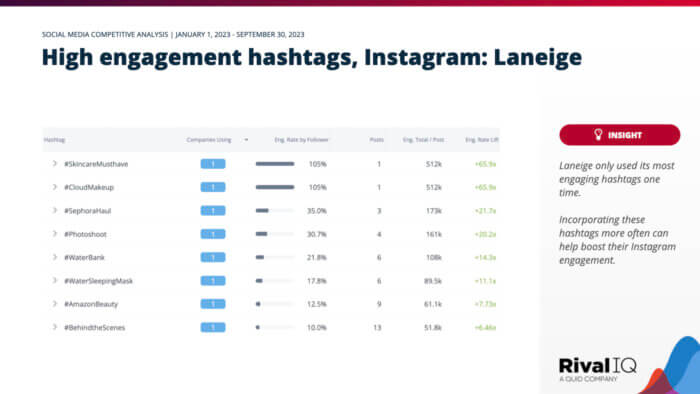
Now let’s look at how Laneige is using hashtags on Instagram. Some of the brand’s most engaging hashtags include #SkincareMusthave and #CloudMakeup, each with a whopping 105% engagement rate. Other high-performing hashtags for the brand include #SephoraHaul at 35% and #Photoshoot at 30%.
Though these hashtags performed well above the hashtags used by the overall landscape, Laneige only used some of them one time. The takeaway? Analyze your high-performing hashtags and incorporate them more often when they make sense with the post.
Step 8: Analyze specific post types
The types of media that you post on social media matter. Depending on the platform, the topic, and the audience, you’ll want to ensure you’re posting the right mix of content.
One sure way to understand how your post types affect your engagement is to break down your analyses by post type. We’d urge you to always do post-type analysis on a channel-by-channel basis. No two social platforms are the same, and mixing channels in your analysis will lead to confusion.
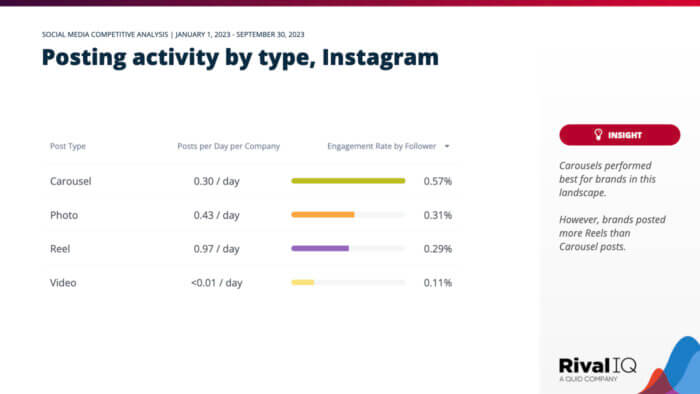
Below, we’ll look at a post-type breakdown for Instagram posts for this landscape. The first thing you’ll note is that Carousels performed the best for beauty brands on Instagram. Photo posts and Reels had similar engagement rates, but these brands posted more Reels than any other post type. Using this data, Laneige and other beauty brands could invest more time into high-performing Carousels.
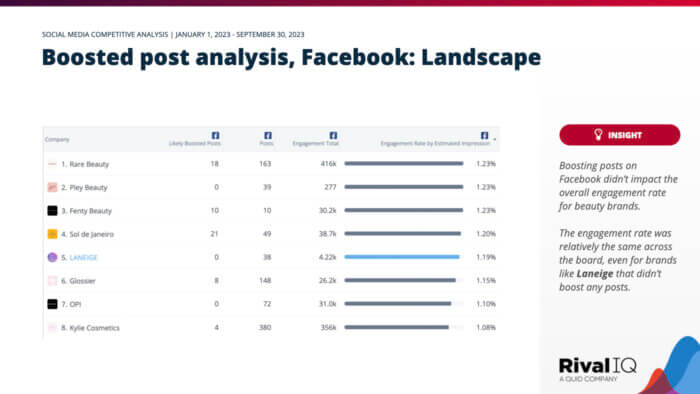
Step 9: Conduct a boosted post analysis
We can gain powerful insights by understanding how often our competitors boost their Facebook posts – and the topics they’re boosting. Using a tool like Rival IQ, we can analyze these boosted posts to see what really matters.
In the slide below, we see Laneige is one of only three brands that doesn’t boost posts on Facebook and those that boost aren’t seeing much difference from it. The engagement rate was relatively the same across the board, even for brands like Laneige that didn’t boost any posts.
Although this won’t be the case in every landscape, it’s helpful to know where your competitors are prioritizing their efforts and their dollars.
How to Use Your Social Media Competitive Analysis Template
After you’ve worked through the entire competitive analysis template, you should have a lot of juicy insights to dissect. Make note of key takeaways so you can start strategizing different ways to apply your findings to your social channels.
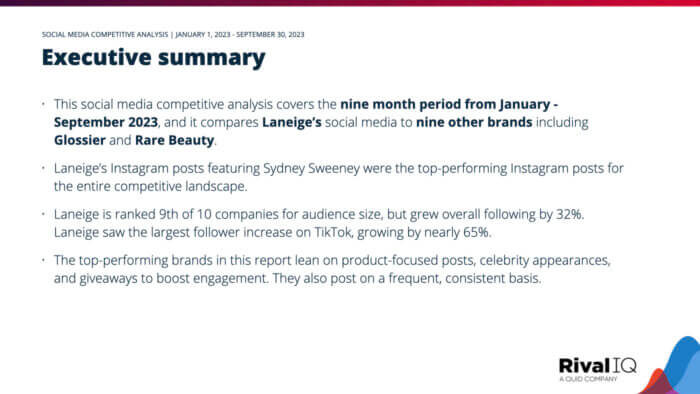
Before you share your results with your team, do everyone a favor: put together an executive summary. Describe the analysis, draw attention to key insights from your research, and highlight the next steps. This should help the rest of your team determine where they’d like to dig into your report most.
Keeping an eye on your competitors’ activity and performance on social should be a regular part of your social media routine. Benchmarking against similar brands provides more context into how your own content is performing and makes it easier to identify opportunities to stand out or improve.
How often you decide to conduct a full competitive analysis is up to you. We’d recommend doing this at least twice a year, so every six months. You can also conduct a competitive analysis every quarter or every month — but we wouldn’t recommend anything more than that as you need at least 30 days’ worth of data for the most accurate results.

You can use Rival IQ’s powerful competitive social media analytics to complete every part of what you’ve learned in this article. We offer a 14-day free trial, and we promise you’ll learn a ton about your industry along the way. Get after it!