Most businesses really look at metrics in an in-depth way at least once a quarter. It’s important to take that time to potentially adjust priorities, budgets or plans, as well as take a moment to recognize big wins or successes. Make sure you are part of that conversation with strong, metrics-driven marketing reports.
Rival IQ can help, and you can create stunning reports in literally minutes.
Follow these steps following the end of each quarter using Rival IQ:
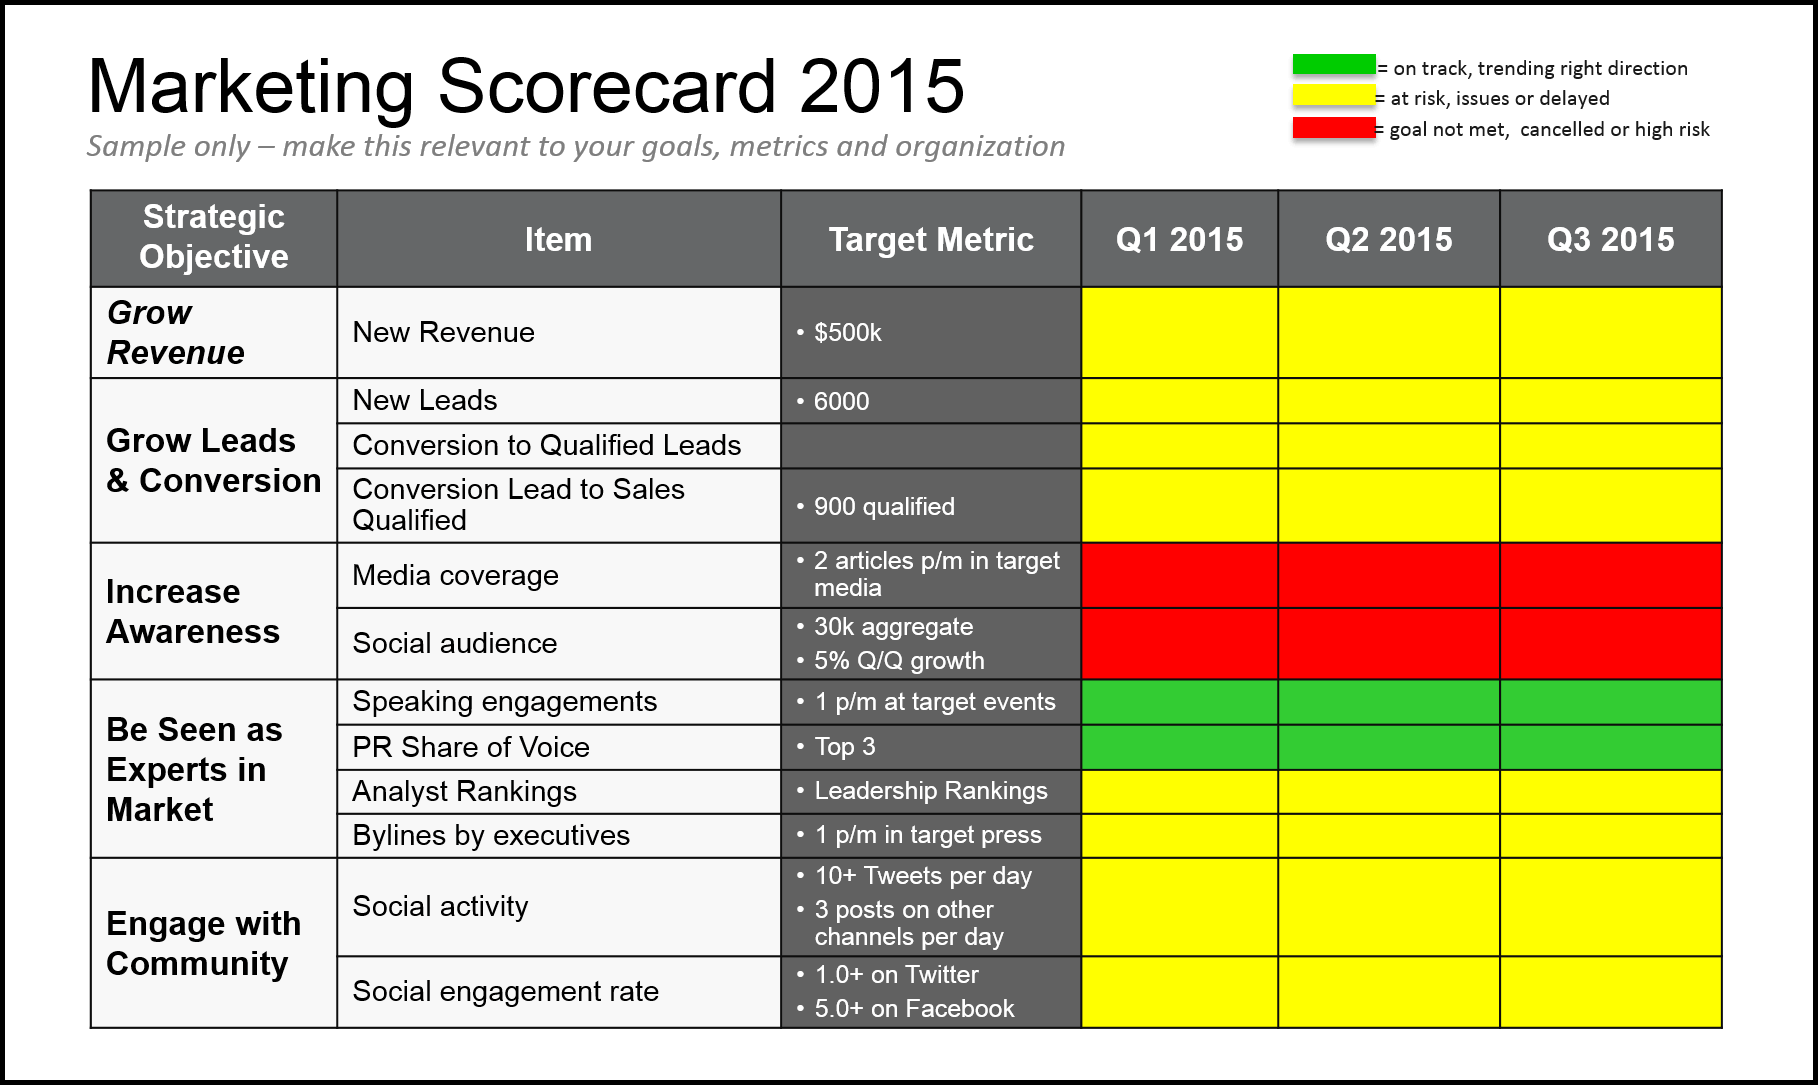
#1: Establish and Report Quarterly Metrics
If you haven’t create a scorecard and clear metrics for each quarter, then start now!! Use this quarter to establish metrics of success and goals for each quarter for the areas you are responsible for. Ideally, these metrics would roll up into the overall integrated marketing plan and scorecard.
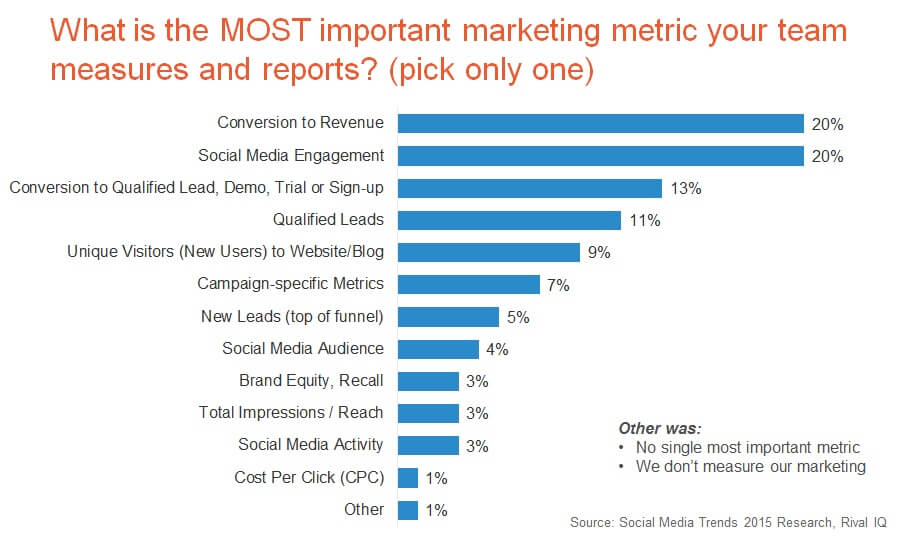
Based on primary research we conducted, conversion to revenue and social media engagement were the top two most important metrics for marketing teams to report on a regular basis. Social media activity and audience also ranked among those identified as the most important metric to measure and report. Make sure you understand what is important to your team, your executives and your business, and reflect those metrics in your quarterly reports.
#2: Show Quarterly Progress in Social Media
Goal: Illustrate marketing success, trends and quarterly updates
Outcome: Clear metrics, growth trends and successes to include in your marketing quarterly business review
Steps to take:
- Either use My Charts or select from one of Rival IQ’s many curated reports for one-click export: https://www.rivaliq.com/reports.
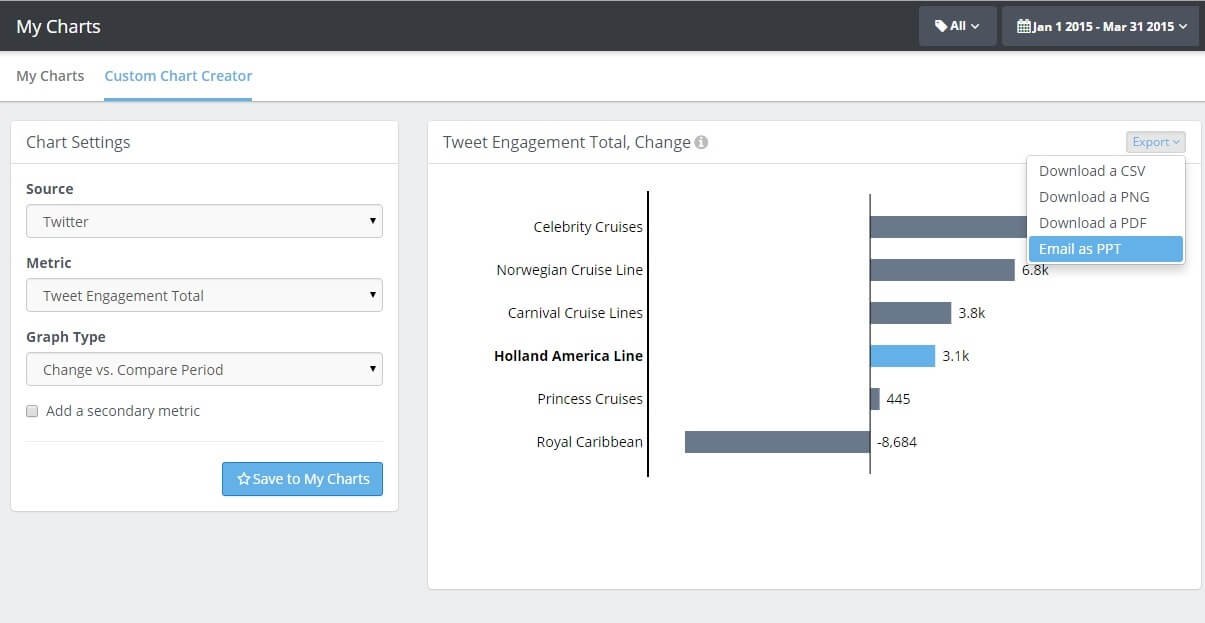
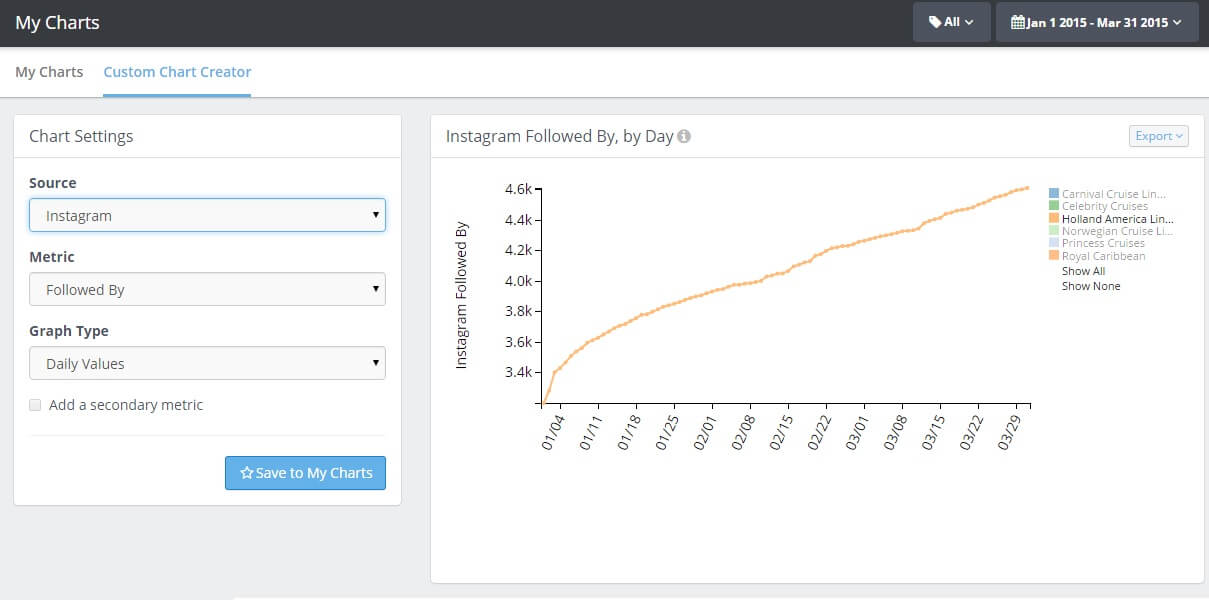
- If you haven’t yet created your own chart to show trending data, then go to Custom Chart Creator, set the date range to the last quarter, and pick the source, metric and graph type you want. For example, I show two custom charts below you can create and export in seconds.
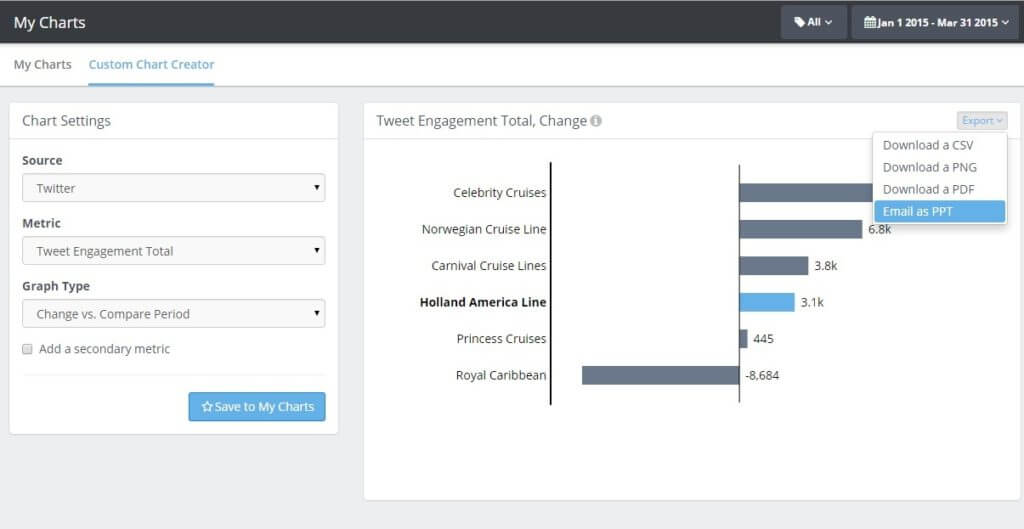

This custom chart shows how the total engagement for me and my competition has changed over the past quarter.


This is a great way to show follower growth for a specific channel, like this one for Holland Cruise Lines on Instagram!
- Set the Date Range to the past 90 days – or if you have a subscription level that supports custom date ranges, set the specific date range you want for the past quarter (e.g., January 1 to March 31).
- Click on the report you want to export, choosing from either channel specific reports or larger summary reports for all channels or all detailed metrics. If you haven’t seen all the easily exportable reports already curated in Rival IQ, check them out.
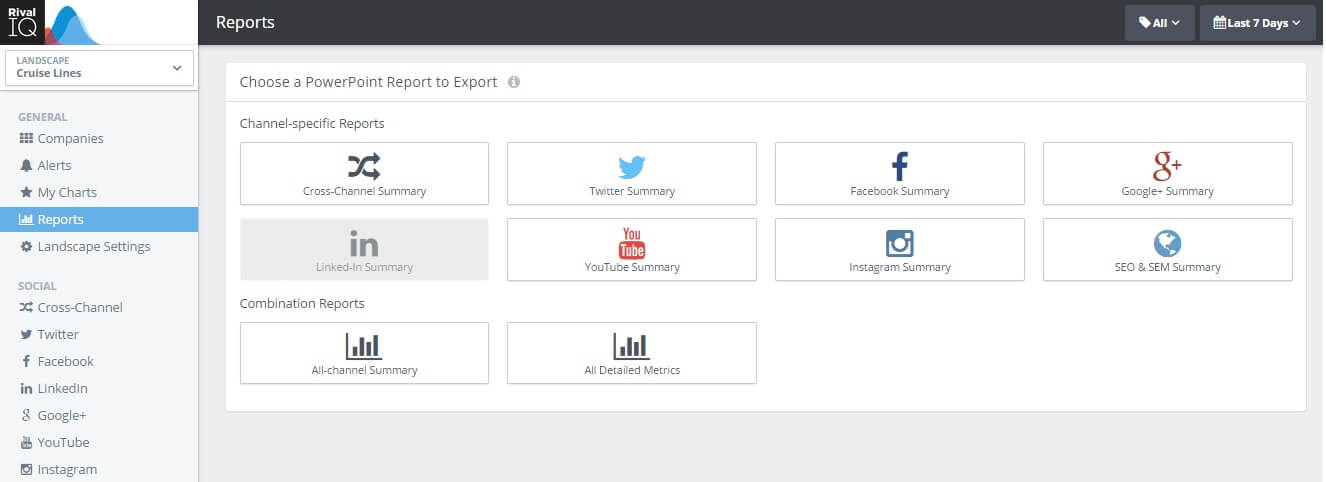
Under reports are all the curated report sets you can download in one click!
#3: Review Social & SEO Positioning and Make Recommendations if needed
Goal: Stay on top of competitive positioning and messaging and adjust your own positioning when needed.
Outcome: Be the source of competitive market positioning and show how you and your team are optimizing your positioning across social media and the web.
Steps to take:
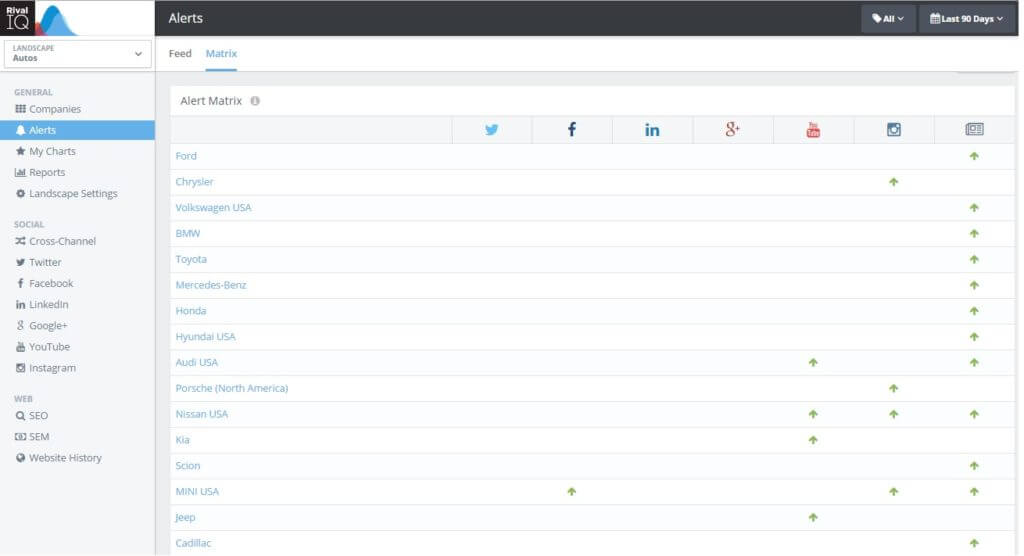
- Set your Date Range to Last 90 Days (or put specific quarterly dates in the custom date range selector).
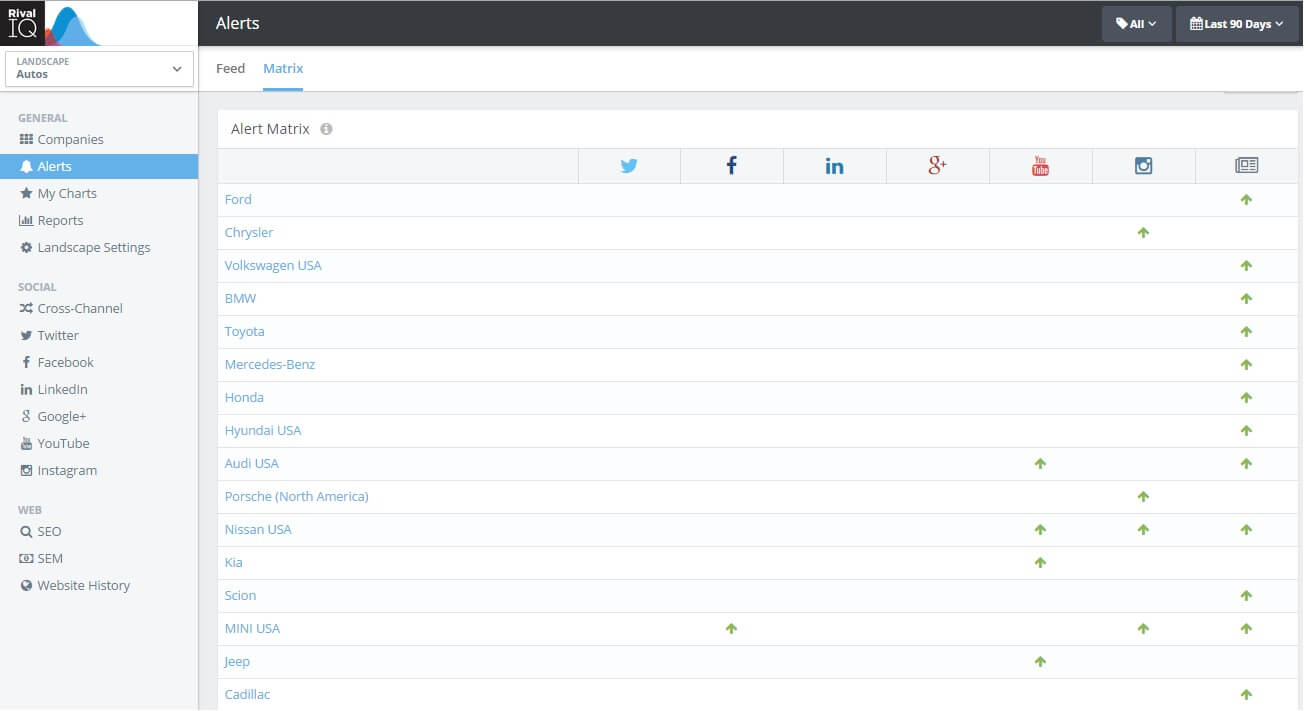
- Review the Alert Matrix to check on any positioning changes you will want to mention: https://www.rivaliq.com/activity.

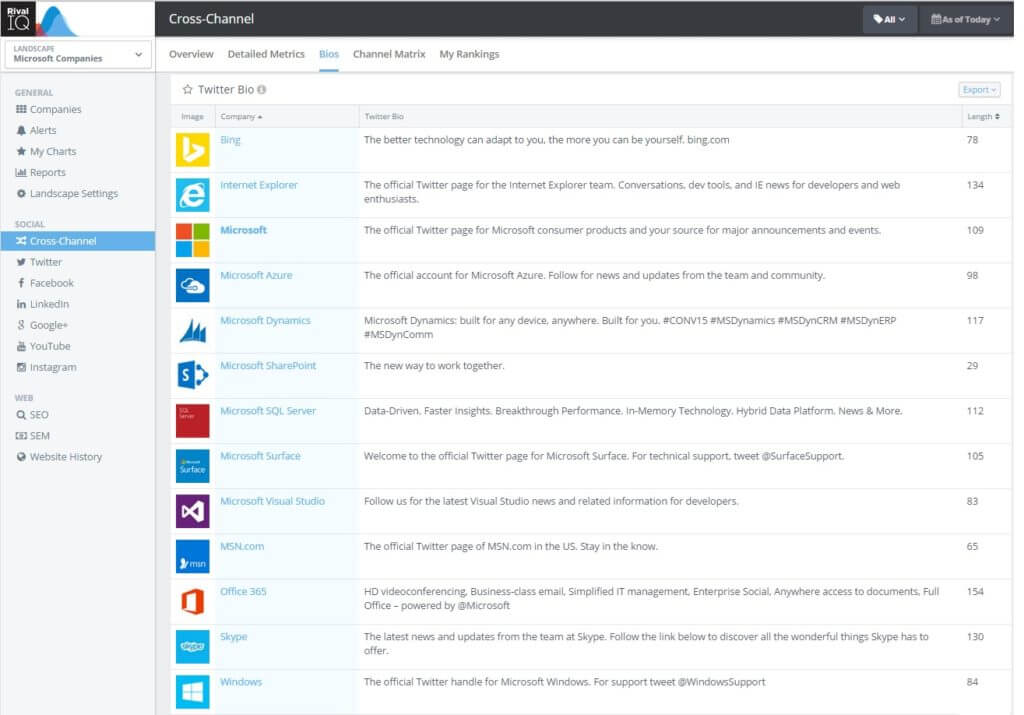
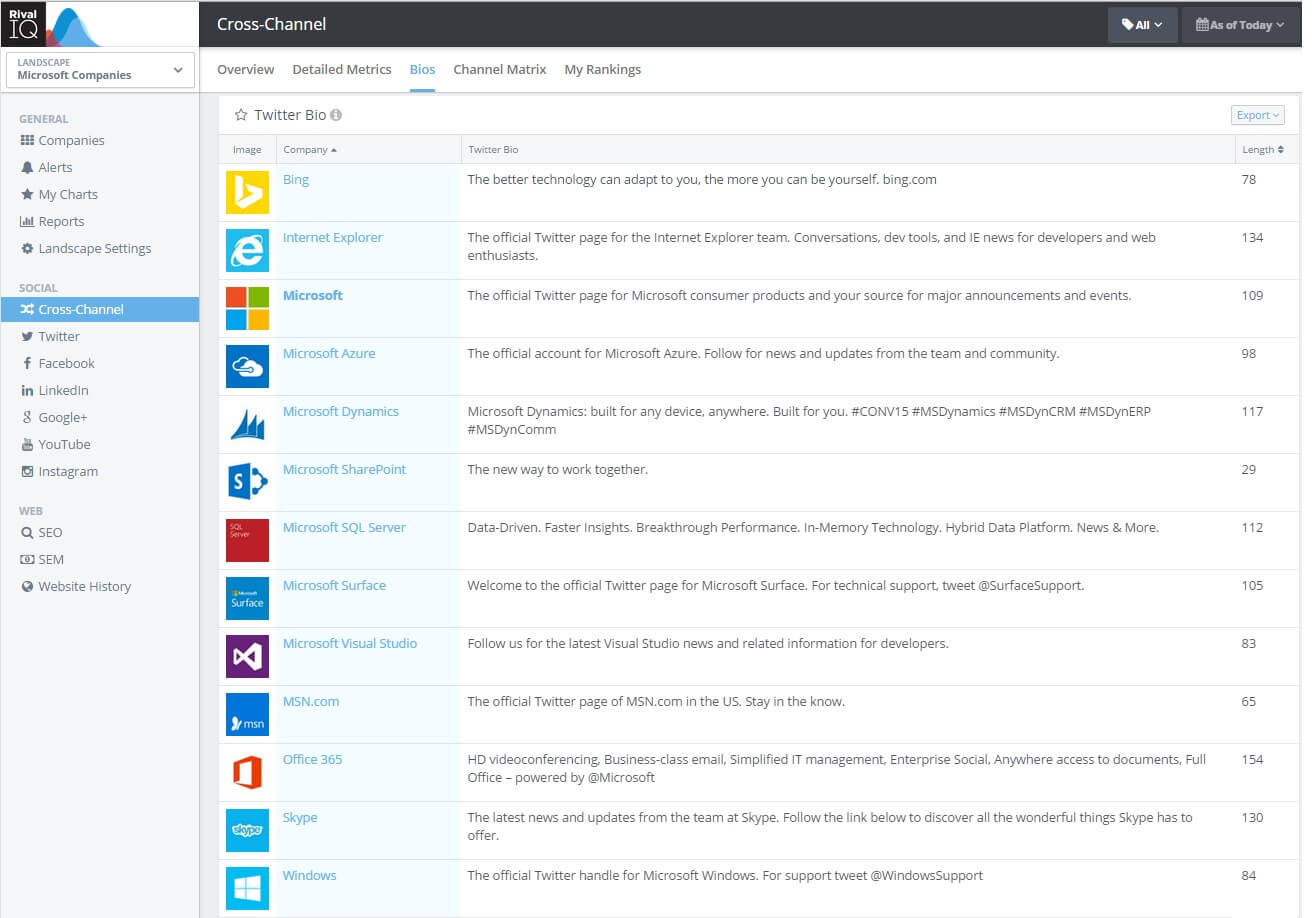
- Go to Cross-Channel Bios (Social Positioning): https://www.rivaliq.com/analyze#?category=social_positioning.
- Not only analyze competitive positioning but make sure you are doing your own brand and positioning audit. Are all your social channels consistent?

- Review and Export the positioning charts to PPT.
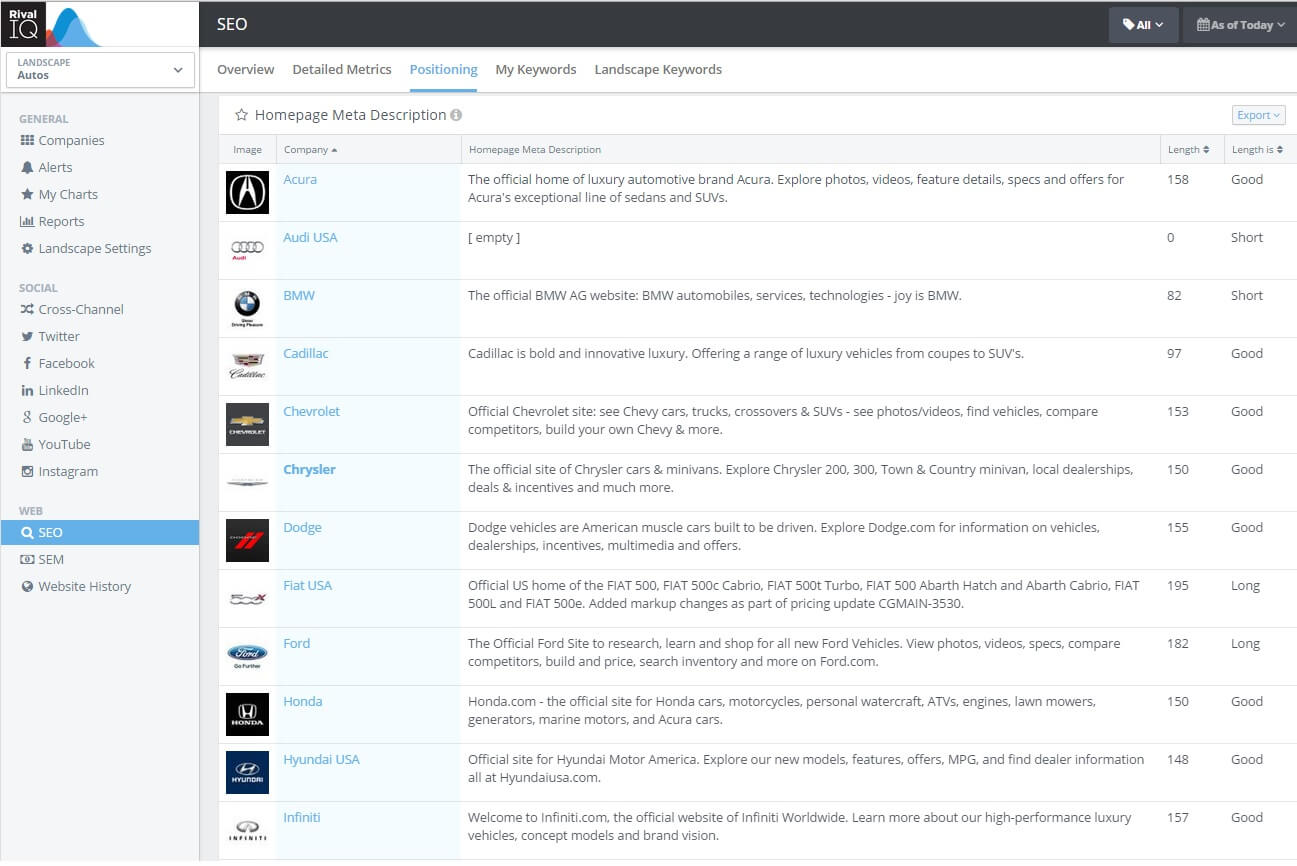
- Go to SEO Positioning: https://www.rivaliq.com/analyze#seo_positioning.
- Review and Analyze the competitive homepage titles and meta descriptions. See which of your competitors are still using keyword tags.
- Export the positioning charts to PowerPoint or PDF.
- Be sure to add any recommendations or strategic analysis to these slides as you finalize your quarterly report.
- For example, is positioning and bios on social and on websites all starting to sound the same across your competitive landscape?
- Do you need to differentiate more?
#4: Share Your Quarterly Report
Goal: Show how your strategies and tactics are working, communicate key trending data, provide competitive positioning and landscape metrics.
Outcome: Illustrate the strategic value of social media and content marketing and incorporate your analysis and metrics in the quarterly marketing and business review.
Steps to take:
- Create your quarterly Rival IQ report.
- Export the report(s) to PowerPoint or PDF.
- Include the Rival IQ charts with other marketing reports if needed.
- Create a one page overview slide talking about highlights, lowlights and next steps – and put at front of report.
Metrics Matter
Many marketers go through their work and never stop to measure what is working and what is not working or report on those findings. With marketing more data-driven than ever before, you need to take the time to identify key metrics of success for your marketing and organization and then report on those metrics on a regular basis. This builds credibility and trust, and it also gives you the power to ask for more budget, people or programs.
In addition to using Rival IQ to create awesome quarterly marketing reports, be sure to review our suggestions for daily, weekly and monthly workflow using Rival IQ.
Happy reporting!!