Post Tagging has been live in Rival IQ for a little over a month now, and we’ve had a blast seeing all the different ways you’re tagging your posts for even deeper social content analysis. (Especially that account with more than 6,000 tags–you go, girl!)
Post Tagging is for those of you who love experiments and wonder about everything all the time. Cats or dogs? Airplanes or boats? Coke or Pepsi? Now you can answer these questions quickly, definitively, and automatically in Rival IQ.
With a little creativity, it’s easy to supercharge your social content analysis with Post Tags for the ultimate flexibility in comparing the KPIs that matter most to you. Here are five of our favorite superuser Post Tagging ideas for when you’re ready to go beyond tracking hashtags and keywords.
(Need a primer on how to get started with Post Tagging? Don’t worry, we’ve got a full walkthrough for you.)
1. Track Your Influencer Successes
You’ve researched the influencers in your vertical and created your list. You’ve reached out to them and secured their posts, mentions, and contributions to your content. You’ve created a landscape in Rival IQ to track your influencers’ social activity. Now what?
Influencers are only as valuable as the awareness and engagement their posts about your brand earn. It’s really important for anyone with an influencer strategy to keep an eye on how influencers are talking about your brand and the buzz they’re generating. A little tagging can go a long way in figuring out how influencers are influencing your business.
By tagging every post that mentions your product and comparing it against a few other key metrics, it’s easy to see whether posts about your product are really resonating with your influencers’ followers.

Select only the tags you want to compare for fully customizable analysis.
To do this, I set up an Auto-Tag Rule on anything that mentions my product to keep an eye on my performance. I set up another Auto-Tag Rule for any posts with the hashtag #ad, which is a great clue for gathering all my influencers’ sponsored posts. I also tagged every post in the landscape using the “influencers average” tag for at-a-glance comparisons.
I can see that posts about my product are scoring more than 2x the average engagement from the influencers’ other posts, and more than 6x better than an average post. These stats are a sure sign that I’ve picked a strong set of influencers whose posts about my product are energizing followers instead of annoying them.
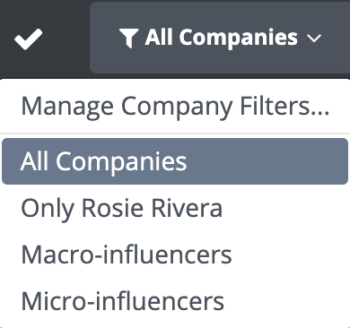
Toggle company filters to group your social data by micro- and macro-influencers.
Tracking what your influencers are talking about can be another great way to make sure your product resonates with their followers. Set up a few Post Tags covering common post topics like makeup, fashion, and travel below to take a look at the number of posts and engagement rate on each topic.

Pull out some common topics your influencers are discussing to track their post frequency and engagement in your content analysis.
Keeping an eye on these trends can go a long way towards keeping tabs on an influencer’s fit with your brand. If you’re a makeup brand and you notice a sharp decline in the number of posts about makeup from one month to the next, it might be time to have a chat with your influencer to make sure your partnership still makes sense and that your audiences and messaging still align.
2. Measure Your Campaigns
By seeing how your big seasonal campaign or product launches have gone year over year, you can see what works and what doesn’t to optimize next time around. Post Tags can help group these campaigns together for easy comparison.
A few years back, we profiled a fundraising campaign from local environmental nonprofit Forterra. We checked in on the results (spoilers: they met their goal!), and used Post Tagging to compare that fundraising campaign to a more recent Forterra partnership campaign with Fremont Brewing. The #FremontCANpaign is all about taking epic photos of Fremont Brewing cans in the wilds of Washington.
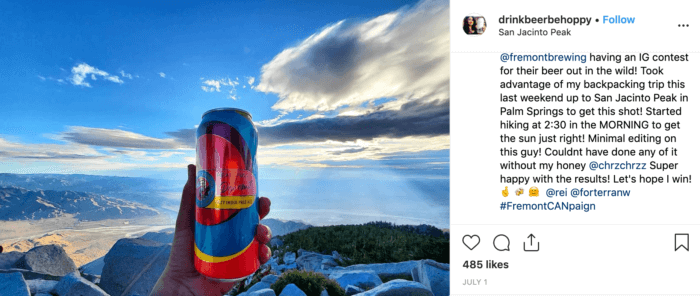
This post from #FremontCANpaign performed well.
Which posts resonate more strongly with followers: a campaign about saving a local trail, or a campaign about beer? The results may surprise you.

#savelakeserene performed more than twice as well as #fremontCANpaign.
I thought for sure that the magic recipe of giveaways+beer would make for a standout campaign, but the #savelakeserene campaign reigned supreme even in the face of a boozy contender. Forterra could easily expand this tag list to include other recent and historical campaigns to start tracking trends over time.

Ready to try tagging and analyzing your social posts?
Start a free 14-day trial3. Spot Visual Trends
You’ve already harnessed the power of Auto-Tag Rules, which can automatically comb for keywords on all current and future posts from you and your competitors (right?). Now that the robots are doing your keyword heavy lifting for you, it’s time to get creative by tagging visuals.

Tagging your posts using grid view can be an easy way to spot visual trends.
Some of REI’s most successful posts feature iconic landscapes, which made me wonder: is there a color in particular that performs best for this outdoor retailer? I spent a few minutes creating a tag for each color and then tagging corresponding Instagram posts from their top performers.

Post Tagging makes it easy to see that purple posts perform especially well.
No surprise that this nature-centric brand sees above-average engagement with blue and green landscapes (reminder that retail brands saw 0.97% average engagement rate on Instagram according to our 2019 Social Media Industry Benchmark Report). While blue and green were neck and neck engagement-wise, REI might be interested to note that predominantly purple posts (say that five times fast) performed almost 50% better than blue or green, so they might want to comb their photo archives for more lilacs and lavenders.
You can apply this same thinking to figuring out whether dogs or babies come out on top, or whether images with a text overlay help or hinder your engagement.
4. Measure Engagement by Region
National and international brands, this one’s for you. Tag posts that mention a specific country, city, or state to see which regions are getting the most fired up about your posts in your social content analysis. With that info in mind, you can include more content that works for followers in those regions while decreasing your focus on, say, Antarctica. (Sorry, Antarctica–we loved your viral Tinder moment, though!)
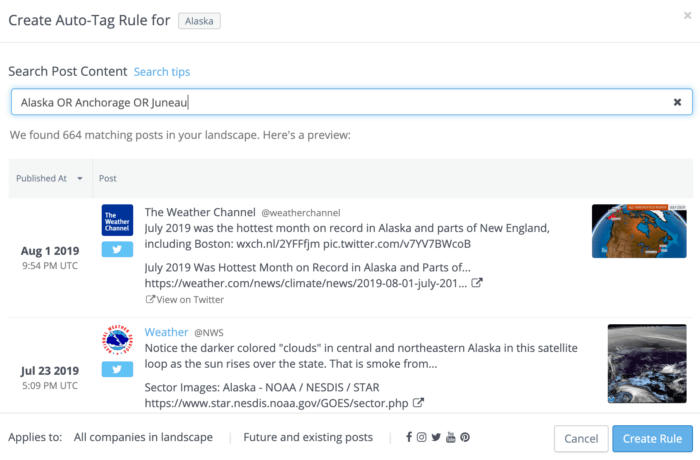
Adding a few key Alaskan cities to this Auto-Tag Rule make it easy to capture posts about Alaska.
To see regionality in action, I looked at how weather-themed posts fared by region this summer of heat waves. I built a landscape featuring popular weather providers and used an Auto-Tag Rule to capture all posts that featured Alaska and its major cities, and then did the same for Texas.

Posts featuring Alaska’s weather had 2x the engagement as posts about Texas’ weather.
Grouping posts like this made it easy to see that posts this summer about weather in Alaska on Facebook had twice the engagement than those about Texas. Why? Perhaps Texans are used to triple-digit temperatures in the summertime, meaning posts about heat waves don’t garner as much attention as Alaska’s epic temperature increase this summer.
Either way, this 2x engagement boost on weather posts that feature Alaska might inspire Accuweather or The Weather Channel to find more content featuring Alaska’s weather this summer.
Other brands could tag posts by region to track sales, openings, or discounts.
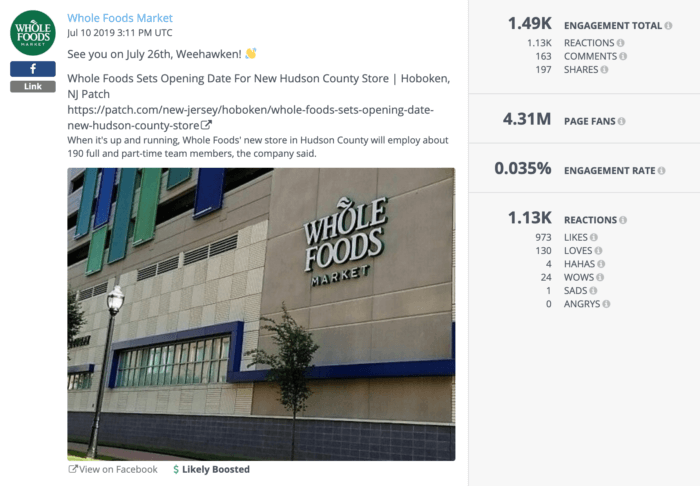
Throw a quick “New Jersey” tag on this post to compare it to store openings in other areas.
For example, Whole Foods could tag all their posts that mention their new store in New Jersey and compare the buzz about that opening to that of another recent new store to gauge customer sentiment and excitement by region.
5. Bookmark Social Media Inspiration
Treat Rival IQ like the social media bulletin board of your dreams by tagging favorite posts and campaigns for a boost of inspiration anytime you need it. These posts don’t have to meet an engagement threshold, or mention a specific keyword, or have a specific character count: they can just ring true with you and/or inspire you to borrow from their content and creative.

Tag things that inspire you on social.
I built a landscape of some of my favorite food-themed social media accounts and turned on grid view for maximum visualization. Then, I tagged posts that really landed with me thanks to gorgeous photography and pithy copy. (And yes, I am a baker with a strong appreciation for order and color-coding!) If I ran a food brand, it would be easy to come back to these posts when I was dealing with writer’s block. As it stands, I’ll just come back to these posts for recipe ideas.
You can also manually tag posts by highest and lowest engagement to create best practices for your brand and to spot patterns about what’s working well for your competitors.

It’s easy to see a pattern of what works well for these top-performing hotel social posts.
In this landscape of hotels and resorts featured in our 2019 benchmark report, I tagged a few of the posts with top engagement and found a clear trend: idyllic and colorful destination shots really engaged fans and followers with a way-above-average engagement rate of 3.62%.

Posts featuring illustrations and food from hotels didn’t perform as well.
And as for the lowest-performing posts for these hotels and resorts? Not a destination photo to be found. With just a 0.23% average engagement rate for low performers, it’s clear that followers didn’t engage with food or illustrations the same way they did with the stunning vacation destinations above.
Wrapping It Up
The sky’s the limit when it comes to Post Tagging, and we hope you leave this post inspired to do more with your tags in your social content analysis. We’d love to hear about your favorite ways to use Post Tagging in Rival IQ, so don’t hesitate to drop us a line on Twitter.
