These days, it seems like Instagram evolves by the minute. From new features to changes to the algorithm, there are always new Instagram terms and metrics to keep up with.
For data-driven social media marketers, it’s essential to stay on top of these terms in order to make sure you’re tracking and analyzing the right metrics for your brand’s Instagram strategy.
That’s why we’ve put together a comprehensive glossary of Instagram terms and metrics to know, along with where to find these metrics in the Instagram app or in Rival IQ.
Pull out your notebooks and get ready to jot down these must-know Instagram terms. Let’s dive in!
Instagram Profile Terms
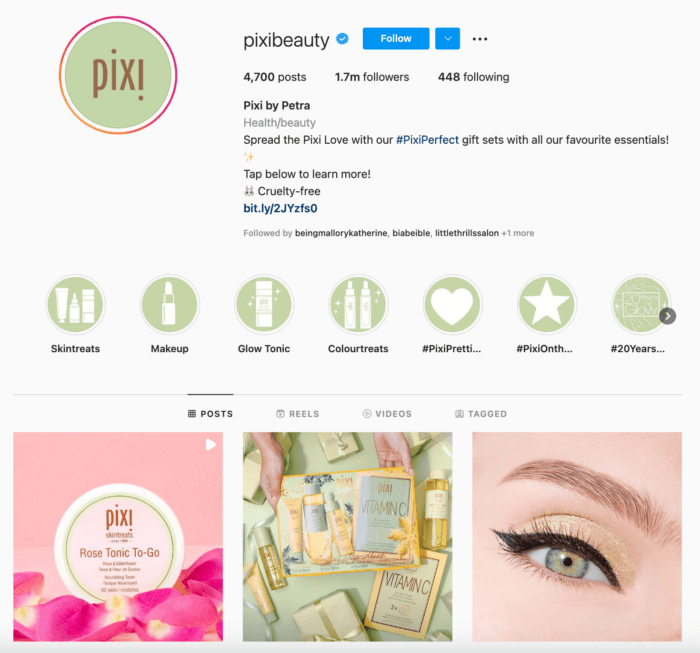
What is an Instagram Bio?
An Instagram bio is the top section on your page that displays your brand’s name, profile picture, and contact information. Though it may seem like a mini “About Page,” an Instagram bio can be an important metric to analyze, especially when you want to compare your account with competitors in your industry.
When done right, an effective Instagram bio is optimized for search, includes a CTA, and displays a link that can be adjusted depending on current marketing campaigns.
What are Profile Engagements?
Profile engagements are when users visit your profile and take action on the contact information or a CTA in your bio. Engagements include clicks on your website, email button, phone call, text message, or directions.
What are Stories Highlights?
Stories Highlights are selected Stories that you can “pin” to the top of your profile. Using Stories Highlights, you can save Stories and organize them in a way that gives followers and visitors a strong first impression of your brand and gives them an idea of what your brand is all about.
What are Followers?
Followers refer to the total number of accounts that have followed a handle in a set period of time. It’s a good idea to track how many new followers an account receives in a selected time period to identify what, if anything, was done differently to attract new followers that may be worth repeating.
What are Unfollows?
Unfollows refers to the number of accounts that have unfollowed a handle in a set period of time. Similar to tracking new followers, it’s also a good idea to be aware of how many unfollows your Instagram account receives during a certain time period.
What is Follower Change?
Follower change is the difference in followers during a selected time period. The difference is calculated as the follower count at the end of the compare period, subtracted from the follower count at the end of the current time period.
Follower Change
=
[Follower Count at the End of Compare Period]
–
[Follower Count at the End of Current Time Period]
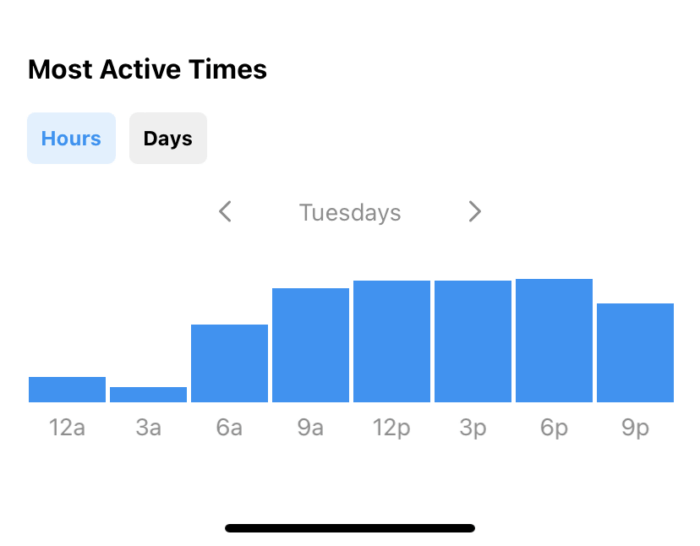
What is Follower Online Times?
Follower Online Times refers to the average number of followers online on a given time and day, based on the last 30 days of activity. The best times to post on social media vary for each platform and industry, but this metric offers audience insight that can be used as a starting point.
Instagram Feed Terms
What is a Carousel?
A carousel is a group of photos or videos that are shared as a single feed post. Carousels can include up to 10 photos and videos and are viewed by swiping to the left (on the mobile app) or clicking through (on desktop).
What are Reels?
Instagram Reels are short videos that are typically meant to be entertaining or creative. Reels can be up to 60 seconds long and are created using effects like voiceovers, music, and text overlays.
The app features a dedicated tab for users to discover and watch Reels. Reels also show up in a user’s Feed if they follow the account.

What are Instagram Lives?
Instagram Lives are live broadcasts where followers can tune in in real time. This is a popular format for brands that host Q&A-style interviews or want to give followers a chance to watch a live event. A replay video of the Live can be saved on your brand’s profile for followers to watch later.
What is Engagement Total?
Engagement Total is the total number of interactions on a post. On your competitive Instagram posts, these interactions include only likes and comments. If you’ve connected your owned Instagram accounts, Engagement Total also includes saves.
What is Engagement Rate by Follower?
Engagement Rate by Follower is the engagement total divided by follower count. Follower count is a public metric and so Engagement Rate by Follower is a widely available competitive Instagram metric.
Engagement Rate
=
[Engagement Total] / [Follower Count]
What is Engagement Rate by Impression?
Engagement Rate by Impression is the engagement total divided by impression count. Since impressions are a private metric, Engagement Rate by Impression is available only for owned handles.
Engagement Rate
=
[Engagement Total] / [Impression]
What is Engagement Rate by Reach?
Engagement Rate by Reach is the engagement total divided by Reach. Since Reach is a private metric available only for owned handles, Engagement Rate by Reach is available only for owned handles.
Engagement Rate
=
[Engagement Total] / [Reach]
What is an Impression?
Impressions are the number of views on a post. The difference between impressions and reach is that impressions don’t consider whether or not the user is new.
If one user views your post 10 times, that counts as 10 impressions.
What is Reach?
Reach is the number of unique accounts that viewed a post. The difference between reach and impressions is that reach only factors in unique people and doesn’t count views made by the same user.
For example, a single user viewing your most recent post 5 times throughout the day will generate 5 impressions but only a reach of 1.
What is Reach Rate?
To calculate the reach rate at Rival IQ, we take the reach of the post and divide it by the number of followers of the account on the published date.
Reach Rate
=
[Post Reach] / [Number of Followers]
What is a Video?
A video is a post type that is shown in the Feed and on a brand’s profile. Instagram video posts can be up to 10 minutes long, but users can only preview up to 60 seconds of the video in their Feed. If the video is longer than 60 seconds, users will have to choose to watch the remainder of the video on the brand’s profile.
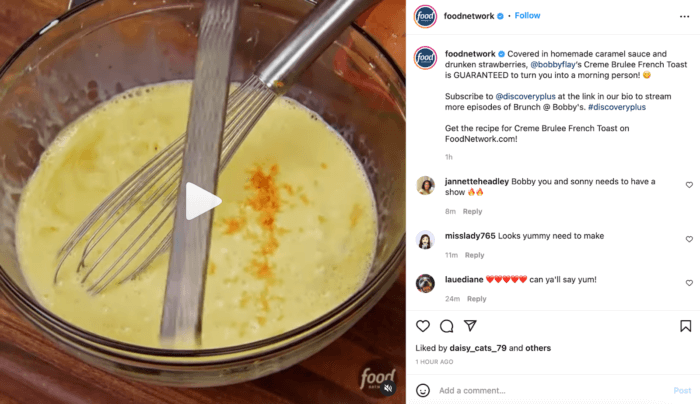
What is a Video View?
A video view is the number of views on a video post that last 3+ seconds.
It’s important to note that video posts can receive both impressions and video views.
A view on the video post of any length will initially count as an impression. When the viewer watches the video for at least 3 seconds, that will count as a video view.
Instagram Stories Terms
What is a Story?
A Story is the set of frames posted within a 24-hour day. A Story can be one frame or it can be multiple frames, but regardless of how many frames are posted within a 24-hour day, the set will only count as one Story.
What is a Frame?
A frame is an individual photo or video published in an Instagram Story. Multiple frames can make up a Story.
What are Story Viewers?
Story viewers are the number of people who saw your Story on a given day.
What are Exits?
Exits are the total number of swipes away or swipes down from the frame. Exits are an important metric to track because it helps marketers understand where their Instagram Stories content may be falling flat with followers.
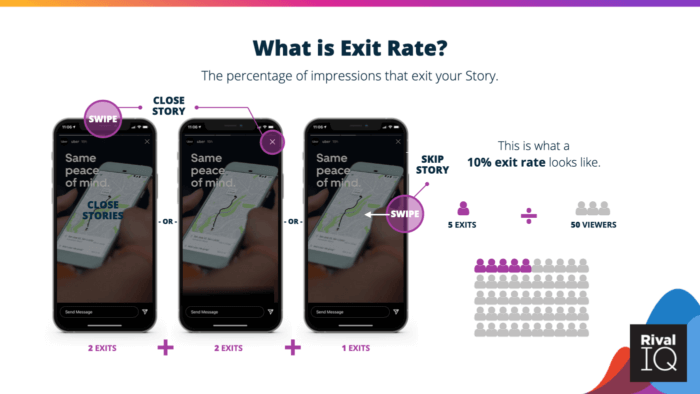
What is Exit Rate by Impression?
Exit Rate by Impression measures the percentage of impressions with an exit. To calculate Exit Rate by Impression, take the exits, divided by the total impressions on the frame.
Exit Rate by Impression
=
[Exits] / [Total Frame Impressions]
What are Days With a Story?
When measuring this metric at Rival IQ, we look at the number of days per month with published Stories.
What is Frames per Day?
The average number of photo and video frames published in each 24-hour Story during the selected time period.
What is Frame Order?
Frame order is the numerical order in which the frame was posted within its 24-hour Story.
What is Frame Reach?
Frame reach is the number of unique users that saw the frame. As we mentioned earlier, reach is different from impressions in that it only factors the number of Instagram users reached, no matter how many times one user may view a frame.
What is Frame Reach Rate by Follower?
To calculate Frame Reach by Follower, start with the number of unique users that saw the frame and divide by the total number of followers. This metric is expressed as a percentage.
Frame Reach Rate by Follower (%)
=
[Number of Unique Users that Saw the Frame]
/
[Number of Followers]
What are Frame Impressions?
Frame impressions are the total number of impressions on a frame. Impressions consider how many views a frame earned, even if those views come from the same user.
What is Frame Completion Rate by Impression?
Frame Completion Rate by Impression measures the percentage of impressions that finished watching the frame without exiting from the entire Story (by swiping away or swiping down). It is calculated by taking the total impressions subtracted by exits, divided by the total impressions on the frame.
Frame Completion Rate by Impression (%)
=
[(Total Impressions) – (Exits)]
/
[Total Impressions on the Frame]
What are Replies?
The total number of replies to either a single frame or all frames in a 24-hour Story. The number of replies you receive can tell you a lot about how engaging your Stories content is. Being intentional about your Stories by giving your audience a reason to reach out is just one way to increase your reply rate and improve your Instagram Stories performance.
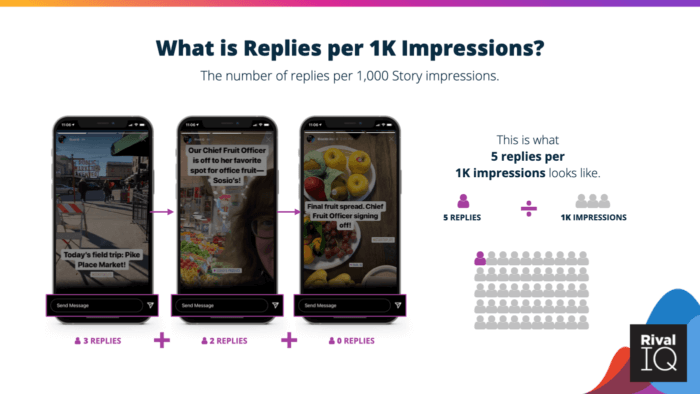
What is Reply Rate?
Reply Rate is the percentage of users that reply to a Story, based on impressions. We calculate Reply Rate as Replies per 1K impressions which expresses the number of replies per 1K impressions as a percentage. Here’s how to calculate Reply Rate:
Replies Per 1K Impressions (%)
=
[Number of Replies on All Frames in a Story]
/
[1,000]
What are Taps Forward?
Taps forward are the total number of taps users made to see the next photo or video.
What are Taps Backward?
Taps backward are the total number of taps users made to see the previous photo or video.
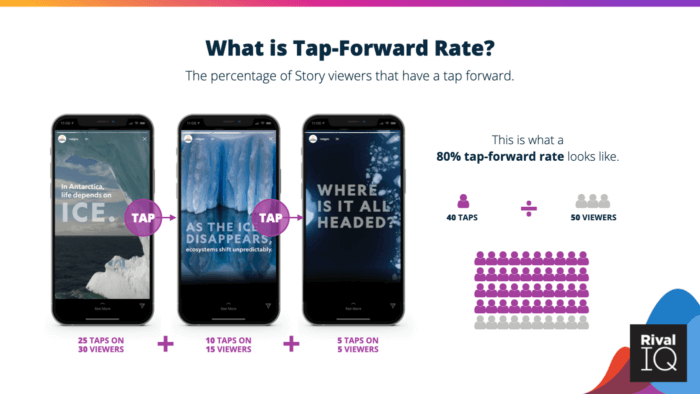
What is the Tap-Forward Rate?
Tap-forward rate is the percentage of your Story viewers that tap forward to see the next photo or video. It is calculated by the number of taps forward, divided by the number of viewers.
Taps Forward Rate (%)
=
[Number of Taps Forward]
/
[Number of Viewers]
What is the Tap-Back Rate?
Tap-back rate is the percentage of your Story viewers that tap backward to see the previous photo or video again. It is calculated by the number of taps back, divided by the number of viewers.
Taps Back Rate (%)
=
[Number of Taps Back] / [Number of Viewers]
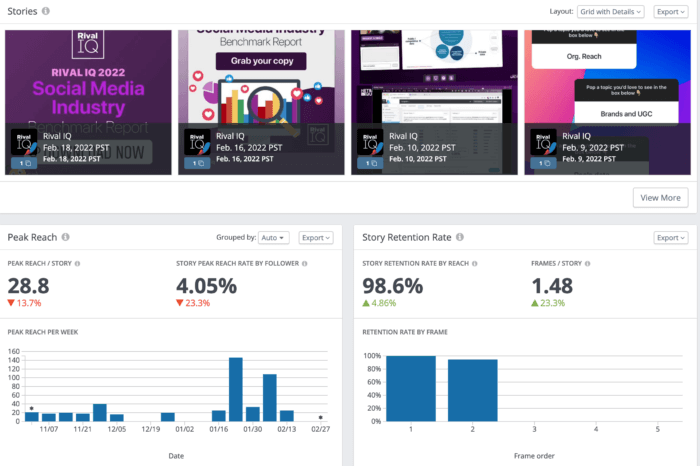
What is Retention Rate?
Retention rate is the percentage of viewers that stick around through any given frame of a Story. This is one of the most important Instagram Stories metrics to analyze as it shows you how well your content is resonating with your audience throughout your lineup of frames.
To see the impact of retention rate in action, check out our 2022 Instagram Stories Benchmark Report.
Instagram Ads Terms
What is a Boosted Post?
Brands can boost a post on Instagram by spending money to amplify its reach. To boost a post, determine your goal, choose an audience you want the post to target, and decide how much money you want to spend. Boosting a post can only be done on Instagram’s mobile app.
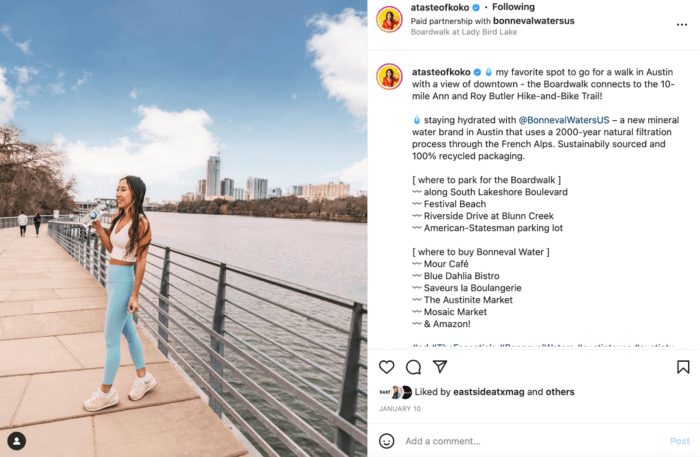
What is a Sponsored Post?
A sponsored post is an Instagram post that’s been published in partnership with a brand. This is a common post type among influencers who use sponsored posts to promote a product as part of a brand partnership.
These posts are easy to identify on the app as Instagram has made it a requirement for accounts to use the “Paid Partnership” label to all sponsored posts in the feed, Stories, Reels, and on lives.
What is Paid Reach?
Paid reach is the number of unique accounts that viewed a post that has been boosted.
What is a Promoted Post?
A promoted post is a post that has been boosted with advertising spend.
When analyzing posts in Rival IQ, look for a tag that says “Likely Boosted” to identify posts that may have a higher engagement rate due to paid reach.
How to find Instagram metrics using the Instagram app
For marketers that want to get a quick overview of how their content is performing, Instagram offers Instagram Insights within the app so you can easily access your metrics.
Your brand’s key data that can be found natively are metrics for reach, impressions, and followers.
Here’s how to find your Instagram metrics using the Instagram app.
Head over to the Insights tab
You will need a business or professional account to access Insights.
Once there, you’ll see an overview of your insights from the last 7 days, 30 days, or another time period that you select. However, you can only see data from up to 90 days.
The overview also offers a snapshot of the top metrics the app tracks which include accounts reached, accounts engaged, and total followers.
Dive into each metric
From there, you can then dig deeper into the data by analyzing each of the metrics.
Under the Reach tab, you’ll see the number of accounts that have seen your content, both organic and paid. You can also get an idea of how your content is performing by seeing which of your post types are being seen most. This tab also provides insight into profile activity which tracks the actions people take on your page, including profile visits and website taps.
There’s also an Engagement tab that offers similar metrics as the Reach tab but hones in on actual interactions.
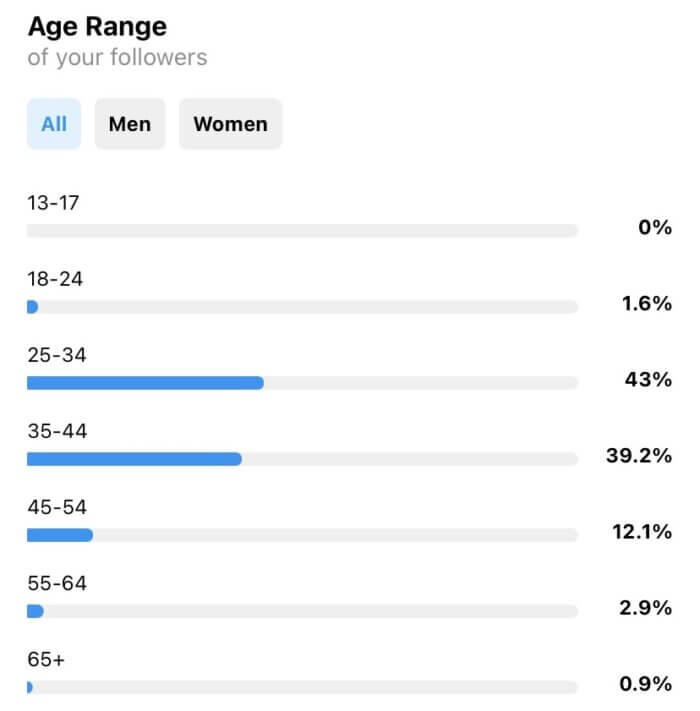
Finally, there’s the Followers tab. This section of Instagram Insights shows your audience growth from the selected time period as well as your followers’ top locations, most active times, and audience demographics like age and gender.
How to find Instagram metrics using Rival IQ
We may be biased, but we can’t talk about Instagram metrics without mentioning our social analytics platform.
When using Rival IQ, you have access to all of your brand’s private data through Instagram Insights. Here you’ll be able to track and analyze all of the metrics listed above, from engagement rates to Stories impressions to retention rate and beyond.
You can also use the platform to monitor how the competition is doing. Though you won’t have access to your competitors’ private data, you can create a side-by-side comparison of metrics like followers, engagement total, and top social posts to see how you stack up against companies in your industry.
Here are the steps to take if you want to find and track Instagram metrics using Rival IQ.
Sign up or log into your Rival IQ account to access the dashboard
If you don’t already have an account, sign up for one. Once you’re logged in, you’ll have access to a suite of analytics tools you can use to track and measure your brand’s Instagram metrics, as well as the metrics of similar companies, AKA your competition.
Compare your Instagram analytics to the competition
While measuring your own metrics is essential to understand your brand’s social success, the real insights come from seeing how your metrics compare to the industry average. To do that, you need to use a tool that allows you to directly compare your analytics to your competitors’.
Rival IQ makes it easy to stay on top of how the competition is doing. To conduct a competitive analysis, start by creating a landscape. You can add any companies you want and Rival IQ will pull their public social media data so you can analyze their metrics all in one place.
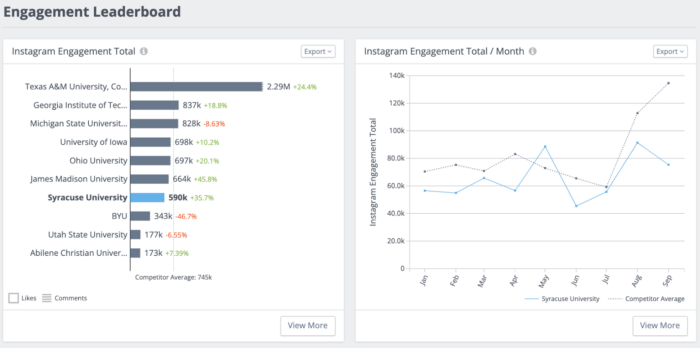
A glimpse at a Rival IQ landscape that displays the Instagram engagement metrics from the top Higher Education brands on social media.
Connect your team’s Instagram Business account for even more insights
Once you’re logged into your account, toggle over to the Instagram Insights tab underneath the section labeled “Your Private Data.” Follow the prompts to connect your Instagram Business Account.
By doing this, you’ll have access to the most up-to-date data from your account. All of the essential metrics you want to track will be in one place so you don’t have to go into the Instagram app to find them. Not to mention, with Rival IQ, you can look at data going up to two years compared with only 90 days within the Instagram app.
The Wrap-Up
Instagram is always evolving. As soon as you get a handle on one metric, another feature is released and it’s back to square one.
But no matter what new features or metrics come out next, measuring your brand’s performance will always be key to success on the platform.
As long as you stay committed to learning the new Instagram terms and incorporating those metrics into your strategy, you can take your brand’s Instagram success to the next level.