Just in time for the new year, we’ve got the latest Instagram Stories Benchmark Report! 🥂
We all can’t wash our hands of 2020 quickly enough, but now is the perfect time to look back on the year in Instagram Stories stats while things are fresh.
This year’s report has tons of updates to all your favorite Instagram Stories metrics like retention rate, exit rate, reply rate, and more. We analyzed tens of thousands of top Stories and broke our stats down by follower count and brand activity levels to help you understand exactly how your brand measures up when it comes to Instagram Stories.
Let’s start with a few key takeaways, and then we’ll get into the deets.

Key Instagram Stories Takeaways
Brands are posting more Stories than ever
Brands of all sizes increased their Story frequency this year, leading to more stellar content (and also more competition).
Retention Rates are flat
Retention rates on Stories increased just 1% this year. Brands saw gains in tap-back rates but losses in lots of other areas like replies and reach, which kept retention rates from growing.
Reach Rate is down (again)
Your Stories are reaching a smaller percentage of your followers compared to last year. As more brands hop on the Instagram wagon, Stories are more saturated and less likely to be seen.
Posts reach more than Stories
Instagram posts continue to see a much higher reach rate. Hook viewers with posts and keep them engaged with Stories.
Days with an Instagram Story
Looking at the number of days in a month in which brands publish Stories is a helpful benchmark for answering the question, “How often should I publish Stories?” More isn’t always more when it comes to frequency on social media, so let’s take a look at how often the average brand publishes a Story in a month.
It’s not too surprising to find that Instagram Story frequency is up across the board as Instagram continues to grow in the US and around the world. You’ll see us breaking down segments by publishing frequency throughout this report so you can see what the top and bottom 25% of brands are up to with Instagram Stories as well as median performance.
- The median brand publishes an Instagram Story 10 times per month, or about once every three days.
- Brands in the top 25% publish at least 16 times per month, or about every other day.
- The least active 25% of brands publish just 6 Stories per month, or just over one Story per week.
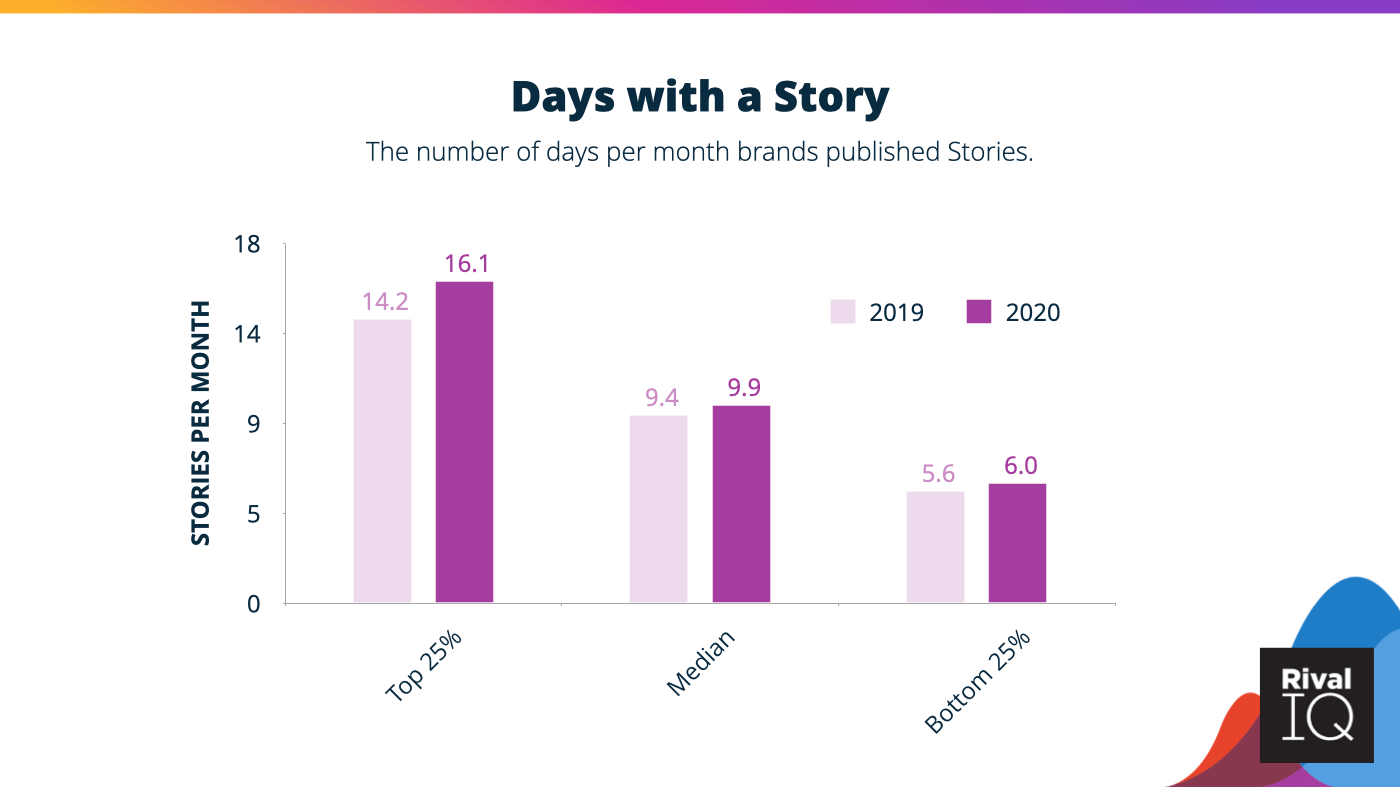
All the brands we studied are publishing Stories a little more frequently than they used to, but it shakes out to one or two Stories per week.
If your brand still isn’t publishing Stories very frequently, don’t fret! Consider 2021 your year for experimentation and a good time to dip your toes in the world of Stories.
Frames Per Day
By our count, Stories represent a 24-hour period, while frames per day denotes the number of individual photos or videos posted within a Story. Frames per day goes hand in hand with days with a Story when measuring Instagram Story activity. Finding the “right” number of frames per day for your brand will help you maximize your reach without over-publishing.
As you can see on the graph below, Stories with just a few frames are more common than Stories with more frames.
- About 30% of Story activity comprises days with only one frame.
- 1-3 frames account for about 60% of brand activity.
- Almost 20% of Stories have 7 or more frames.
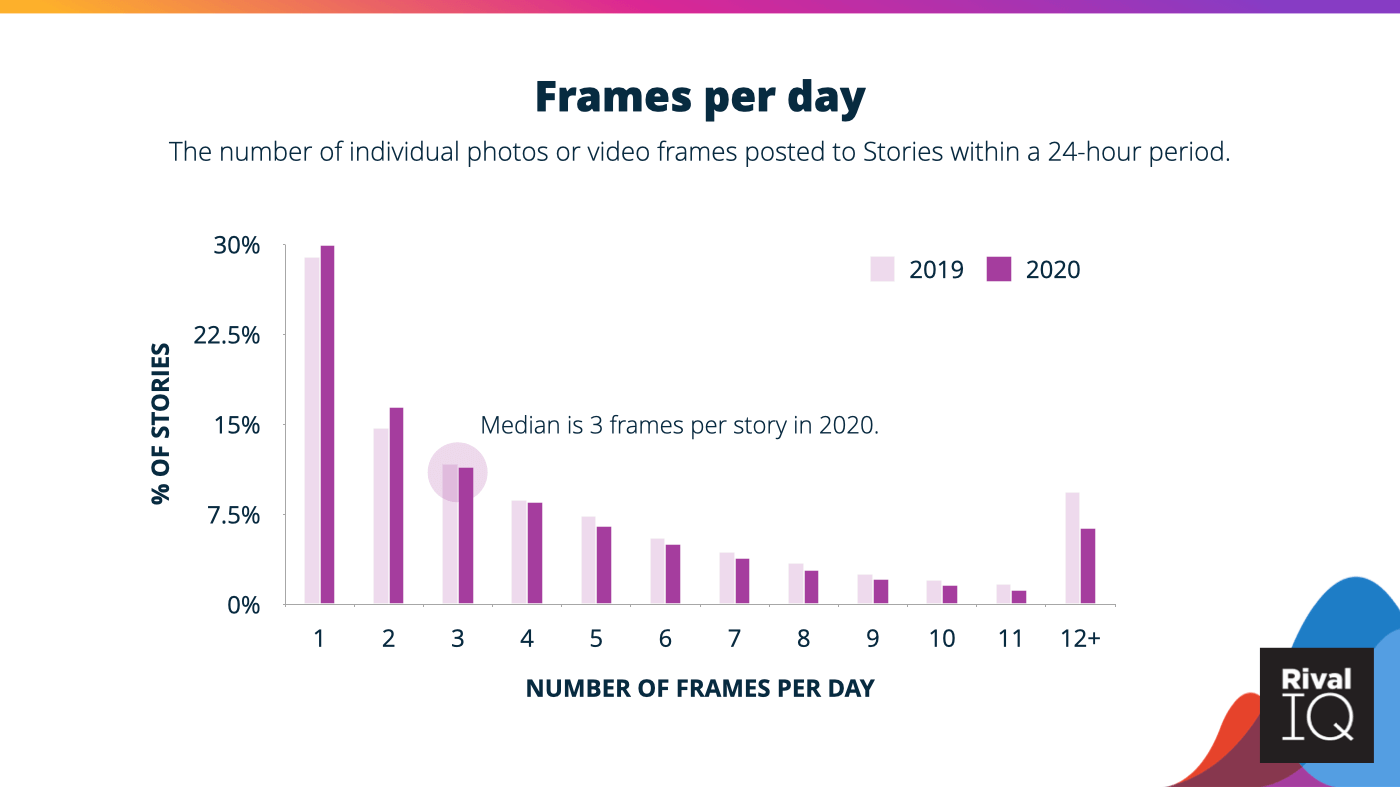
Low frame per day counts as the norm should be encouraging for any brands currently feeling intimidated to try Instagram Stories. Brands really only need a few eye-catching frames to draw a user in and shouldn’t worry too much about creating frame after frame of perfection.
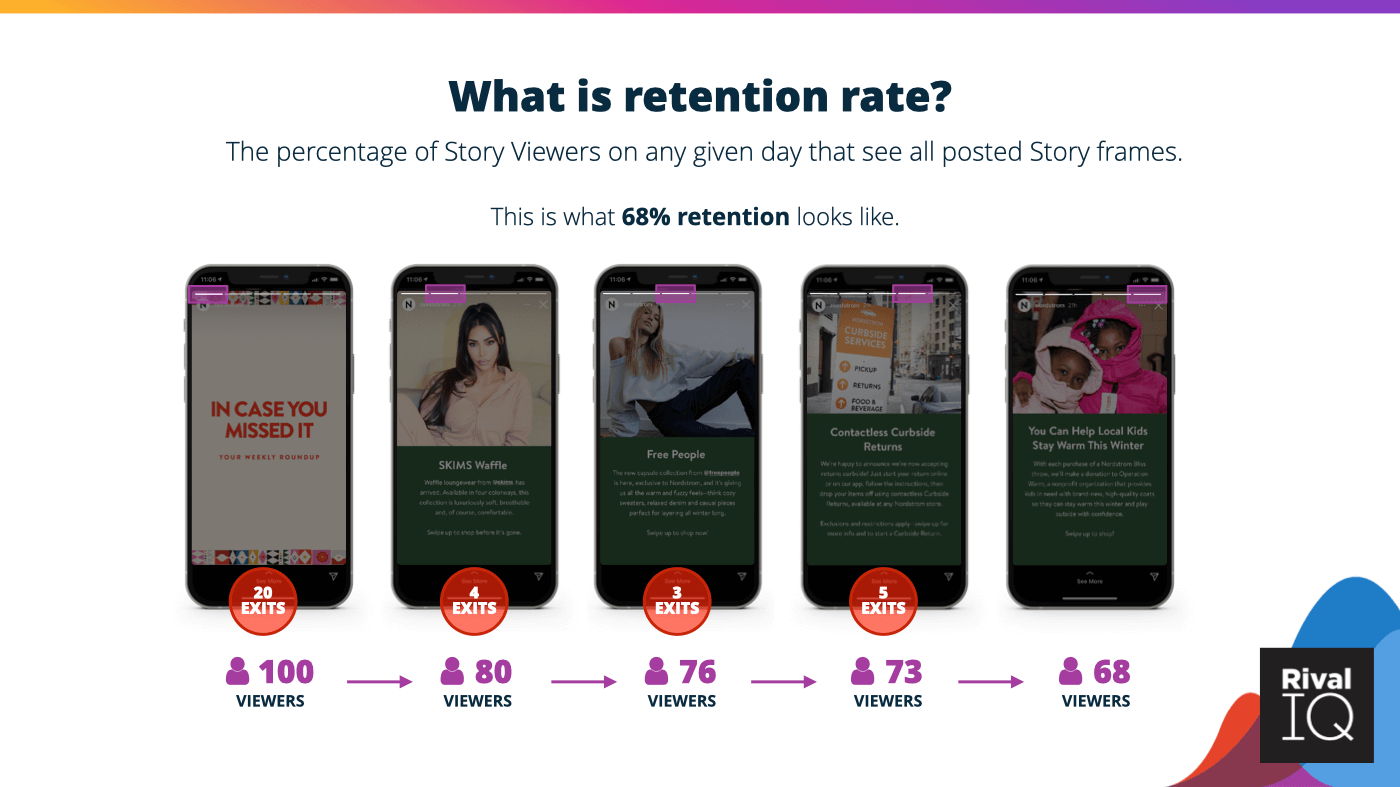
Retention Rate
Let’s jump into one of our favorite metrics for measuring Instagram Story performance: retention rate by frame. This metric helps you understand the percentage of Story viewers that are hanging onto your every frame (and obviously the more the merrier here).
The Instagram Story retention rate tl;dr is pretty simple: The more frames you publish, the lower the retention rate. Here are a few other key retention rate stats:
- The average retention rate was pretty flat this year, with just a 1% increase on average over 2019.
- As expected, the biggest dip is from 1 to 2 frames a day as users swipe past the Story.
- After that big initial drop-off, the retention decline slows down and stays above 75% through 6 Stories per day.
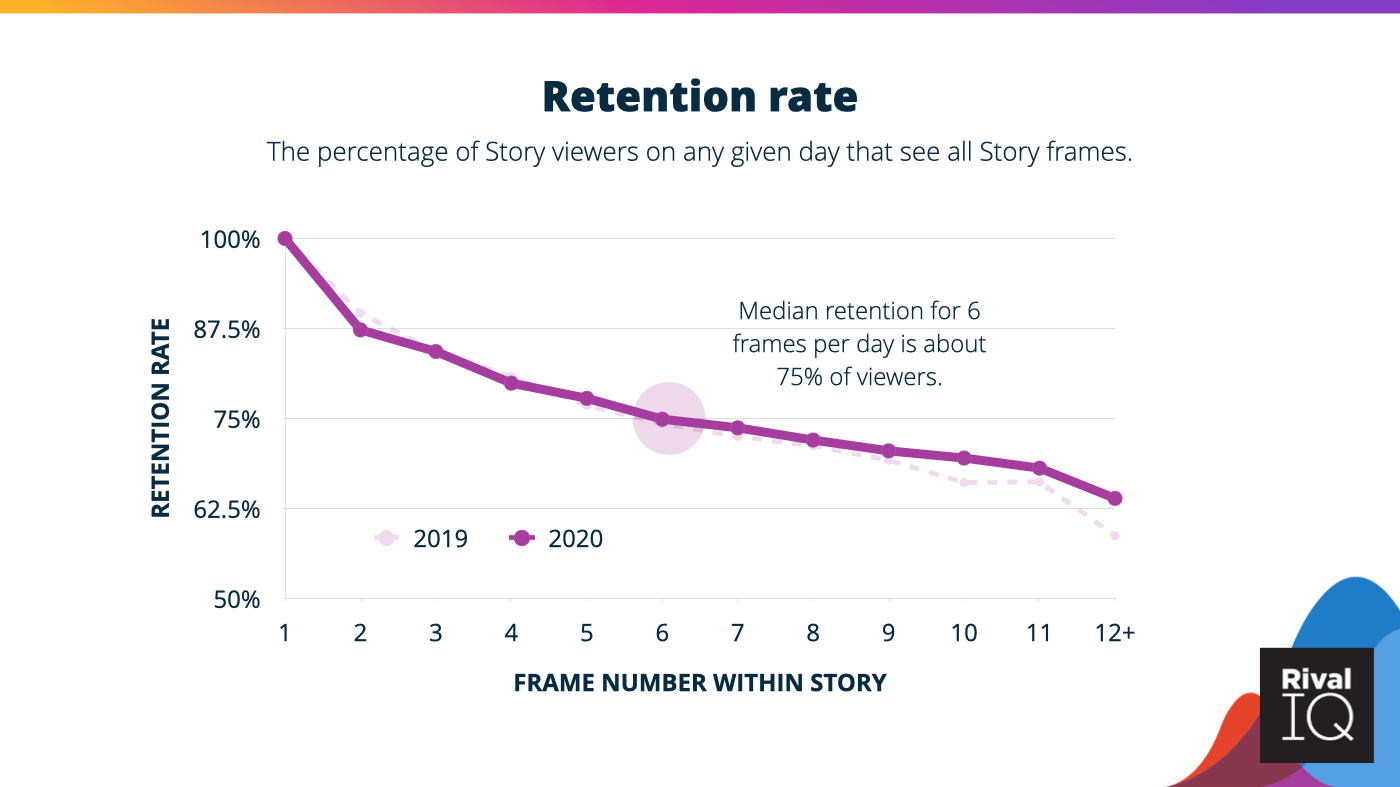
Retention rate is a great measure of your Story viewers’ attention to and interest in your content. With retention rate at its peak with just a few frames, content creators should focus their efforts on creating especially dynamic photos or videos for the first frame or two to really pull viewers in.
We like this metric because it’s really focused on the strength of your brand’s content: retention isn’t influenced by Instagram’s algorithm or in competition with another brand. It’s just your content, your viewer, and whether or not you can keep them tapping forward instead of exiting and moving onto the next Story.
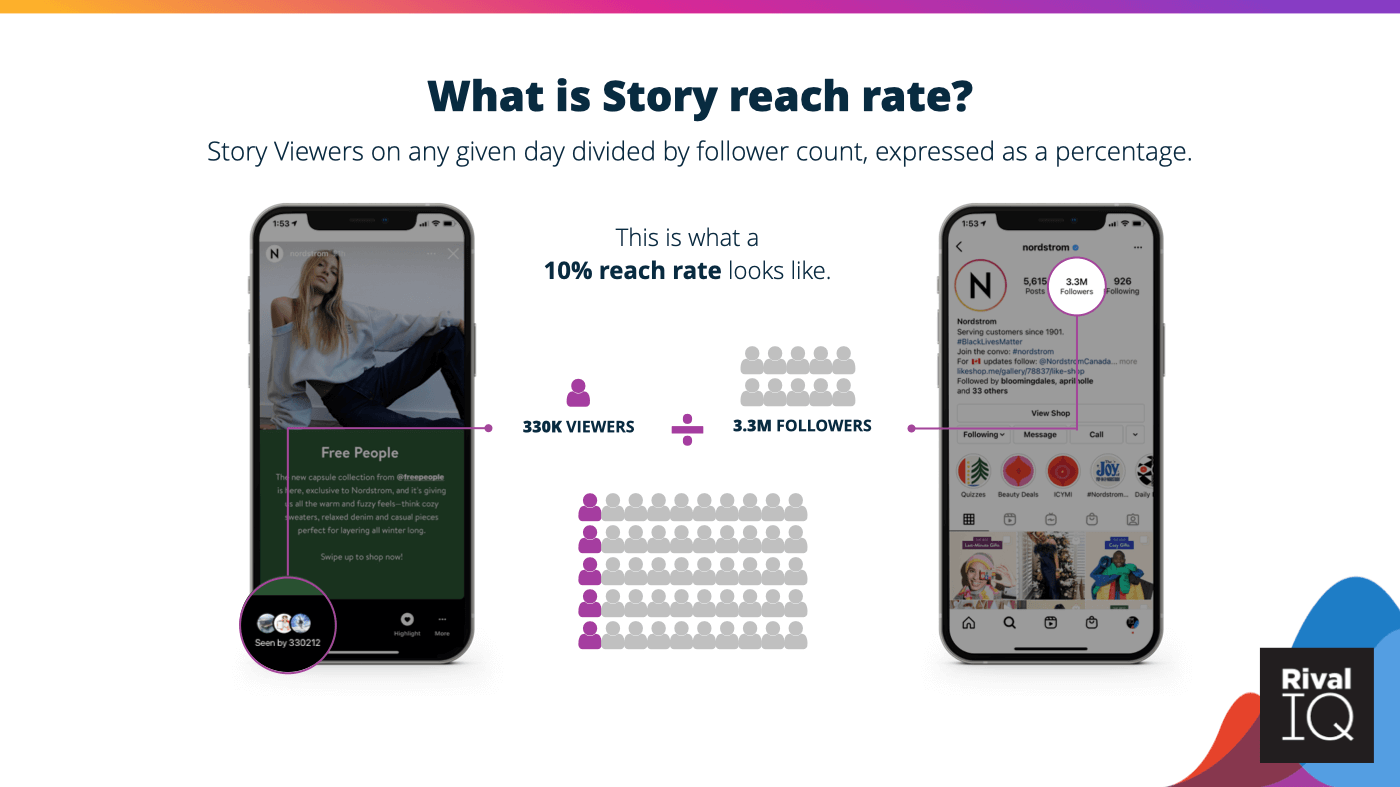
Story Reach Rate
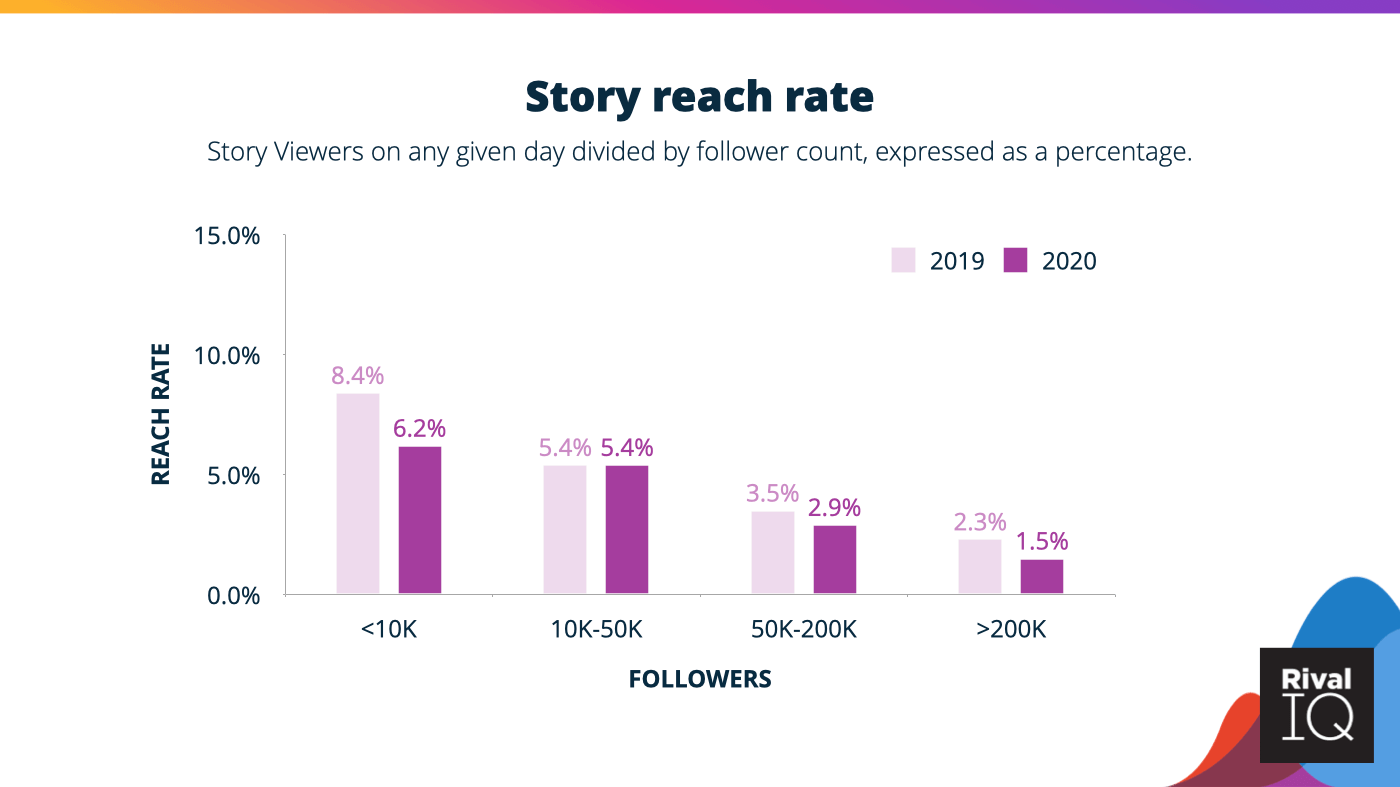
Story reach rate helps you understand what percentage of your followers are actually seeing your Stories. These reach rates are tiny and shrinking year over year, but don’t get discouraged.
Brands are seeing reach rates decline in 2020 no matter their follower count.
- Mid-size brands with between 10K-50K followers were able to hang onto a consistent reach rate from 2019.
- Brands with over 200k followers lost the most this year with a 34% drop in retention rate, but brands with small follower counts weren’t far behind.
As we saw earlier, Stories are on the rise, which means there’s more competition for every pair of eyeballs that comes across your Story. You can influence this rate using the same tactic we recommended for boosting retention rate: focus your efforts on creating dynamic and engaging first frames. Your brand can also experiment with Story Highlights, which pin your favorite Stories to your profile page and help viewers discover your content long after its 24-hour expiration date in Stories. Using interactive sticker elements like questions, polls, and quizzes can also increase reach (and retention).
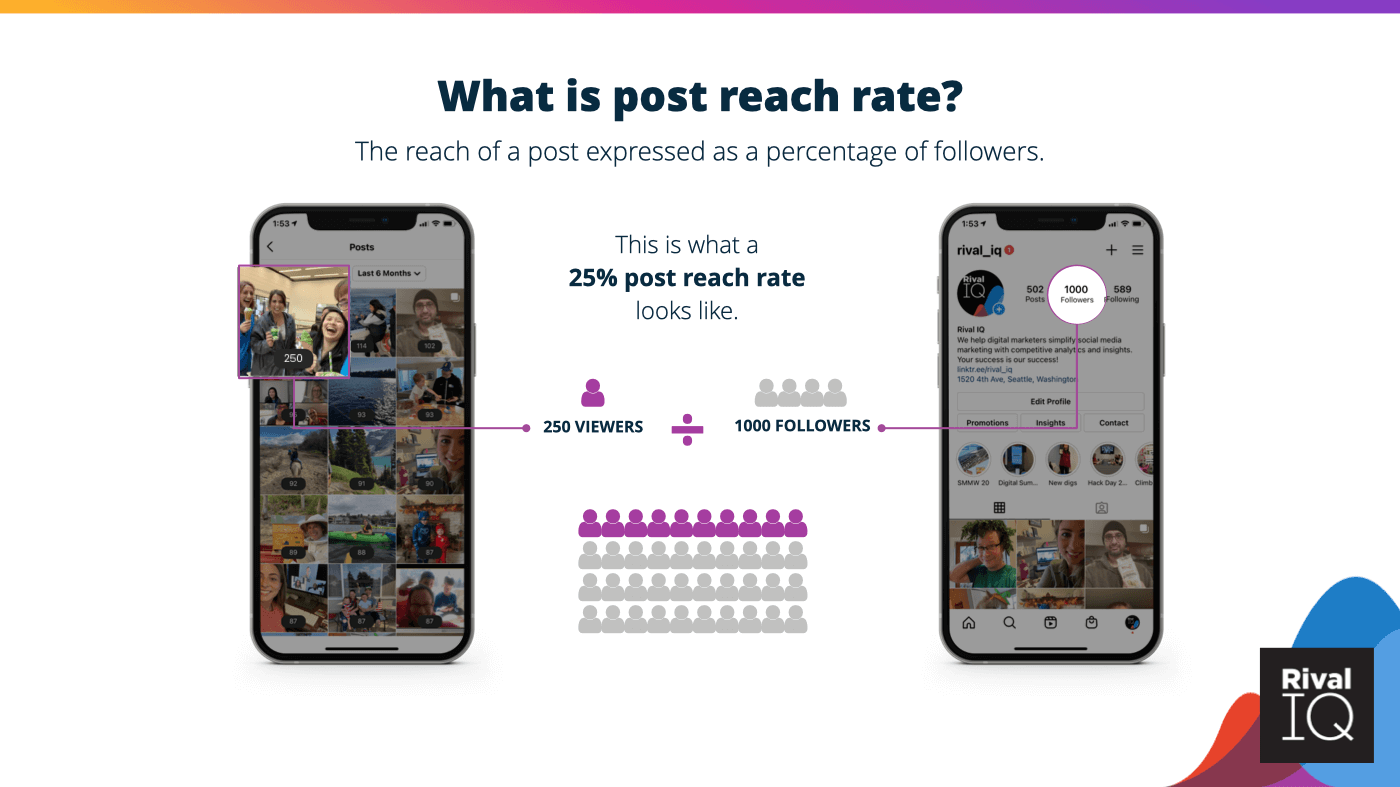
Post Reach Rate
Post reach rate, which is the percentage of your followers that saw one of your posts, stayed the same or declined slightly this year.
Brands large and small saw post reach rates that were just a little lower than they were last year. Mid-sized brands with between 50K-200K followers managed to hold onto their 18% post reach rate from last year.
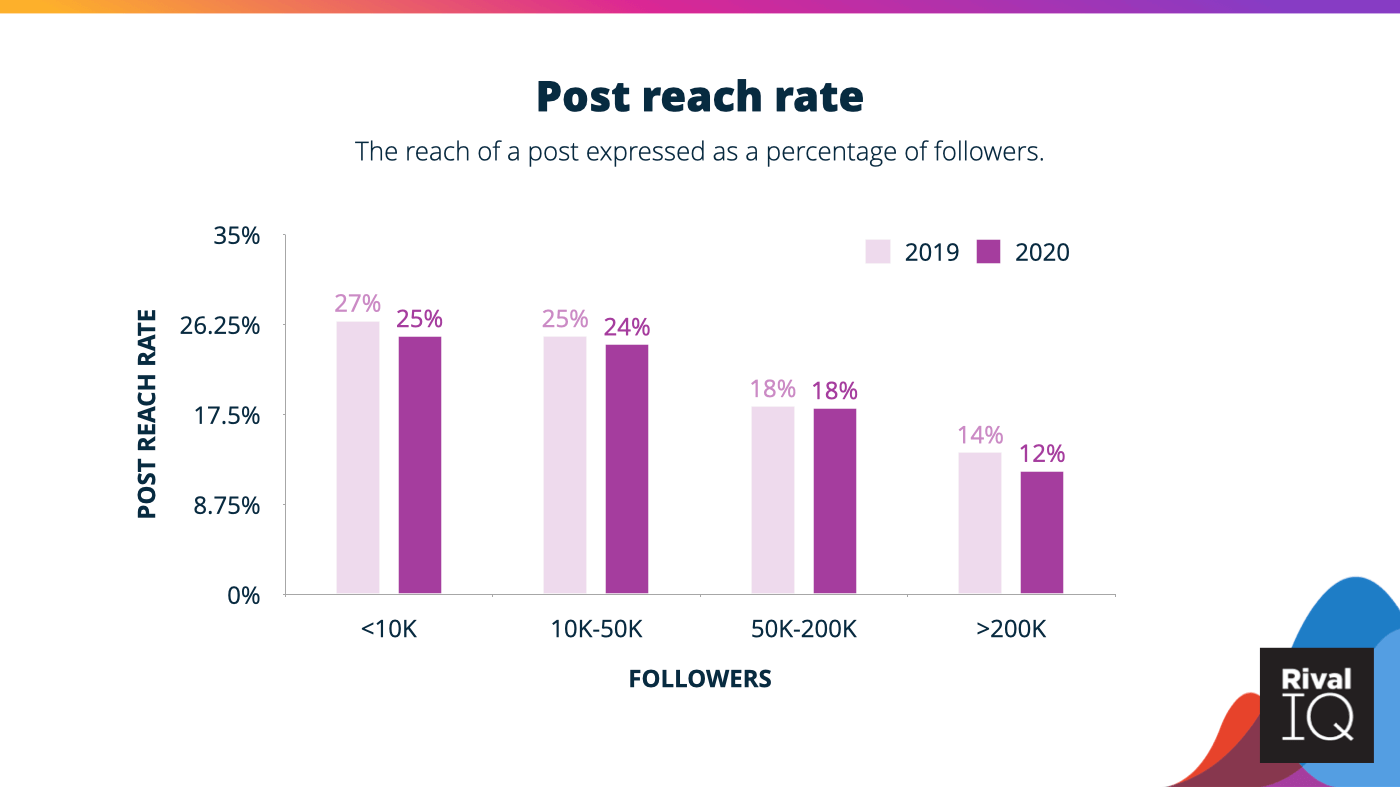
As usual, the larger your follower count, the smaller your reach rate. It’s not too surprising that post reach rates continue to decline as Instagram adds more ways to consume content on its platform, further dividing attention.
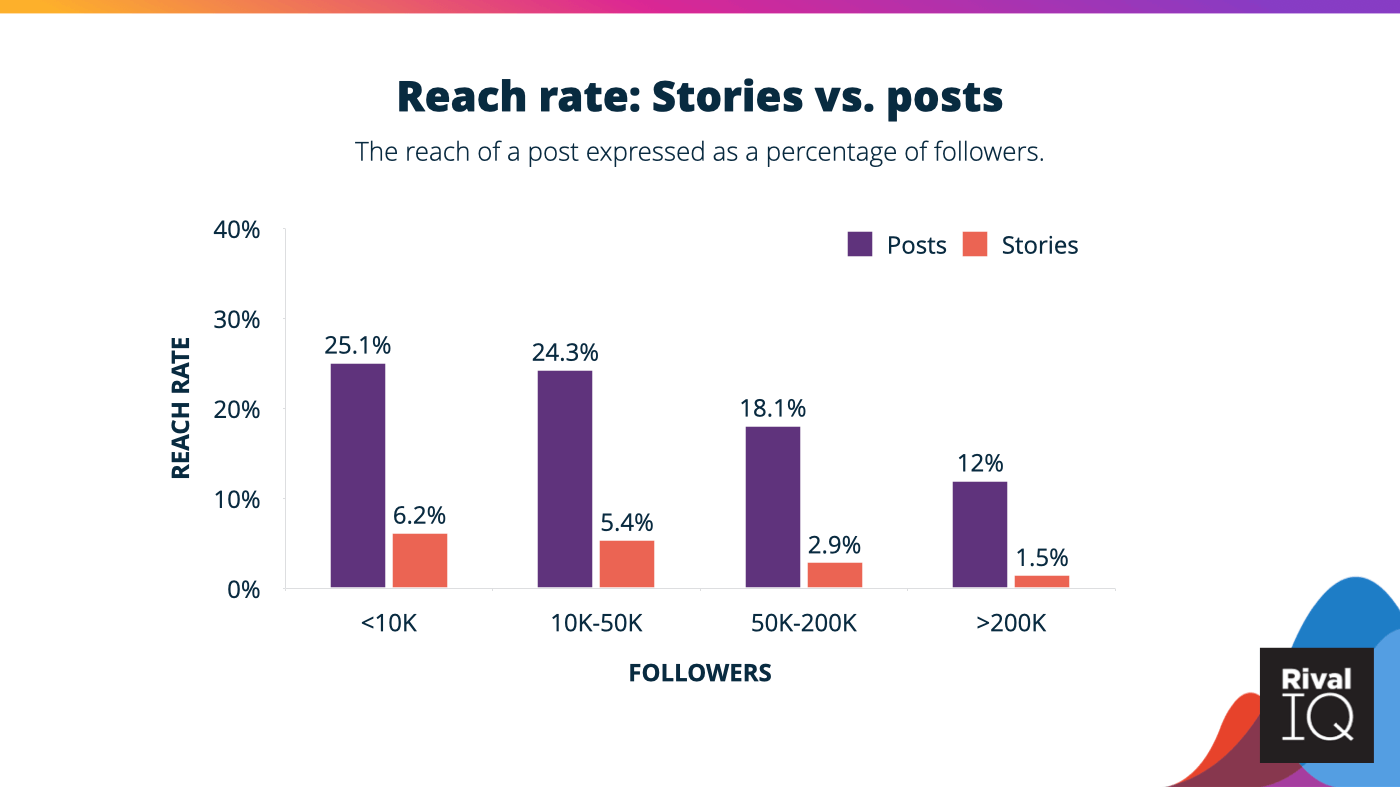
Reach Rate: Instagram Stories vs. Posts
If you’ve been following closely, you’ll have noticed a pretty big disparity between Story and post reach rates, so let’s compare the two side by side.
Brands with follower counts up to 200K can expect around 5x more of their followers to see their posts than their Stories, and the disparity only grows more dramatic as follower counts increase.
Do these bummer reach rates mean brands should abandon Stories? No way. Posts and Stories engage your followers differently and should be treated as two different tools in a marketer’s toolbox. Posts are great for a quick scroll, but as we’ve seen with stats like retention rate and tap-back rate, Stories can really draw viewers in and keep them engaged.
By the way, if you’re wondering if there’s a right time to post on Instagram or an ideal posting frequency, we’ve got you covered.

See what thousands of brands are up to on social with our Social Media Industry Benchmark Report.
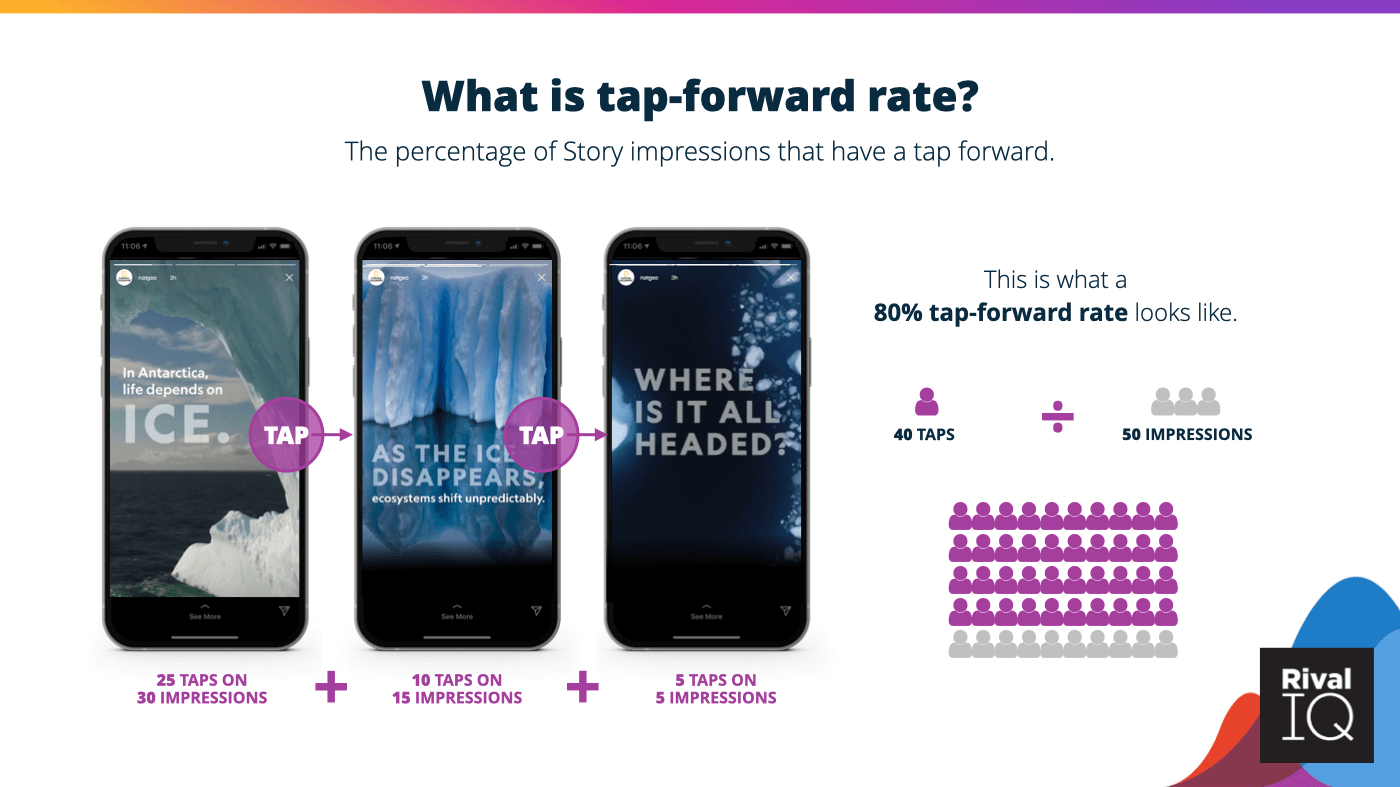
Check it outTap-Forward Rate
Tapping forward in an Instagram Story means one of two things: either the viewer has had enough of your content, or can’t wait another second to hit the next frame. This stat measures the percentage of your Story impressions that have a tap forward.
The general rule of thumb is: the more frames in your Story, the more likely it is that followers will tap forward. A few other key stats:
- The median tap-forward rate at 5 frames per day is about 75%.
- If your Story contains more than 12 frames, almost 80% of your viewers are tapping forward to advance to the next frame.
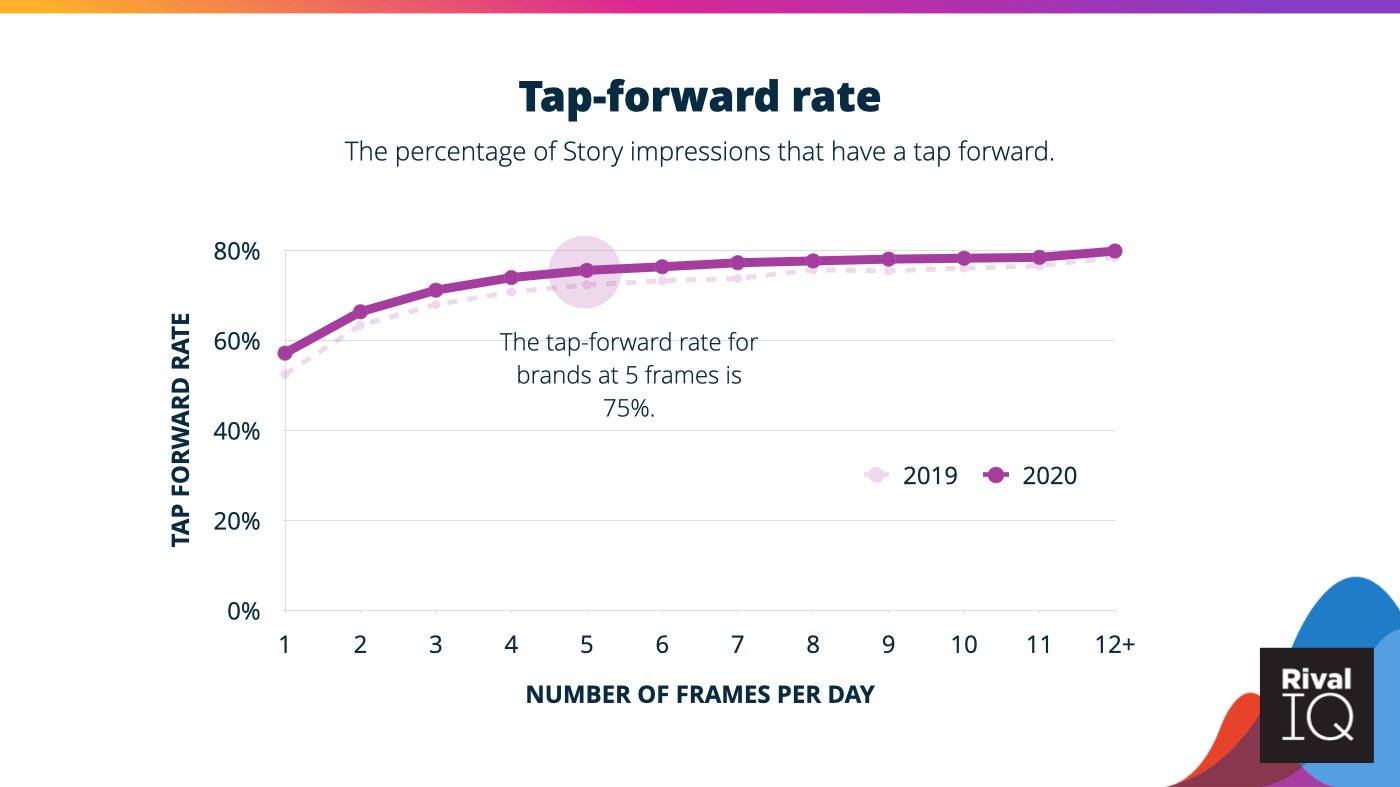
Tap-forward rates have stayed almost exactly the same compared to last year’s data, signifying that our attention spans haven’t decreased much this year.
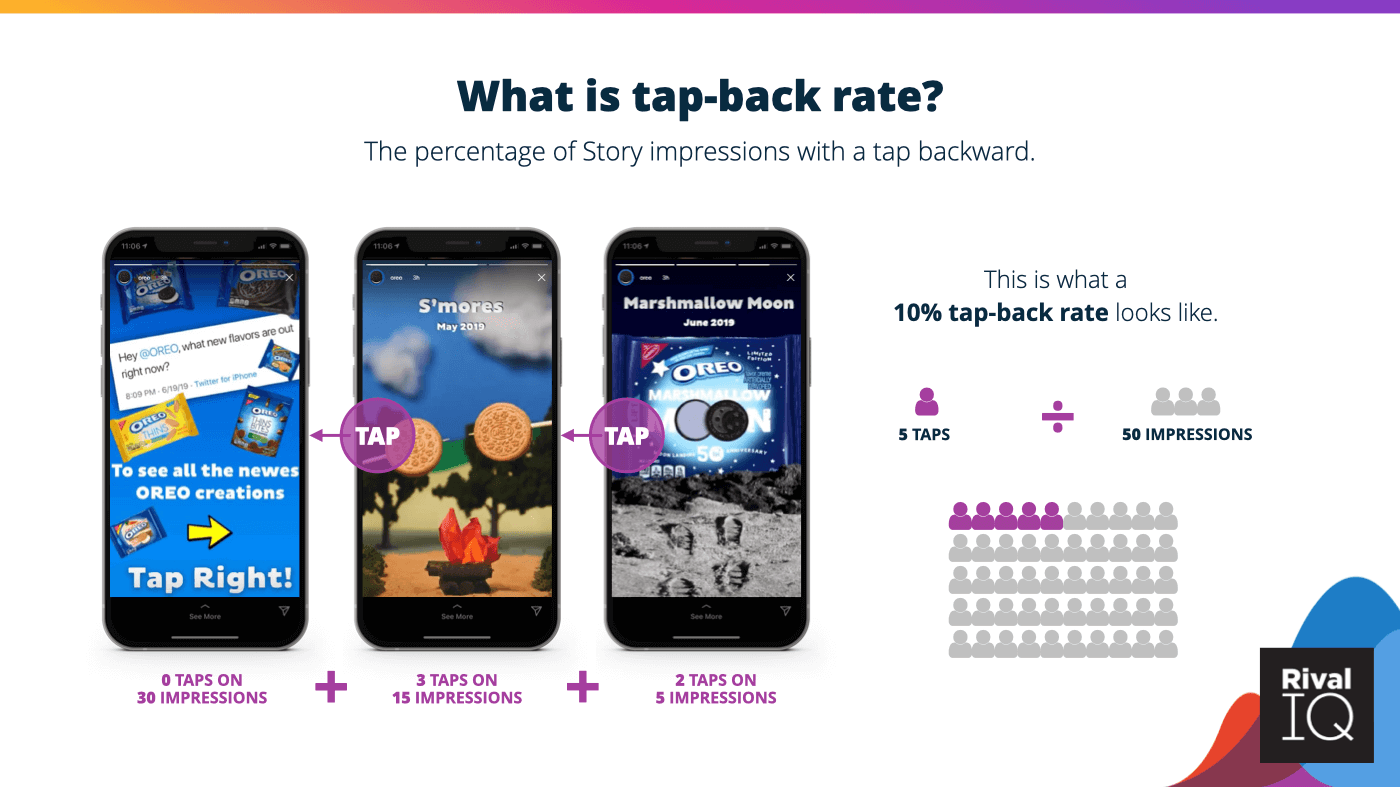
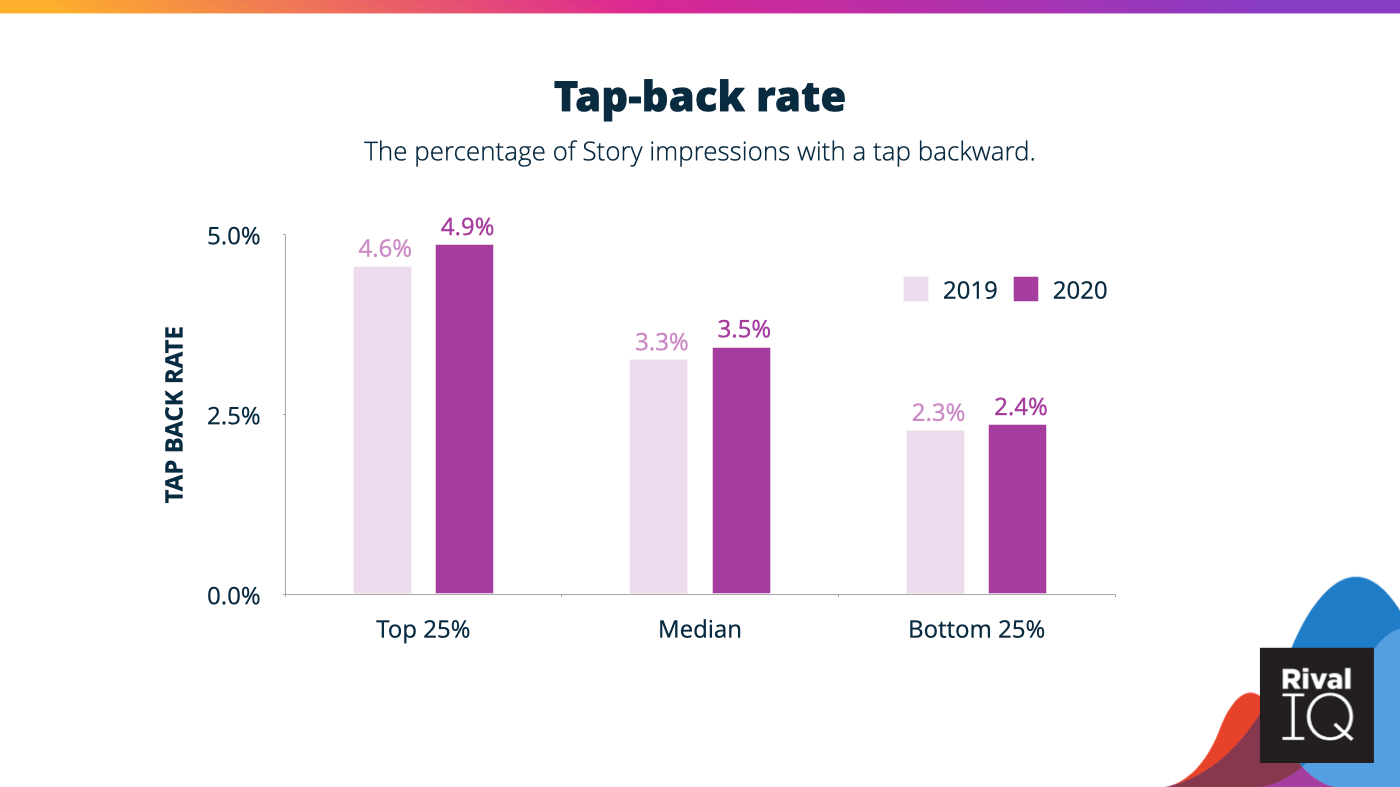
Tap-Back Rate
Every marketer loves an Instagram Story tap-back, because it means a viewer wanted a closer look or re-engage with a brand’s content. This rate represents the percentage of Story impressions with a tap-back.
As with many of the other key Instagram Story benchmarks in this report, the tap-back rate didn’t change much this year. The good news is that it’s a little higher across the board, which means brands are creating content that’s just a little stickier and more engaging than last year.
- The median tap-back rate is 3.5%, but the top 25% of brands see tap-back rates closer to 5%.
- The least active brands on Instagram can expect a tap-back rate of about 2.4% this year, which is half of what the most active brands see.
Savvy marketers will pay attention to Stories with especially high tap-back rates this year as indicators for content that your followers really want more of. We have tons of ideas for Instagram Story best practices, but lots of text or especially dynamic video frames can help encourage viewers to take another look at your frames.
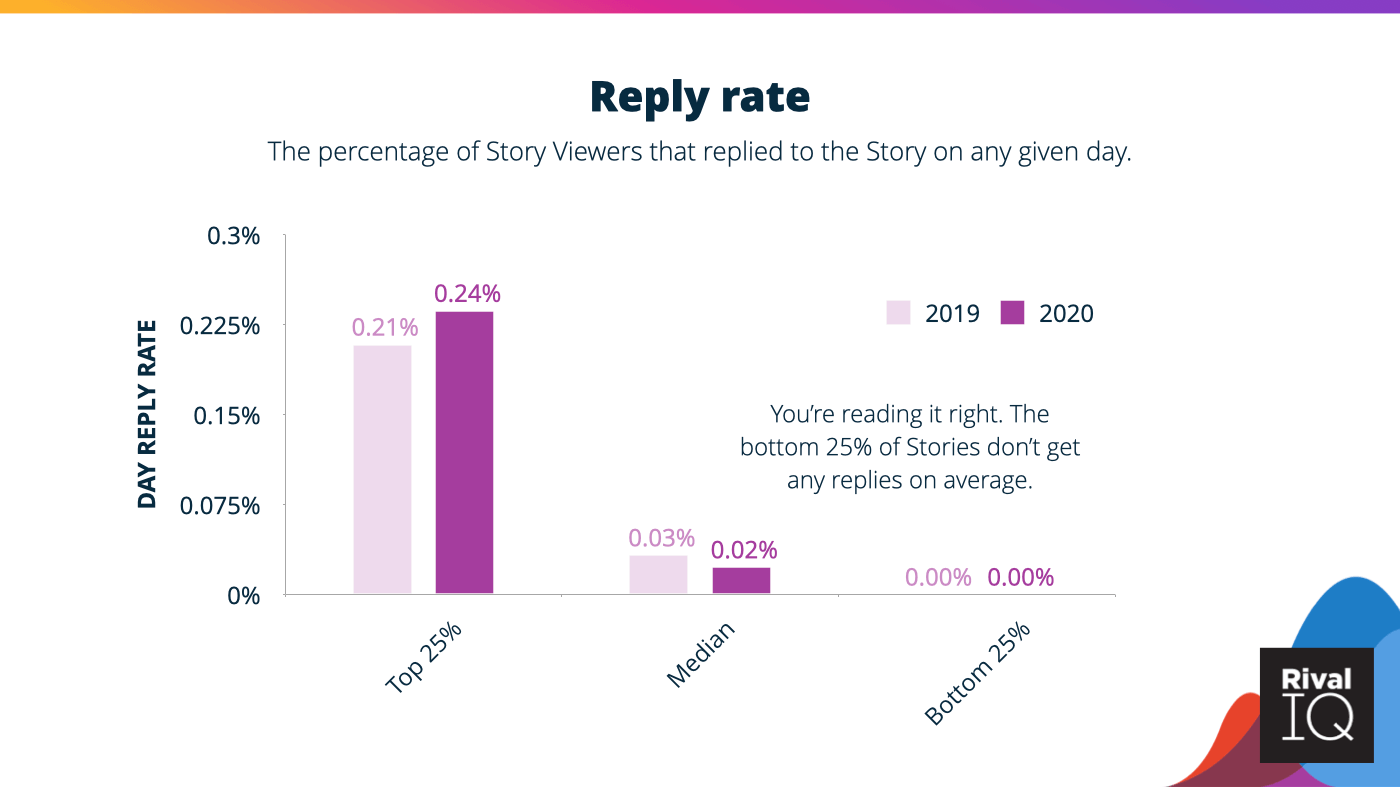
Reply Rate
How often do Story viewers reply to your Stories? Spoilers: not that often. Reply rate measures the percentage of Story viewers that reply to your Story on any given day.
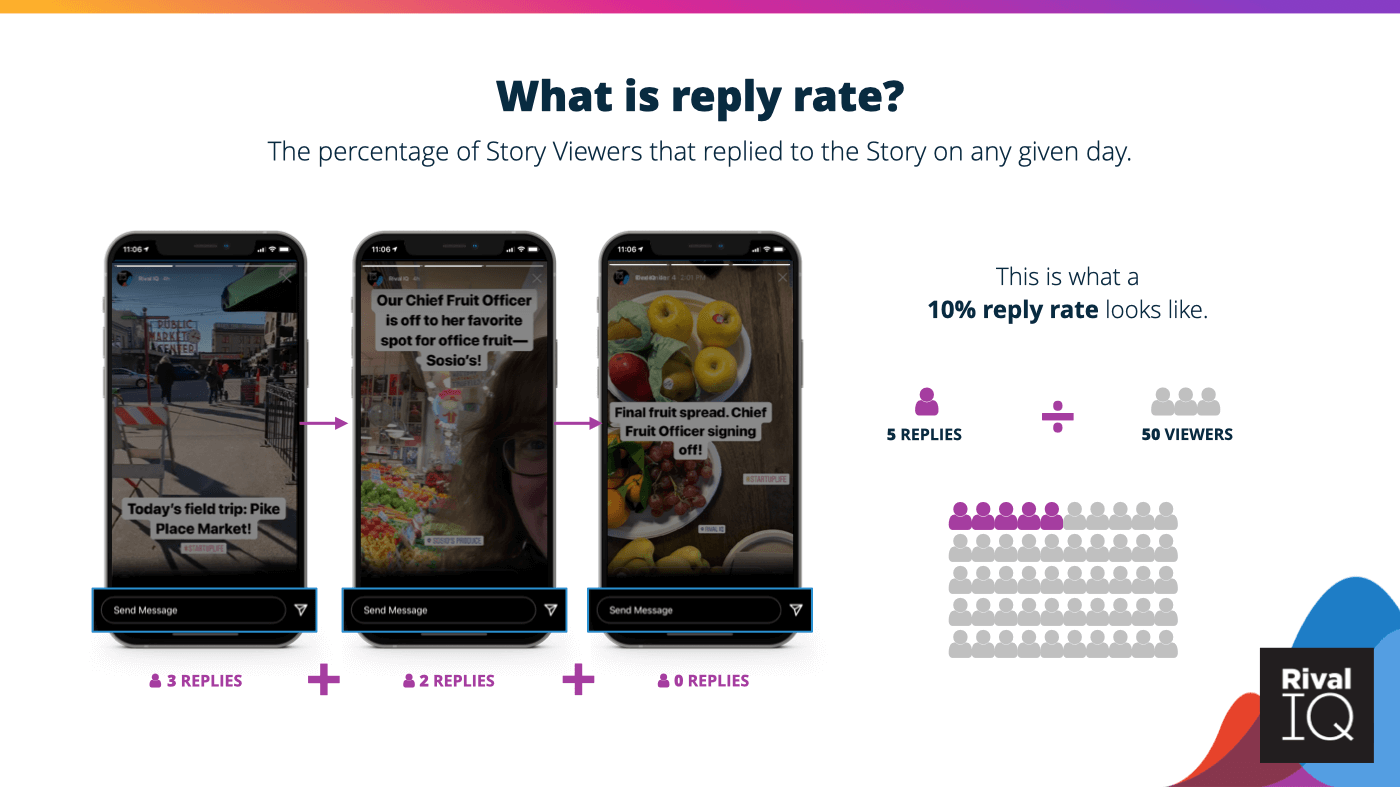
The average reply rate stayed about the same in 2020, which is to say: it remained pretty darn small because the vast majority of Instagram users don’t reply to Stories.
- The top 25% of brands in this study saw a 12% increase in Story replies, while median reply rates fell about 30%.
- Check out the bottom 25% of brands, which has a 0% average reply rate. ☹️
The best way to score an elusive reply is to ask for one by asking a question. Unfortunately Instagram’s API continues to limit data from in-frame engagement stickers like polls and quizzes.
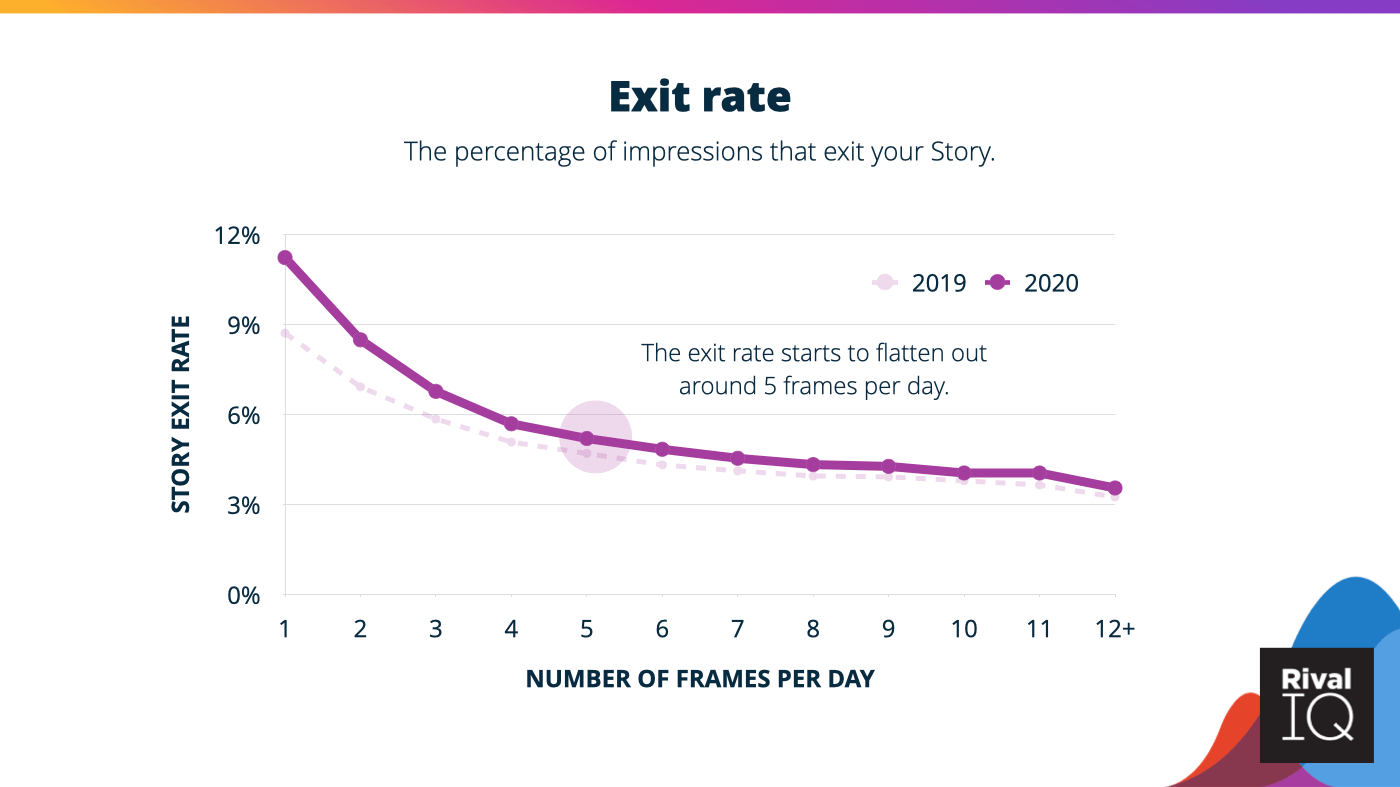
Exit Rate
Exit rates, which measure the percentage of impressions that exit your Story before it ends, increased a little this year. This slight increase in exit rates indicates viewers were slightly less engaged with Story content this year.
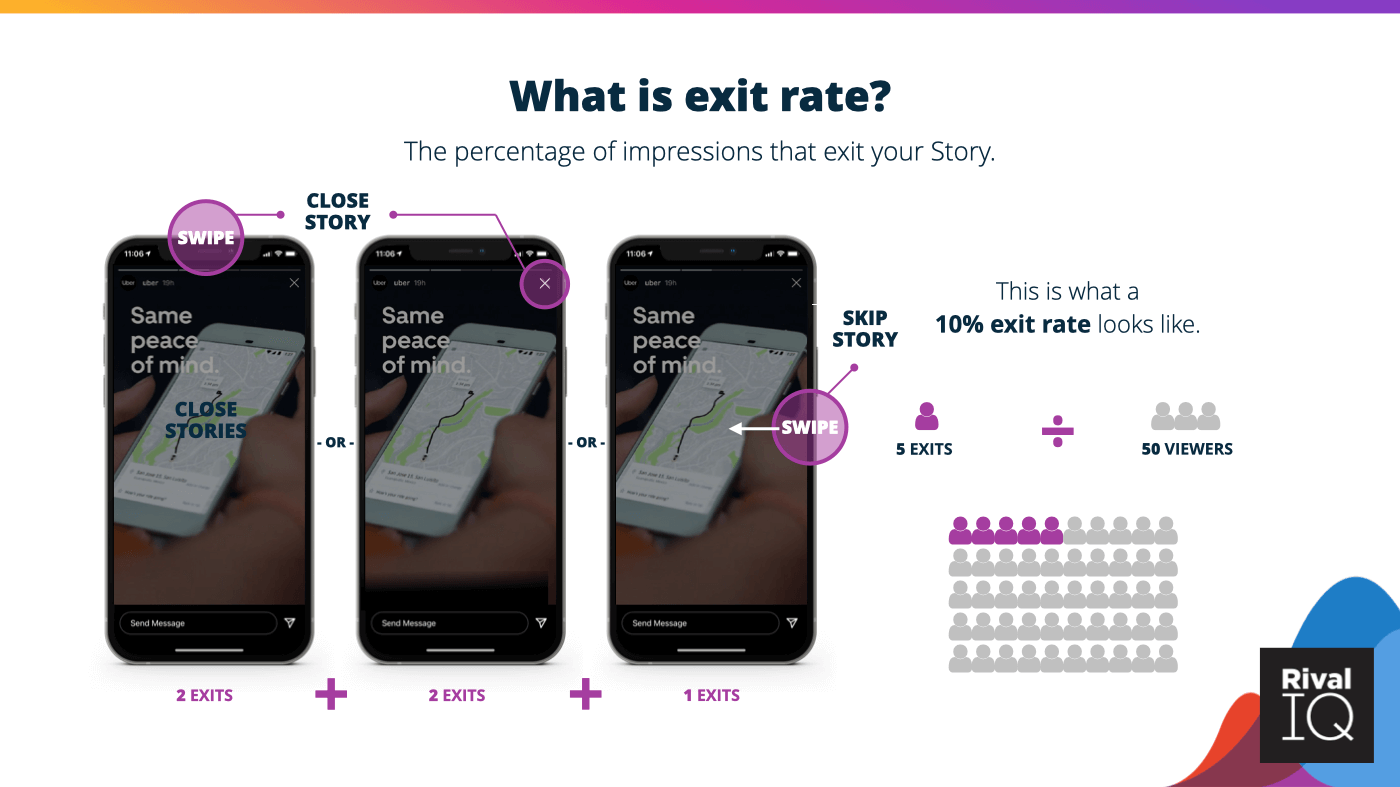
Brands saw exit rates increase by about 12% this year, which means viewers are a little more likely to bail on a Story than they were last year.
- Exit rates start at about 11% for Stories with a single frame.
- The rate begins to really tail off at 5 frames per day and flattens out in the 3% range.
As we noted earlier, Instagram continues to divide the attention of their viewers with features like Reels and IGTV. With more competition for attention, a drop here isn’t too surprising, but is definitely good for brands to keep an eye on.
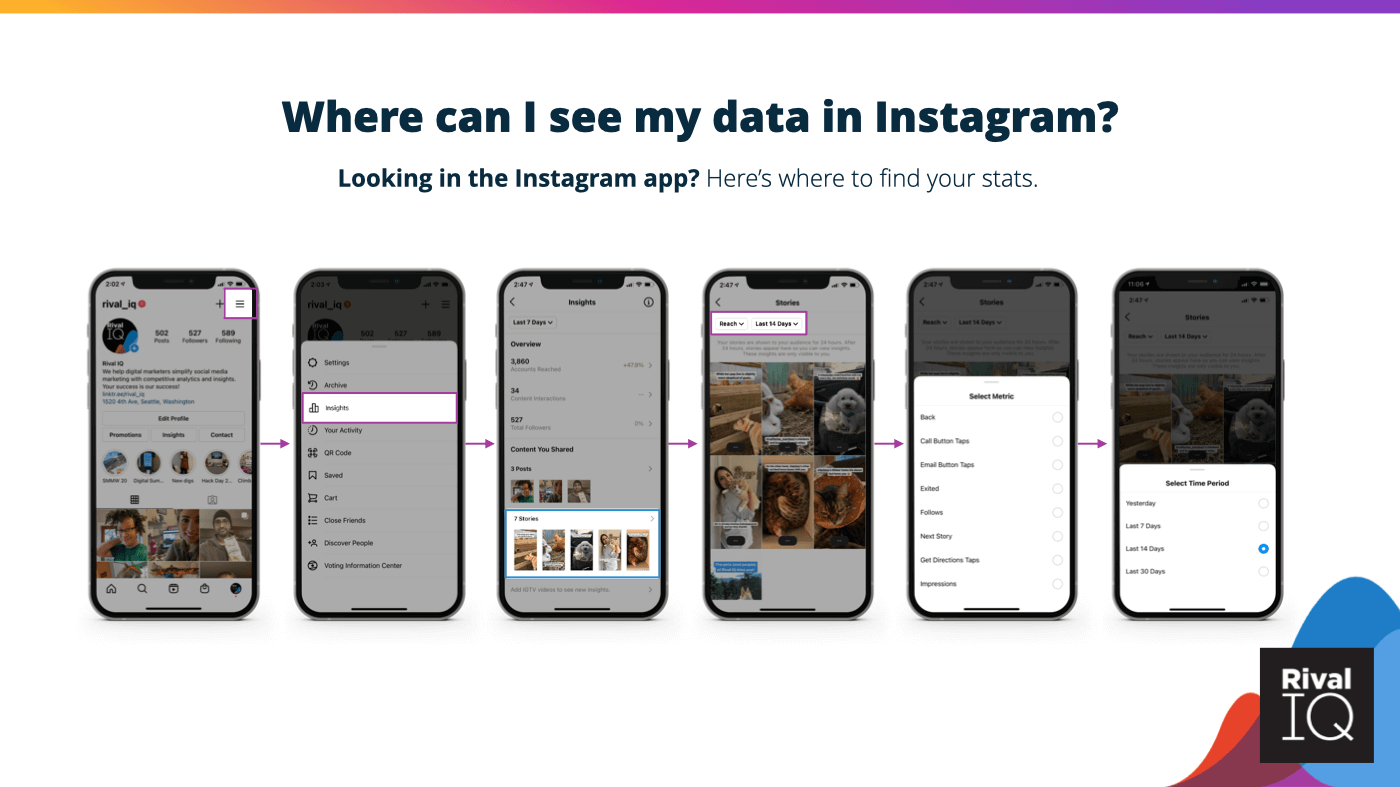
How to Find your Instagram Stories Data
Follow these simple(-ish) steps to find 14 days of Stories data natively in Instagram. Remember that these stats are available only for business profiles, creator accounts, or verified handles. Here’s more info from Instagram on how to access your data natively.
If you’re looking for way more Instagram Stories history and the ability to view all your Story stats in one spot, you can always start a free trial of Rival IQ or access Instagram Insights in your existing account. Once you connect an Instagram business profile to Rival IQ, you’ll start capturing all your new Instagram Story data (and more!).
Wrapping It Up
2020 wasn’t a huge year for growth or declines on Instagram Stories, which is nothing to sneeze at. In a year with a ton of distractions, from the pandemic to TikTok to US elections and beyond, the fact that brands were able to maintain their followers’ attention is a credit to all the hardworking marketers out there.
If we could give one piece of advice to marketers dipping their toes into the world of Instagram Stories or trying to improve their performance, it would be to focus on creating a few really engaging, dynamic frames to start off your Story. If your brand can hook viewers early with great content, it’ll improve your retention and turn your followers into fans.
Looking for even more Instagram Stories insights? Check out our Data-Driven Marketer webinar with Instagram expert Lauren Teague all about Inventive Instagram Strategies for 2021.
Where does your brand stack up when it comes to Instagram Stories? Let us know on Twitter (or Instagram!).
Methodology
Rival IQ analyzed over 45K Instagram Stories (and 190K+ frames!) posted between July and November 2020 to bring you insights for your 2021 marketing strategy.
We included 770 Instagram handles that had at least one Story published during each month of the time frame, and we only included handles with a reach of at least 100 views for each frame and a 1K total follower minimum. Handles were included only if we had all of their data for the entire time period, regardless of how frequently or infrequently they published Stories. These handles reached across multiple industries, including beauty, media, influencers, outdoor/adventure, marketing, and more.
Instagram Stories Metrics: Glossary
Here’s a handy glossary of the metrics and their definitions used in this report. This way, we’re all on the same frame.
Engagement: Measurable interaction on Instagram Stories and posts, including likes, comments, replies, and shares.
Exit Rate: The percentage of your impressions that exit your Stories by swiping right, swiping down, or closing Stories.
Frame: A single photo or video posted to your Instagram Story.
Impressions: The total number of views of a frame in your Story.
Post Reach Rate: The reach of a post expressed as a percentage of your followers.
Reach: The total number of unique people that saw a frame in your Story.
Reach Rate: Your Story Viewers on any given day divided by your follower count, expressed as a percentage.
Reply Rate: The percentage of your Story Viewers that replied to your Story on any given day.
Retention Rate: The percentage of your Story Viewers on any given day that see all your frames.
Story: The set of frames posted to your Story within a single 24-hour day.
Story Viewers: The number of people who saw your Story on a given day.
Tap-Back Rate: The percentage of your impressions that have a tap backward to see the previous photo or video again.
Tap-Forward Rate: The percentage of your impressions that have a tap forward to see the next photo or video.