If there’s one thing that’s stayed constant in the ever-evolving world of social media, it’s this: the numbers matter. To truly stand out in the crowded feed, you need data-backed insights. That’s where Instagram metrics come into play.
Tracking and analyzing key metrics helps you unveil the secrets behind what’s working and what’s not, empowering you to ace the Instagram game. In this blog, we’re walking you through the essential Instagram metrics you should be using to skyrocket your brand’s presence.
Ready to dive in? Let’s get started on understanding the world of Instagram metrics and how you can use them to fuel your brand’s success!
Understanding Instagram Metrics
To truly gauge your performance and understand how your content resonates with your audience, you need to keep an eye on the numbers that matter.
Instagram metrics can be conveniently split into four types, each serving a unique purpose in helping you evaluate your performance comprehensively. Let’s break them down:
- General Account Metrics: These give you a bird’s-eye view of your Instagram performance. Monitoring these stats will help you gauge your overall account growth and popularity.
- Post Metrics: Dive into individual post insights to see how each piece of content performs. By analyzing post metrics, you can identify the type of content that resonates best with your audience.
- Story Metrics: Monitoring your Story metrics lets you know which Stories are captivating your audience and which ones may need some fine-tuning.
- Reel Metrics: With the rise of short-form video content, tracking Reels metrics has become essential. They reveal how your short-form video content is captivating your audience, helping you craft Reels that keep those views and shares rolling in.
Each type of metric provides valuable insights into your Instagram performance. Tracking them all will give you a comprehensive understanding of your performance.
Top 9 Instagram Account Metrics
These metrics apply to your account as a whole, giving you a big-picture view of your Instagram performance.
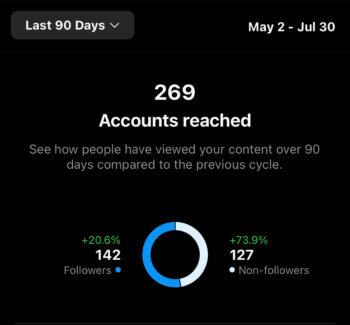
Accounts Reached: This tells you the total number of unique accounts that have seen any of your content. It’s a great indicator of your content’s visibility and how well you’re expanding your reach.
Followers vs. Non-Followers: You should also track the ratio of your followers to non-followers. Reaching non-followers means you’re expanding your community and reaching new potential fans.
Impressions: This is the number of times your content appeared in users’ feeds and explore pages. Keep an eye on this metric to track overall visibility and identify content that’s being shared or pushed by the algorithm.
Profile Activity: Get insights into how users interact with your profile, such as profile visits, external link taps, business address taps, call button taps, email button taps, and text button taps. It’s the best way to see how your Instagram efforts convert.
Accounts Engaged: Find out how many accounts have interacted with your posts. This metric highlights your content’s ability to spark engagement.
Total Content Interactions: This metric is the sum of all interactions on your content, including likes, comments, saves, and shares. It’s a quick measure of your overall engagement.
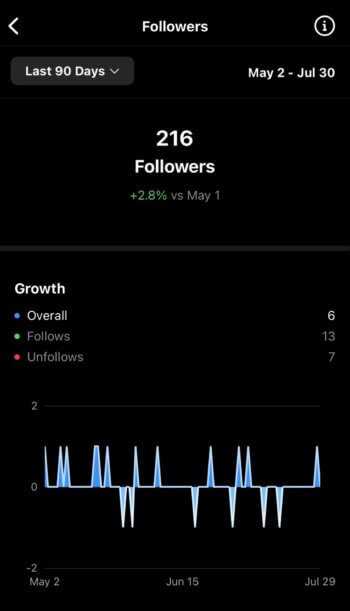
Total Followers & Follower Growth: Keep tabs on your follower count and growth. These are fundamental metrics that reflect your reach and community size.
Most Active Times: Be aware of when your followers are most active on Instagram. Posting during these peak times can boost your content’s visibility and engagement.
Demographics: Get to know your audience better with insights into their top countries, cities, gender, and age ranges. Instagram reports demographics for your reached audience, engaged audience, and your followers.
Now that we’ve covered the general account metrics, let’s take a closer look at how to evaluate the performance of individual Instagram posts.
Top 5 Instagram Posts Metrics
Here are the key metrics you should be tracking for individual posts.
Accounts Engaged: Knowing the number of accounts that interacted with your posts helps gauge the level of interest your content generates. Compare this metric to accounts reached to see how effective your post is at prompting viewers to engage.
Post Interactions or Engagements: This metric sums up all the interactions on your posts, including likes, comments, shares, and saves. It’s a good overall gauge of how well your content connects with your audience.
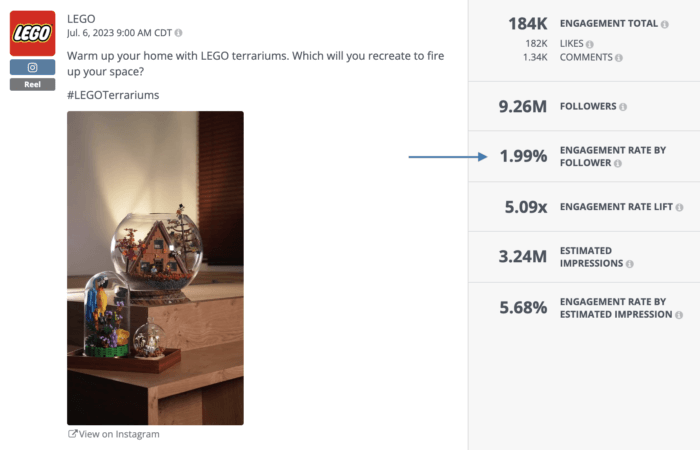
Engagement Rate by Follower: Often expressed as a percentage, this is a post’s total number of engagements divided by your amount of followers. Your engagement rate can also be calculated by dividing by impressions or reach, but using followers makes it easier to competitively benchmark your rates against others.
Profile Activity: This metric lets you see how many times users visited your profile after encountering one of your posts. It helps you understand how compelling your posts are in driving users to explore your profile further.
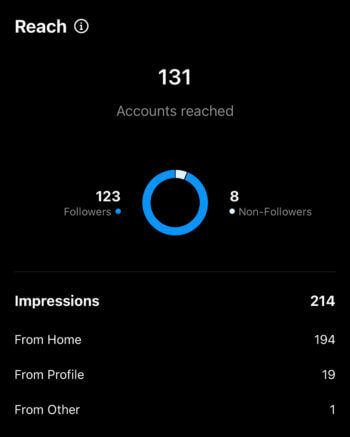
Accounts Reached: This metric reveals the number of unique users who saw your post on their feed or Explore page. It gives you a glimpse into the size of your audience and reach.
Impressions: Impressions indicate the total number of times your posts were displayed to users. Keep an eye on this metric to understand how far your content is spreading across the platform and where it’s being seen.
Now that we’ve covered evaluating Instagram post metrics, let’s shift our focus to another vital aspect of your Instagram strategy — your Stories.
Top 6 Instagram Stories Metrics
How do you know if your Stories are really making an impact? Keep an eye on these top Stories metrics:
Accounts Reached: This metric tells you how many unique users have seen your Story. Keep an eye on this to gauge your reach and audience growth.
Impressions: Unlike reach, impressions count total views, including multiple views by the same user. This metric helps you understand overall Story popularity.
Accounts Engaged: This measures the number of unique accounts that interacted with your Stories.
Story Interactions: This metric includes shares, replies, and other clickable elements. Keep track of these interactions to measure how your audience is connecting with your Stories.
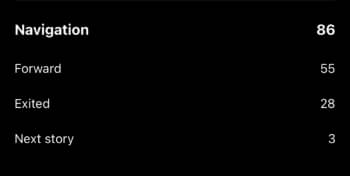
Navigation: Navigation metrics reveal how viewers move through your Stories, telling you how many users tapped forward, exited, moved on to the next Story, etc. Understanding navigation patterns helps you understand what resonates with your audience.
Profile Activity: Want to know if your Stories are driving people to your profile? This metric lets you know how many profile visits and follows your Stories are driving.
And there you have it. Keep these metrics in mind to fine-tune your Instagram Stories strategy and connect with your audience. Want to see how you stack up against other brands? Compare your numbers to our findings from our Instagram Stories Benchmark Report to get a deeper understanding of your performance.
Now, let’s dive into understanding Instagram Reels metrics.
Top 5 Instagram Reels Metrics
Instagram Reels has become an exciting platform for brands and creators to showcase their creativity and engage with their audience in fun, bite-sized videos. To track the performance of your Reels effectively, you should track these key metrics.
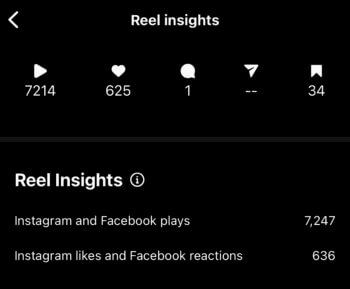
Plays: Plays indicate the total number of times your Reel has been viewed. Compare it to the number of accounts reached to understand whether the number of plays is a reflection of your audience size or if your Reel is being rewatched over and over.
Accounts Reached: This refers to the total number of unique Instagram accounts that saw your Reel. It measures the size of your audience and how far your content is spreading across the platform.
Accounts Engaged: This is the number of unique accounts that interacted with your Reel through likes, comments, shares, or saves. This metric tells you how well your Reel resonates with your audience.
Total Engagement: Instagram reports the number of interactions on a Reel and breaks it down by type of engagement. Likes show appreciation, comments reflect conversations, shares extend your reach, and saves indicate valuable content.
Engagement Rate by Follower: This is a Reel’s total number of engagements divided by your amount of followers. Just like a post’s engagement rate, this metric adds the context of a brand’s audience size to accurately measure how engaging a Reel is and make it possible to compare performance to other accounts.
Facebook Plays and Reactions: Since Instagram is owned by Facebook, your Reels might also get exposure on the parent platform. Keep an eye on Facebook Plays and Reactions to understand the cross-platform reach and engagement of your content.
By monitoring these Instagram Reels metrics, you can fine-tune your content strategy, understand what resonates with your audience, and create Reels that keep them coming back for more.
Measuring Instagram Metrics Natively
Now that we’ve covered the nitty-gritty of each metric, let’s talk about how to access your performance data. Instagram has its own built-in analytics dashboard, offering valuable data to help you track your performance and fine-tune your strategies.
Accessing Instagram Insights
Here’s a simple step-by-step guide to accessing your Instagram Insights:
- Switch to a Business Account. If you haven’t already, convert your personal account into a business account. Go to Settings and privacy, then navigate to Account type and tools and select Switch to professional account. From there, simply follow the prompts.
- Navigate to insights. Once your business account is set up, go to your profile and either tap on Professional Dashboard or tap on the menu icon and navigate to Insights.
- Explore your metrics. Inside Instagram Insights, you’ll find all kinds of data. From content reach and engagement to follower demographics, you can track and analyze various metrics to gauge your performance.
- Dive into the specifics. Want to easily see insights about a specific piece of content? Tap the View Insights shortcut under a post or on a Reel. For Stories, simply scroll up on an active Story.
Instagram Insights definitely has its perks. It’s free, easily accessible, and directly linked to your business account. But, it does come with a few limitations. For instance, insights are only available for the last 90 days and there’s no option to export your data for further analysis. Plus, tracking competitors’ metrics? Not possible with Instagram Insights.
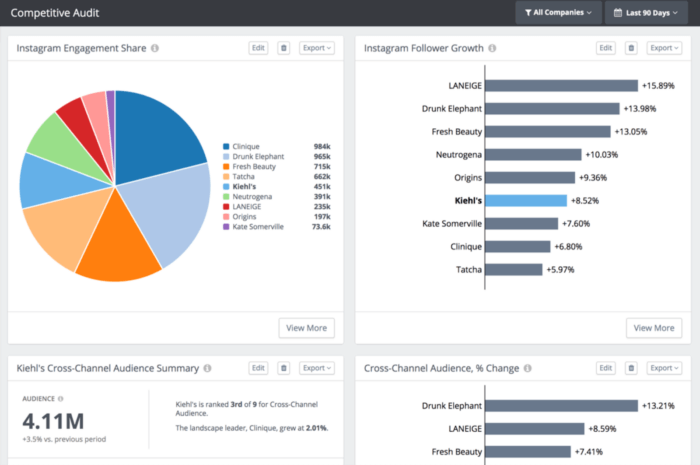
To address these limitations and gain a comprehensive view, consider turning to third-party tools like Rival IQ, which seamlessly integrate with Instagram to provide deeper analytics and competitive insights.
Leveraging Third-Party Tools
Why limit yourself to just what Instagram provides when you can have access to insights beyond the app? Third-party tools offer a range of advantages that can help take your Instagram game to the next level.
These platforms are designed to give you a deeper understanding of your audience, content performance, and overall strategy, allowing you to make data-driven decisions for growth.
Different tools and platforms come with their unique strengths and capabilities.
For instance, Rival IQ excels at providing in-depth analytics for both your brand and your competitors. Beyond providing a comprehensive view of your performance, our social analytics platform makes it easy to observe the competitive landscape and see how you stack up against the competition.
Other third-party tools and platforms may focus on different aspects of social analytics. Some may have extensive features for optimizing content creation and scheduling, while others may prioritize hashtag research or influencer tracking. The one that’s best for you will depend on your brand’s specific goals.

Wrapping It Up
Making data-driven decisions is the key to standing out from the crowd and taking your social media game to new heights. By leveraging top Instagram metrics, you can gain valuable insights into your performance, audience preferences, and content strategies.
Don’t let the overwhelming sea of data deter you. Embrace the opportunity to measure your Instagram performance and gain a competitive edge. Stay ahead of the curve by understanding the trends, optimizing your content, and responding to the changing landscape of social media.