Last week, Rival IQ Explore launched, giving you access to live social metrics from leading brands in 18 (and counting) industries. You can review social media benchmarks by industry, spotting trends, analyzing performance, and identifying commonly used hashtags. But how does this help you?
That’s a great question!
There are several ways that you can leverage the metrics, insight, and content from Explore. If you have an idea that I don’t cover here—give me a shout, I’m interested in learning from you too. Try any of these that interest you or align with where you’re at with your current social media strategy.
Benchmarks Enhance Your Competitive Analysis
Benchmarking social media should be a part of your competitive analysis. If you haven’t done a social competitive analysis ever, or even recently, use this free social media competitive analysis template to get started. (And yes, by free I mean really free. There’s no form to fill. Just click, download, and create a killer analysis to wow your boss.) Your full competitive analysis includes much more than social media benchmarks, but including these benchmarks adds valuable insight to your report.
Use the metrics in Explore to show how your brand compares to the top-tier brands we’ve included. This is especially helpful when you’re trying to explain your current social metrics to leadership or management. These benchmarks give a sense of a bar to understand if performance is on-par or even better than the perceived ‘best’.
Metrics that Matter
Every campaign has different metrics that matter most, just like ads. The purpose and intent of the campaign should drive how you measure its success. The same is true for every social post. Measuring a status update by clicks wouldn’t make any sense.
With Explore, we included the metrics that social media managers want to compare against broadly and frequently. But if there is a metric you’d like to analyze or compare that’s not there—just click the ‘free trial’ button to use Rival IQ and get a deeper look at each brand and other metrics. Here’s a bit about the metrics that we included, why they matter, and how you can use that for your social strategy.
Posts per Week
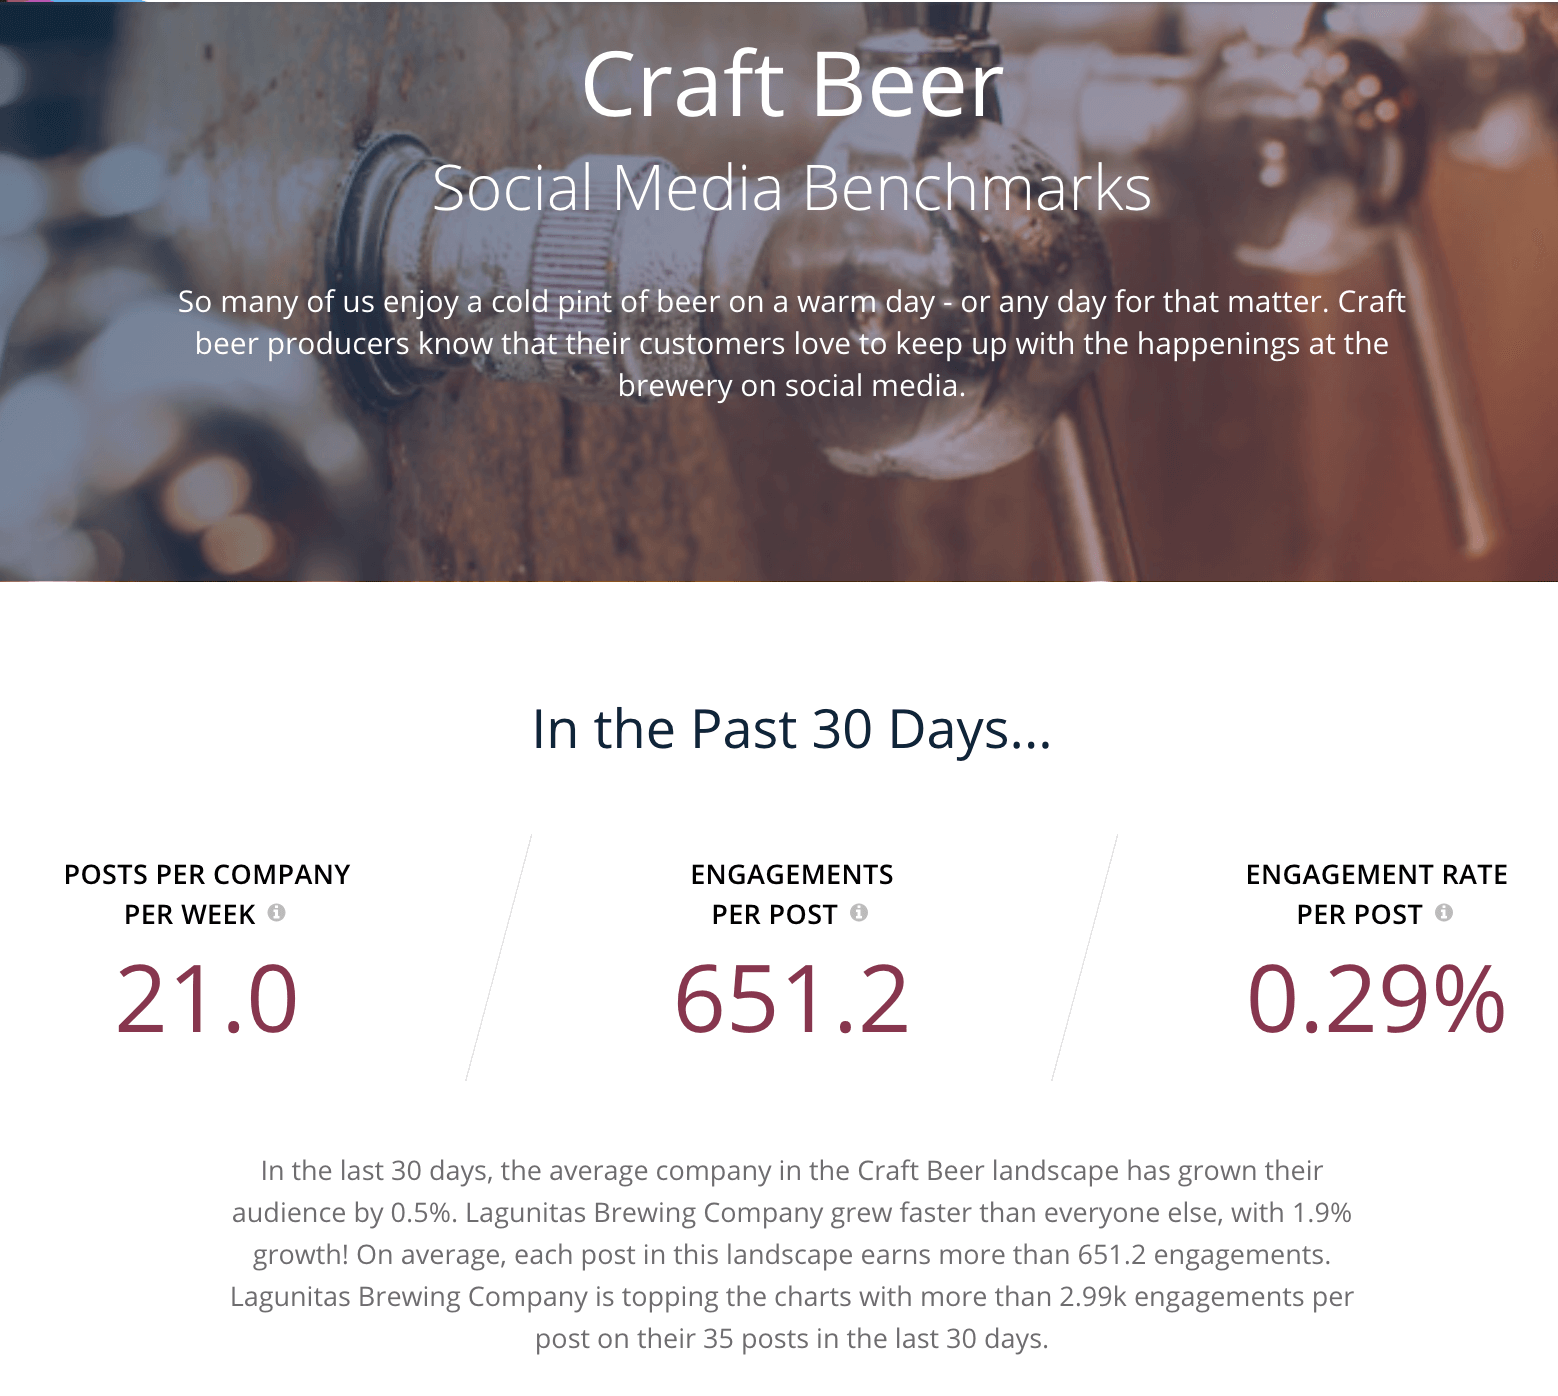
Post per Company, Per Week is the average number of posts across all social channels created each week by a single company. When you’re considering how to lay out your editorial calendar it’s helpful to understand the investment of your peers and industry heavyweights in their social content. This greatly varies with each industry and can reflect the role social media plays in a marketing strategy, the relationship with audiences, and more. By starting with this high-level stat you can begin to get an understanding of your industry’s themes.
Keep in mind that posting frequency is not consistent across social channels and the content itself reflects the differences. By keeping track of this metric you’ll be able to understand seasonal industry shifts in social media (for example: the fashion industry might see an increase in frequency around fashion weeks) as well as opportunities to stand out when brand posting drops. Use these metrics to get a sense of where your brand falls on the frequency spectrum — and investigate how shifting your frequency might affect your performance.
Engagement
Engagement is the key metric in social that indicates success. Social engagement is the interactions and interest in your brand. This includes actions such as likes, comments, or shares/retweets of your post.
The average number of engagements per post across all social channels are included in Explore. It’s easier to spot outliers when you have a sense of the average engagement rate for posts. This is helpful for your own comparison as you can understand if your average engagement rate is on par with industry heavyweights or has room for growth. It might feel discouraging if the average engagements per post are 10x what your brand experiences, which is why average engagement rate is also included.
Explore also includes an average engagement rate per post across all social channels. This standardizes engagement so you can compare it to past performance, competitors, and other organizations that are targeting the same audience as you. A brand with high average engagements per post doesn’t always correlate to a high engagement rate. Looking at engagement rate allows you to compare your content and post performance in a way that’s relational to your audience size. Often, only a small percentage of posts get an abnormally high amount of engagement while the rest of them engage audiences at a steady, more predictable level. Averaging it out cuts through the performance variability of single posts, creating a better idea of true performance.
Types of Engagement
As I mentioned, engagement is defined as “interactions and interest in your brand” that most social channels calculate by adding up your post’s likes, shares, and comments. These types of engagement should not be treated equally. Each of these social metrics is communicating something different.
- Like: A says that the content is interesting and that the audience would like more content like this.
- Comment: Comments carry more weight than a like because they correlate with the audience’s effort.
- Share: A share also carries more weight than a like. Clearly, the audience found it valuable and worthy of their own audience or network.
When you hover over individual posts within each of the Top-Performing posts sections in Explore you’ll see the engagement total and engagement rate. Each post also includes the metrics for each type of engagement. Eliciting a good engagement rate on social media means the content is resonating with its audience. The higher the engagement rate, the more likely the audience will be loyal and continue to purchase. Take note of how these top posts compare to your own brand’s top posts.
Measure Social Media Success
When it comes to planning and executing, it’s not uncommon to forget to create and define goals. But a “we’ll know success when we see it” sets you up for disappointment and confusion. Goal setting should be a part of every project plan, but if they’re not measurable and realistic they’ll do you no good.
Social media benchmarks by industry like the ones you see in Explore give you a way to create a relevant measuring stick — helping you ensure you have measurable and realistic goals. If your average engagement per a post is 1k, your goal to be at the same level as a brand with an average of 30k within 6 months might be a bit out of reach. But it could provide a long-term goal that you can use as a north star to point to.

Craft A Meaningful Story
Highlight your own social media success by painting a picture with social media benchmarks like the Canadian Olympic Committee. The Committee uses benchmarks as part of their sponsorship information — illuminating the value The Committee’s social channels bring to campaigns. They’re able to show potential partners how they consistently outperform Canadian media outlets and how they convert followers into fans. By bringing multiple pieces together it’s a compelling story that helps them succeed.

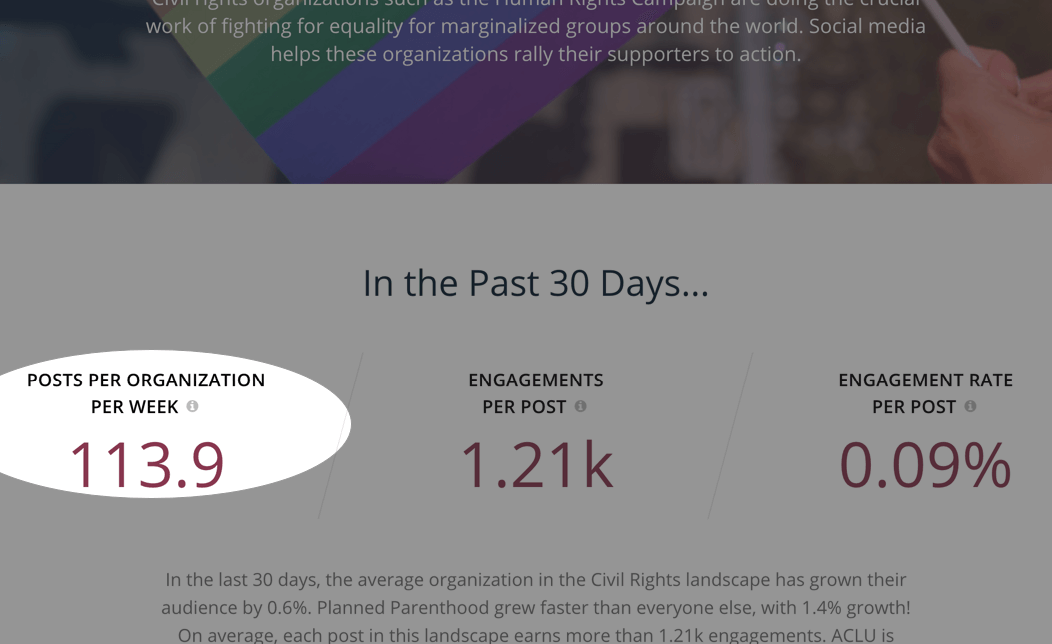
For example, if you’re a nonprofit, try pairing the average nonprofit Facebook engagement rate of .17% (according to our 2018 benchmark report) with the live data from Explore on top-tier nonprofits, like Human Rights Watch or World Wildlife Fund. Contrast that with how your organization is performing. For many niche organizations, engagement rates often outperform the best in class. It’s a compelling story when you’re talking about the passion of your community, the value a relationship can provide, and the opportunities that haven’t yet been tapped.
Social media benchmarks by industry also become a way to illustrate the concept that follower counts don’t make up for engagement metrics. Being able to articulate how your content compares, and how your audience shows their passion, helps you take ownership of your brand’s social media successes.
Depending on your industry, social media stats and metrics can vary drastically. Try telling a story about your brand and how it keeps up with heavyweights in your industry. By using Explore, you can find ways to show your brand outshining the top-tier companies. One possible way is comparing the average engagement rate. Since this average levels the playing field in relation to audience size, you might find that your engagement rate is significantly higher. Use this newfound insight to walk through how your social media strategy has engaged your audience.
Recently, we looked at local NPR affiliate, KUOW, discovering that their consistent approach and quality content drove a constant increase in followers and engagement. By using benchmarks, we could compare their performance against their industry and identify the driving force behind their continued growth. Often times, our stories of success don’t rely on breakout posts or fancy content — rather it’s a consistent understanding of our audience and how to engage them.
What if your performance doesn’t measure up? Use this opportunity to explain how the best brands are succeeding and the necessary changes that will lead to improving your own social media performance. Show your brand’s potential to compete with the best in your industry. Use the examples of top-performing posts as inspiration for social media content and strategy and illuminate the possibilities.
Be Inspired
It’s not uncommon for me to have a conversation with a cautious marketer. The conversation usually centers around a worry that watching competition so closely means you’re not giving your brand enough attention AND you’re probably missing what’s right in front of you. I understand this concern, and I’m not one to encourage you to prioritize watching your competition over creating a foundation. Yet, I would compel you to reframe what it means to pay attention to the competition.
Refining our craft as marketers means watching and learning from the best. It’s what you likely did in college. I can’t count how many case studies I’ve read over the years, or the award-winning campaigns I’ve pored over. While I might not have a big budget like Nike, REI, or L’Oreal, I can identify lessons within their successes and spot ways to translate that into my own work.

This research doesn’t replace the work of understanding your brand’s values, voice, audience and more, but rather it’s further knowledge and insight that helps enhance your strategy. By spending time with your competitors’ content as well as those aspirational brands you admire, you’ll begin to identify tactics like imagery, topics, or copy that lead to highly engaging content. Or you might notice how over time all the top brands are using similar color schemes and styles. This is a great time to ask yourself if it’s an opportunity for your social posts to stand out in the crowd.
And if you hadn’t been paying attention, you’d have missed the insight.
Use Rival IQ Explore to easily watch and learn from the best brands in various industries. Learn and try some of the tactics from the most engaging posts on Facebook, Instagram, and Twitter. Which is what Alliant Credit Union did as they prepared to expand their social presence onto Instagram. Instead of watching their own industry, they identified successful Instagram accounts from non-financial brands and unearthed strategies and tactics that would easily be applicable to their own audience.
These ways of using Explore to leverage industry insights naturally build on each other, but can just as easily be mixed and matched depending on your current social media strategy and bandwidth. Using social media benchmarks by industry is one way to help you improve your social strategy — but as I’ve outlined it can do so much more. Whether you’re trying to educate your leadership, sell partnerships, or tell a compelling story, adding benchmarks provides meaning, measurement, and clarity. And if you have another way you’re using benchmarks to rock, send me a note — I definitely want to hear from you!