Just in time for the end of the quarter/month/year, we’ve got the social media reporting template you need to help you strut your social stuff. What’s different in this year’s template, you ask? We’ve revamped it and added a section on social listening so you can dive deeper into your audience’s world and take your social game to the next level.
It’s always good to take a minute to reflect on how brands and agencies performed on social media. Looking back helps us capture valuable lessons and earmark experiments to try in the weeks and months ahead.
Social media reporting can feel daunting at first, and it’s hard to know where to start. To help you out, we have a quick and free social media reporting template you can download, and we paired it with a completed sample for inspiration.
Let’s raise a glass to recent social media successes and jump in!

Grab your free social media reporting template.
Download nowWhy you should use a social media reporting template
Managing one or more social media accounts is, as we all know, a serious undertaking, so reflecting on your success is critical. Running a check on your social media performance doesn’t have to take hours and hours, but it’s worth a little time for a few key reasons:
Makes your brand (and you) look good: By pulling out a few easy-to-find social media KPIs (key performance indicators), you’ll be able to see the channels, posts, and campaigns in which your brand excelled. Don’t forget to compare your data to your top competitors for critical context for your success, and of course, share it with your team.
Get a jump start on social media strategy tweaks: Taking note of what worked well for your brand and jotting down a few ideas for what’s working well for your competitors gives you a roadmap for exactly what you should be doing next on social.
Identify areas of improvement: It’s not just about celebrating wins; it’s also about spotting what didn’t quite hit the mark. Recognizing posts or campaigns that didn’t resonate well provides key insights into what to avoid in future strategies.
Understand your audience better: Stay tuned to the online chatter that’s happening about your brand or product to understand public opinions, trends, and sentiments. Social listening insights will help you tweak your content, making it more of what your audience loves and less of what they scroll past.
Map your performance over time: Investing a little time reviewing this year’s key social media metrics will give you even more to look back on next month/quarter/year to help you tell a story of how your social handles are growing and changing over time.
Take a quiet afternoon or a quick lunch break to review your brand’s recent social media performance. This review can be as quick or comprehensive as you need it to be, and don’t be afraid to go off-script by choosing other metrics or screenshots that are most relevant to your brand. We’ll walk you through exactly how to use our free, easy-to-use social media report template.
How to use our social media reporting template
If you haven’t already, download the free slide deck in Keynote or PowerPoint, which includes everything you’ll need to get started. We included social media reporting template slides and a sample report we filled out that’ll help you see what goes where. Then, log into your Rival IQ account (or sign up for a free trial), and we’ll get started!
Ready to start your report?
Step 1: Build a competitive landscape
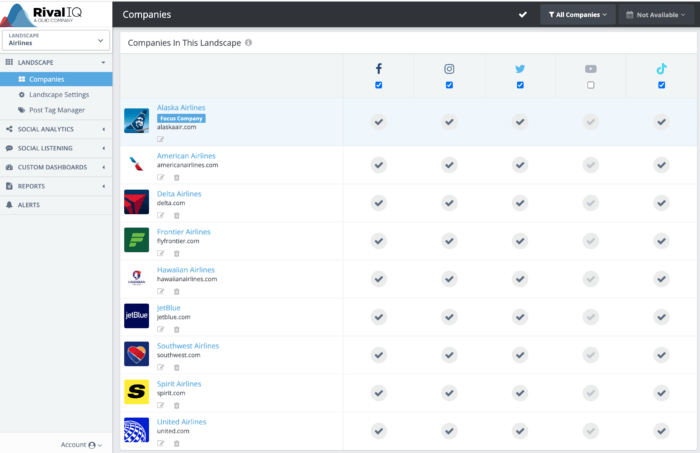
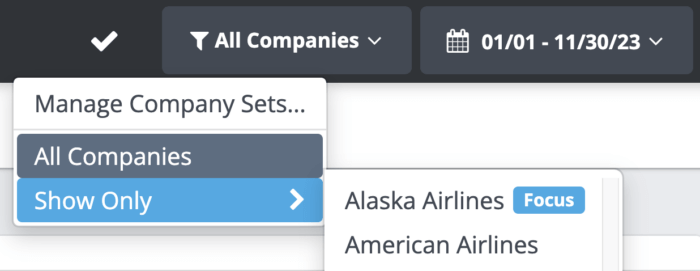
Any social media marketer worth their salt can name five competitors off the top of their head, so the first step is to generate a list of fellow brands you want to keep an eye on and then put that list into a Rival IQ landscape. You can definitely do this using native social media analytics, but it’ll require a lot more manual research, so we recommend using Rival IQ or another social media analytics tool.
In our sample report, we’ve picked Alaska Airlines as our focus brand. As you can see, we’ve included all the major airlines in the US to build the landscape. With Rival IQ, you can pick and choose which channels you want to report on. For this report, we have included Facebook, Instagram, TikTok, and Twitter in our analysis.
Once you’ve assembled your list of competitors, select the date range you want to study.
The first slide is easy: populate it with your logo, brand name, reporting period, and anything else you’d like to capture in summary.

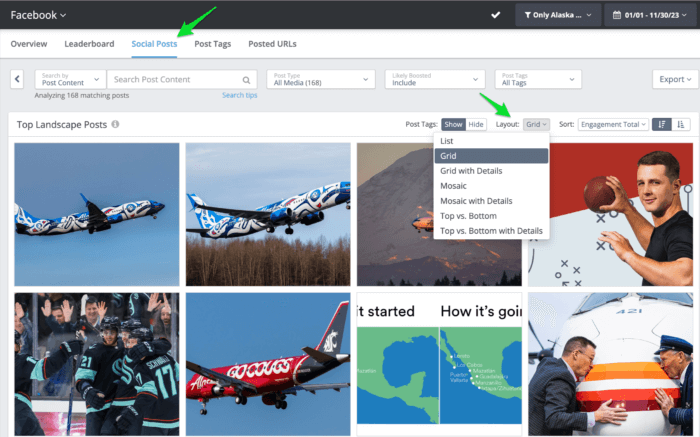
Then, screenshot a grid view of your top social posts and use them as the background for this slide. To make that happen, head to the “Social Posts” dashboard in Rival IQ for your favorite channel and set the “Top Landscape Posts” layout to grid view. Peep at the image below to see exactly where to click.
Step 2: Dive into channel-by-channel performance
The metrics overview slide is all about key numbers and graphs that show how you performed and grew on a specific channel over the reporting period you have selected.
Pick your favorite channel to get started. Paste your social icon in the top left corner, and replace [channel] with the correct name.

Step 3: Capture key data at a glance
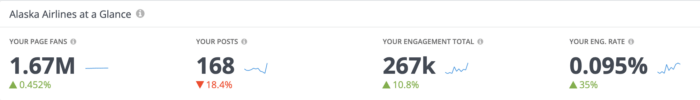
To fill in the left side, head to your Overview dashboard in Rival IQ for the channel you’re studying. All four of those stats are in the “At A Glance” table at the top of the screen, so just screenshot and pop them in. Here’s the table you’re looking for:
Step 4: Locate followers and engagement total
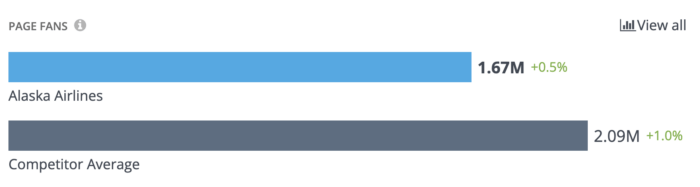
Let’s fill in two other key metrics for the right half of the slide. Scroll down on the Overview dashboard for your followers vs. competitor average, which looks like the graph below. Pop that in the top right, and then do the same for its neighbor, engagement total (or go rogue and select another metric–we won’t mind).
When you’ve arranged all your metrics the way you like, spend a few minutes studying them. Are you way ahead of your competitors in one area? Did you grow your followers or engagement total significantly as compared to last year? Don’t forget that we have tons of automated insights in the Overview dashboard of Rival IQ as well, so poke around there for other observations about what stands out about your social media performance.
Once you’ve gathered a few thoughts, jot them down on the right side of the slide so you don’t lose those valuable insights. When you’ve assembled everything on this slide, it’ll look something like this:

You’re halfway done with your first channel! Now that you’ve created an overview of your performance on this channel, let’s spend a little time on what led to that success by jumping into top posts.

Just like above, you’ll want to drop your social icon in the top left box and specify your channel in the slide’s title. We’re going to focus on your brand’s performance only for this slide, so change your company filter in Rival IQ to focus on just your brand.
Step 5: Find your top posts by engagement total
Head back to the Social Posts dashboard for your chosen channel and click on the “View More” button in the “Top Landscape Posts” table. Use the layout dropdown to select “grid with details.” Then, sort by engagement total, or the metric of your choice. We like engagement total because it focuses on your absolute impact on social, but this template is totally customizable so you can use your most important metrics.
It’ll look something like this (but probably with fewer planes).

Play with your browser zoom and width to focus on the posts that are most relevant to you. In this example, we picked the top six.
Step 6: Calculate engagement total per post in your top 6
Your overall engagement total per post helps set a baseline for the engagement you can expect (and improve upon!) in the future. To find that number, take the engagement totals at the bottom of each post in your top 6 and divide them by the number of posts you’re looking at to fill in the average engagement for the top 6 posts. In this case, Alaska Airlines averaged 9,556 engagements per post, which is nothing to sneeze at.
Write up a sentence or two about commonalities or differences among your top posts. Are they all videos or photos? Do they all feature product shots, or do posts with people perform better?
Step 7: Identify your top campaign or hashtag
On the right side of the “Top Posts” slide, we’ll focus on a top social media campaign or hashtag. We bet you’re intimately familiar with the strategies you tried recently, but if you need a little #inspo, head to the Overview dashboard where we pull out a few key insights to focus on. You can also review the Social Posts dashboard where we dive deep into top hashtags, popular topics that were mentioned in your posts, and more.
Once you’ve picked an area of focus, try tagging your posts using Post Tags to easily keep track of campaigns and pull out top metrics. Screenshot a few of the top posts, and then do a quick calculation or head to the Post Tags dashboard to see the average engagements per post for that hashtag or campaign.

Write up a sentence about what made this campaign successful and any lessons learned.
Step 8: Calculate your overall engagement total per post
Since this slide focuses a lot on engagement totals, be sure to fill in the overall engagement per post in the bottom right. To find that number, pop back to the previous slide to divide your overall engagement total for the year by your total number of posts.
When you’ve assembled everything on this slide, it’ll look like this:

Lather, rinse, repeat
Congratulations! You’ve completed one channel’s worth of your social media reporting. Repeat this process for any other channels that matter to your brand.
Step 9: Gather your social listening insights in a single click
The Social Listening Overview slide focuses on key metrics for your search terms and the net sentiment generated by all the posts across tons of data sources on the web over the last 30 days.

Quickly analyze conversations about your brand or industry directly within your Rival IQ landscape with the Instant Search feature. Enter your search term and use our intuitive query builder to easily fine-tune or narrow your results.
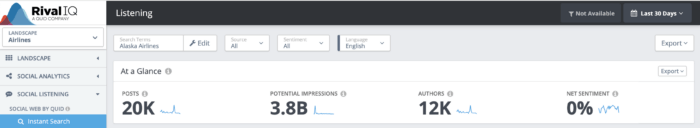
Pop those high-level stats in the At a Glance section on the left side of the template for info on the number of posts about your search term, the potential impressions across tons of sources around the web, the number of authors posting about your brand, and your net sentiment, which describes how positively or negatively people are talking about your brand. Don’t miss those blue sparklines to show how things are fluctuating in each of these key areas.
Step 10: Dig deeper into your sentiment analysis
The Posts and Sentiment panel lets you visualize the number of conversations happening about your search term over time and identify any correlation between volume and sentiment. Take a screenshot of these charts and pop it into the center of the slide.
Use the post volume (grouped here by day) to identify upticks in conversation about your search term easily. Hover over the posts per day or the net sentiment per day to drill into the conversations that took place by clicking on View Content. Include your observations about large increases in post volume or key sentiment drivers in the right side of your slide.
The completed slide should look something like this:

That’s it for your 30-minute social media report! Well, except for sending it to everyone you know and/or posting it on social, of course.
Extra Credit: To-Do List
This slide will help you keep track of experiments you want to run, new strategies or campaigns you want to, uh, borrow from your competitors, social networks you want to check out, and any other social media goals you come up with.

Here are a few recommendations and experiments for Alaska Airlines based on our quick study of their recent social performance:

Alaska Airlines’ To-Do List provides inspo and a place to start in the new year, like experimenting more with Carousel posts and TikToks.
Other social media resources
We have a few other ideas for adding context to and showing off your social media success, including handy reports and free tools.
Social Media Industry Benchmark Report: This report is the definitive guide to exactly what’s going on with Facebook, Instagram, and Twitter for 14 top industries like Health & Beauty, Travel, Food & Beverage, and tons more. Use this report to measure your social performance against your industry so you can see if you’re better or worse than the other top brands you’re competing with. We survey hundreds of brands in each industry for a comprehensive set of benchmarks.
Free head-to-head social analysis: Want a free report that compares your social success to your #1 competitor? Run a free head-to-head analysis on Instagram, TikTok, Facebook, or Twitter to get granular.
Find the right social tools for your workflow: We tested and reviewed dozens of social media analytics, management, and listening tools to find the best one in each category and price point. Check out the lists to see if there’s a social media tool that can help streamline your workflow. Of course, we’re biased towards one analytics tool in particular…😈

Wrapping it up
We hope this 30-minute social media reporting template helps you celebrate your successes while setting you up for your next big social media strategy move. Don’t forget to send around your completed social summaries to your colleagues, your boss, your mom, and anyone else who will listen–including us. We’d love to see what you come up with!
This post was originally published in December 2022 and has since been updated.