It’s here: our first (but definitely not last!) TikTok Benchmark Report, with all the metrics you need to see how your brand is performing on TikTok.
Key metrics like engagement rates, hashtags, and posting frequency? On it.
Analytics sliced and diced by industry, follower count, and more? Check and check.
Profiles of standout performers to inspire your brand’s videos? Oh yeah.
Read on for all the info your brand needs to outperform your competition on the #FYP and beyond this year.
Key TikTok Benchmarking Takeaways
TikTok is out-engaging other channels.
Median brands are earning an average engagement rate per follower of 4.1% on TikTok, which is 6x Instagram and way, way more than Facebook and Twitter.
Mentions matter.
Brands are seeing an engagement boost when they include mentions in their videos, and you can bet those mentions are helping with follower growth as well.
Health & Beauty, Higher Ed, and Sports Teams dominate.
These industries are consistently at the top of the pack across other social channels we study, so it’s not too surprising that their content is engaging fans on TikTok too.
Brands are producing less content for TikTok than for other channels.
With the average brand posting just 1.8 videos per week, it’s clear that brands are still ramping up posting on TikTok.

Grab the full report with even more TikTok #inspo.
Download the full reportTikTok Videos per Week
We get the question, “How often should my brand be posting on social media?” a lot, because nailing your posting frequency really matters. Establishing your brand’s TikTok posting frequency benchmark against a) brands of a similar size and b) competitors in your industry is the best way to figure out how many videos per week you should be aiming to post.
TikTok Videos per Week: Distribution
The average brand in this study publishes about 1.8 videos per week, or about 8 per month.
- The top 25% most active brands published videos at least 5 times per week on average.
- A full 30% of brands publish less than once a week.
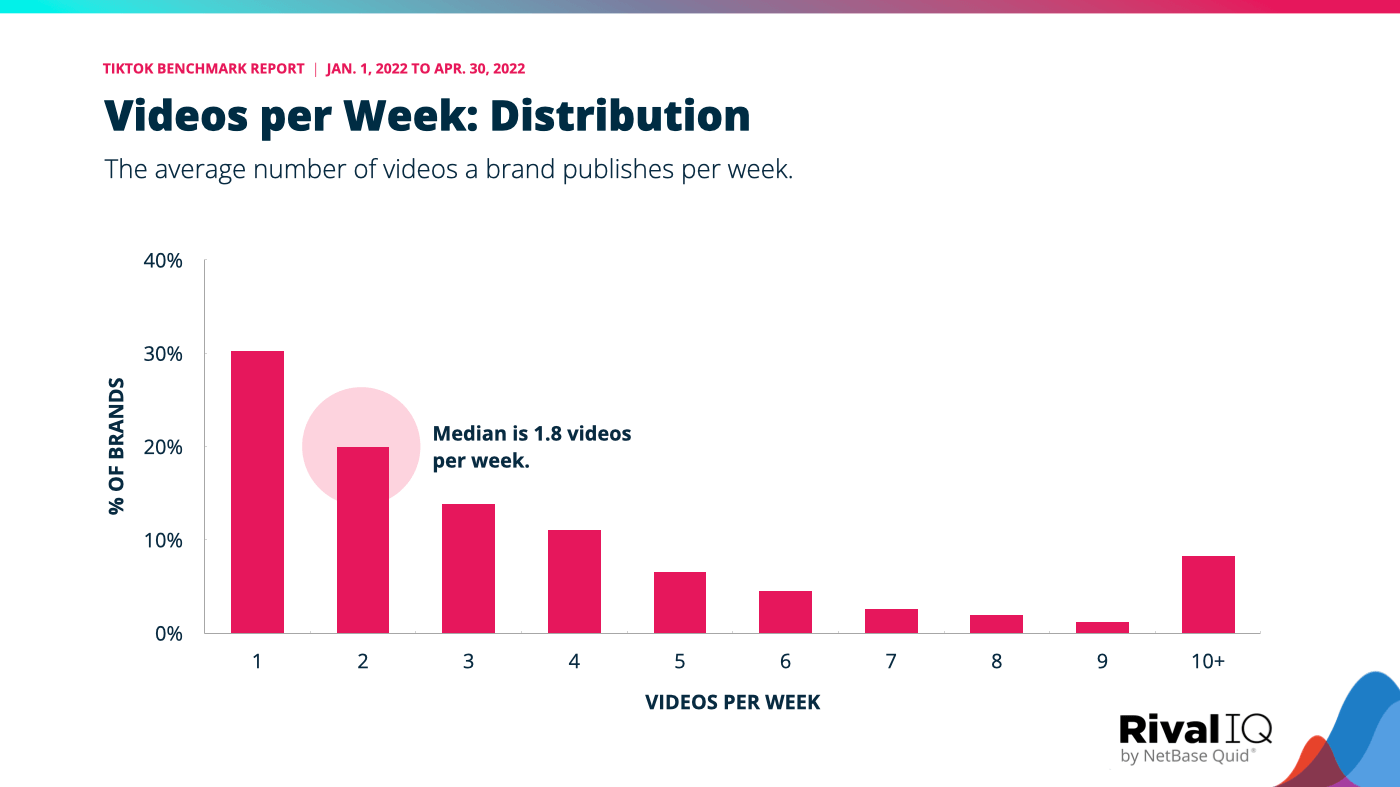
Creating compelling videos for TikTok is definitely an investment for brands. The median posting frequency here is about 2.5x lower than what we see for Instagram posts in our annual social media benchmark report.
TikTok Videos per Week: Account Size
The larger your account, the more likely you are to publish more frequently.
- The smallest bin we studied (1K-5K followers) averaged about 1 video per week.
- Accounts with 1M+ followers post 3 or more times per week.
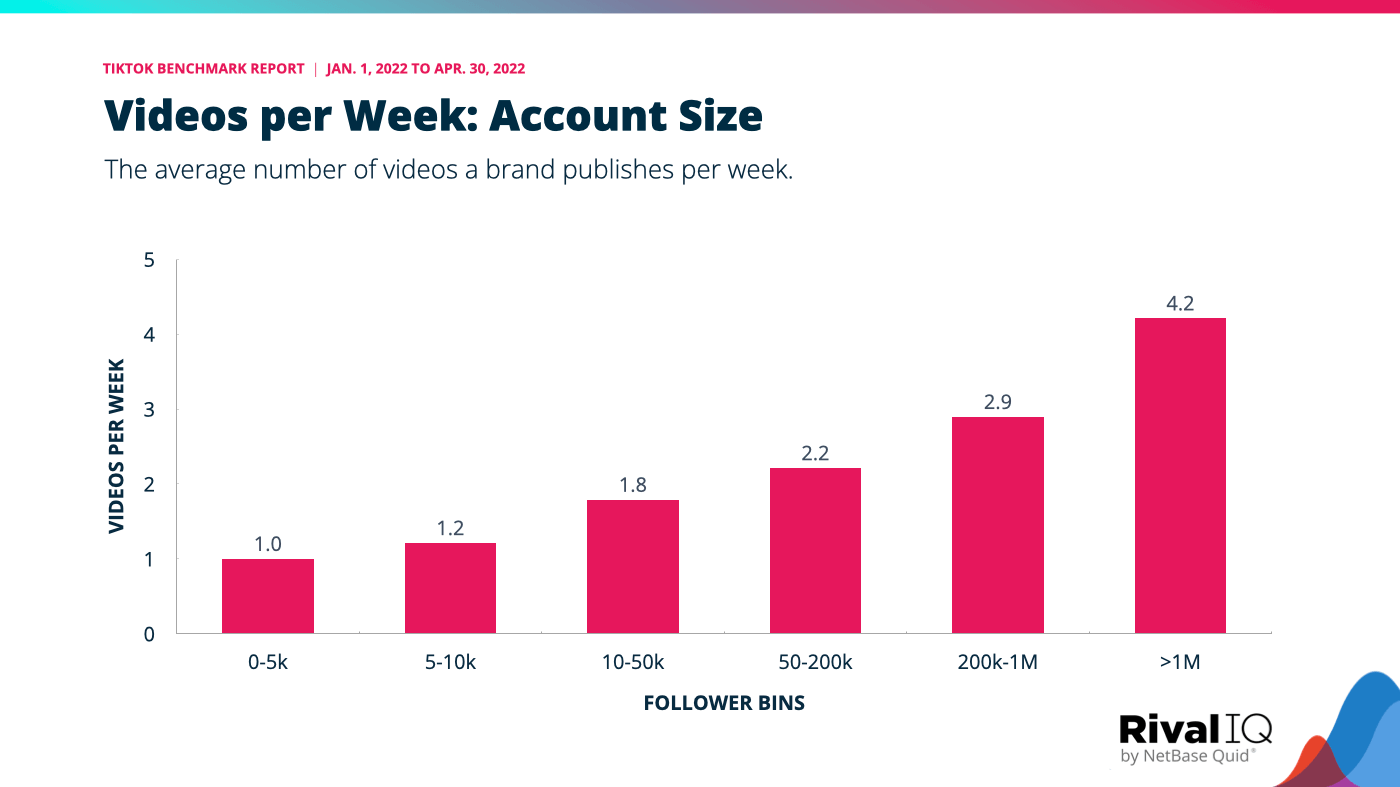
It’s not surprising to see this correlation between follower count and posting frequency. Of course, having more followers doesn’t make you post more. Rather, accounts that consistently post a higher volume of quality videos are going to grow their accounts. As they grow, we see the investment in posting grow along with it.
TikTok Videos per Week: Industries
There’s a wide range of frequencies as we examine posting behavior by industry.
- Media brands top the charts with the average brand posting more than four times per week.
- The least active industries, Nonprofits and Food & Beverage, publish slightly more than once a week (about five videos per month).
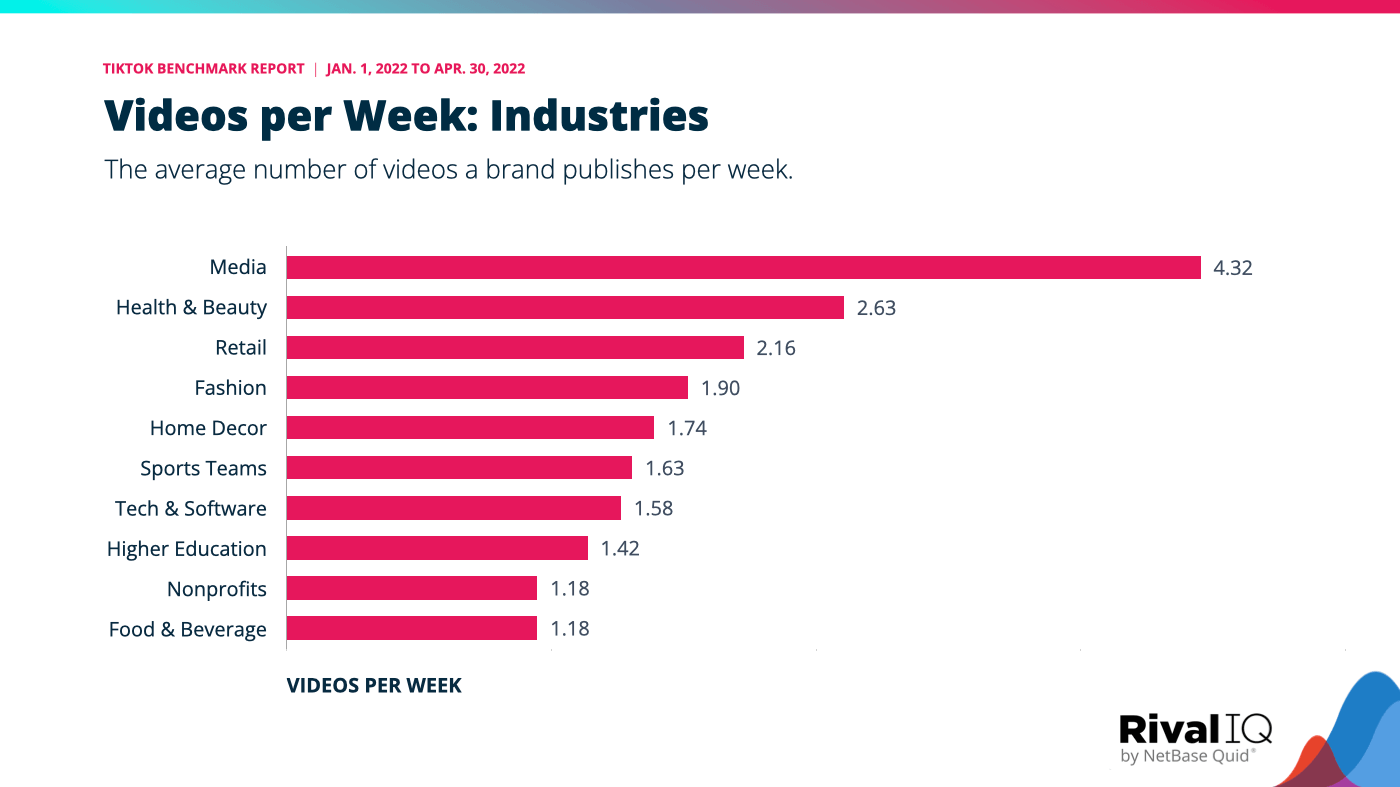
Media and Health & Beauty post more frequently than other industries on nearly every channel we study, so their TikTok frequency is no surprise. The same can be said for the lower posting frequencies of Higher Education and Food & Beverage. One notable deviation is Nonprofits; their investment on TikTok is relatively low compared with their posting on Instagram.
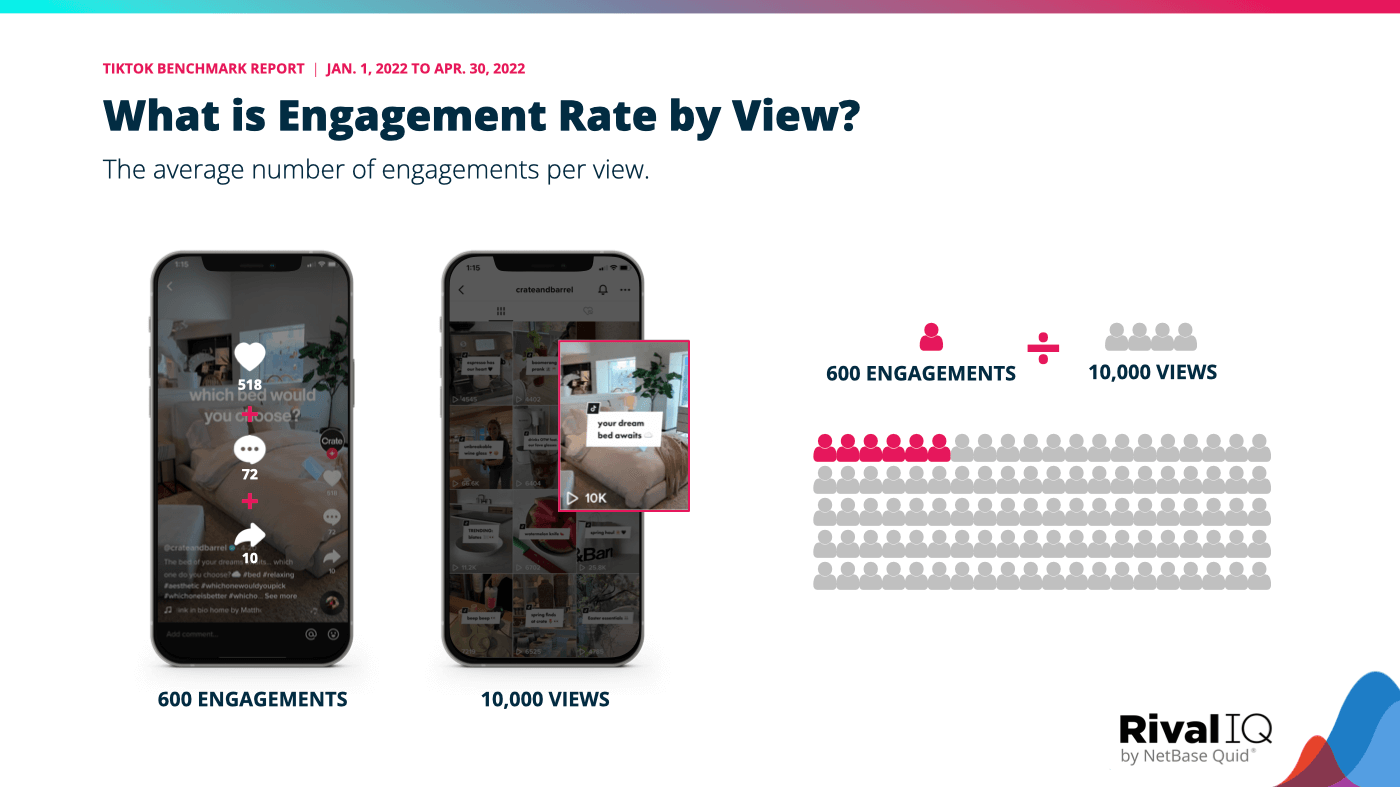
Engagement Rate by View
Engagement Rate by View on TikTok is one of the best measures of a video’s quality. Why? Counting the number of times a viewer liked, commented, or shared and dividing it by the overall number of views measures just how compelling your content was. If your video wasn’t high-quality, thought-provoking, or even controversial, viewers will be less likely to engage with it, and therefore you’ll earn a smaller engagement rate per view. If your video was attention-grabbing, viewers will be more likely to take the extra step of engagement before swiping to the next video.
Engagement Rate by View: Distribution
The average brand in our study earns an engagement rate by view of 5.8%.
- Only about 20% of brands earn double-digit percentages for engagement rate by view.
- Low engagement rates by view are an indication that boosting is a substantial part of the reach for a video. About 7% of brands average less than 2% across all their videos, suggesting they’re boosting an appreciable portion of their videos.

Engagement rate by view is a roughly comparable metric to engagement per impression that we see on other platforms like Instagram. In our most recent Instagram report, we noted that brands have been consistently earning 5.5% engagement per impression.
Engagement Rate by View: Account Size
Starting with accounts larger than 50K followers, we see an upward trend in the average engagement rate by view.
- Brands with 200K-1M followers have an average of 7.6% engagement rate per view, almost 46% higher than brands in the 10K – 50K range.
- The largest accounts, with more than 1M followers each, are reaching an engagement per view of almost 9%.

Given the strong role that the FYP algorithm plays in the world of TikTok, it isn’t surprising to see a positive correlation between account size and engagement rate by view. Brands with large followings didn’t get that way by creating mediocre content. Consistently producing high-engagement videos is a sure way to grow your following.
Engagement Rate by View: Industries
Sports Teams, Nonprofits, and Higher Ed top the list when it comes to highly engaging content.
- The Sports Teams in this report average an eye-popping 11% engagement rate by view.
- On the low end, Health & Beauty, Home Decor, and Fashion brands are all below the report-wide average of 5.8%.
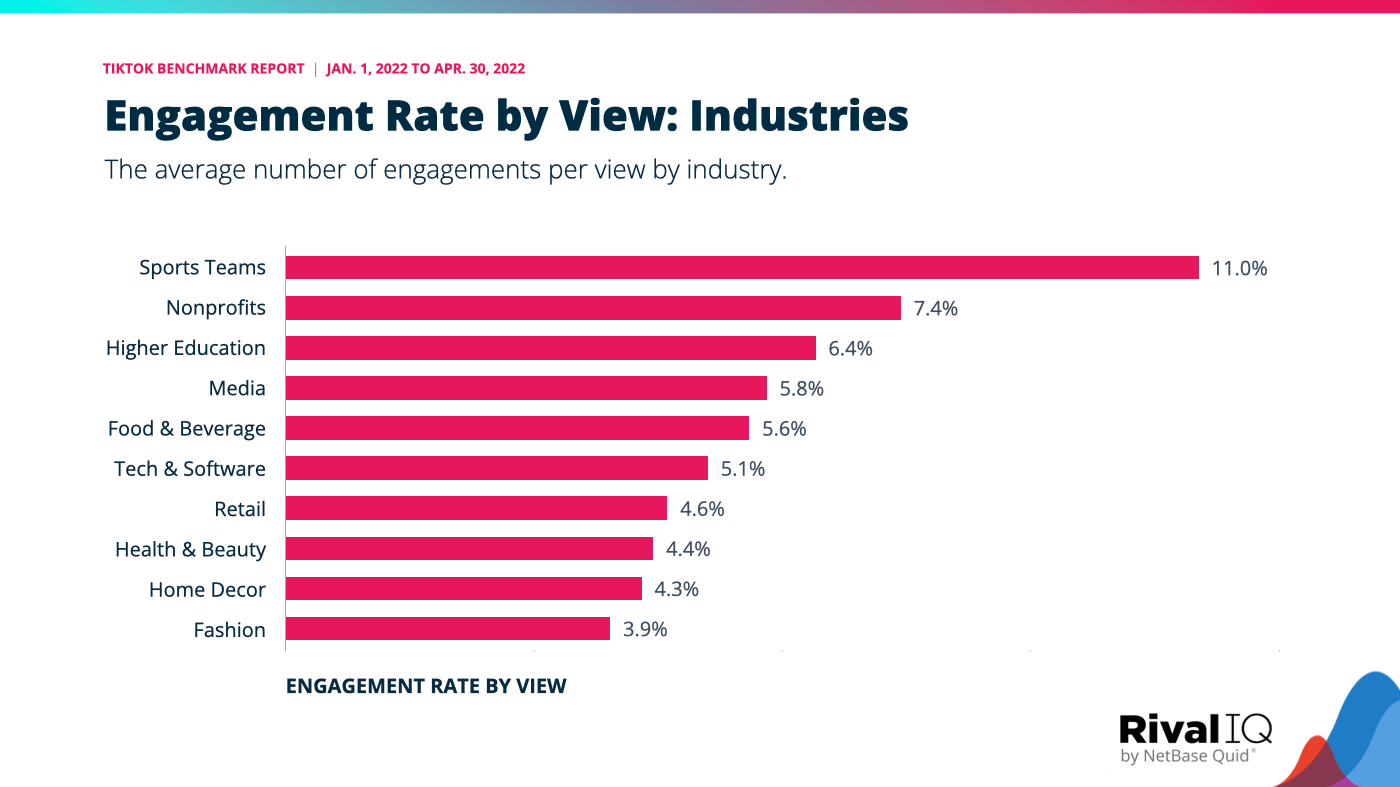
As we see in other industry-level studies we’ve done in the past, Sports Teams, Nonprofits, and Higher Ed gather relatively high engagement from fans. For each of these industries, viewers are passionate about their team, school, or causes much more than they are for their favorite brands.
Engagement Rate by View Standout Performer: Arsenal
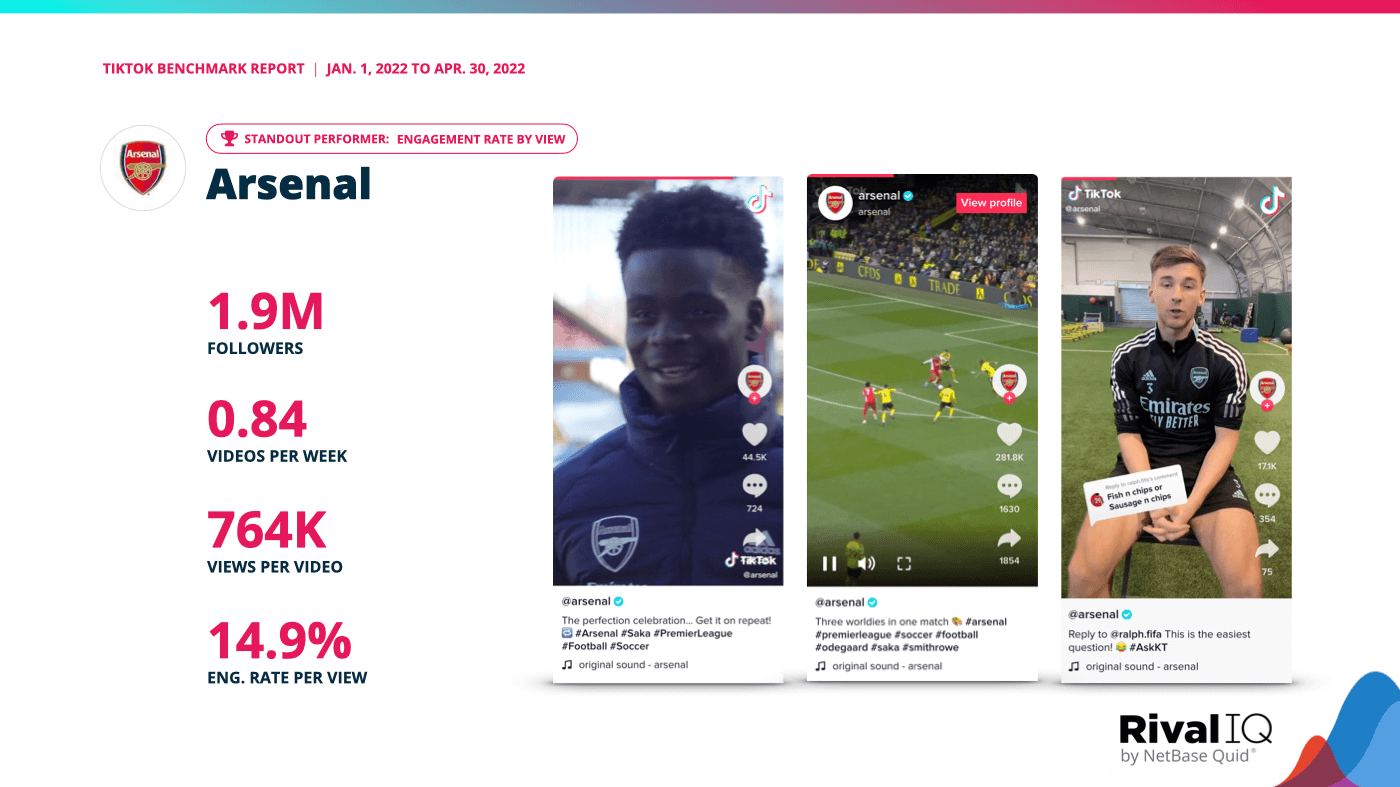
Arsenal earned an outstanding engagement rate per view of 14.9% with TikTok videos focused on two main things: Arsenal team members kicking *ss, and a Q+A series with a popular player.
Fans ate up watching videos of their favorite football club scoring goals or breaking away on the pitch, and Arsenal curated this engagement by focusing on short videos featuring or even looping the moment of triumph.
A Q+A with fan fave Kieran Tierney back in February was a successful gamble for the team that led to big engagement totals.
Views per Follower
Now that the For You Page has entered the chat, it’s not just followers seeing your content anymore as TikTok’s algorithm rushes to serve content they think it’ll like to viewers. It’s important for brands to make sense of how videos are reaching followers and non-followers alike, and benchmarking your brand’s views against your followers is a useful engagement metric for understanding how your views stack up against your follower count.
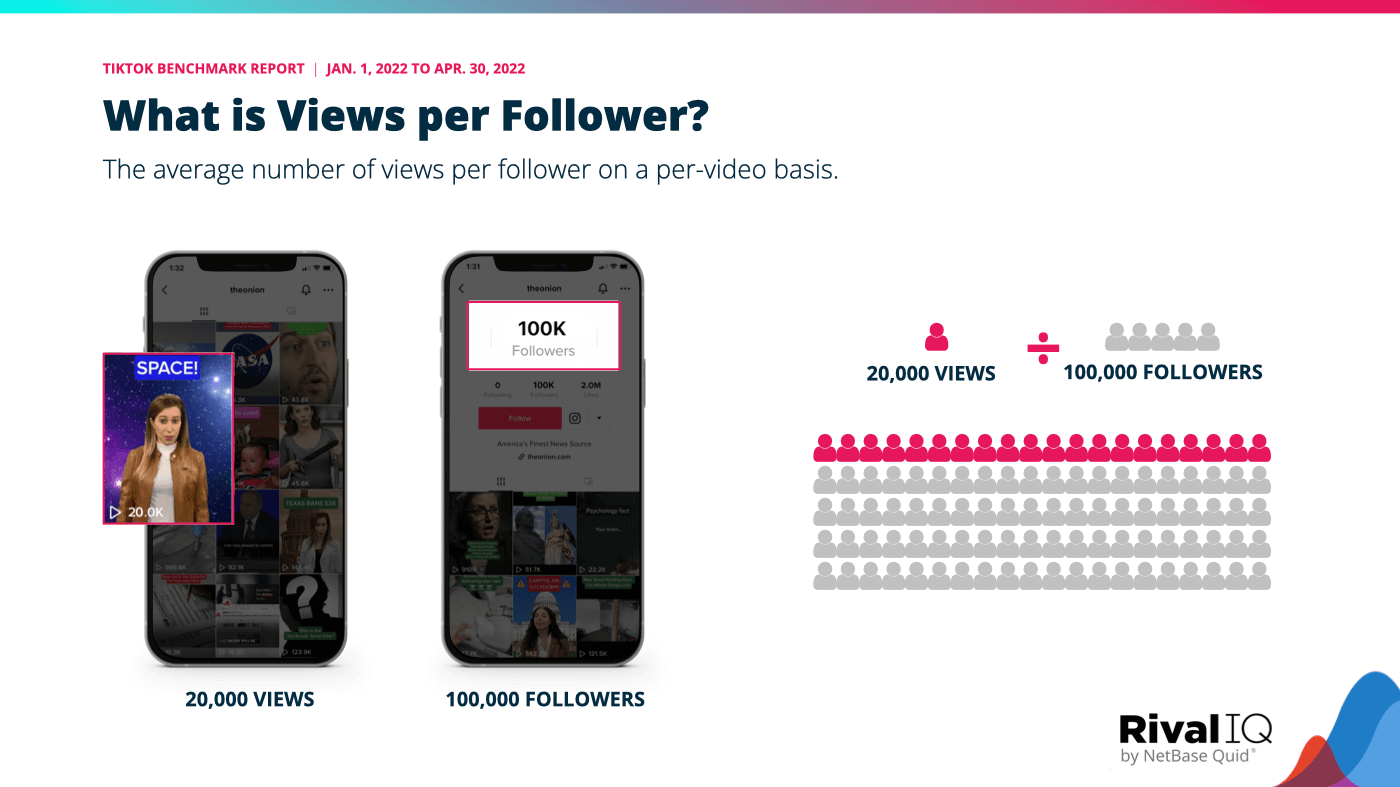
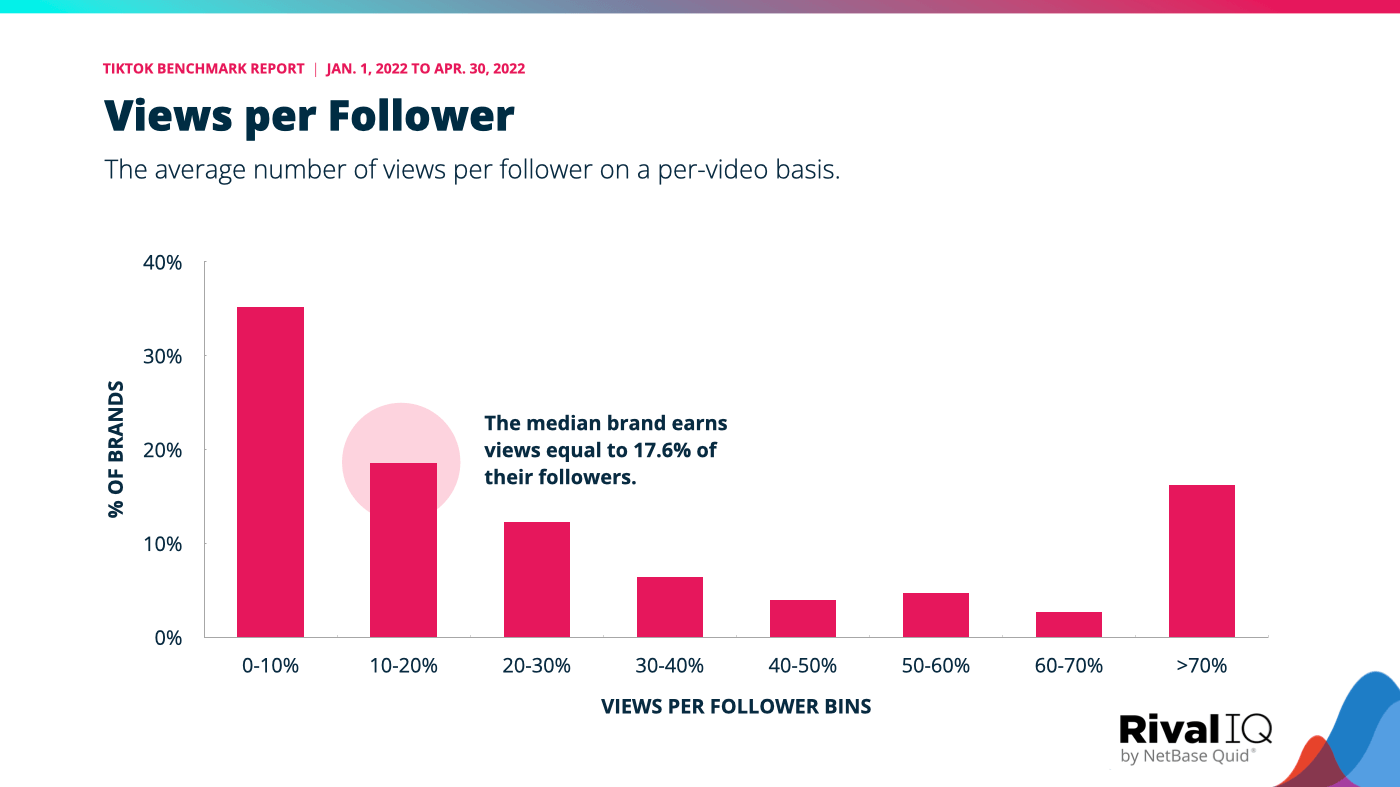
The average brand in our study earns about 17.6 views per 100 followers on each video they post.
- Though most brands don’t achieve at such a high rate, the top 25% of brands earn more than 50 views per 100 followers per video on average.
- On the low end, more than 35% of brands earn fewer than 10 views per 100 followers, on average.
On TikTok, the For You Page is a strong driver of reach for any account. Still, following accounts to stay up to date with their content is a thing. We find it useful to benchmark how many views an account will achieve, on average, as a function of followers.
Views per Follower: Account Size
In general, we find that the larger the number of followers, the lower the views per follower.
- Accounts with fewer than 5,000 followers average about 50 views per 100 followers on each video.
- That ratio decreases with accounts between 200,000 and 1 million followers averaging just 7 views per 100 followers on each video.
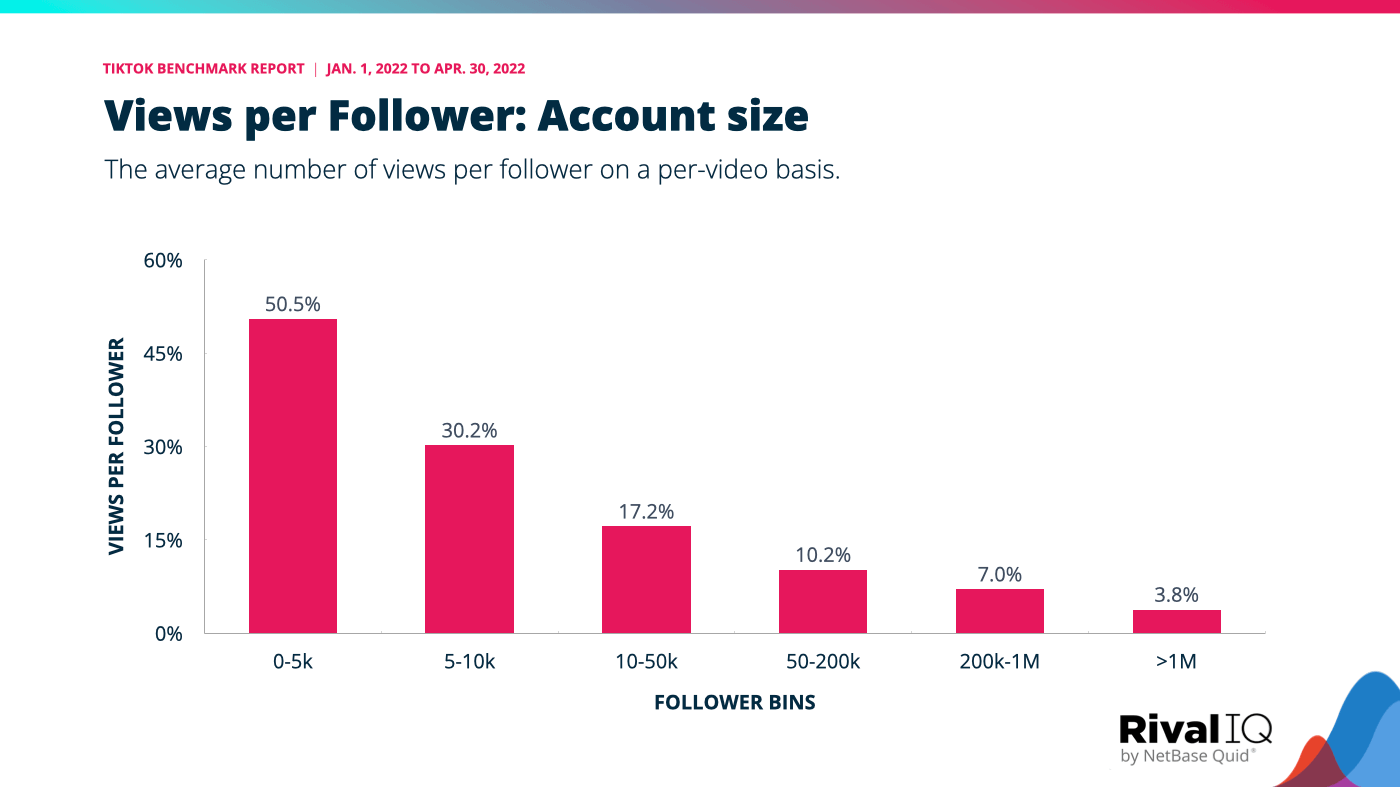
It isn’t surprising to see that views per follower decline, on average, as accounts grow in size. This dynamic is one that we also see on other platforms like Instagram. Smaller accounts tend to post less frequently, which also helps increase the views on each individual video.
Views per Follower: Industries
Higher Education, Sports Teams, and Nonprofits top the list of industries earning views per follower.
- Health & Beauty rounds out the list of brands that are above the median rate for views per follower.
- Media and Tech & Software brands lag behind the cross-industry median, earning less than 11% on average.
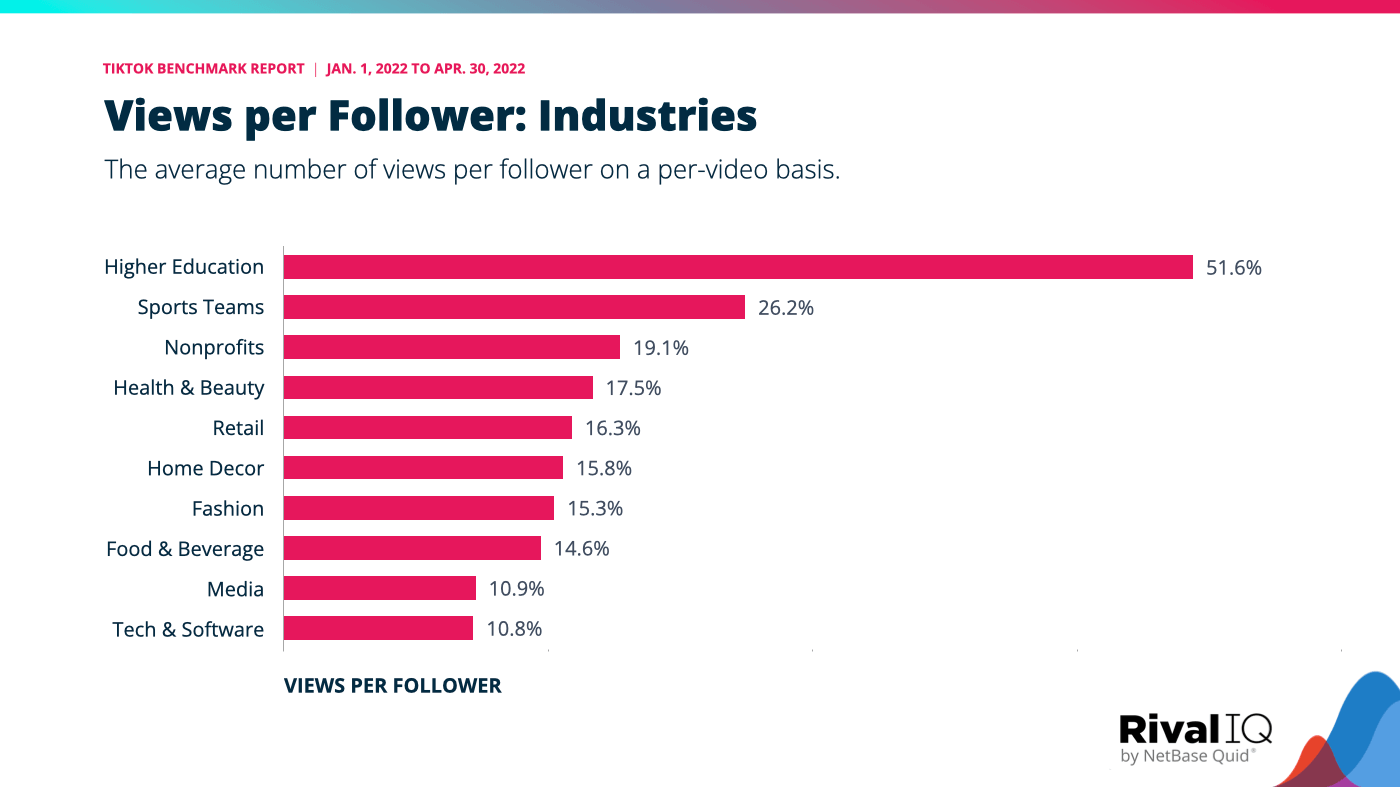
As we see across all social media channels, Higher Ed, Sports Teams, and Nonprofits tend to rise to the top for metrics having to do with reach and engagement. Each of these industries has an audience with high affinity and passion for their cause. Higher Education accounts are relatively small compared to Sports, driving their average views per follower higher in this analysis.
Views per Follower Standout Performer: James Madison University
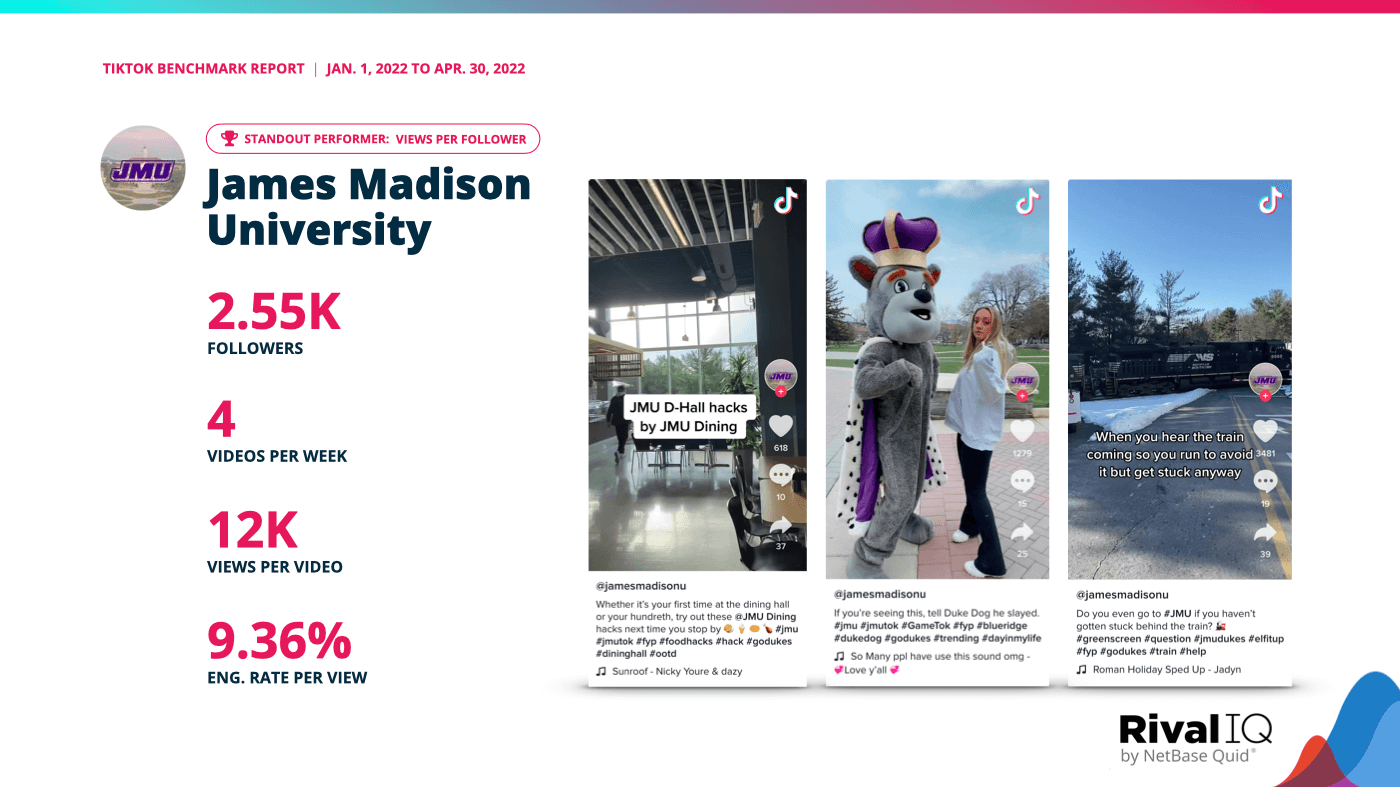
James Madison University slays on social year after year in our annual Higher Education Social Media Engagement Report, and their TikTok performance is no exception.
The university is at the front of the pack for colleges and universities with views per follower thanks primarily to a heavy dose of campus nostalgia. Alums and students alike ate up TikToks that featured JMU’s mascot and school traditions, and the university’s strong hashtag game helped videos reach any and all Dukes scrolling the FYP on TikTok.
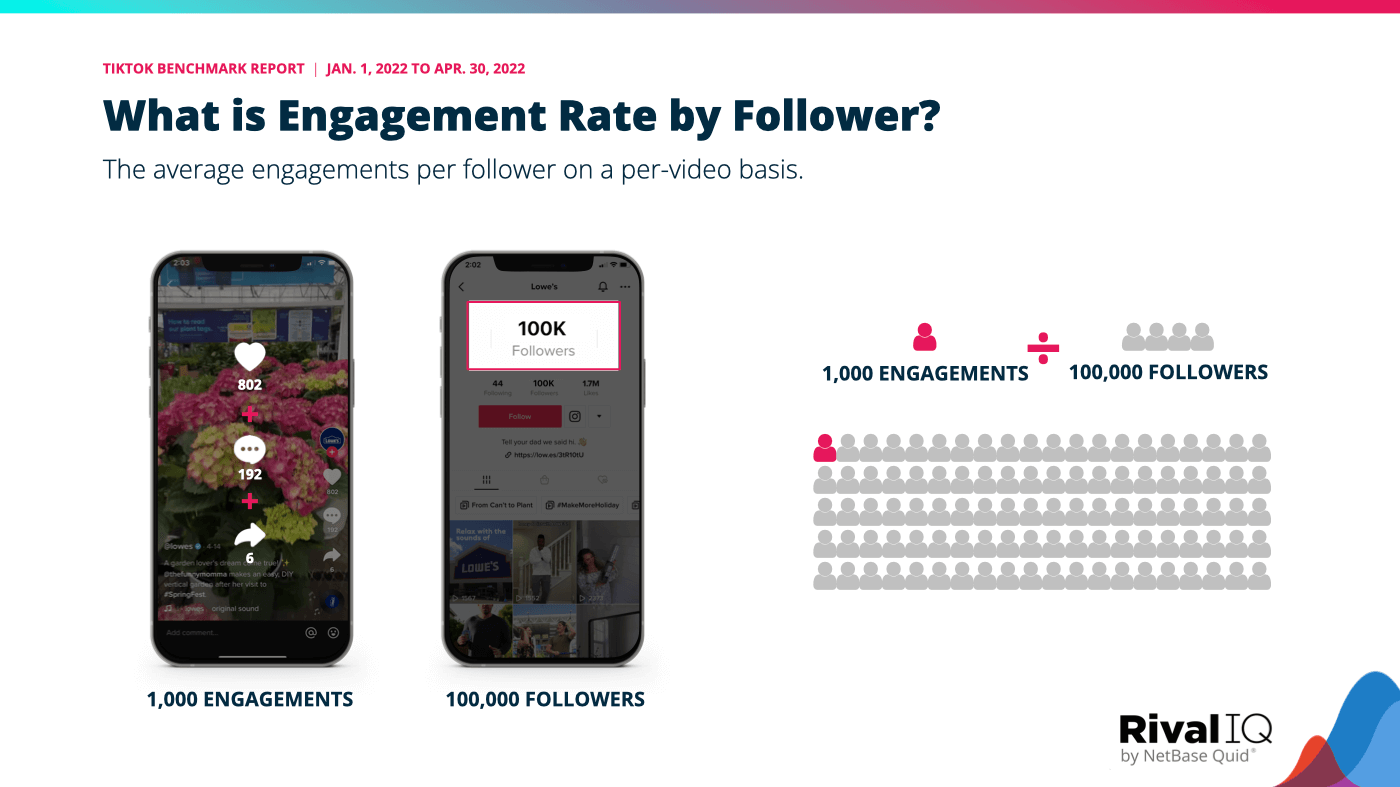
Engagement Rate by Follower
If you’ve ever read a Rival IQ benchmark report before, you won’t be surprised to see our most-used engagement metric making an appearance on TikTok too. Engagement rate by follower helps users control for audience size when measuring engagements on social. It’s crucial to go beyond engagement total because audience size is hugely important: 200 likes is great engagement for a brand with 2,000 followers but is a drop in the bucket to a brand with 200,000 followers.
Engagement Rate by Follower: Distribution
On a per-video basis, the engagement rate by follower for the median brand comes in at 4.1%.
- About 33% of brands earn an engagement rate by follower of more than 8%, more than double the median.
- On the lower side, a third of brands also average an engagement rate of less than 2%.

We share this engagement rate to help brands understand their TikTok performance relative to other social media channels. Engagement rates per follower that brands are earning right now on TikTok dramatically outpace that of other channels, with Instagram being the next closest.
Engagement Rate by Follower: Account Size
On average, brands with larger accounts see lower engagement rates by follower on average.
- Accounts with less than 50K followers see their average engagement rates come in above the median brand at 4.1%.
- The largest accounts, those with more than 1 million followers, see their per-video average engagement per follower come in just under 2%.

There are multiple factors that drive engagement rate, including average video reach and content quality. As we saw in the previous section, larger accounts tend to earn fewer views per follower, on average, and that lower reach will contribute to lower engagement rates by follower.
Engagement Rate by Follower: Industries
Higher Education and Sports Teams top the list for engagement rate by follower with performance well beyond the cross-industry average.
- Nonprofits, with an average engagement rate of 6.4%, round out the top 3 industries.
- Health & Beauty and Home Decor brands perform well below the cross-industry average.

Similar to the performance we saw for views per follower, Higher Ed, Sports, and Nonprofits out-earn other industries for the average engagement rate by follower metric. Combining above average reach with content their audiences are excited about is a surefire way to yield high per-follower engagement.
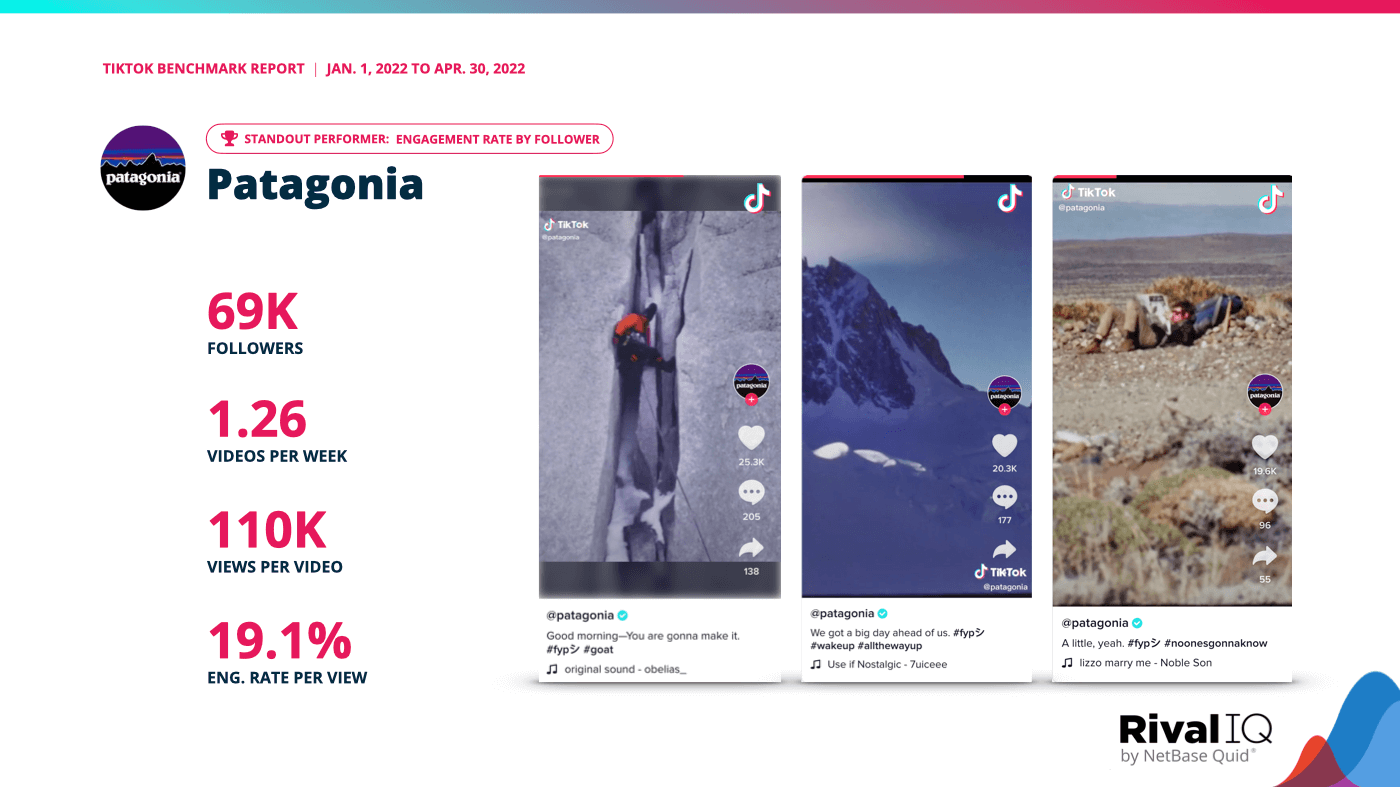
Engagement Rate by Follower Standout Performer: Patagonia
Outdoor clothing retailer Patagonia climbs high above its fashion industry competitors on TikTok with a whopping 51.7% engagement rate by follower.
The brand posts just about once a week and almost always features short videos overlaid with nostalgic filters and sounds without so much as a product shot for miles around. Fans race to the comments to compliment Patagonia’s social media team on videos that hit just right, keeping the brand at top of mind for customers without hitting them over the head with a hard sell.
Average Monthly Follower Growth
TikTok’s growth has been explosive over the last few years and shows no signs of stopping, so it’s useful for brands to measure their own growth to see if they’re increasing their audience size or not.
Across all account sizes, brands on TikTok are growing their followers at least 2-3% on a monthly basis.
- Smaller accounts, those with less than 50K followers, are averaging monthly growth of more than 5%.
- The larger accounts in this study are growing at a rate of 2.5% or more per month.
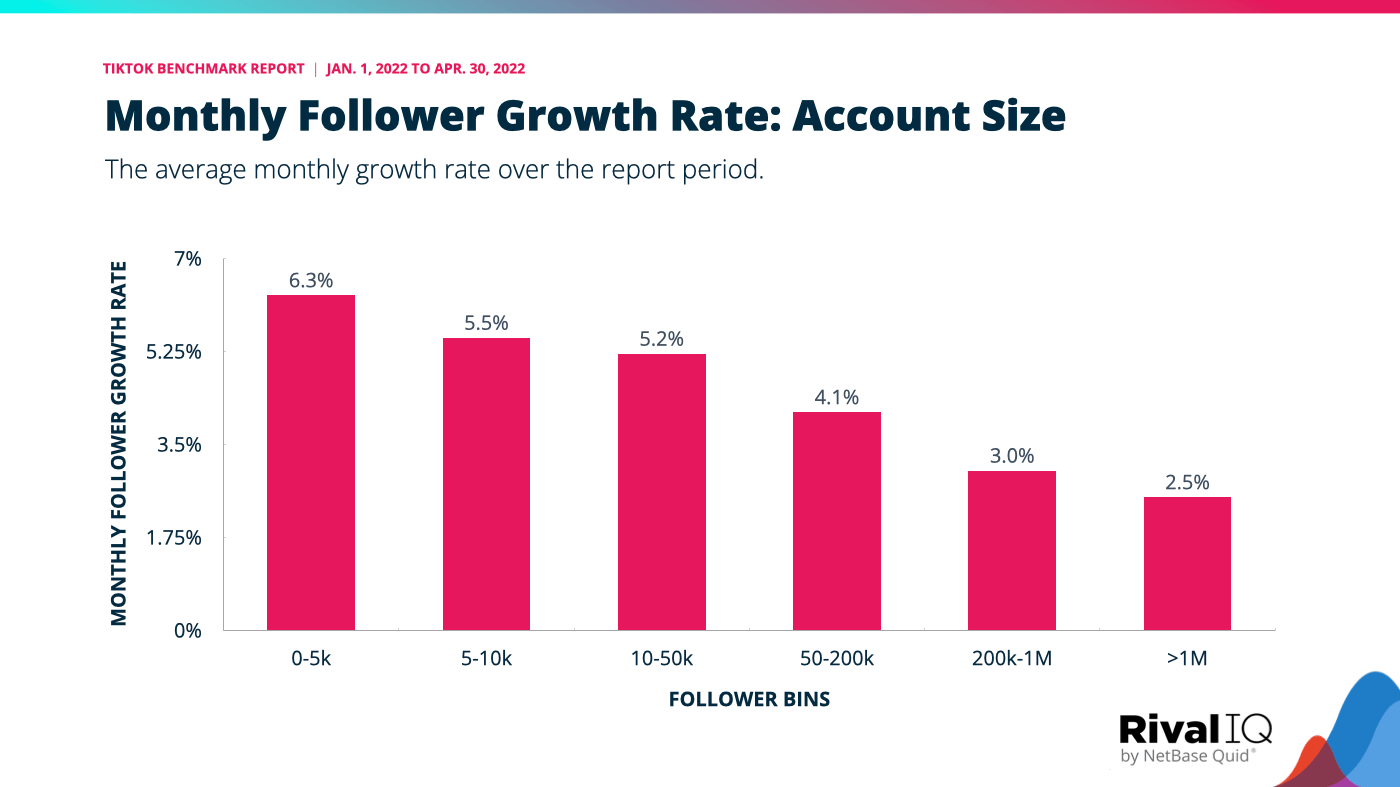
TikTok is very much an expanding platform, and we see brands of all sizes finding success in growing their accounts. This shouldn’t be surprising given that TikTok has been the most downloaded app for the last several years.
Hashtags per Video
Brands are using hashtags to entice viewers and to give TikTok a clue as to what their content is about to increase the chance of landing on the coveted #FYP.
Brands include about four hashtags per video on average.
- Brands lean towards fewer hashtags, with just 34% of brands including 5 or more hashtags in their videos.
- 15% of brands include one or fewer hashtags in their videos.
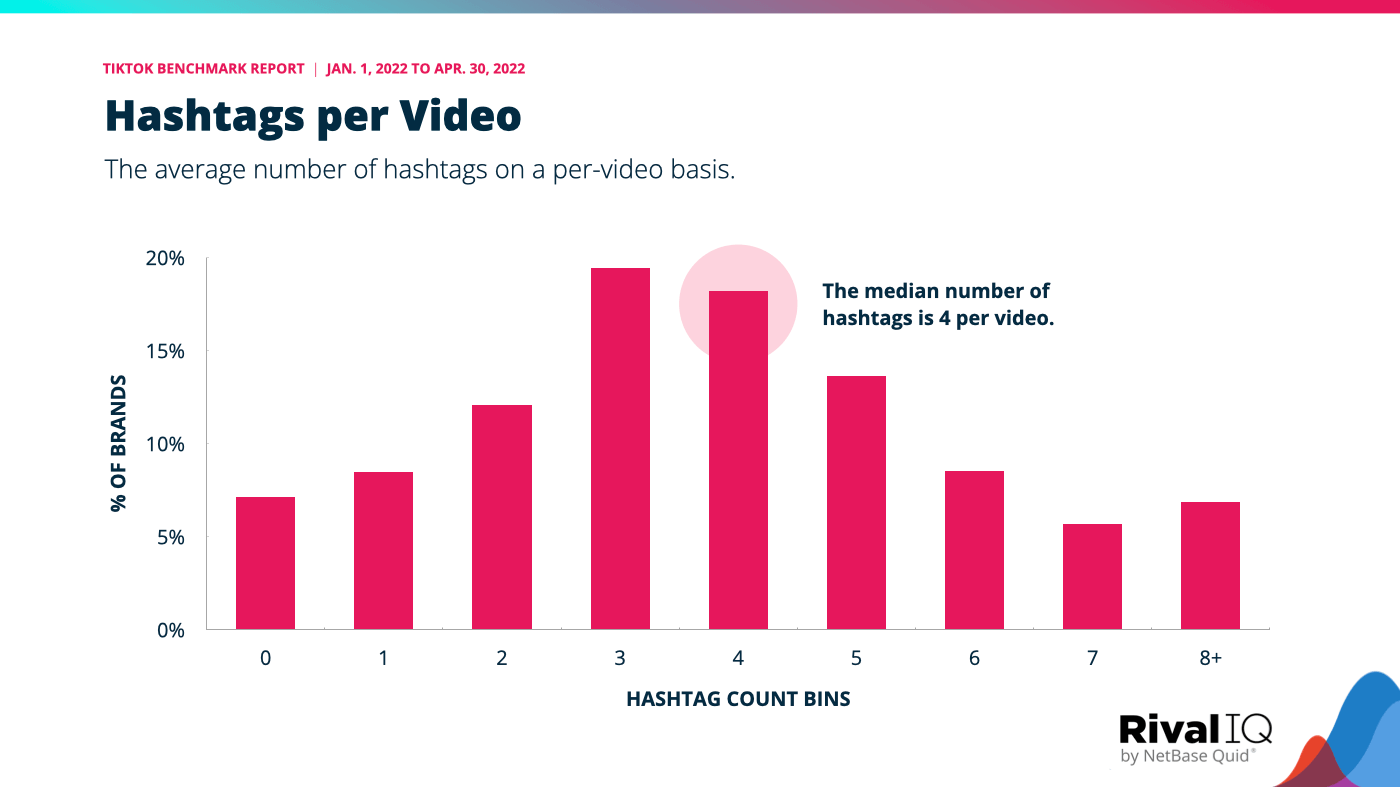
Hashtags are a powerful way to land content in the all-important #FYP. Be sure to note your brand’s individual hashtag engagement to pick the right number of hashtags for your videos.
Videos with Mentions
While TikTok isn’t necessarily as effective as, say, Twitter at starting and maintaining conversations between followers and brands, there’s still an awful lot of mentioning going on. From replies to trying to catch the attention of a favorite TikToker, mentioning another handle in a video is a powerful way to amplify reach.
The average brand doesn’t mention other accounts very often, only in about 14.5% of their videos.
- About 14% of brands include a mention in more than half of their videos. Wow!
- Almost 20% of brands never mention another account.
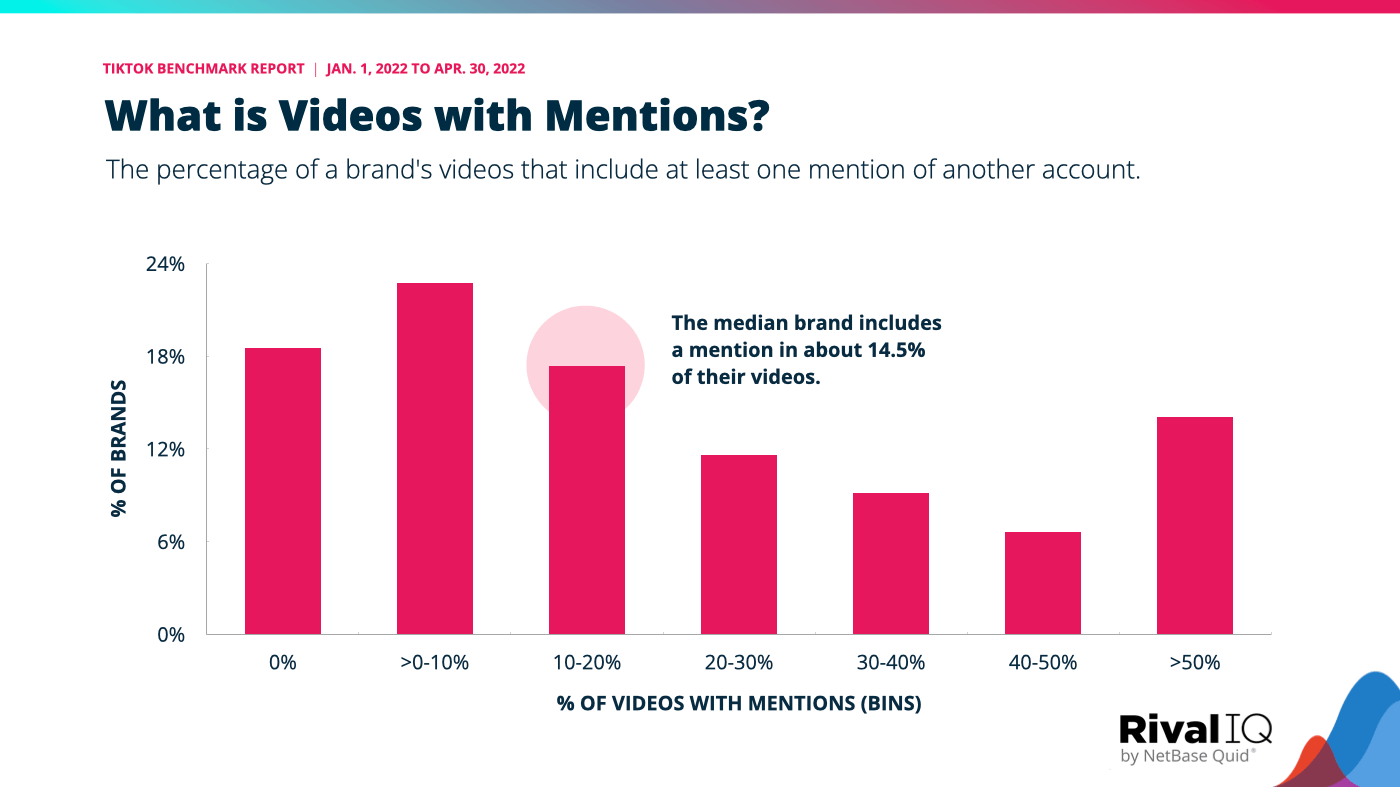
Mentions help non-followers find new videos that are related to brands and accounts they already love. These numbers suggest that brands are favoring original content over replies or mentions.
Brands that include mentions consistently in their videos tend to see higher per view engagement rates.
- Brands that use mentions in 10%-20% of their videos have the highest per-view engagement rates.
- Brands that never mention other accounts have the lowest per-view engagement rates, only 4.5%.
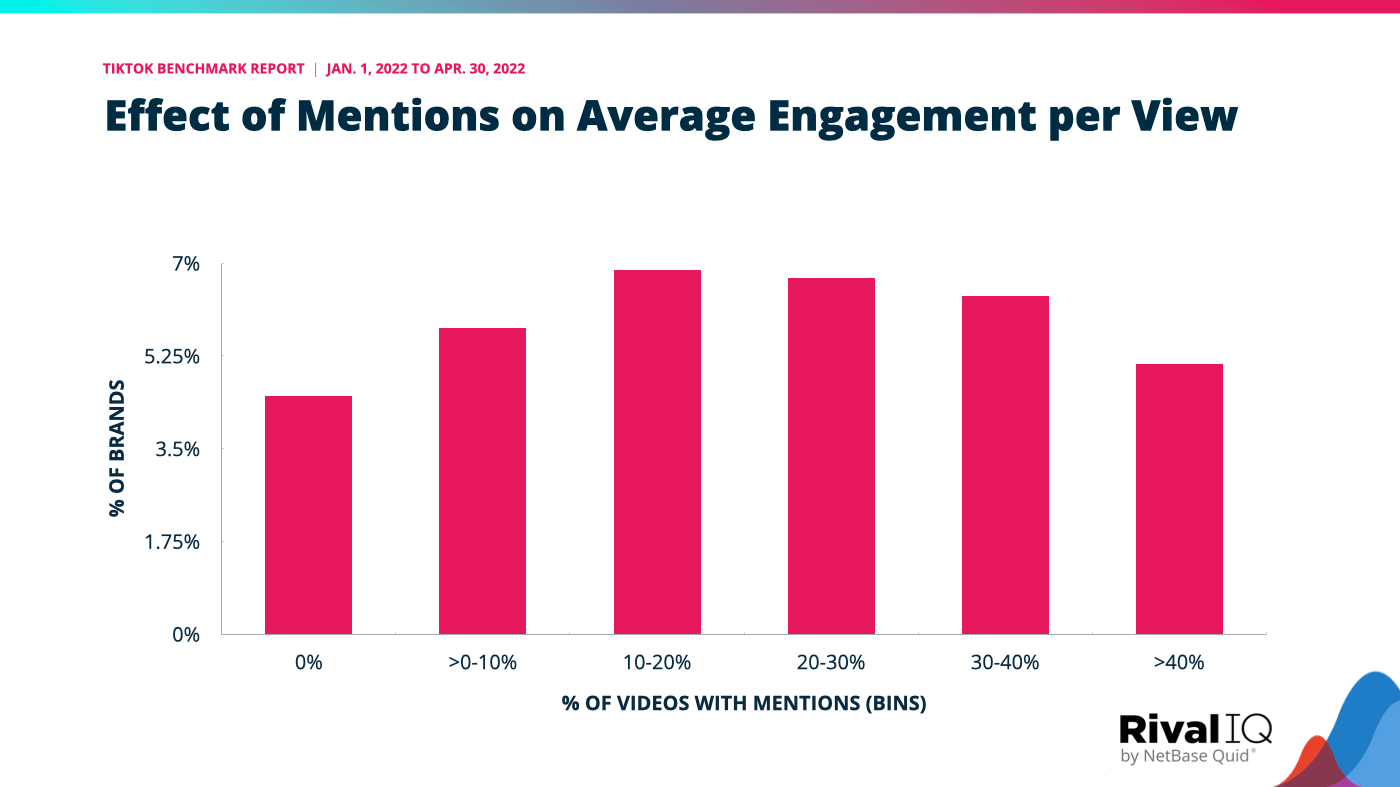
Don’t be afraid to start conversations with mentions on TikTok. These numbers show that aiming to include a mention every fifth video (or more frequently) will boost engagement while helping grow follower counts as more fans discover your brand.
Videos with Mentions Standout Performer: Sol de Janeiro
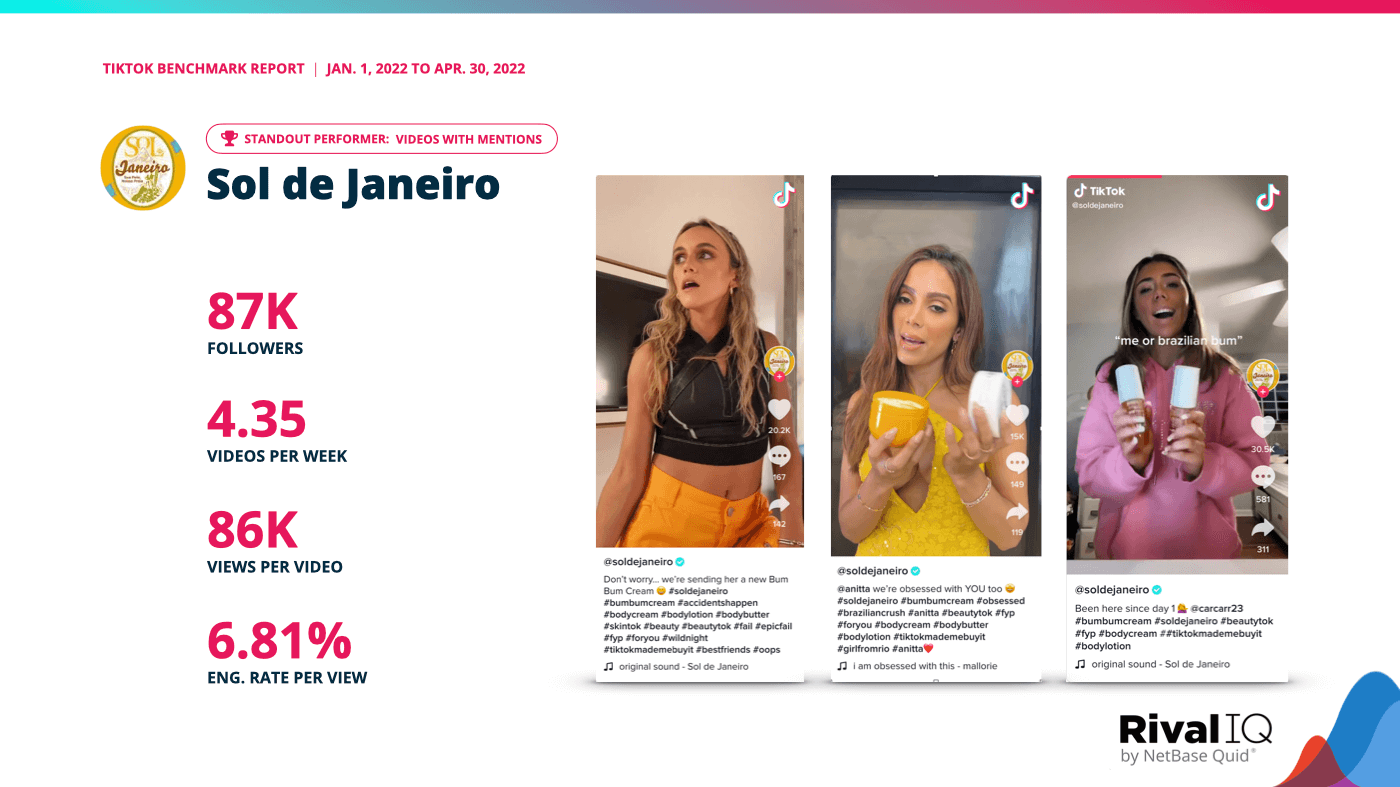
Health & Beauty brand Sol de Janeiro saw a ton of engagement thanks to videos with mentions. Their secret? UGC. The brand clearly keeps an eagle eye out for fans posting love letters to their beloved products and reposts them for a major engagement boost. Listening for UGC is a smart strategy for any brand on TikTok, and works especially well for product-focused brands like beauty or CPG.
Like many Health & Beauty brands, influencer collabs also led to soaring engagement rates, especially when Sol de Janeiro mentioned the influencer in the video description, which they did in about a third of their videos.
TikTok Terms Glossary
We know there are many different ways to measure engagement, so here’s a quick round-up of all the TikTok engagement metrics we studied in this report and their definitions.
Engagement Rate by Follower: The average number of engagements per follower on a per-video basis.
Engagement Rate per View: The average number of engagements per view.
Engagement Total: The total number of interactions (likes, comments, and shares) on videos.
Hashtags per Video: The average number of hashtags on a per-video basis.
Monthly Follower Growth Rate: The average monthly growth rate over the report period.
Videos with Mentions: The percentage of a brand’s videos that include at least one mention of another account.
Videos per Week: The average number of videos a brand publishes per week.
Views per Follower: The average number of views per follower on a per-video basis.
Wrapping It Up
We hope this report helps you benchmark your TikTok performance while providing oodles of #inspo for your brand’s next contribution to the FYP. We’re impressed by brands pivoting with such commitment to portrait-style videos, and can’t wait to see what comes next for this dynamic social channel.
Ready for even more social media analysis? Catch the reply of our dynamic convo with top beauty brand The INKEY List to talk all things building community, TikTok, and more.