Investing in Instagram Stories is a time commitment for your brand, but are your efforts paying off?
Benchmarking your Stories success against real data makes all the difference in setting attainable goals for your social media marketing plans. Use this comprehensive look at Instagram Story performance from 2019 to benchmark your success and craft your strategy for 2020.
To get you all the info, we combed data from over 29k Stories and 145k+ individual frames. With it, we’re able to answer your top questions about Instagram Stories like how often to post Stories, which media types to use, what engagement rates to expect from your Stories, and of course, how your brand measures up to the competition.
Key takeaways
Retention Rates are up
Retention rates on Stories are up for 2020. Story viewers are tapping backward, sticking around longer, or watching every frame. Engagement elements Instagram has added in the past year, like stickers, are likely helping.
Reach Rate is down
Your Stories aren’t reaching as large of a percentage of your followers as in the previous year. There’s been a consistent rise in marketers using Instagram and with the increased competition Stories are more saturated and less likely to be seen.
The most active brands post every other day
Instagram’s most active brands post Stories at least every other day, almost 33% more than the average brand. That’s some serious dedication to consistent Stories content.
Your Instagram feed still gets more reach than Stories
Despite the rise in brands using Stories and viewers watching them, Instagram posts still see a much higher reach rate. So hook viewers with posts and keep them engaged with Stories. Skip ahead to the posts versus Stories matchup.
Days with a Story
As savvy marketers, we’re looking to spend our time efficiently for the largest return including how often to invest on each social platform. If you’re not consistent, or if you’re over-posting, your metrics can reflect poor performance. Days with a Story is the number of days per month brands published to their Story. This is one metric that’ll help you benchmark your strategy against other brands on Instagram.
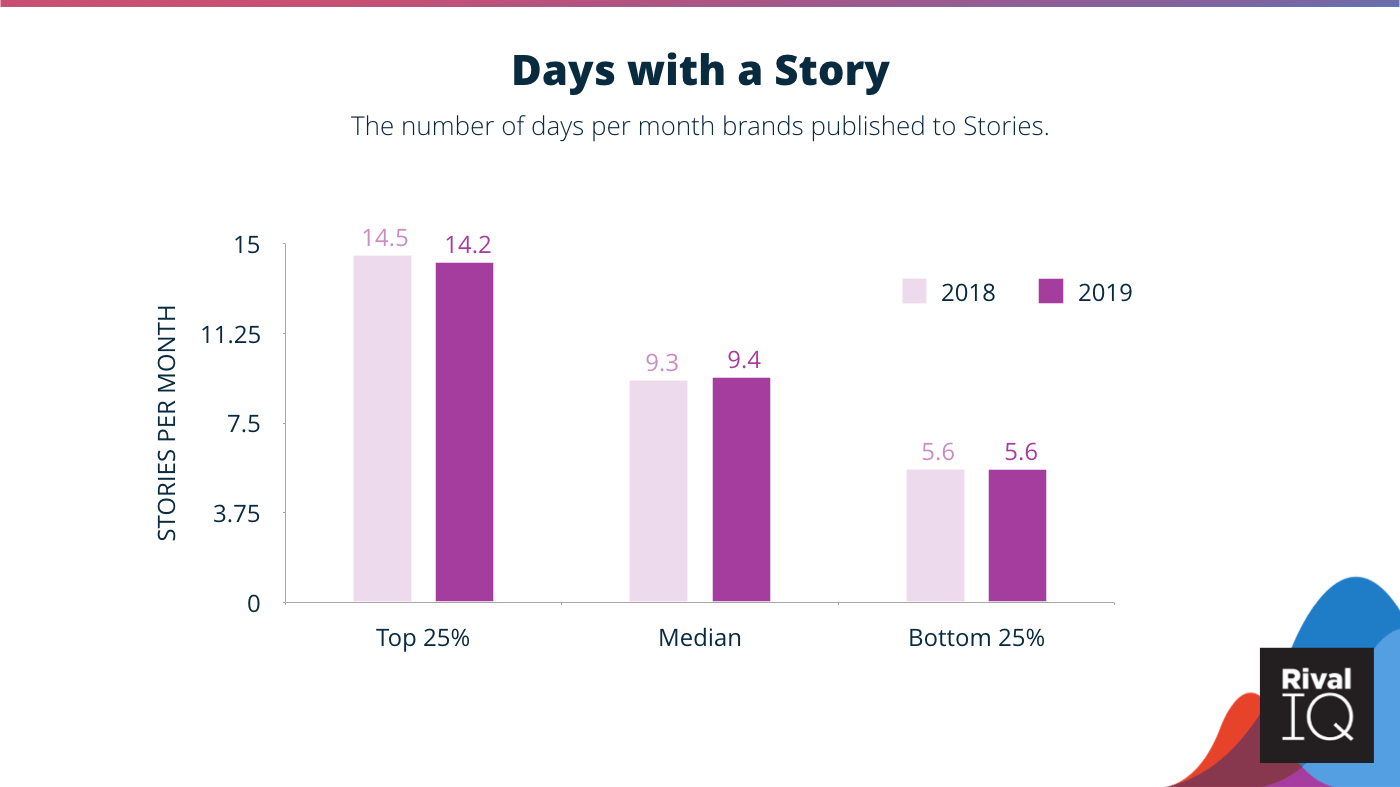
The average brand is posting Instagram Stories nine times per month, or about twice per week. Brands that are most active are publishing Stories at least 14 times a month—roughly every other day. Even the least active 25% of brands in our study are publishing consistently, on average just over one Story per week.
This year, more brands are marketing with Instagram which means there’s more competition in the fight for eyes on your content. Though more brands are active on the platform, our data shows that brands publishing Stories are posting about the same number of days per month as last year.
Setting your brand’s schedule depends on your goals for Stories marketing. The majority of brands that we researched are posting over twice a week. If you’re aiming for consistent viewership, test out a routine that has at least two Stories per week.
Frames per day
Stories are made up of individual frames, like photos, videos, or graphics. For this study, frames per day represent the number of frames published in a 24-hour period.
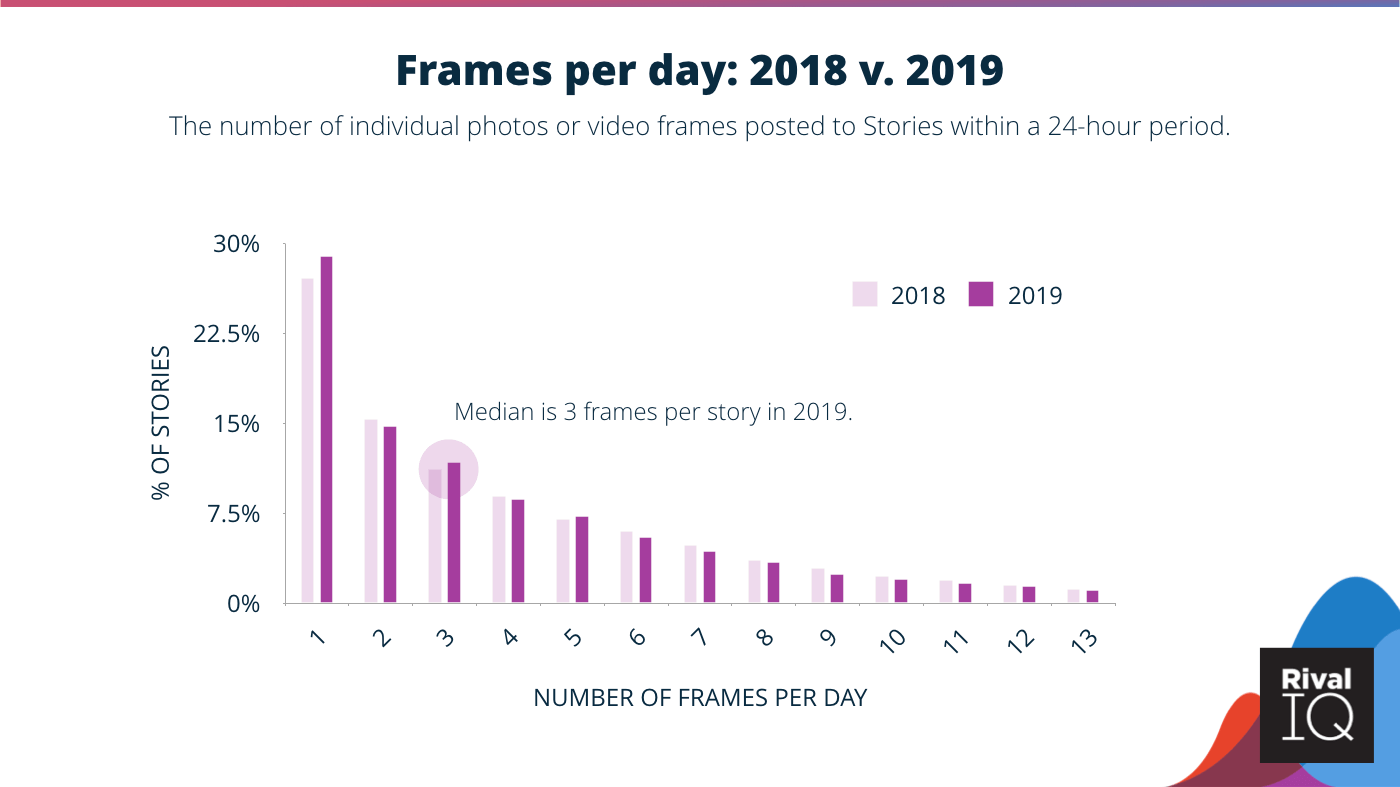
This year, we saw that 28% of all Story activity is made up of days with just one frame. The median number of frames published in a day is 3, and just 24% of Stories had 7 or more frames in their Story on average.
The number of frames per day hasn’t changed much compared to last year’s data. Smaller Stories with minimal frames have increased slightly from 2019 which means more brands are testing the Stories waters. More brands may be using Stories in their marketing but they’re not posting higher frame counts compared to last year.
Retention Rate
Retention rate is the percentage of Story viewers on any given day that see all Story frames.
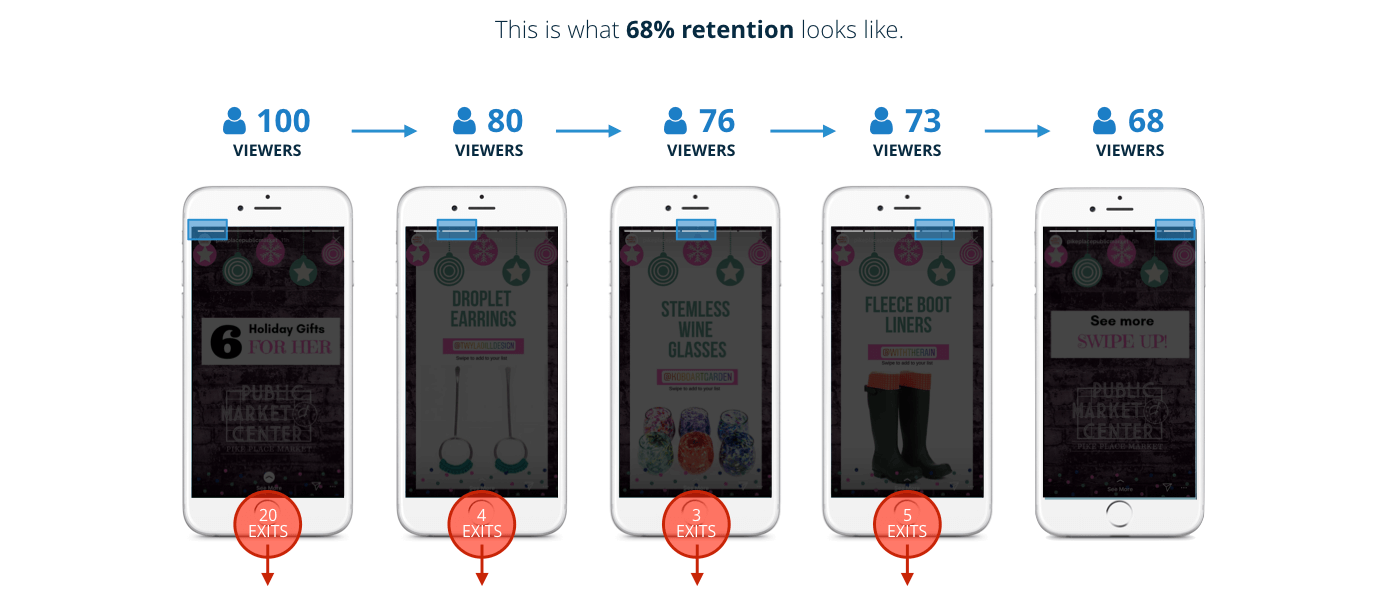
A strong retention rate is an indication of success across all your Stories analytics. Plus, if you’re creating content that keeps your viewers engaged and interested throughout your entire Story, your reach rates could increase as well.
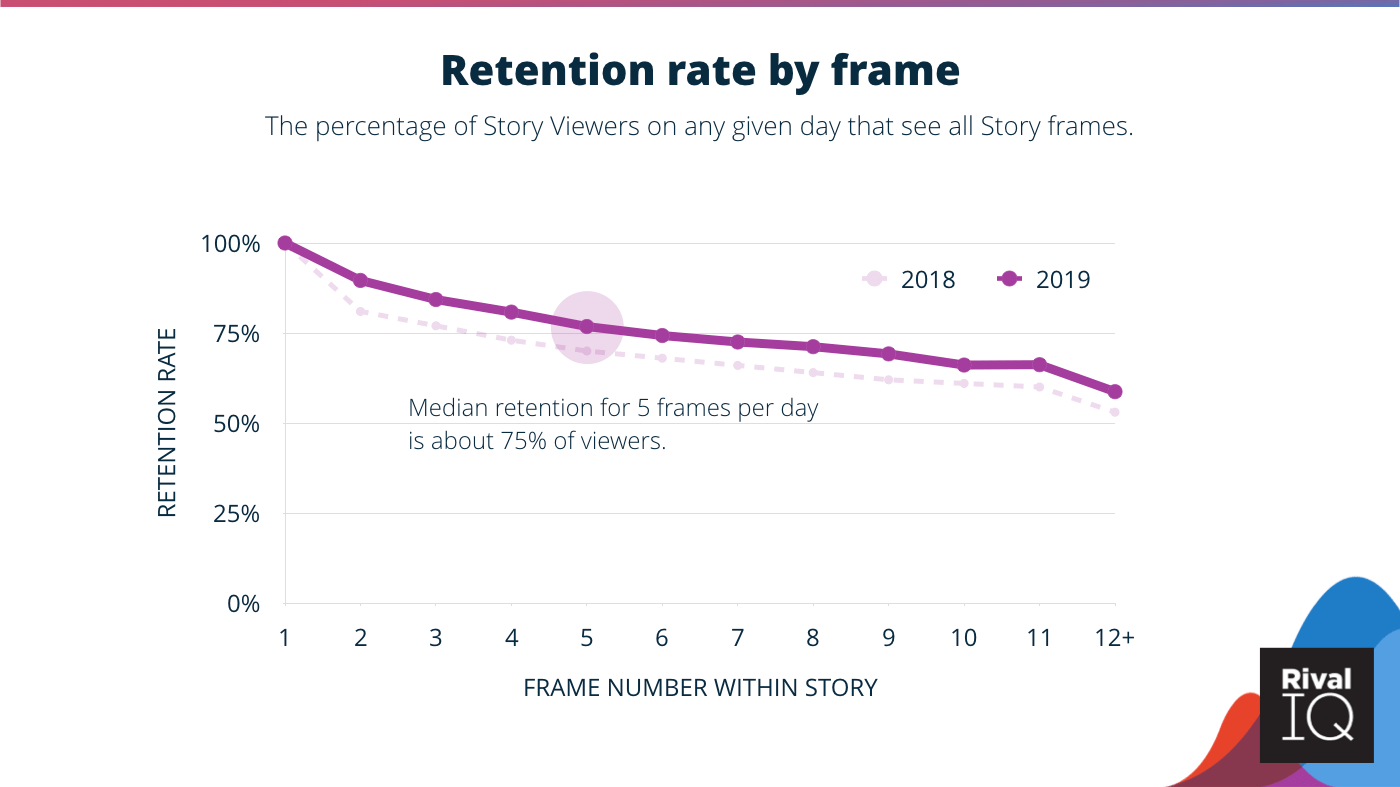
The data show that the more frames published in a day, the lower the retention rate for that Story. There are no surprises there, as you can only lose viewers with each additional frame.
The biggest dip is from 1 to 2 frames a day as users swipe past the Story altogether. After that big initial drop-off, the retention decline slows down and stays above 75% through 5 stories per day.
Compared to last year, average retention rates have increased by almost 5% across the board. The decreased drop-off from frame one to two is the most notable change this year. After that point, the data follows the pattern from last year, with each subsequent frame added to a Story yielding slightly lower retention.
Once people stick with you to the second frame, you’ll likely keep them for a few more. Knowing this, don’t miss out on the extra time of a second or third frame. Finding your own brand’s average number of frames per day can help get your strategy into a data-backed groove.
The overall retention rate is likely higher for 2020 thanks in part to Instagram’s continued rollout of interactive stickers (e.g., polls, quizzes, sliders, etc). Since we don’t have access to the data for stickers in Instagram’s API, it’s hard to say for sure, but adding them to increase retention and interaction is definitely a strategy to test out.
Stories may not get your entire following tuning in, but the retention rate increase this year shows they’re sticking around longer. Make sure the first frame hooks viewers, and from there, you’ve got the time and space to get creative.
Stories Reach Rate
Reach rate is the percentage of followers that see your Stories and gives an indication of how often Instagram surfaces your Stories.
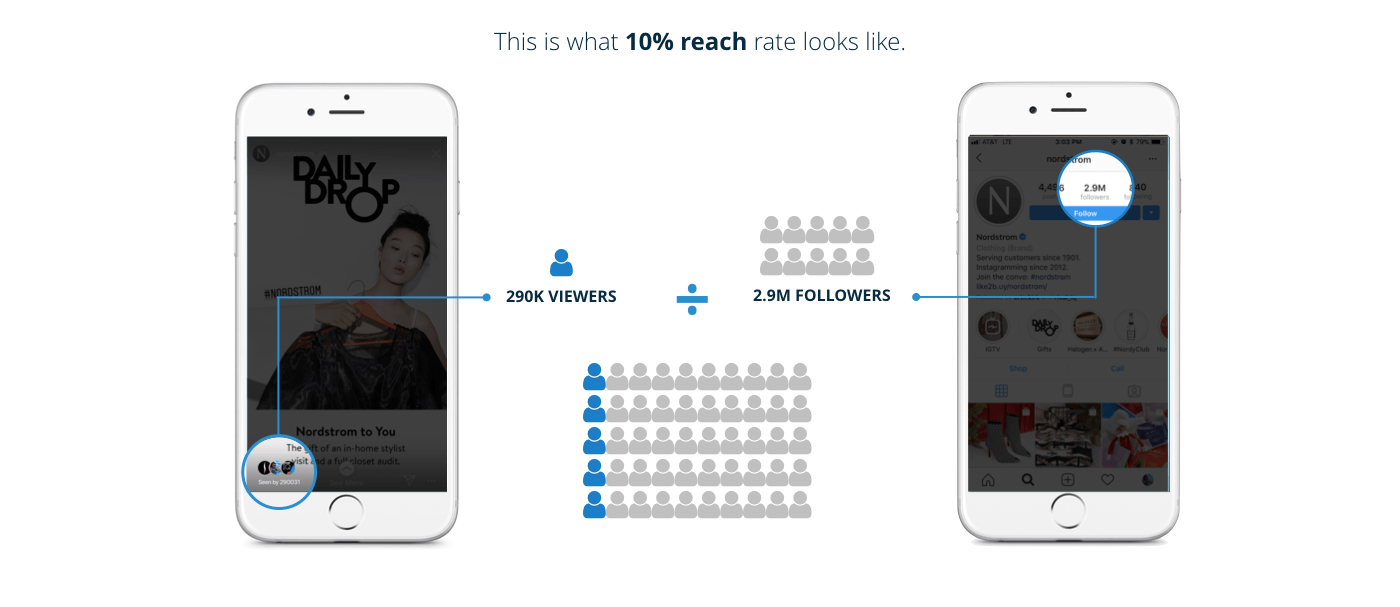
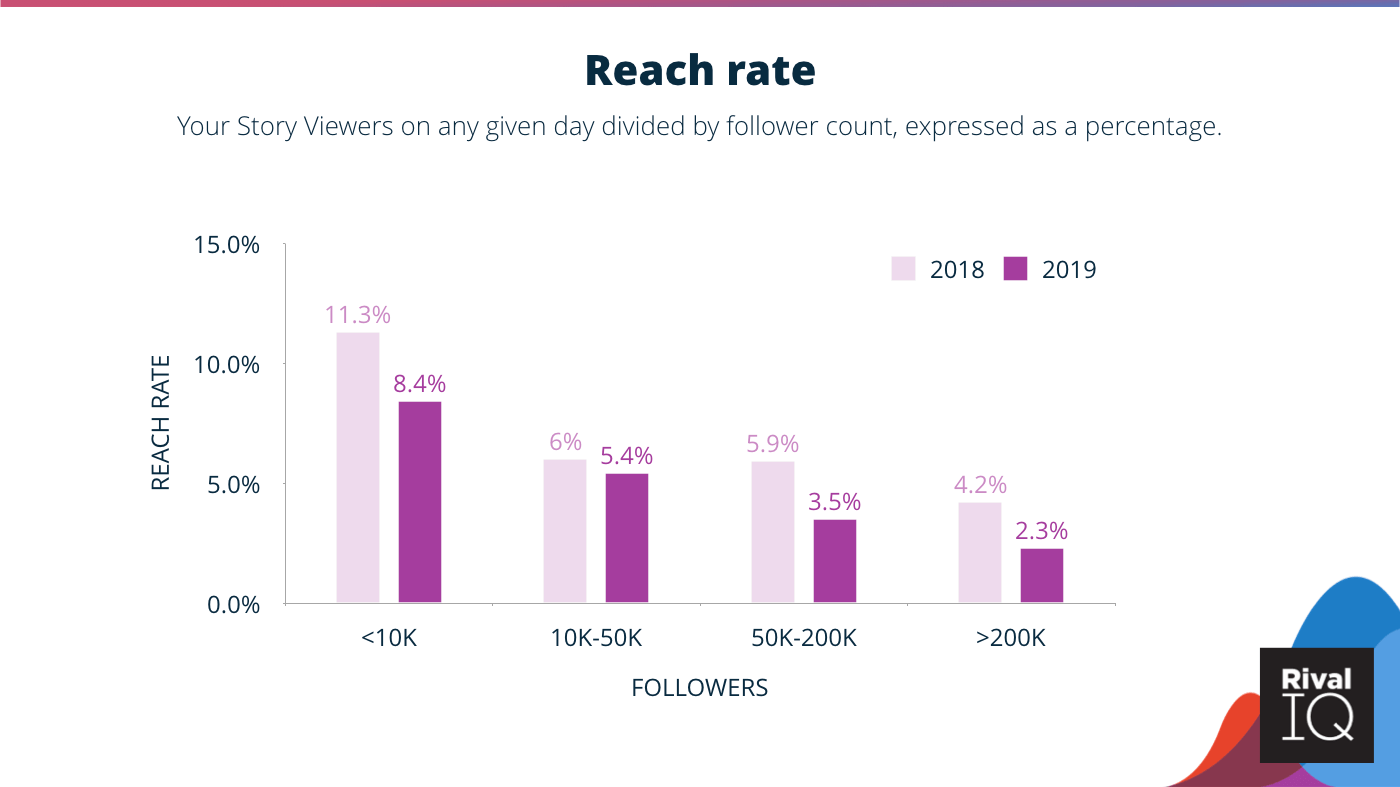
In general, the larger your follower count, the smaller the percentage of them you’ll reach with Instagram Stories. The median reach rate for this set of companies is 4.4%, meaning only about 4% of your followers are seeing your Stories.
Since the previous year, the reach rate for Stories has decreased in every size bracket of followers. Brands with over 200k followers saw the largest drop in reach rate of about 45%.
Reach rate is heavily determined by the Instagram algorithm’s feed and Story order but is impacted by things like your audience activity, time of day, engagement and more. With 106.7 active million Instagram users in the US alone and 73.2% of US marketers using Instagram, there’s only so much time in a day to get eyes on your message. Viewer engagement signals to the algorithm people want to see your content, so encourage interaction to increase your reach rate.
Post Reach Rate
To give you context for Stories reach rate this year, we’ve computed the reach rate for posts from the same brands. As with Stories, we answer the question: how many people saw my post compared to the size of my audience?
Post reach rate is the percentage of followers who saw a post, on average.
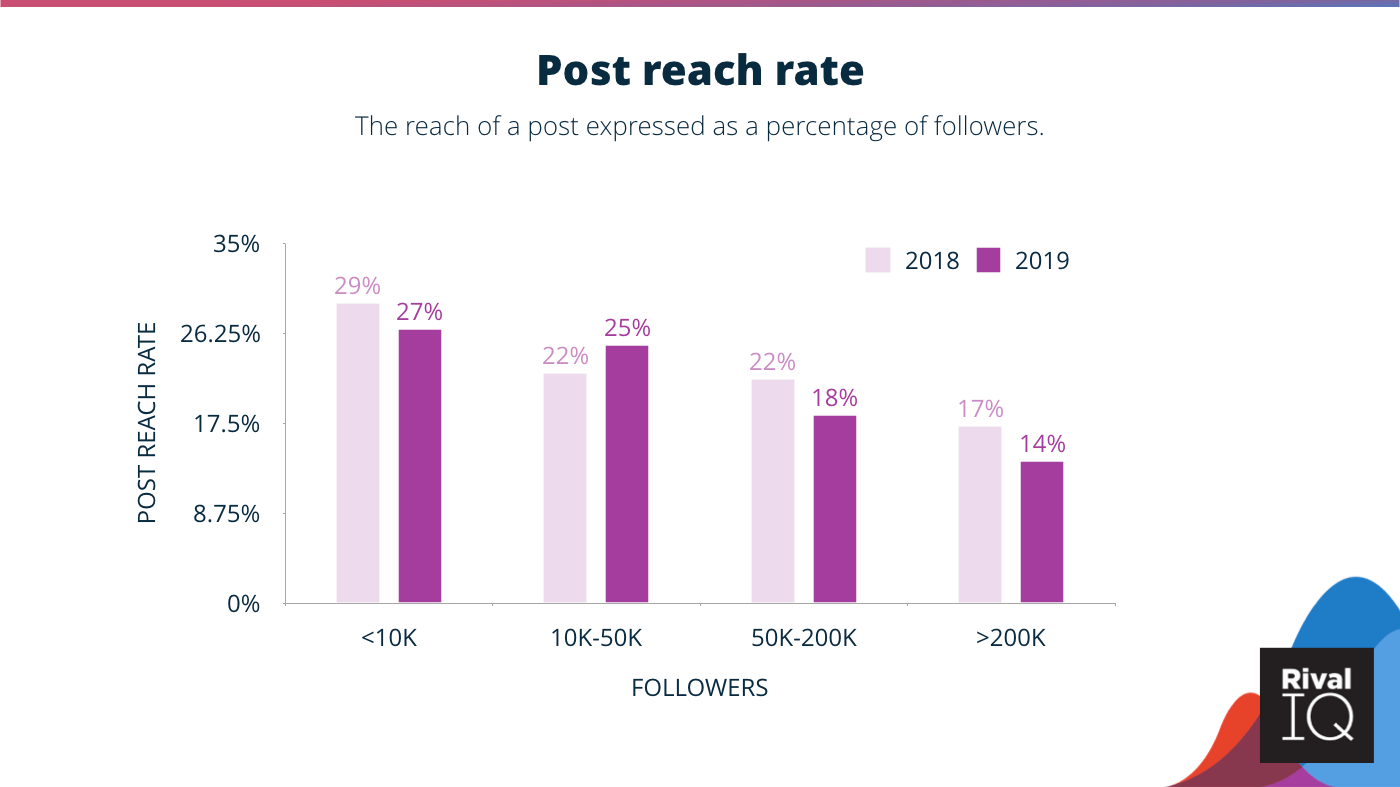
In general, handles with the largest followings see lower reach rates. For handles with 200K or more followers, only about 14% of followers see their posts. Across both posts and Stories, handles with high follower counts had the largest hits in reach rate.
On average, brands saw a decrease of 5.7% in post reach rates for 2020. The outliers are handles with 10-50k followers, which saw a small increase in reach rate.
These stats make a lot of sense looking toward 2020, not only due to the rise of Instagram users worldwide but also the growing amount of content, advertising, and features (e.g., Stories, IGTV) that Instagram has going on.
Instagram Posts versus Stories Reach Rate
Of course, these post numbers look a lot better than the average Stories reach rates, and that’s clear when we stack up the data.
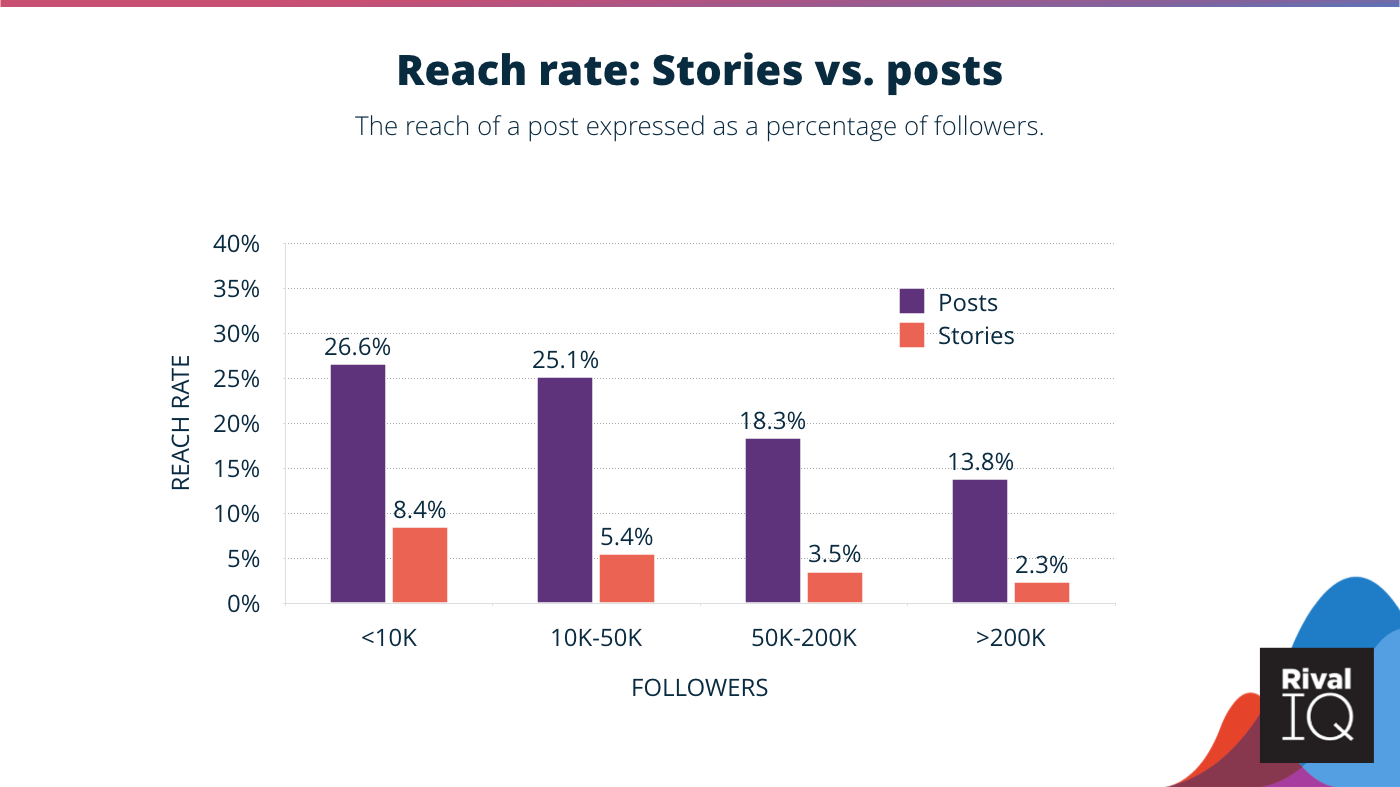
Comparing posts versus Stories, broken down by follower count, we see that a smaller percentage of your following is seeing your Stories. This discrepancy in reach rate increases when your following gets larger.
Across the board, your posts are continuing to earn more reach than Stories. Keep in mind that a post view doesn’t have the same value opportunity as an avid Story watcher. The ability to add a “swipe up” CTA in your Stories, something posts doesn’t have, gives Stories an added bonus to activate engaged viewers.
The higher retention rates compared to last year show that brand followers who are watching Stories are sticking around longer and changing Instagram content consumption behaviors. While posts are still reaching a broader cross-section of your followers, metrics like retention rate show your followers are watching Stories.
Tap-Forward Rate
Speaking of retention, a great metric to pay attention to when it comes to Stories success is the tap-forward rate of your content.
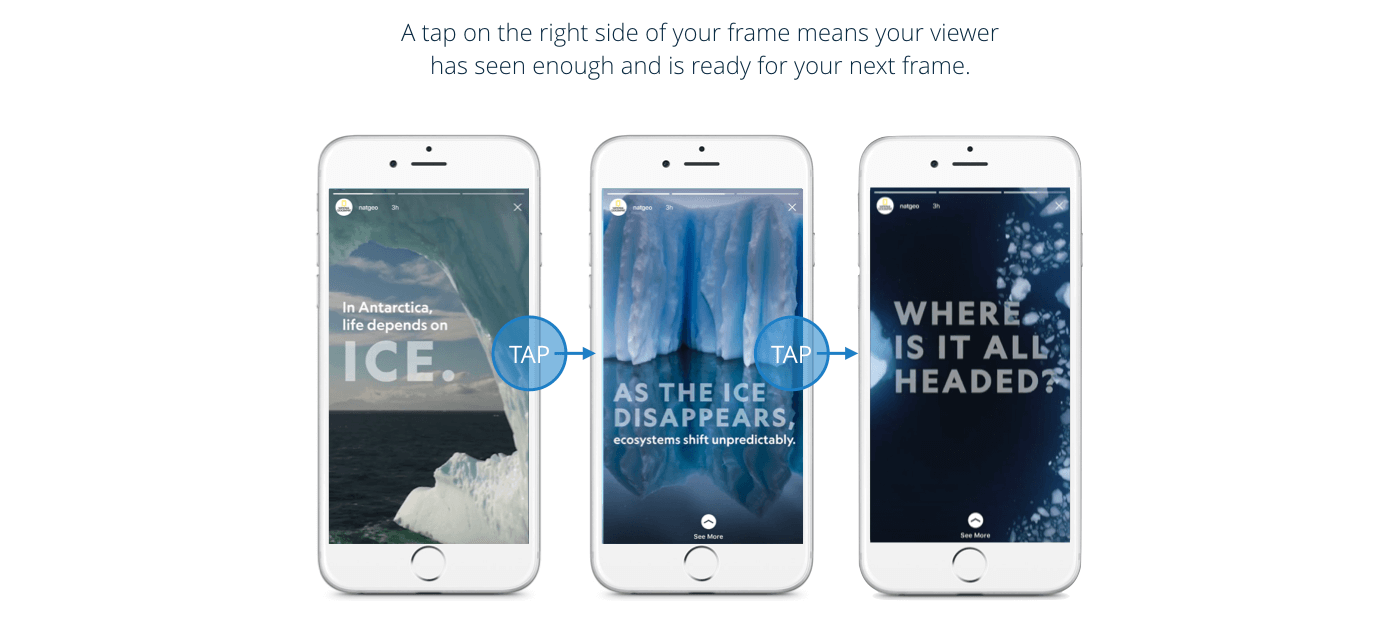
Tap-forward rate is the percentage of your Story impressions that have a tap forward to the next frame.
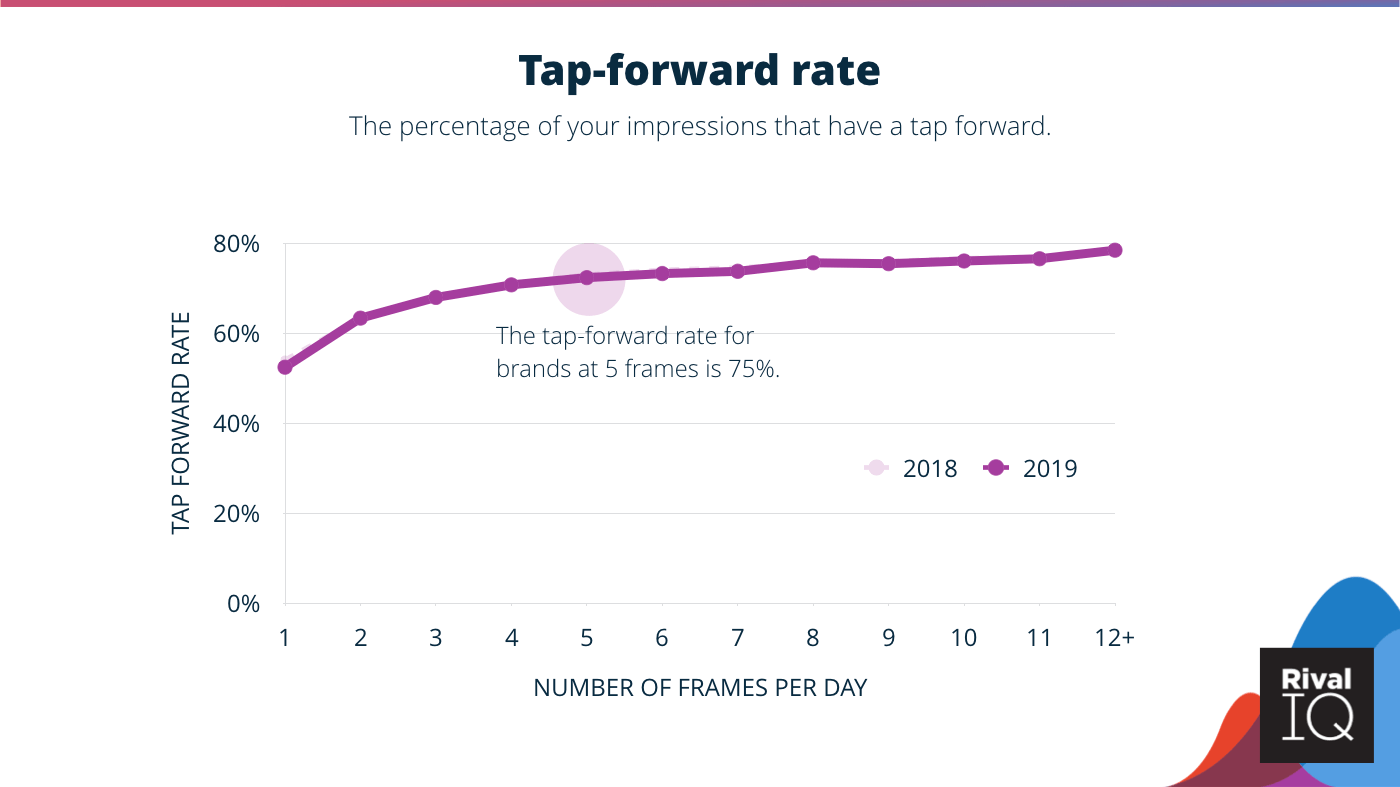
The average tap-forward rate increases as you publish more frames within a day. Instagram Stories were made to move fast, and with so many to see, your audience doesn’t have all day. The median tap-forward rate at 5 frames per day is about 75%. If you’re posting more than 12 frames, your viewers are tapping forward on 80% of your frames–ouch.
Tap-forward rates have stayed almost exactly the same compared to last year’s data.
Tapping forward isn’t always a bad thing, but it can indicate that the viewer has either seen enough of the content or wasn’t interested in the first place. Keep your frames concise and experiment with video to maintain your viewers throughout the entire Story.
Tap-Forward Rate: Images versus Videos
Images on Instagram Stories have a higher tap forward rate than videos, about 3.2% higher. On average a viewer has more patience for images within shorter Stories, by the number of frames. As a Story gets longer, that patience wains.
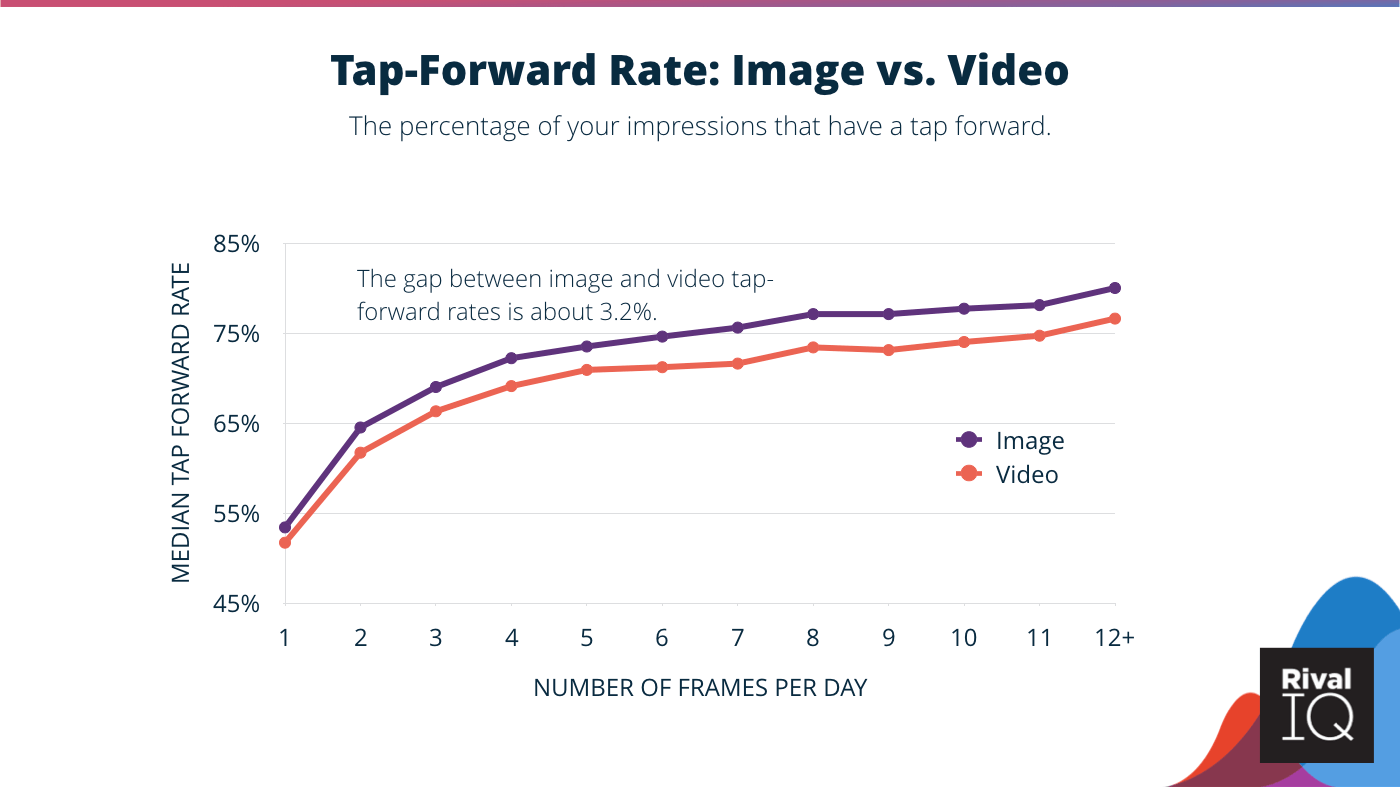
This year, images performed a bit better but still have performed worse than videos in Stories regardless of the number of frames in a day.
Images stick to your Story for a full 5 seconds, whereas video will stay on a screen just for the length of the clip. Once someone has consumed an image, they’re ready to move on to the next thing. More engaging media like videos means more viewers are sticking around until your next frame rather than skipping ahead. Images are viewed in full when your Story has a smaller number of frames, but videos will likely keep eyes on your frames without the fast forward of a tap.
Tap-Back Rate
Tap-back rates indicate Stories reengagement which means double the impact on your viewer.
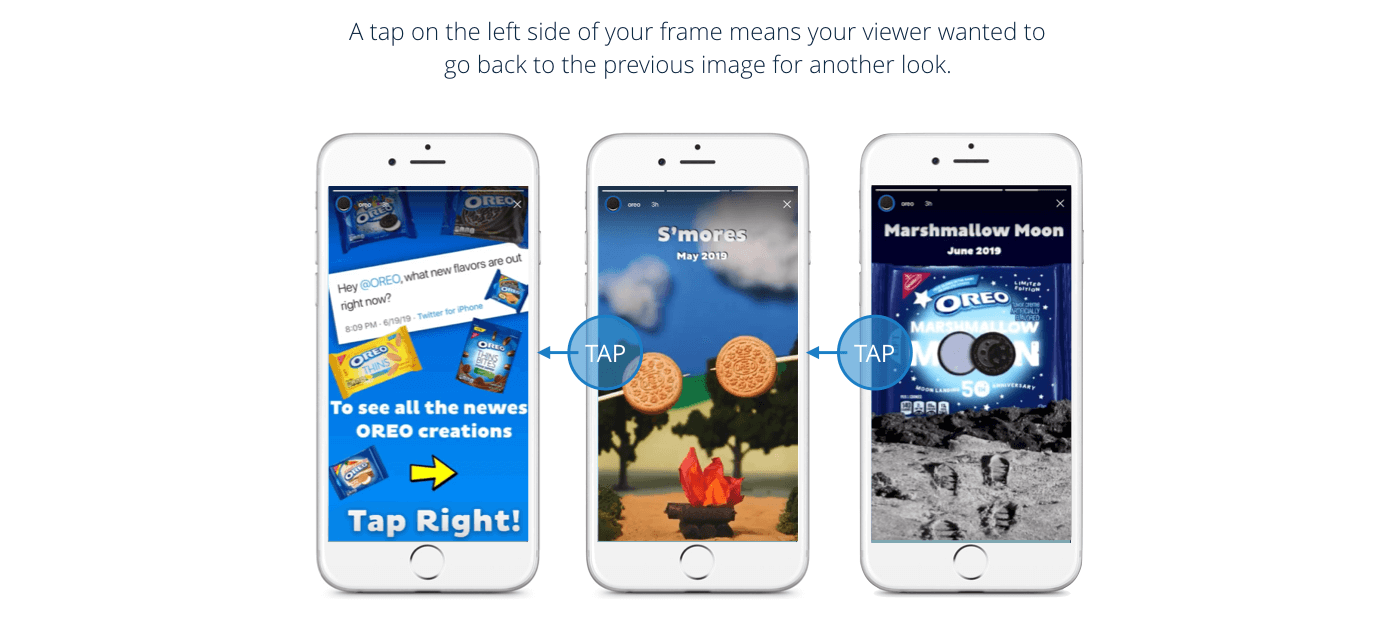
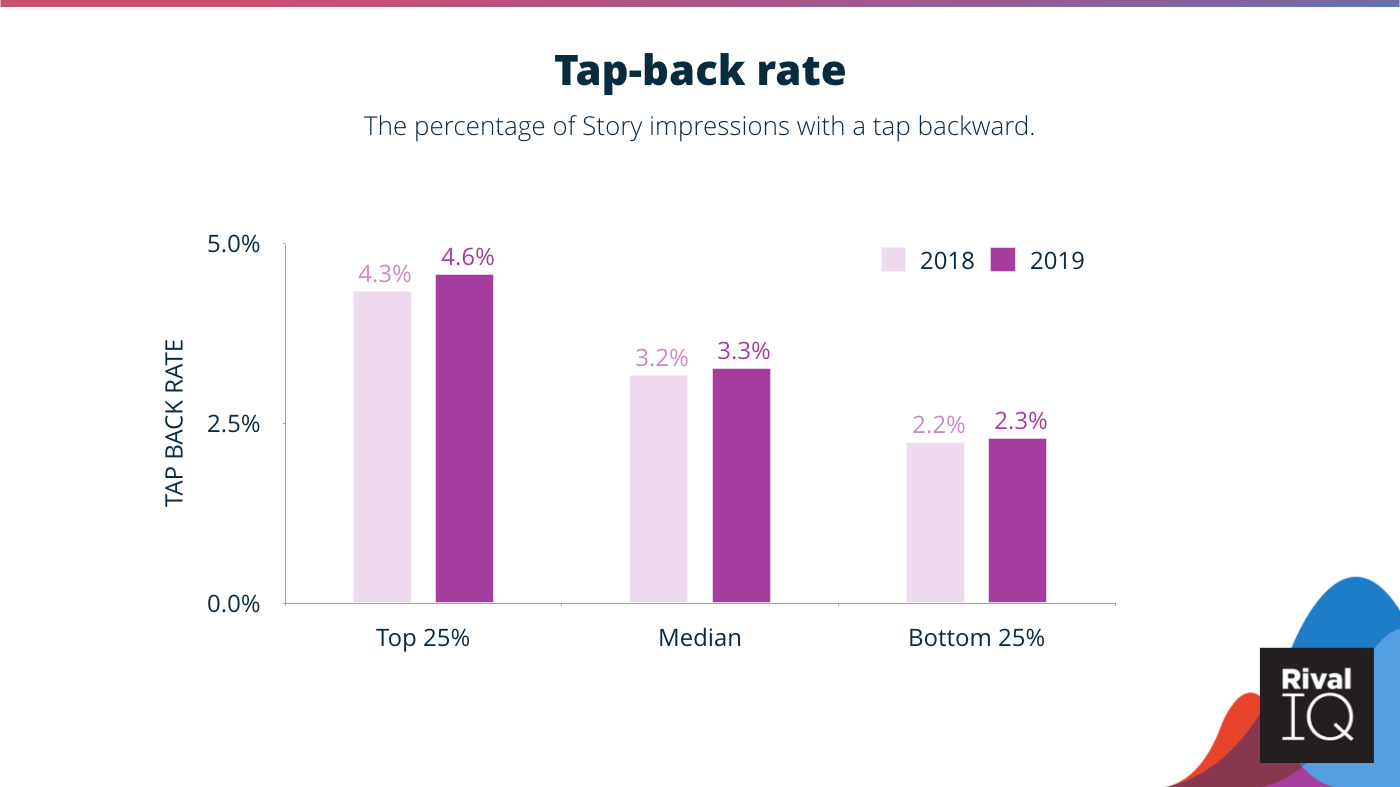
The median tap-back rate is about 3% which is incredibly close to last year’s data. The top 25% of brands see tap-back rates at 4.6%, so if you’re looking at tap-back rates close to that, you’re doing great.
The tap-back rate is only slightly higher in 2020 across the board.
Tap-backs are a good way to see which content type resonates with your followers since they show a viewer was eager to reengage with your content. Tap-back rates have only slightly increased, and without a significant jump, one hypothesis for the slight uptick is that Story viewers are more comfortable with Instagram’s UX this year.
Reply Rate
Replies are a direct way for viewers to acknowledge a Story and are a clear indication that your content landed. In our study, reply rate is the percentage of your Story Viewers that replied to your Story on any given day.
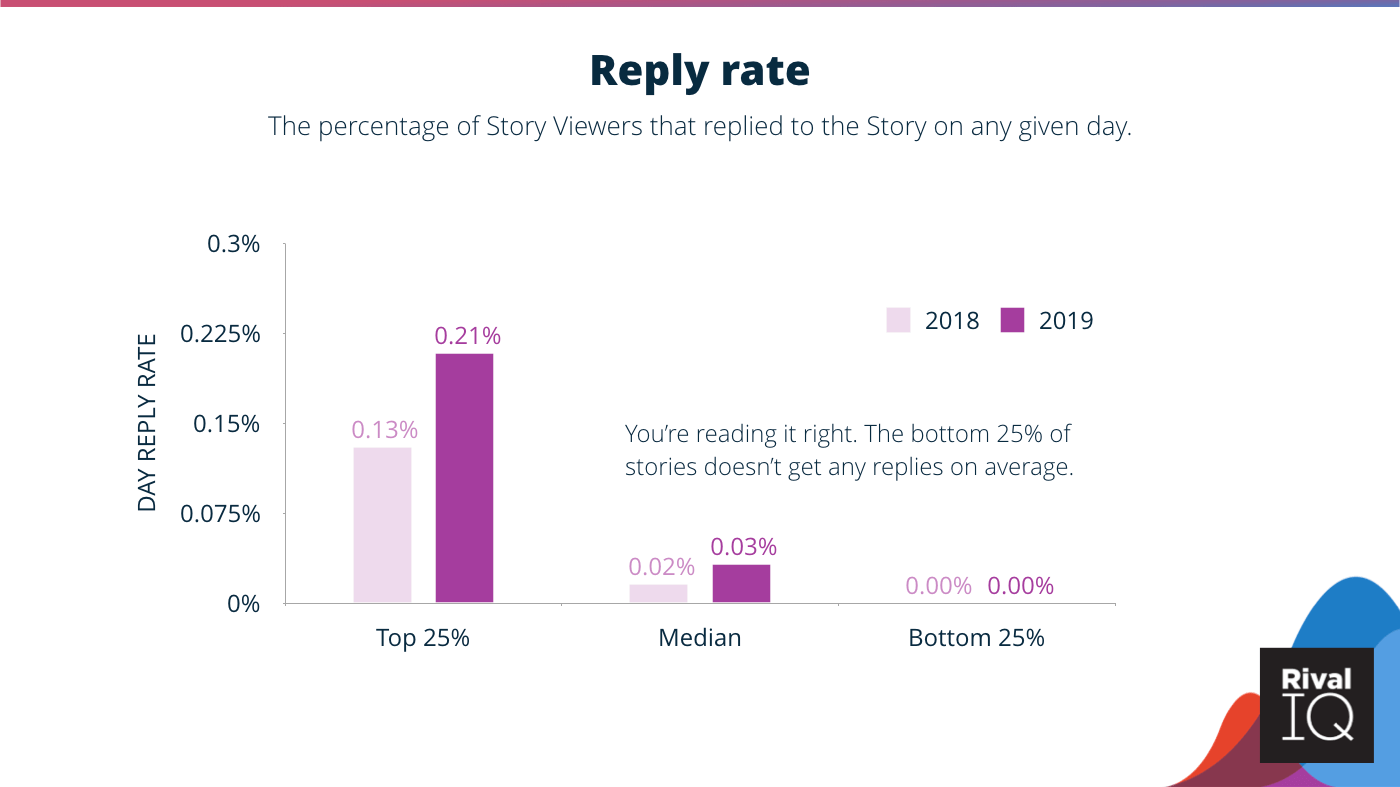
Our analysis shows that users mostly don’t reply to Stories—particularly the bottom 25% of Stories, which has a 0% average reply rate.
But luckily for high performing brands, the average reply rate has increased in 2020. The top 25% of brands in this study saw a 47% increase in Story replies. Median reply rates also grew, about 40%.
Those high levels of change don’t necessarily mean jackpot success, but that the average brand gets a reply from 0.00033% of viewers or 3.3 of every 10,000 people watching their Story. Messages and emoji reactions, launched by Instagram in July 2018, are included in reply rates and contribute to the uptick for 2020.
Unfortunately, Instagram’s API doesn’t include data from in-frame engagement stickers like polls and quizzes, which could count as “replies”. Lightweight engagement from newer features like stickers make viewer interaction simpler and a bit more fun.
Exit Rate
Exit rate is an important metric to keep a pulse on your Stories content and overall success. Think of it as a “mark as read” in your email marketing.
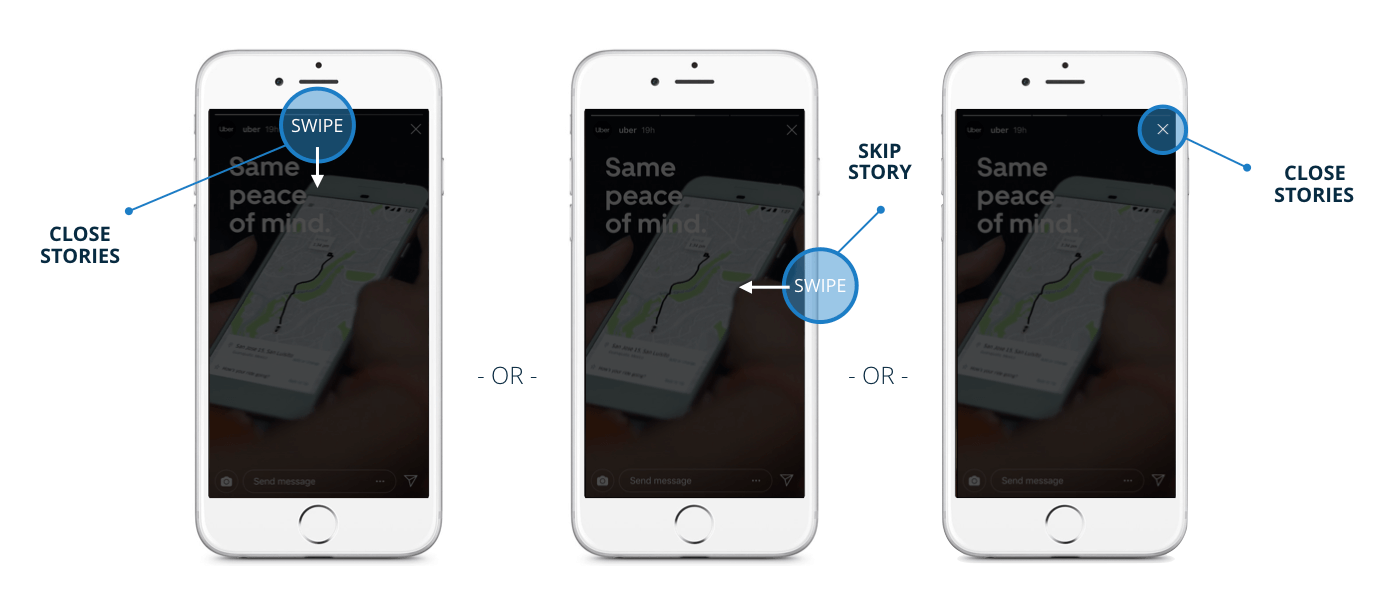
There are three ways to exit a Story: swiping down to exit Stories fully, swiping right to skip the Story, or hitting the “X” to return to Instagram’s feed.
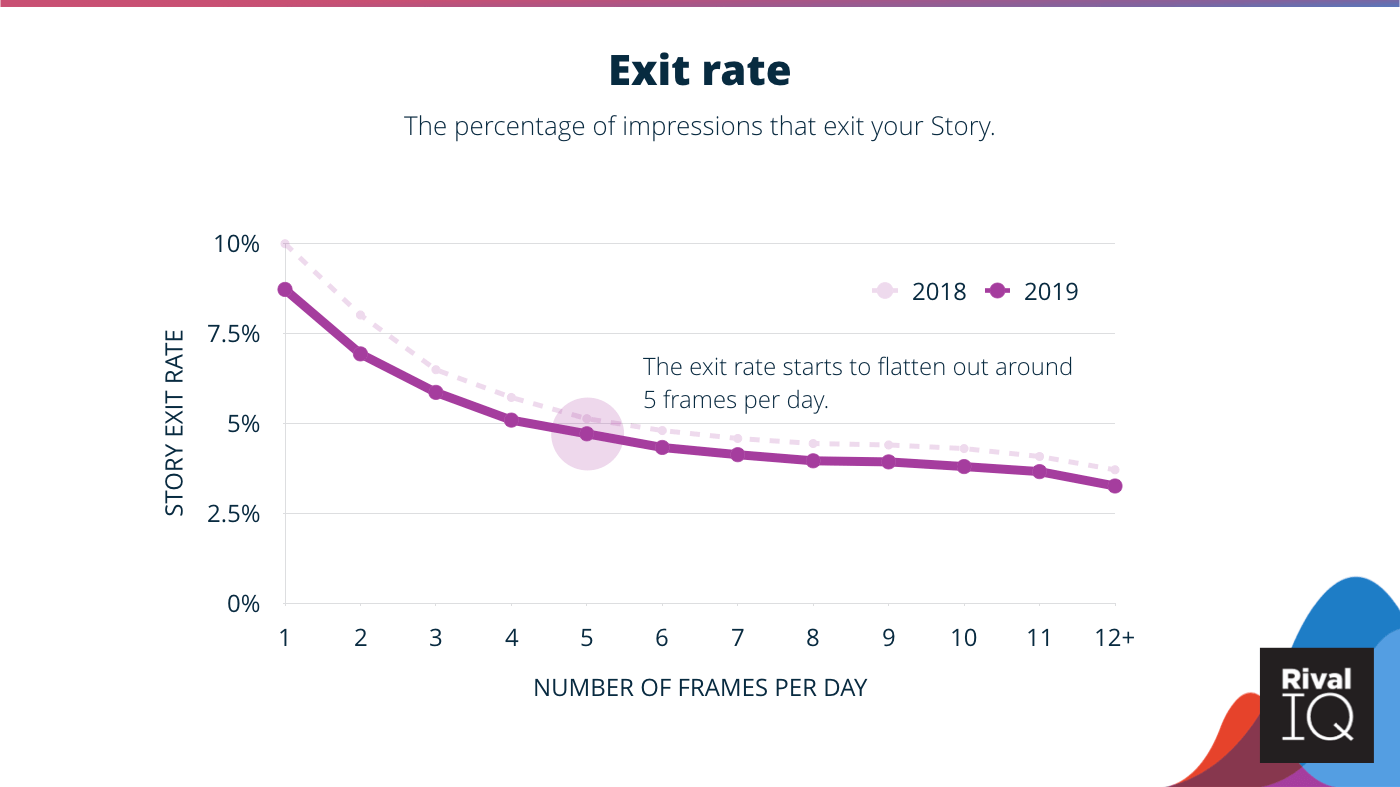
The Story exit rate starts at about 8% for days with a single Story and begins to trail off at 5 frames per day and flattens out in the 3% range.
Brands overall improved by about 20% in exit rate performance since the year’s data. In this report, the average brand’s performance is outperforming the previous year’s Story data. Fewer skips, exits, and closing Stories across the board means that we, as social media marketers, must be getting good at this Stories thing.
Exit rates are correlated with retention, so consider this graph a companion to the retention rate analysis.
Find your own Instagram Stories data
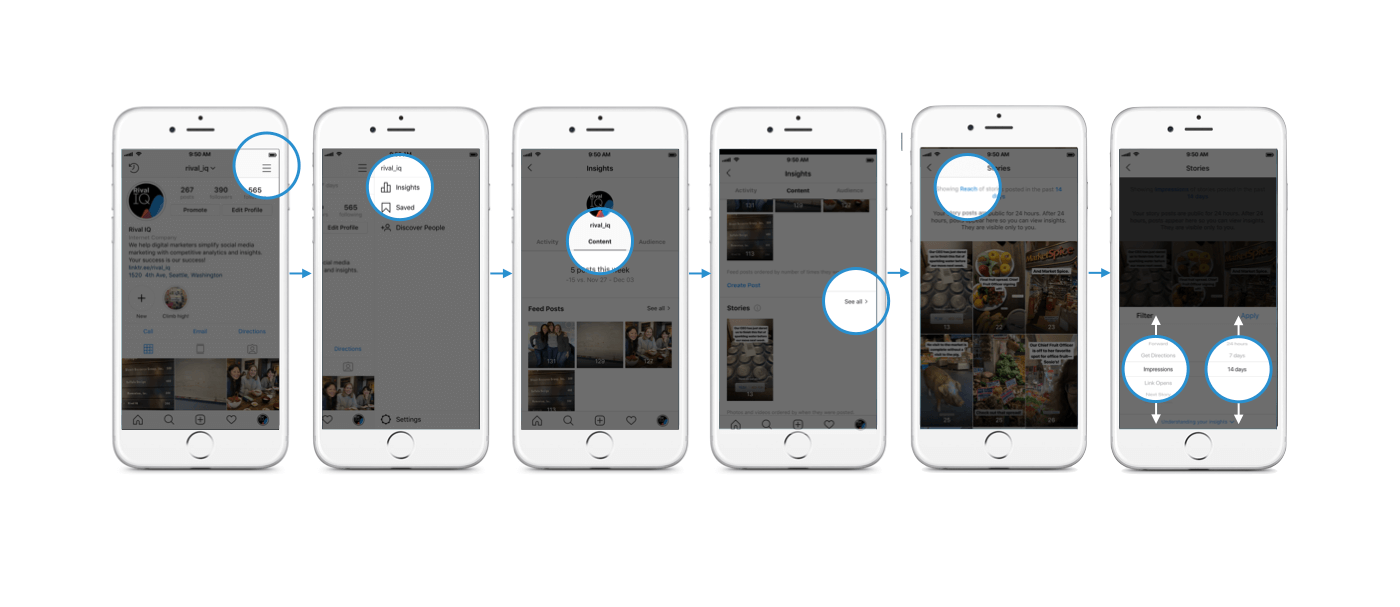
Hey, get your own data! Instagram Insights are only available to Instagram business profiles, creator accounts, or verified handles. You can look at viewer lists as far back as two weeks in Instagram’s native Insights platform. Here’s more info from Instagram on how to access your data natively.
If you’re looking for all your Instagram Stories stats all in one spot, you can always start a free trial of Rival IQ or access Instagram Insights in your existing account. Once you connect an Instagram business profile to Rival IQ, you’ll start capturing all your new Instagram Story data (and more!).
Conclusions
Despite some changes from last year, Stories are growing in use with both brand and personal accounts. We can see that Instagram is continuing to invest in the Stories format by putting stories front and center and building out Story features. Brands experimenting and investing in Stories are seeing rewards in their engagement from viewers.
If you haven’t started using stories, think about creating a strategy that experiments with Stories multiple times a month. Remember to post at least a few frames and use the interactive elements offered by Instagram to maximize your reach and engagement. With reach rates down and retention rates up, it’s more important than ever to hook your audience with high-quality, engaging frames.
Ready to see how your brand measures up? Download a copy of the report that you can consult anytime.
Of course, don’t forget to measure your performance and what works best for your brands. Analyzing your data and developing a Stories strategy is easier than ever with powerful analytics tools and competitive benchmarking from Rival IQ. See for yourself when you try it free for 14 days.
Methodology
Rival IQ analyzed over 29,000 Instagram stories (and 145k+ frames!) posted between June-October 2019 to bring you insights for your 2020 marketing strategy.
We included 550 Instagram handles that had at least one Story published during each month of the time frame, and we only included handles with a reach of at least 100 views for each frame and a 1k total follower minimum. Handles were included only if we had all of their data for the entire time period, regardless of how frequently or infrequently they posted. These handles reached across multiple industries, including beauty, media, influencers, outdoor/adventure, marketing, and more.
Instagram Story Metrics: Glossary
Here’s a handy glossary of the metrics and their definitions used in this report. This way, we’re all on the same frame.
Frame: A single photo or video posted to your Instagram Story.
Story: The set of frames posted to your Story within a single 24-hour day.
Story Viewers: The number of people who saw your Story on a given day.
Impressions: The total number of views of a frame in your Story.
Reach: The total number of unique people that saw a frame in your Story.
Engagement: Measurable interaction on Instagram Stories and posts, including likes, comments, replies, and shares.
Retention Rate: The percentage of your Story Viewers on any given day that see all your frames.
Reach Rate: Your Story Viewers on any given day divided by your follower count, expressed as a percentage.
Post Reach Rate: The reach of a post expressed as a percentage of your followers.
Tap-Forward Rate: The percentage of your impressions that have a tap forward to see the next photo or video.
Tap-Back Rate: The percentage of your impressions that have a tap backward to see the previous photo or video again.
Reply Rate: The percentage of your Story Viewers that replied to your Story on any given day.
Exit Rate: The percentage of your impressions that exit your Stories by swiping right, swiping down, or closing Stories.