“How do I know how my Instagram Stories are doing?”
Instagram Stories are hotter than ever, but it can be tough to know how you’re doing in comparison to your competitors. We heard your cries for more information about how to measure your Story performance, so we’re rolling out the most comprehensive look yet at Instagram Stories benchmarks.
We looked at more than 18,000 Instagram Stories (91,000+ frames!) to answer your most pressing questions about how you’re doing on Instagram and where you can improve. How frequently should you be posting Instagram Stories? Should you be focusing more on videos or photos? What kind of Stories engagement can you expect?
We answer all that and more in this comprehensive look at Instagram Story performance in 2018 so you can benchmark your success and adjust your goals and strategy for your 2019 Instagram Stories game.
Tap forward (?) for all the details, and then download a copy of this report so you have it handy anytime you need to see how you’re doing on Instagram.

The Stories benchmarks you need to supercharge your engagement.
Download the reportTable of Contents
- Methodology: How to measure Instagram Stories success
- Activity Levels: The best number of frames to post to your Story and how often to post
- Retention Rate: The number of viewers you can expect to stick with every frame of your Story
- Average Reach Rate: The percentage of your followers you can expect to see your Story
- Reach on Stories vs. Posts: How to compare reach for your posts vs. Stories
- Tap-Forward Rate: How to calculate the number of tap-forwards you can expect based on frame count and media type
- Tap-Back Rate: The number of tap-backs you can anticipate from your viewers
- Reply Rate: The number of replies you’ll see in your story (spoilers: not many!)
- Exit Rate: The importance of keeping exits low to increase Stories retention
Where are Instagram Story stats?
Finding Your Stories Metrics On Instagram
Instagram Insights, which are needed to access in-depth Story data, is only available to Instagram business profiles or verified presences. Once you meet that criteria, here’s how to find your stats.
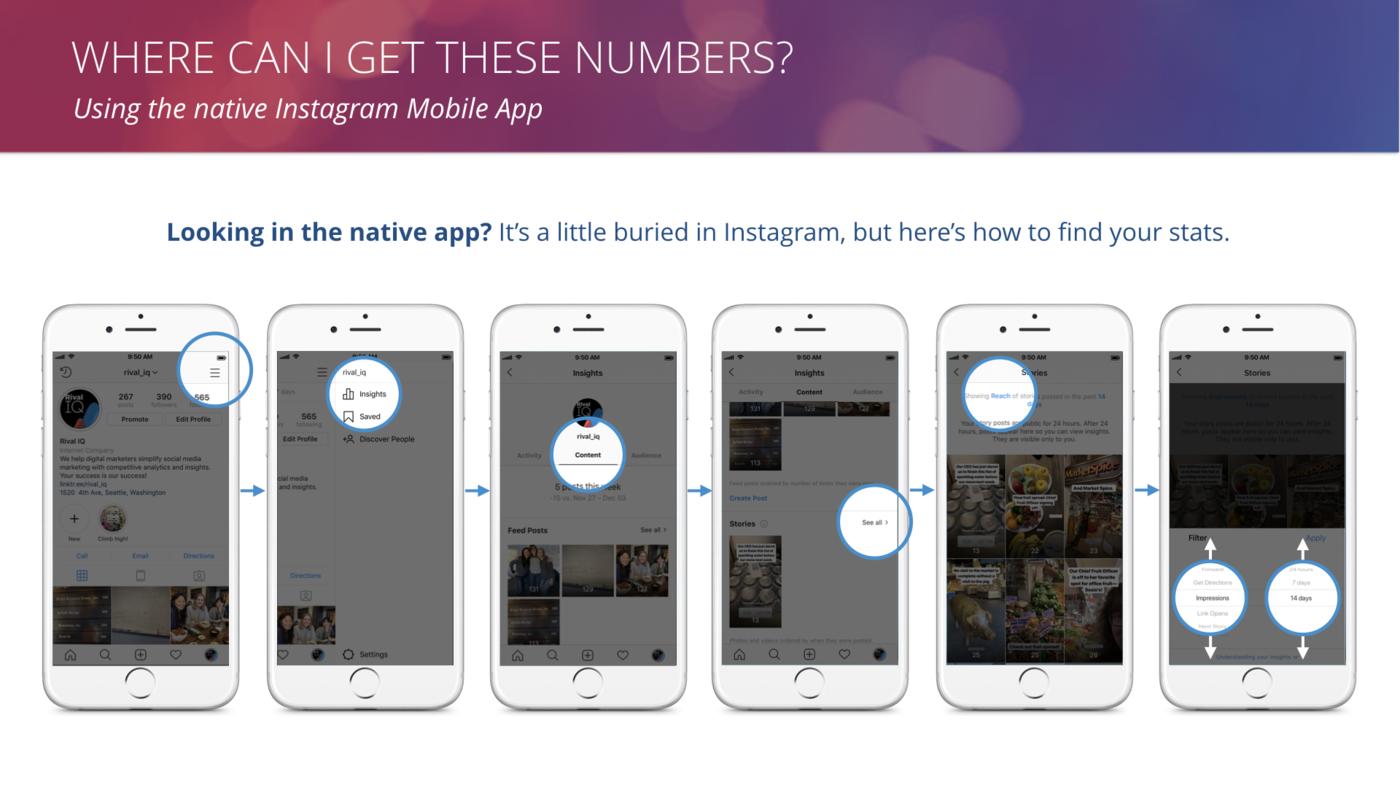
Getting Stories Metrics From the Instagram App
You can look at metrics as far back as two weeks in Instagram’s native Insights platform.
Finding Your Stories Metrics In Rival IQ
Of course, if you’re hungry for all your Instagram Stories stats in one spot, you can always start a free trial or access Instagram Insights in your existing account in Rival IQ.
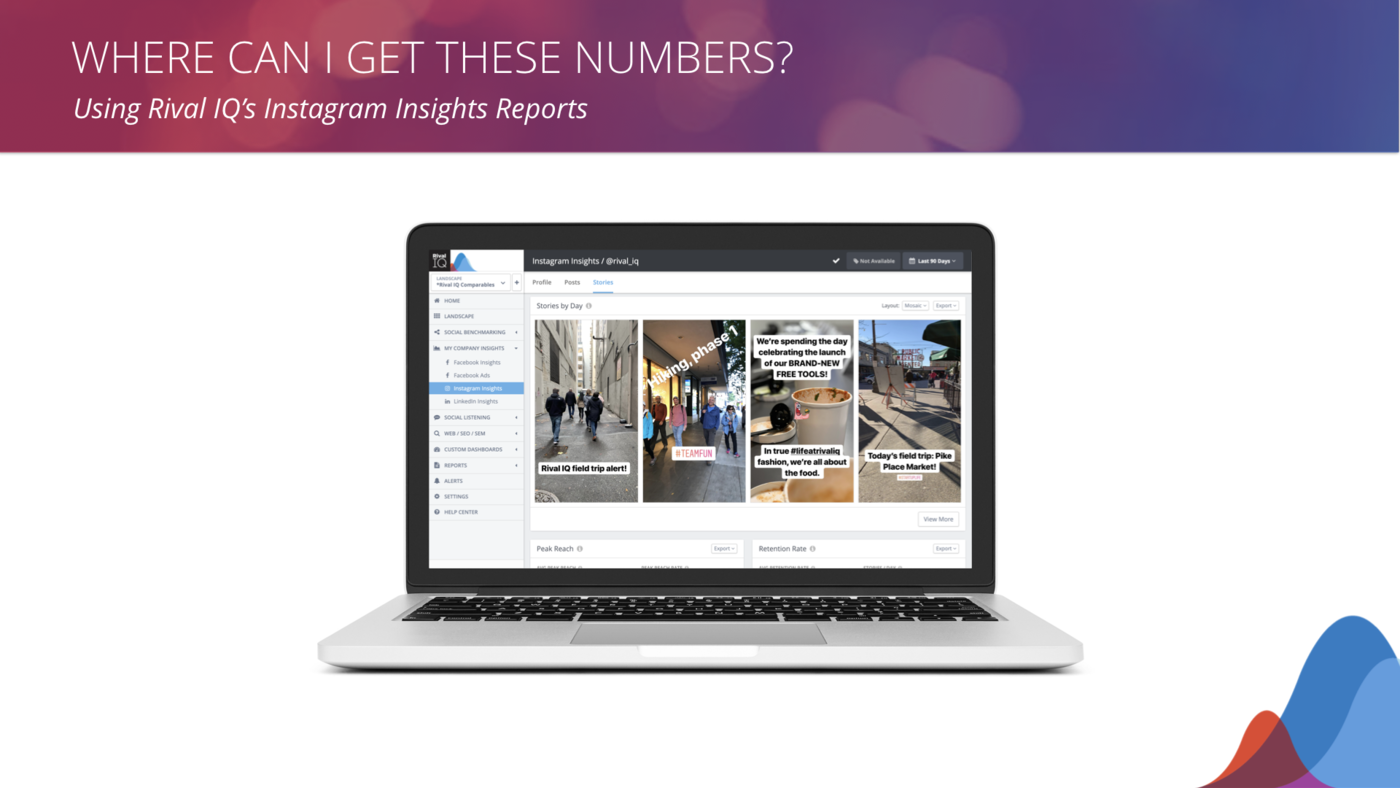
Get Your Instagram Stories Metrics Within Rival IQ
Once you hook up your Instagram business profile to Rival IQ, you’ll start capturing all your Instagram Story data (and more!). We know we’re a little biased, but we think being able to see all the metrics that matter at a glance and have more control over the time frame we’re examining is the best way to improve the impact and reach of your Instagram Stories.

Start measuring your Instagram Stories performance today.
Free 14-day Rival IQ trialNow, let’s get to the good stuff: the analysis.
Activity levels
Are you posting Stories too often? Not often enough? Too many or too few per day? We established a baseline of posting frequency so you can figure out your Stories sweet spot.
Days with a Story
Every social media marketer can sing a song about not enough time and too many channels, so she has to conserve her content creation energy by finding the right number of days to post Stories.
Let’s take a look at how many days each week or month you should be planning to post Stories.
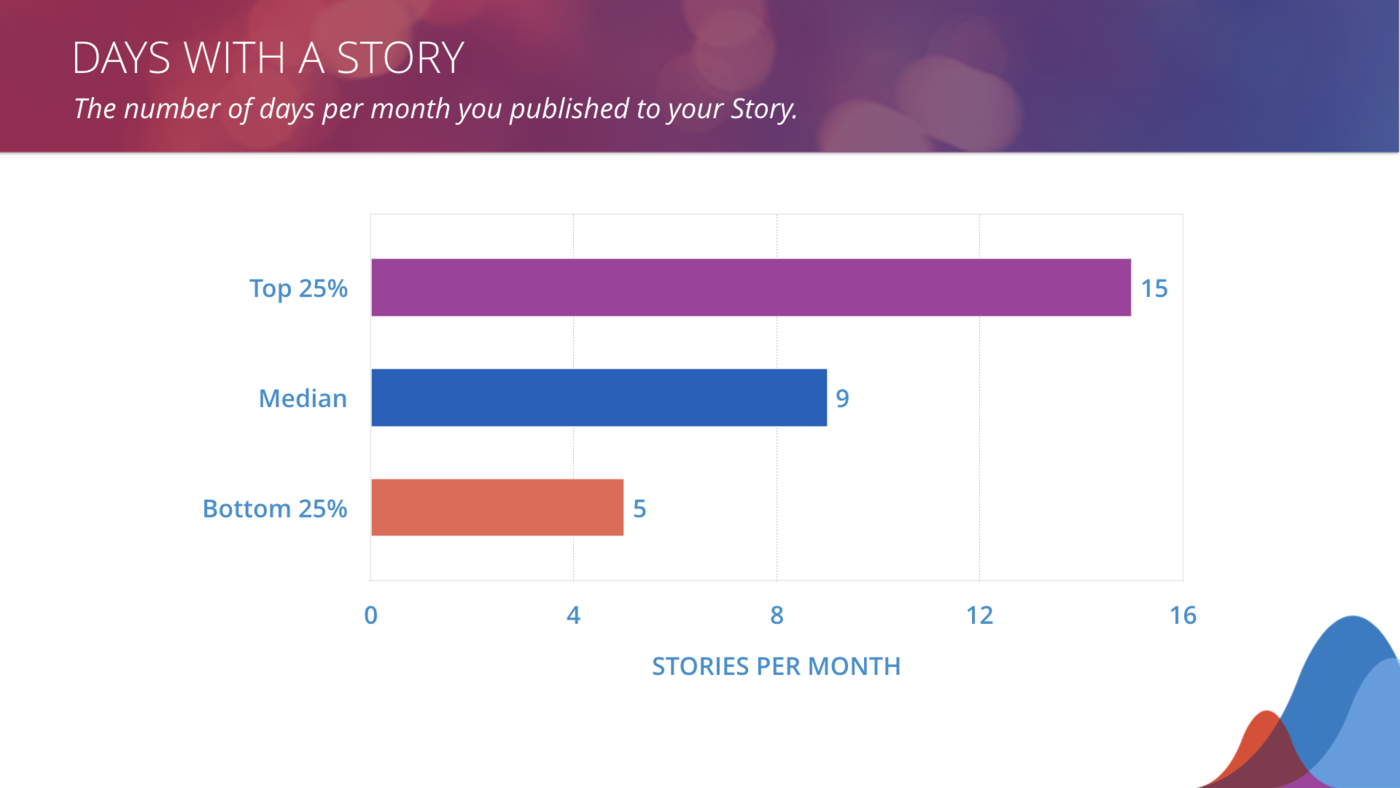
Days with a story benchmarks
On average, brands are posting Instagram Stories once every three days, which is a good cadence to aim for. Across all industries, only the most active are publishing close to daily, while the vast majority are still posting 3-4 days per week or fewer.
Bottom line: Aim to post a Story every few days to keep the content flowing to your most engaged fans and to stay in the Instagram Story stream. Consistency is key, and helps remind your followers that they should check back often to see what your brand is up to.
Frames per day
Is one Story frame better than a hundred? What about the difference between three Story frames per day and five?
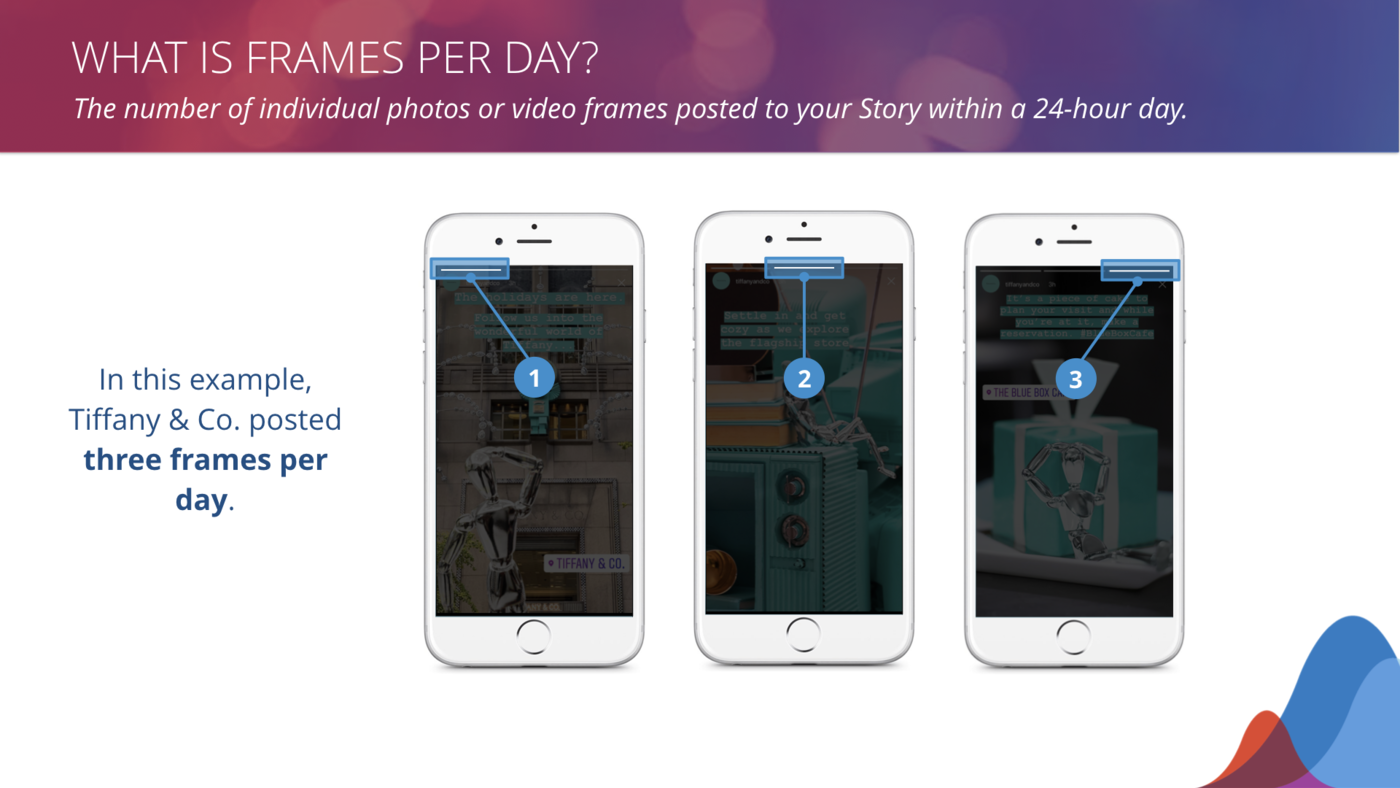
What is frames per day?
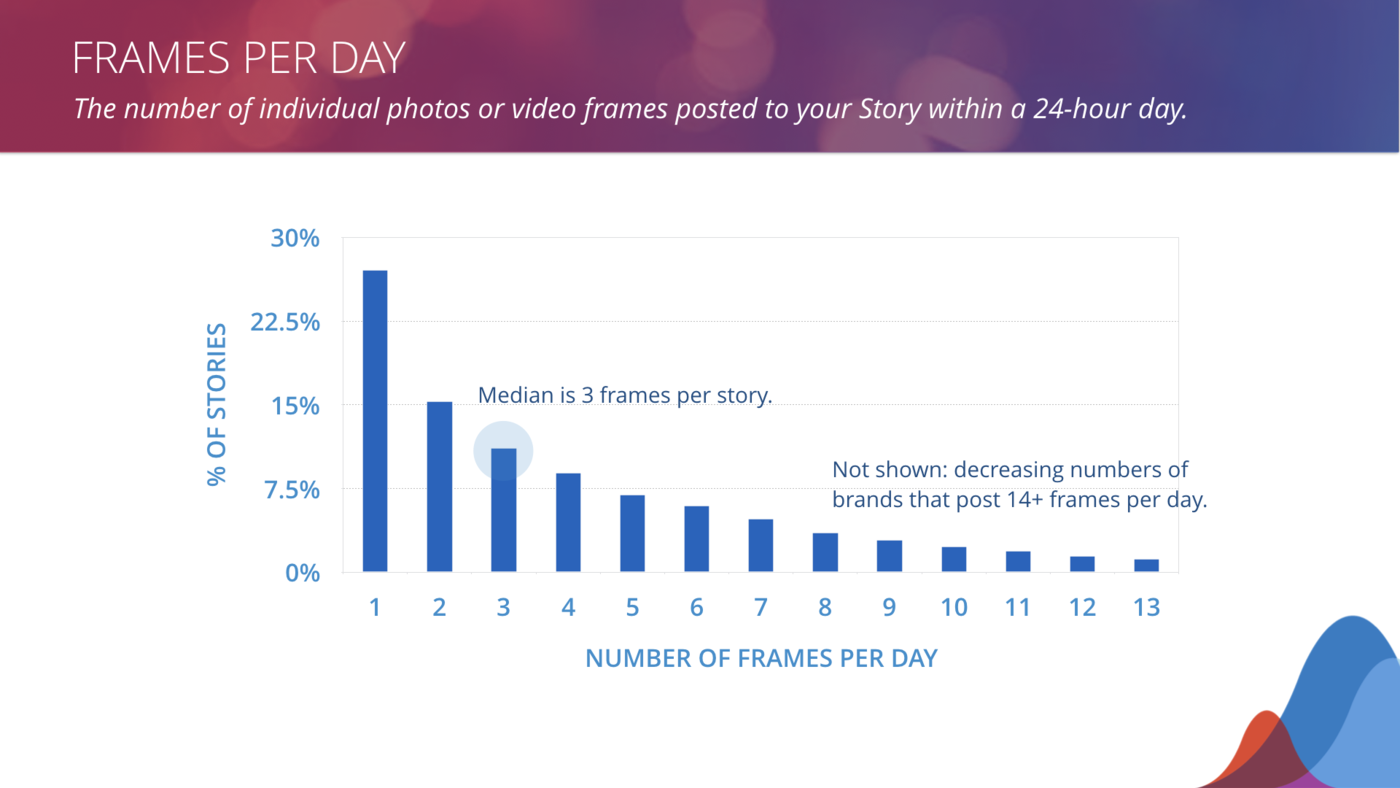
For the purposes of this study, frames per day represents the number of frames (as indicated by each indicator bar in the graphic above) published in a 24-hour period.
Frames per day benchmarks
More than 27% of all Story activity in our study comprises days with a single frame. In other words, if you’re posting just one frame per day, don’t sweat it. You’re not alone.
The median number of frames published in a day is 3, and only about 25% of days have 7 or more frames. Generally, shorter Stories are more common than long ones.
Bottom line: No need to produce a bunch of frames to get in the game–a well-told frame or two can make a big splash with your followers while keeping your handle in the Instagram Story rotation.
Retention rate
We don’t like to play favorites, but if we had to pick one Instagram Story metric to rule them all, it would be retention rate. If your viewers stick around, it validates your entire Stories content strategy: not only did you bring them in, but you kept them around with engaging content.
Other metrics are important too, but a strong retention rate is a good indicator of health across all your Stories analytics. And, of course, vice versa–a low retention rate goes hand in hand with a high exit rate, for example.
What is retention rate?
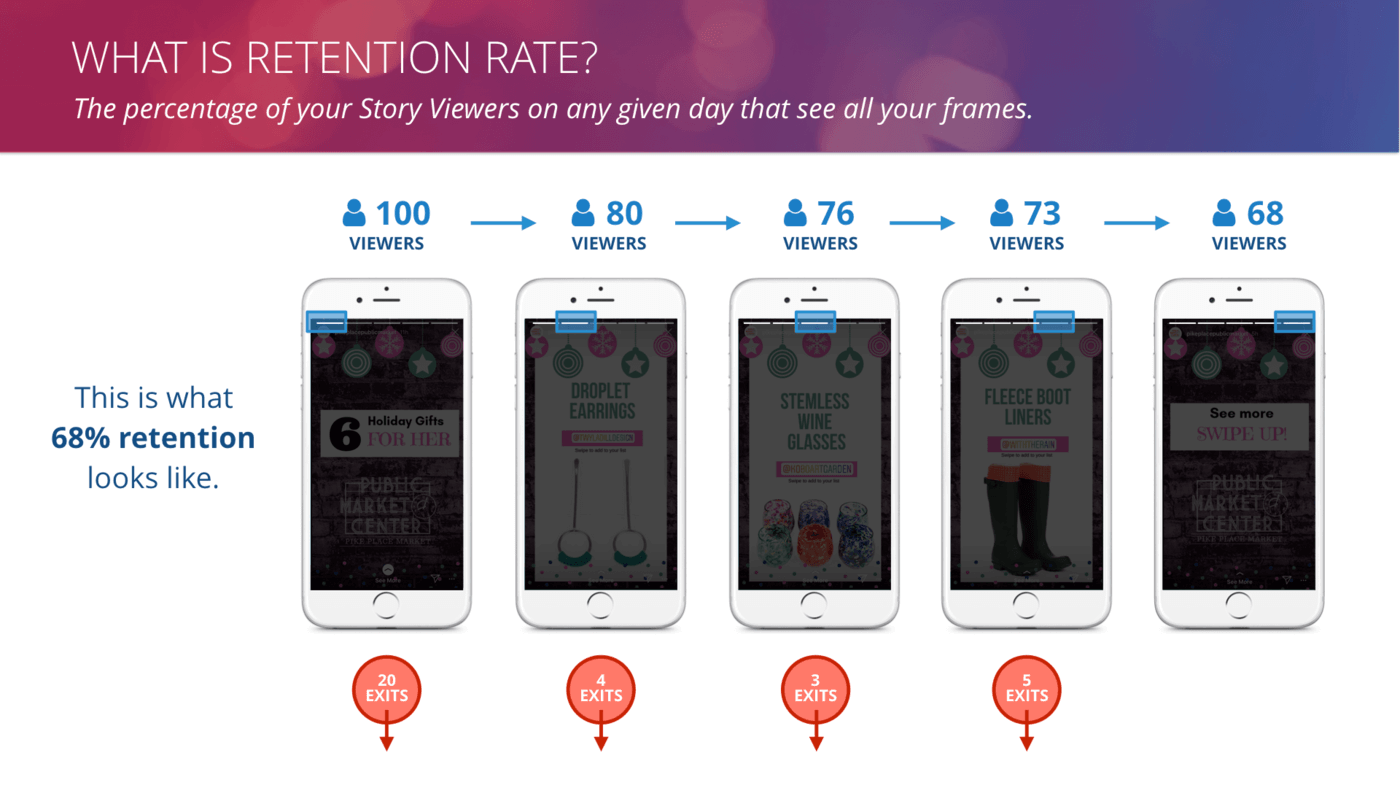
We define retention rate as the percentage of your viewers within a day that see all your frames. The more of your frames a viewer sees, the higher the chance for connection and engagement, so retention is a really good place to focus your Stories efforts.
Retention rate benchmarks
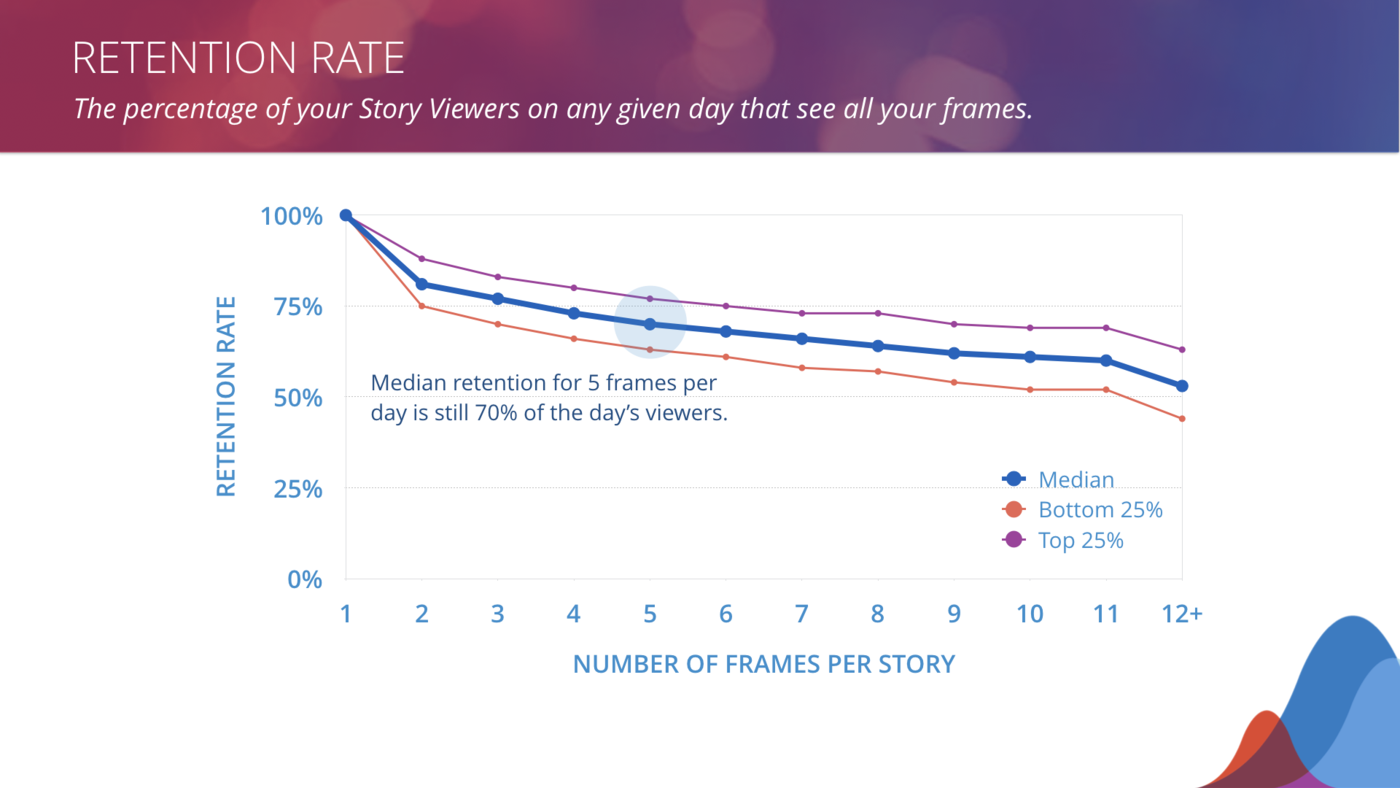
In the retention graph above, we can see that, on average, brands are losing about 20% of their audience moving into the second frame of the day. Though that might seem like a large drop, the good news is that the audience fall off from there isn’t nearly as sharp. Even at five frames per day, the retention rate stays above 70%.
Brands might think that posting too many frames in a day will turn viewers off and deter them from sticking with their content, but that’s just not the case. Seeing the gentle decline in retention as the number of frames in a day grows, we can see that there’s really no downside to posting more frames–as long as your content is engaging.
While most of your followers might not be seeing your Stories, a high retention rate means you have a big opportunity to focus the attention of those that do see your stories, especially when compared with a single post. Adding additional frames to your story create more chances to entice your viewers to purchase, share, tell their friends, etc.
Bottom line: In our experience, retention is the single largest measure of Instagram Story success. Make sure your first frame hooks your viewers, and then from there, the sky’s the limit: don’t be afraid to post as many frames of quality content as you have on hand. Your most fervent followers will want to see all of it.
Story reach rate
All of us marketers publish content to reach and engage our followers. But, how do we know that they’re all seeing it? Can we count on a consistent percentage of them seeing our content on any given day?
What is reach rate?
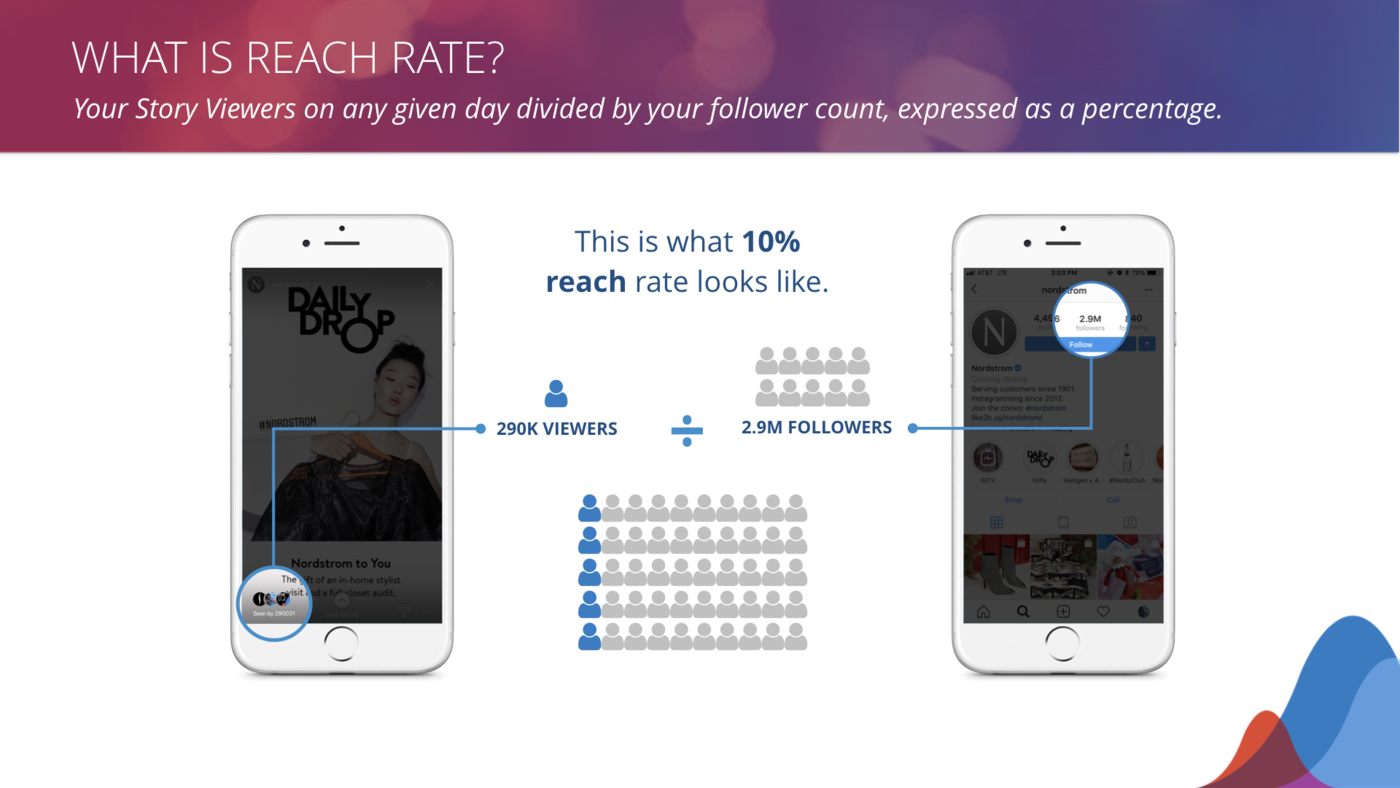
Reach rate, the percentage of followers that see your Stories, can tell us the answer. Reach rate, often referred to as organic reach, is a measure of how often our content is appearing in our followers’ feeds. The number is heavily determined by the Instagram algorithms for feed and story order.
Reach rate benchmarks
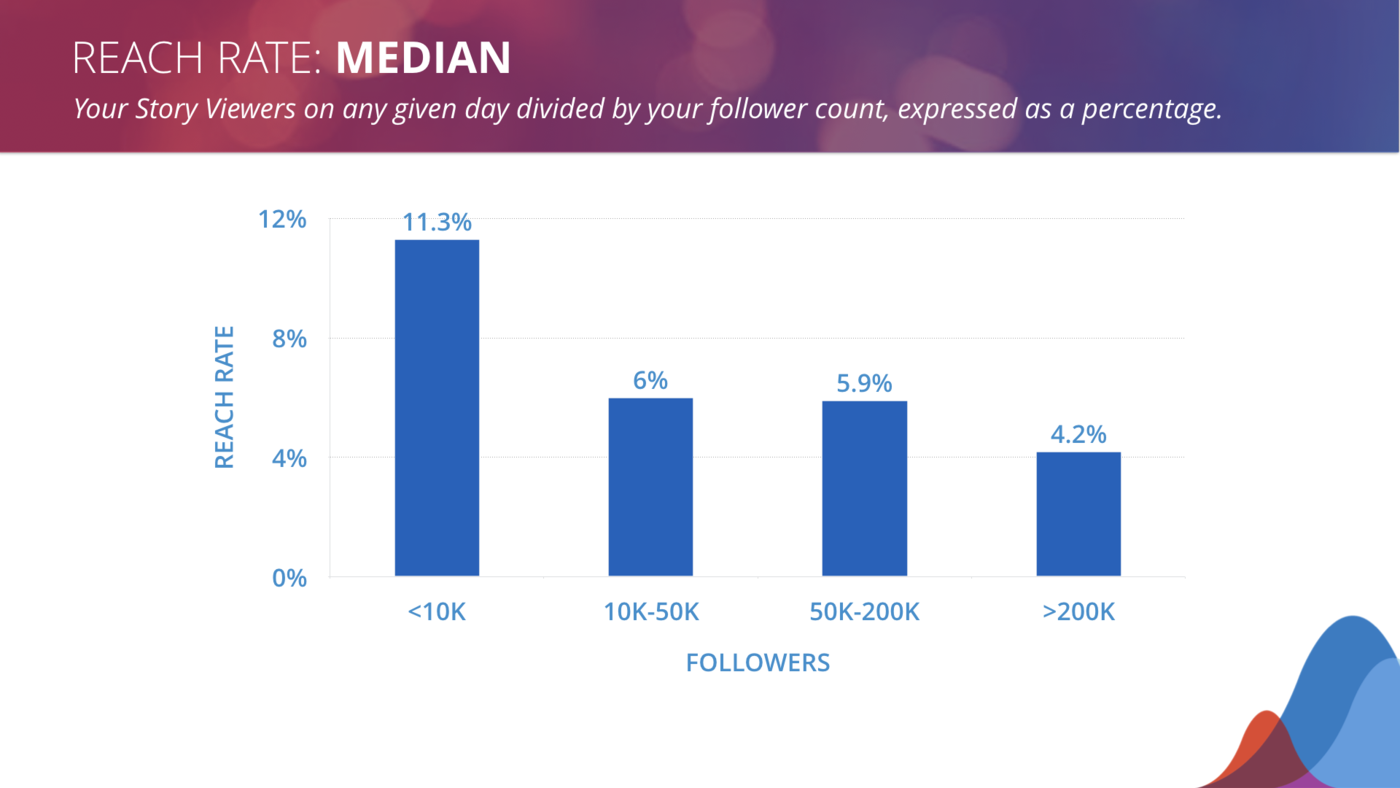
As you can see in the chart above, the larger your follower count, the smaller percentage of them you’ll reach with your Instagram Stories.
Big congratulations to handles with fewer than 10,000 followers, who enjoy almost a 10% reach rate–nearly double their larger cousins’. If you have more than 10,000 followers, your story reach rate is likely under 6%. Following this decline, handles with more than 200,000 followers reached just an average of 4.2% of their followers on any given day via Stories.
Bottom line: It can feel disappointing for bigger brands to reach fewer of their followers, but it still pays to thoughtfully grow your follower count over time.

See how you stack up against your biggest Instagram competition.
Run a free Head-to-Head ReportComparing reach rate: Instagram Posts vs. Instagram Stories
A little context goes a long way, so we wanted to compare the reach rate of Instagram Posts and Stories side-by-side so we could see which medium touches the most viewers. Spoilers: posts still win the day, but there’s still plenty to learn by lining up posts and Stories.
Post reach rate
Let’s start with post reach rate, which should feel familiar to anyone regularly crunching their Instagram metrics. Just like with Stories, we’re aiming to answer the question: how many people saw my post compared to the size of my audience?
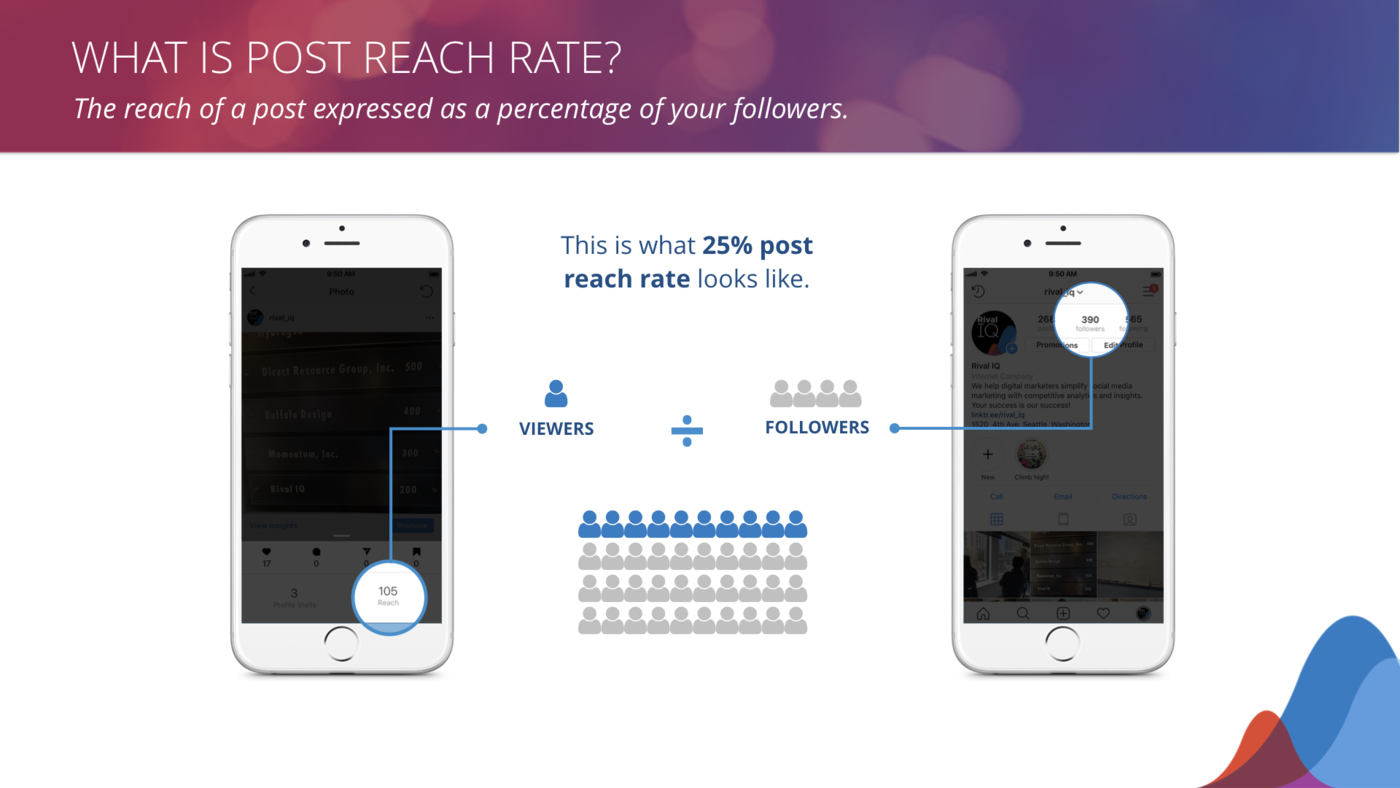
What is post reach rate?
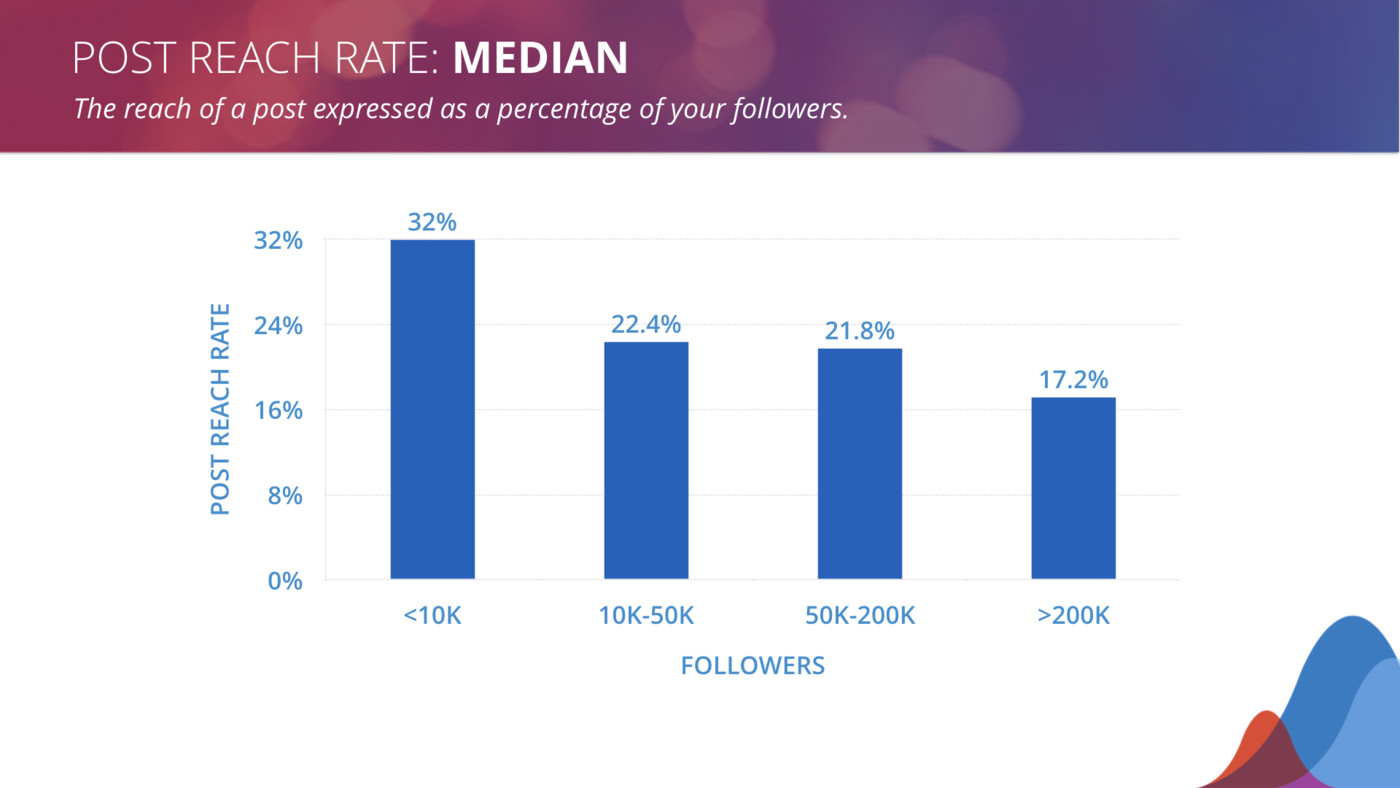
In the graph below, we see post reach broken down by the follower counts of the handles in this study. Smaller handles (with 10K followers or fewer) reach more than 30% of their followers on average. As follower counts grow, that number decreases. For those handles with 200K or more followers, only about 17% of their followers see their posts on average.
Post reach rate benchmarks
Bottom line: While brands with more followers see less post reach rate than those with smaller followings, there’s still plenty of reach to go around when it comes to posts.
Reach rate comparison
How does reach rate compare when Instagram Stories and posts are side-by-side? We wondered too, so we lined them up to look at the relative comparison of each reach rate.
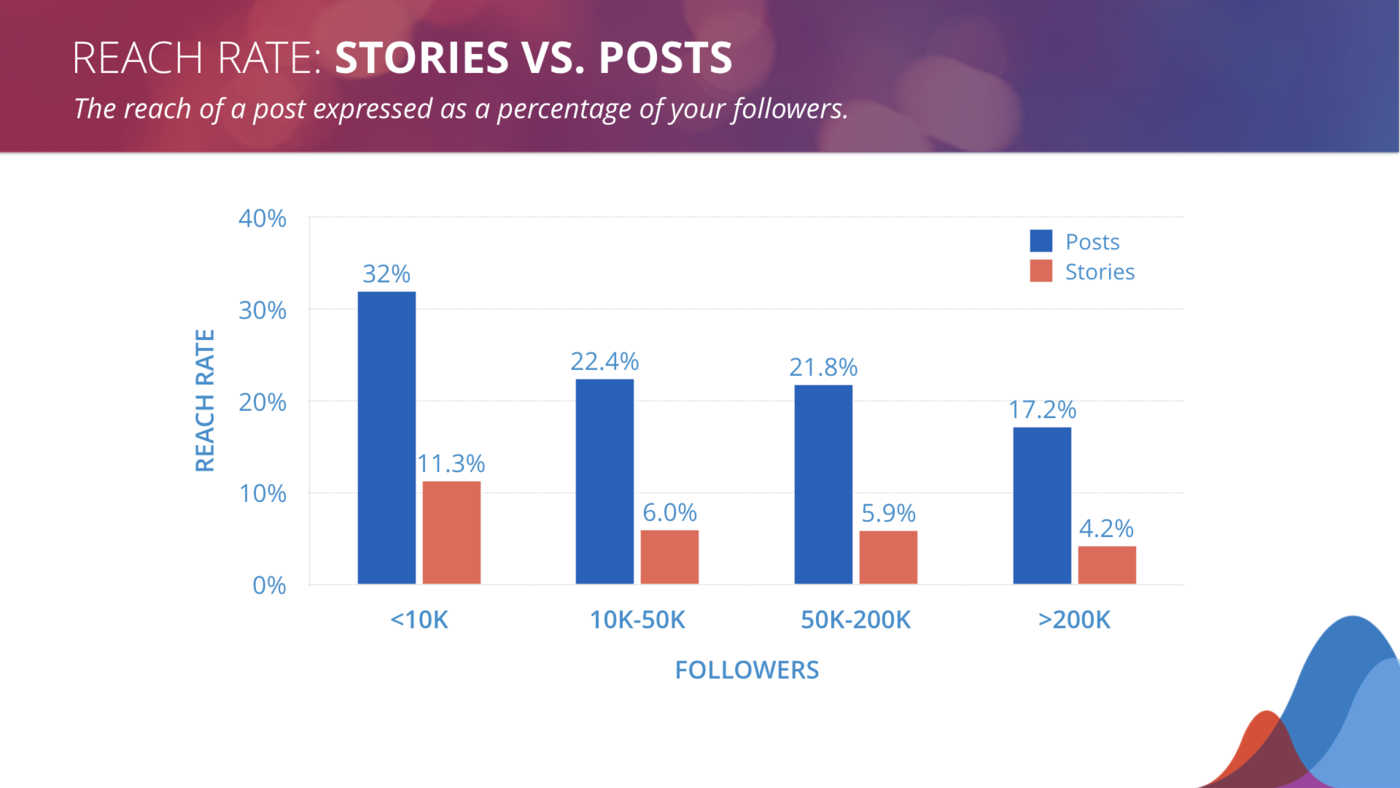
Just like with Stories, the larger your follower count, the smaller percentage of them you’ll reach with your posts.
Stories vs. posts reach rate benchmarks
Smaller handles (with 10K followers or fewer) reach 32% of their followers on average. For those handles with 200K or more followers, only about 17% of their followers see their posts, on average.
In the chart above, you’ll note that when we line up Instagram Stories vs. posts, it’s clear that no matter how many followers you have, more of them are seeing your posts than any given Story.
But wait! Even though fewer people are seeing Stories, the average brand is getting lots of face time with their followers who are watching Stories. The high retention rates we saw earlier mean that the followers who are watching stick around to see what you’re saying.
Bottom line: Don’t let post popularity keep you from investing in Stories. While posts are still reaching a broader cross-section of your followers, we can see via metrics like retention rate that followers are really watching your Stories, which is worth its weight in gold.
Make sense of your Instagram Stories metrics.
Tap-forward rate
When measuring your Instagram Stories success, it’s really helpful to know at what rate your viewers are consuming your content. Is every frame you share getting a tap forward, or are viewers lingering with your content?
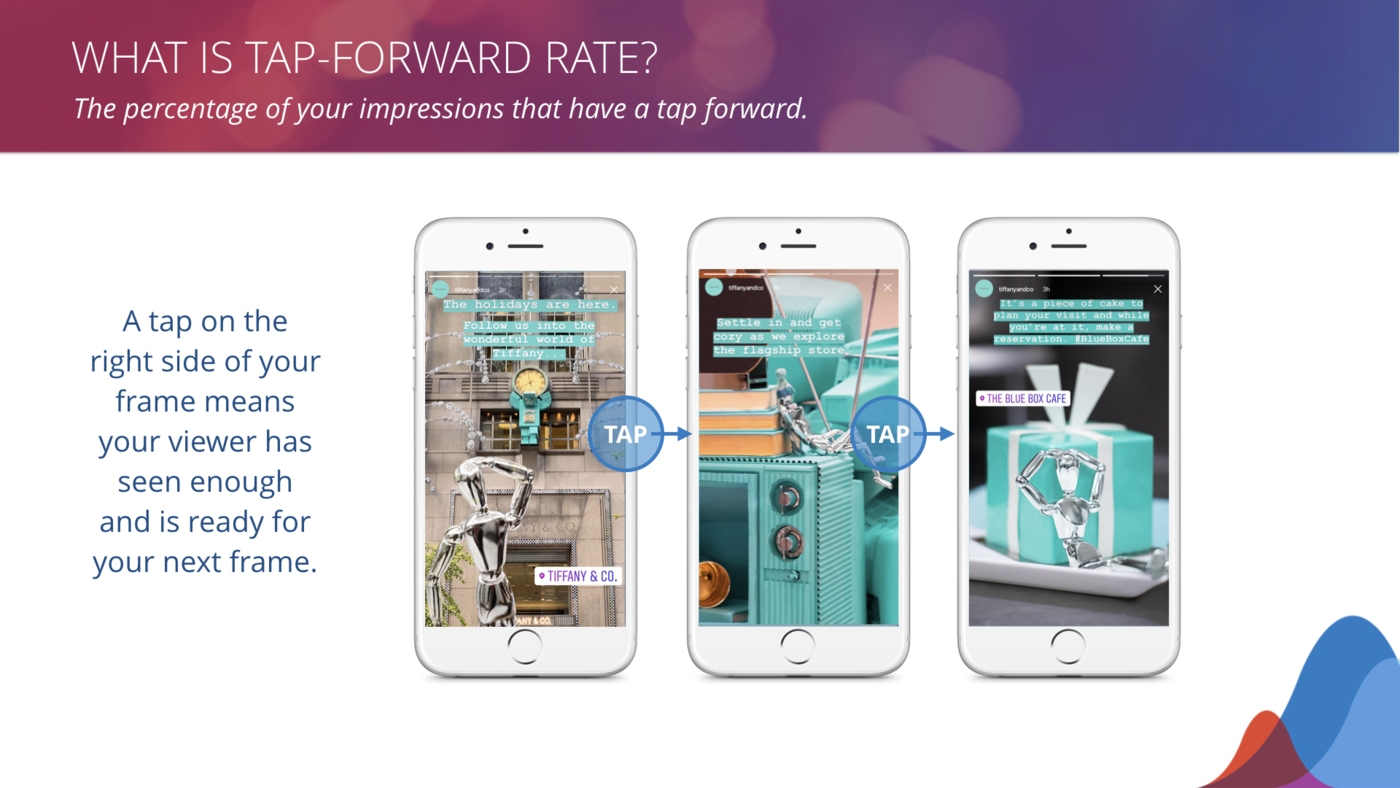
What is tap-forward rate?
Your tap-forward rate is the percentage of your impressions that have a tap forward to see the next photo or video in your Story.
Median tap-forward rate
How does the number of Instagram Stories you post per day influence your median tap forward rate? No surprises here: the more Stories you post, the higher number of tap-forwards you can expect.
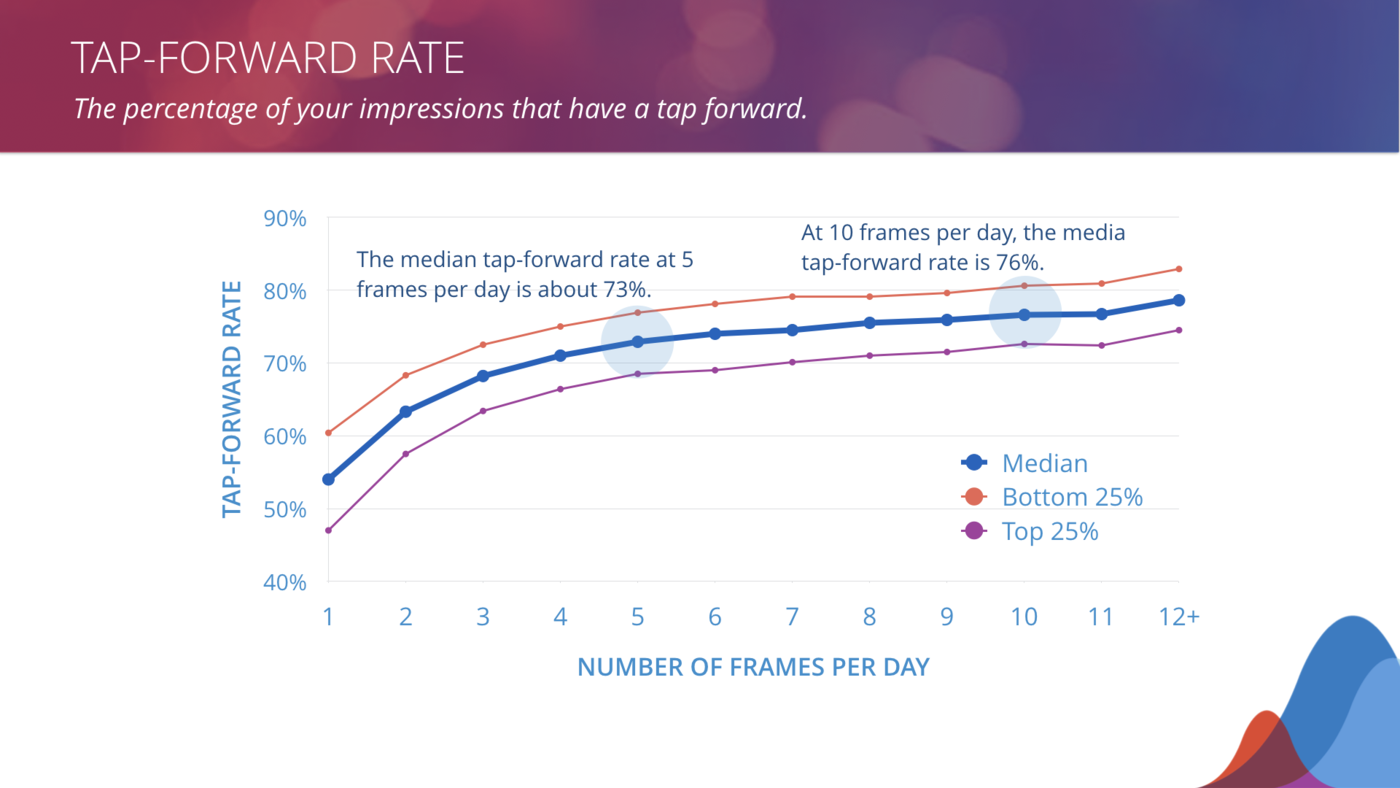
Tap-forward rate benchmarks
In the graph above, you’ll see that your average tap-forward rate increases as you publish more frames within a day. This makes sense: Instagram Stories are all about bite-sized content, so people are poised to get through them one way or another instead of lingering or commenting on a favorite post in their regular Instagram feed.
Bottom line: Tapping forward isn’t necessarily a bad thing, but it does indicate that the viewer has either seen enough of the content or wasn’t interested in the first place.
Tap-forward rate: image vs. video
We were curious to see if the media type (image vs. video) mattered when measuring tap-forward rate. To no one’s surprise, images received tap-forwards at a higher rate than videos.
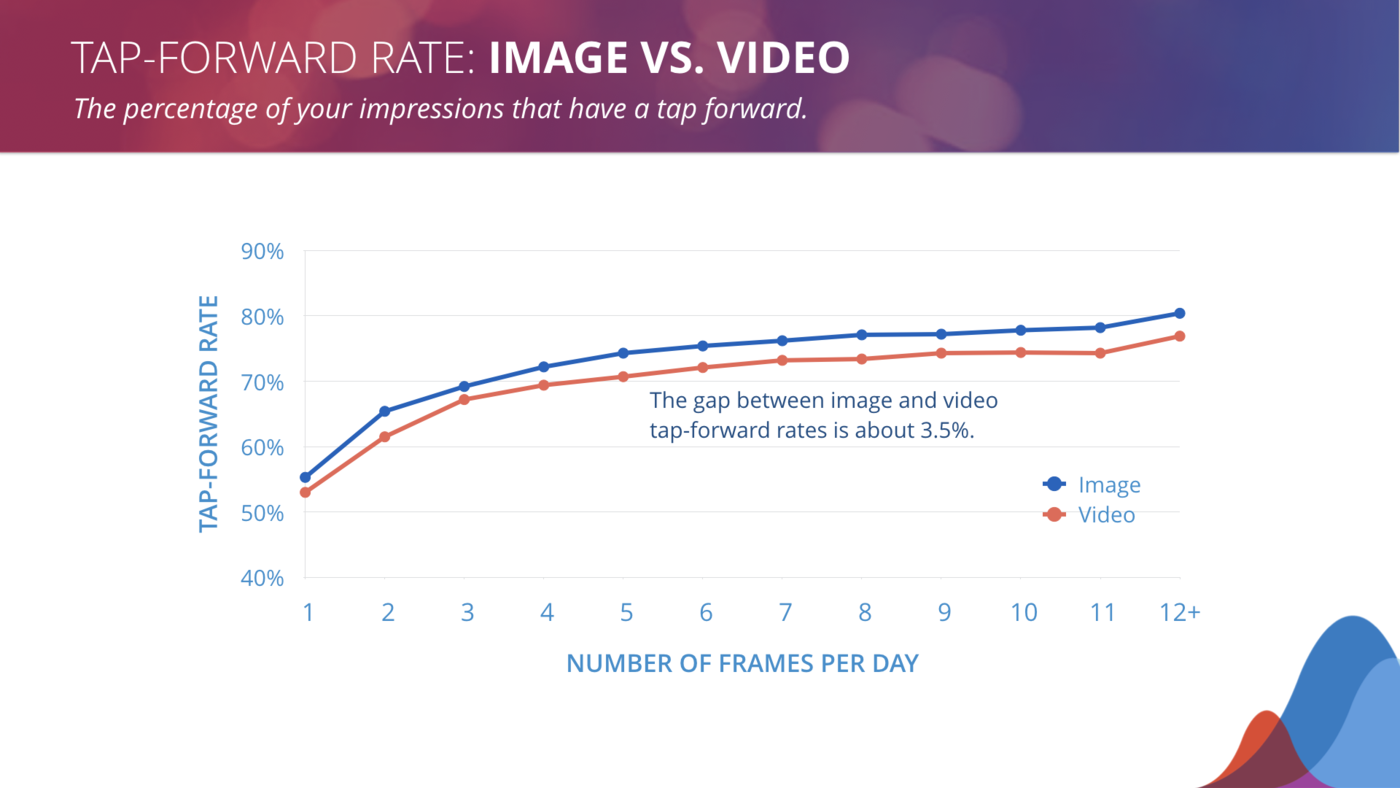
Image vs. video tap-forward rate benchmarks
Overall, images have higher tap forward rates by about 3.5%. As you can see in the graph above, this gap occurs regardless of the number of Stories in a day.
Videos often garner extra attention because they’re more dynamic, but they have another added benefit too when it comes to tap-forwards: a video will stay on screen just for the length of the clip and then move you forward to the next frame, which means a viewer is less likely to tap forward during a video. A static photo will stay on screen for the full five seconds, which might be more than the average viewer needs to get the gist of your frame.
Bottom line: Vary your Instagram Story mediums. Once someone has consumed your image, they’re ready to move on to the next thing, but watching to the end of a video might entice them to stick around.
Tap-back rate
Now that we’ve established the rate at which viewers are moving forwards through Instagram Stories, let’s take a look at the rate at which they move backwards.
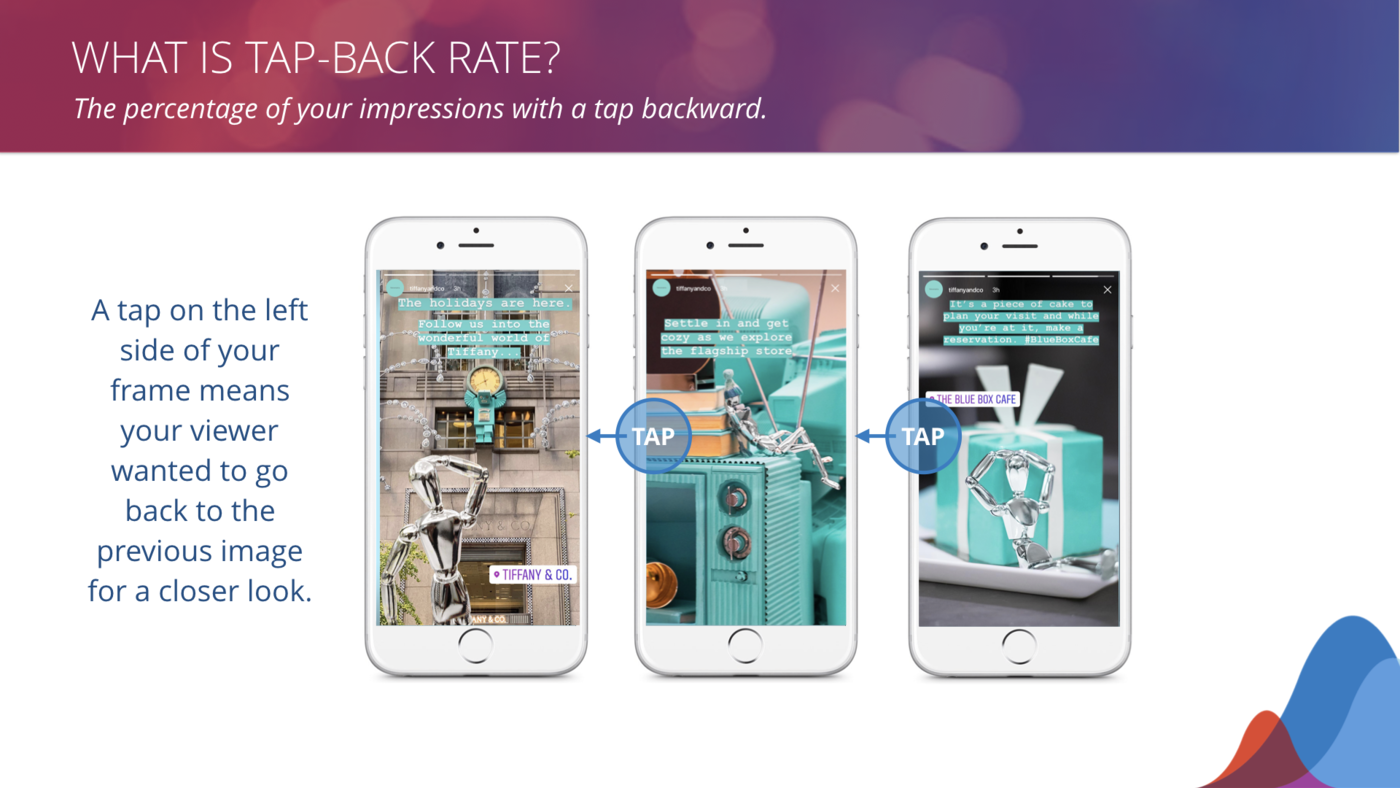
What is tap-back rate?
Tap-back rate is the percentage of your impressions that have a tap backward to see the previous photo or video.
Tap-back rate benchmarks
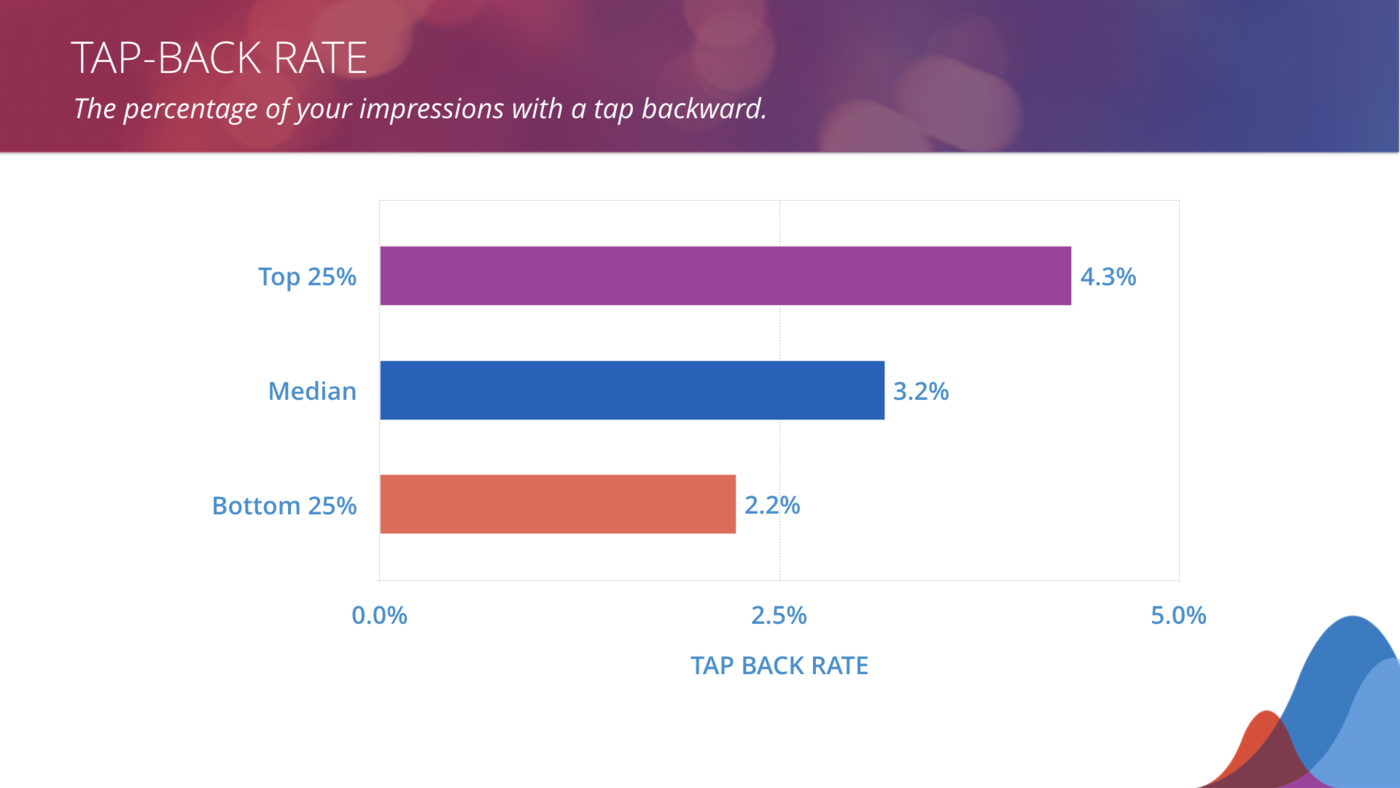
The median tap-back rate on days where there at least two frames is 3.2%, which is pretty darn low (read: tap backs are rare). They can happen because a viewer tapped forward a little too quickly and wanted to go back to see something, or because the frame ended without the viewer getting the full story (so to speak). Tap-backs can also indicate a particularly juicy piece of content that a viewer wanted to spend a little more time with.
We found that the tap-back rate isn’t correlated with the number of frames a handle publishes in a day beyond 1. In other words, tap-back rate is influenced by the substance of your Stories rather than quantity.
Bottom line: Tap-backs are a good indicator of sticky, engaging content in that a viewer was eager to learn more about your Instagram Stories, which is always a good thing.
Reply rate
Replies are the elusive unicorn in Instagram Stories: they don’t come around too often, but when they do, everything is magical.
What is reply rate?
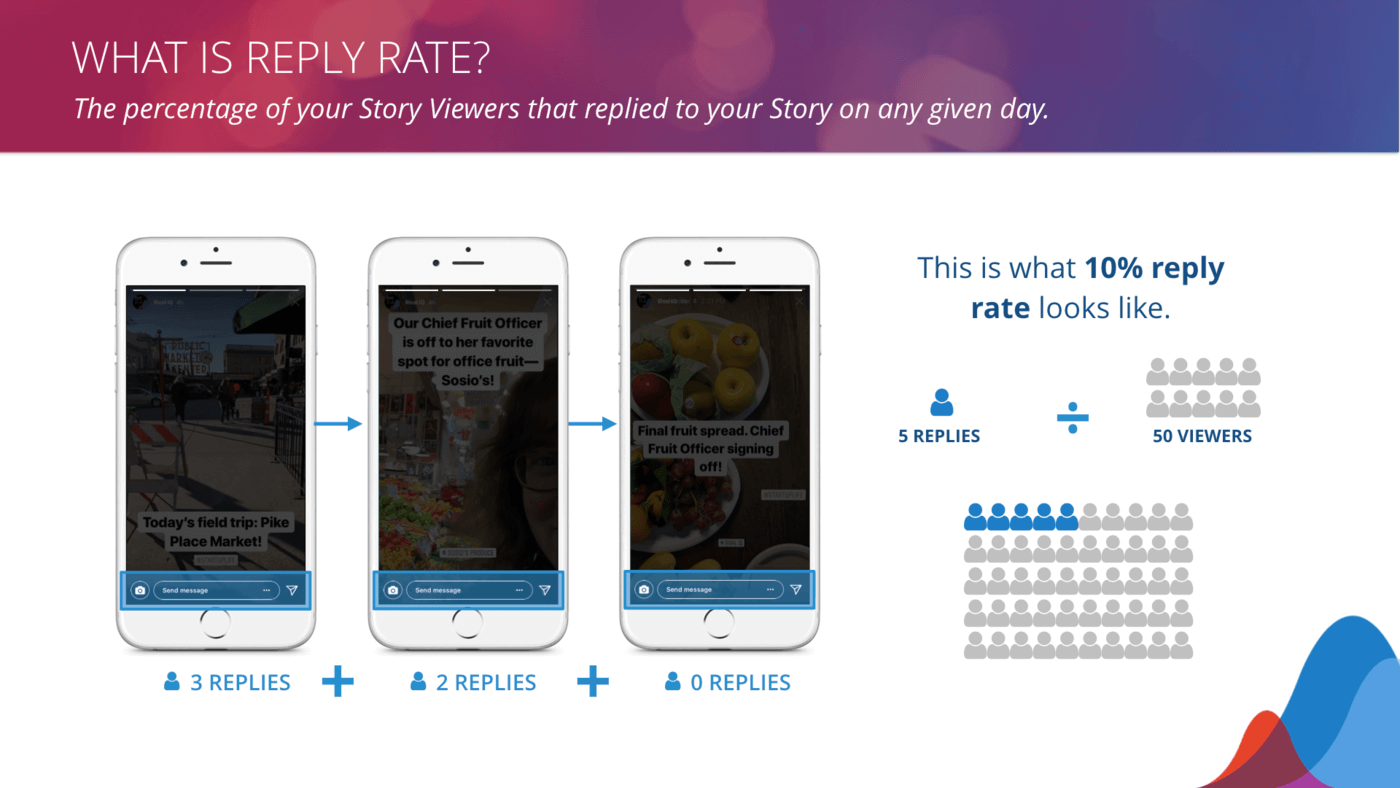
Replies are the only direct way to acknowledge a Story (no likes or comments here), so they’re a clear indication that your content resonated with a viewer.
Reply rate benchmarks
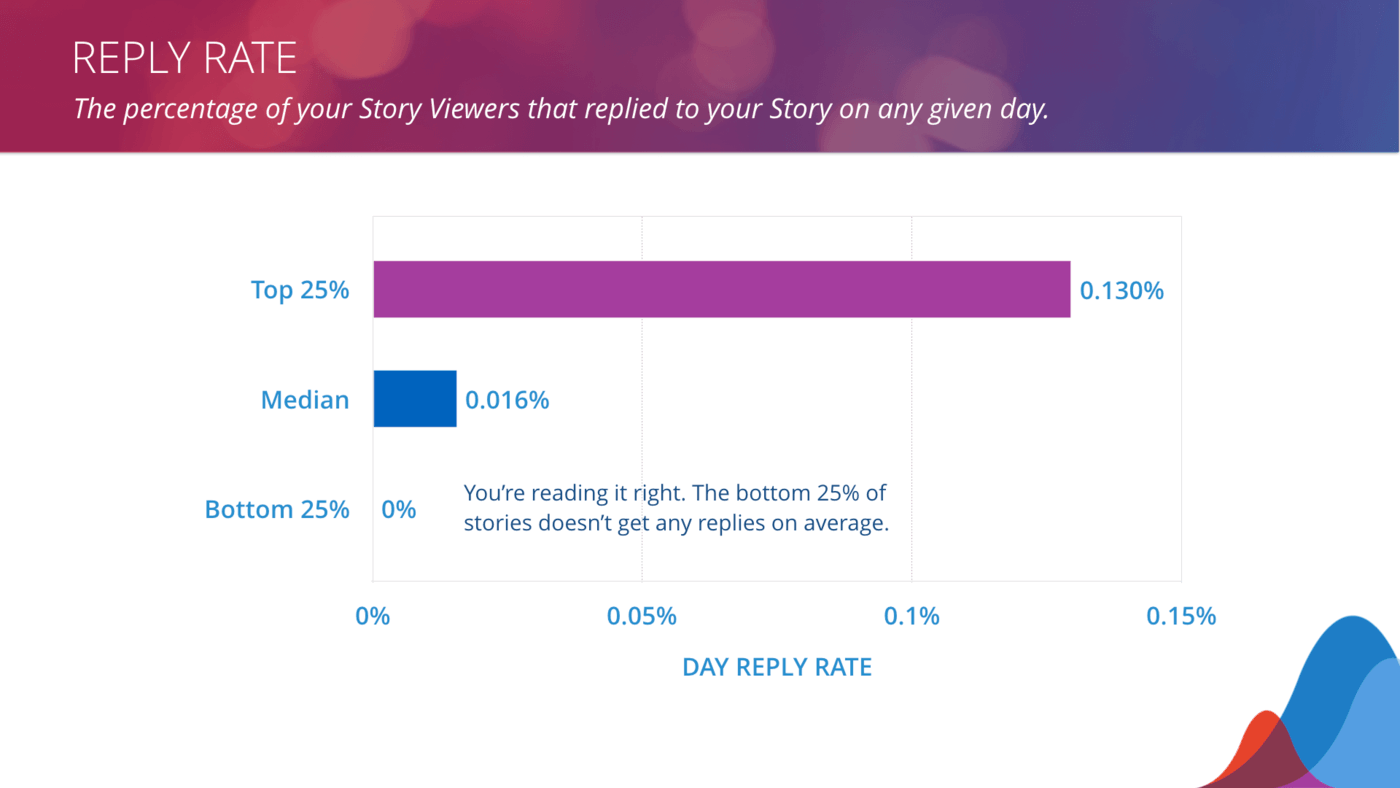
The average brand gets a reply from just 0.00016% of viewers–that’s 1.6 of every 10,000 people that see their Story! Brands leading this pack will see 13 replies for every 10,000 people–still small potatoes.
Replying is a pretty heavyweight action (as opposed to an “applause” action, such as a like or a love), so it’s no surprise these numbers are small. Our analysis shows that users mostly don’t do it–25% of stories that handles publish see no replies at all.
Bottom line: It’s all about the views, not replies. The number of frames published in a day doesn’t impact the number of replies, so focus on quality in the form of interactive, engaging Stories rather than quantity.
Exit rate
Exits are a drag. Since they mean you lose the chance to grab your viewer’s attention, exit rate is an important metric to monitor.
What is exit rate?
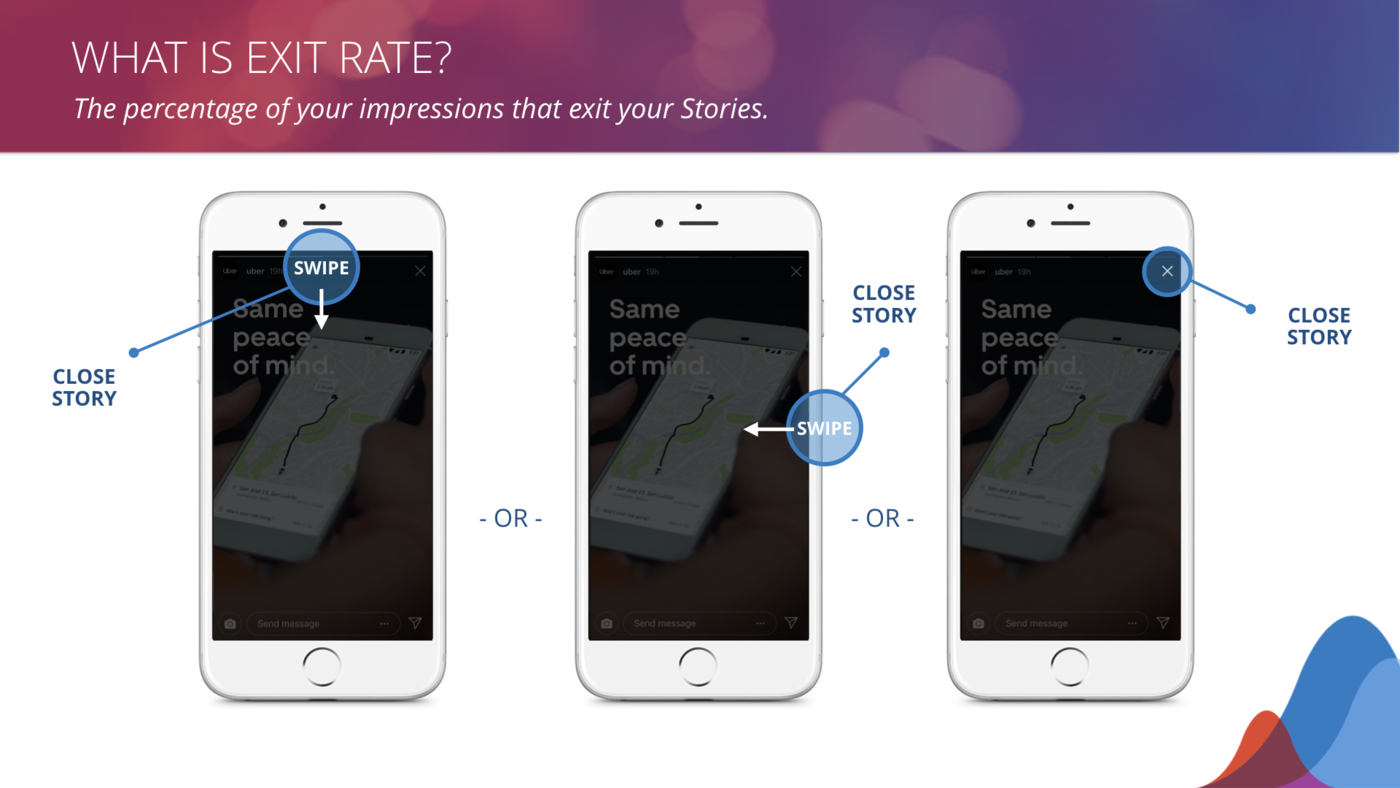
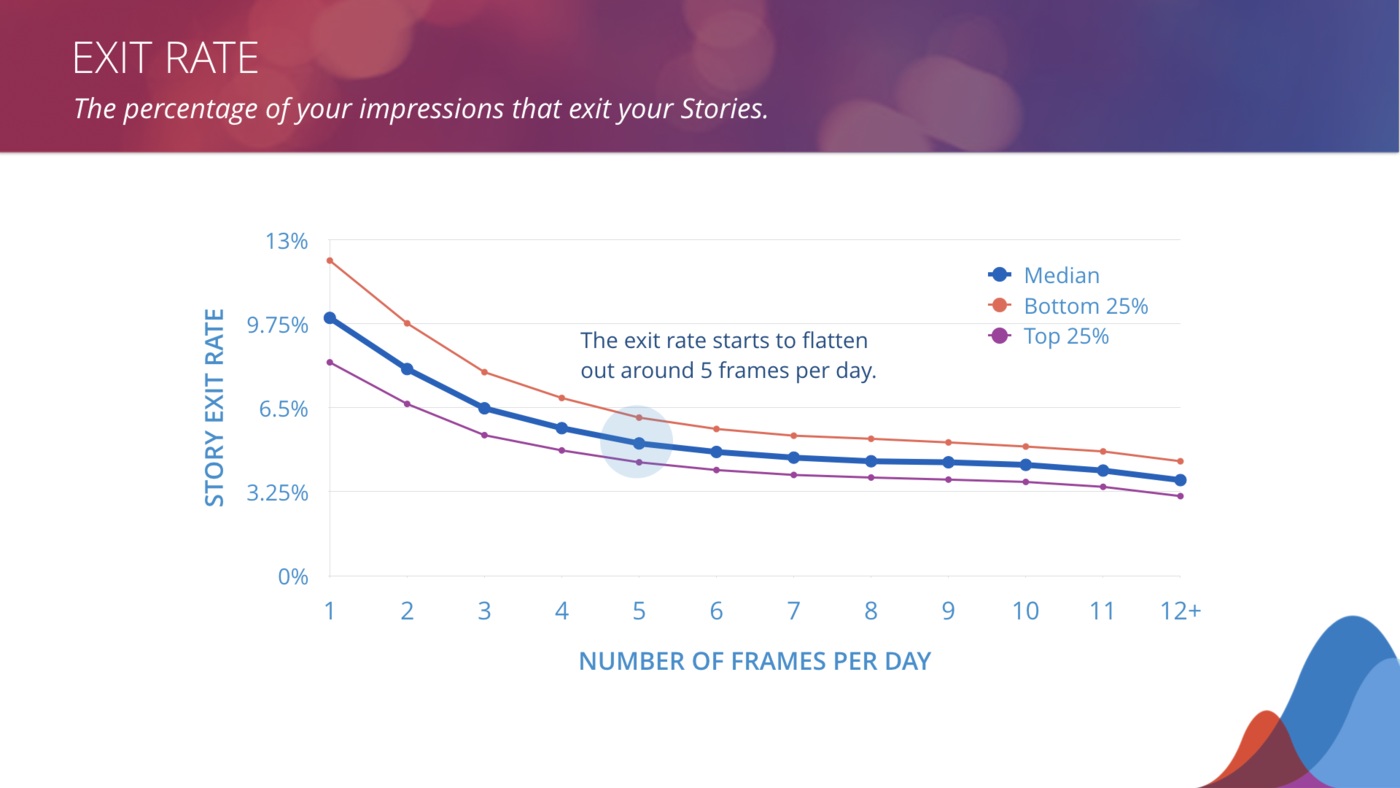
Remember that your Instagram exit rate is the percentage of your impressions that leave your frame by closing out of Stories in Instagram. There are three ways to exit: swiping down, swiping right, or hitting the “X” to return to Instagram’s home base (the post feed).
Exit rate benchmarks
The exit rate starts at around 10% for days with a single frame. The average rate begins to turn the corner at 3 frames per day and starts to flatten out around 5 frames per day. From there, we don’t see much decline on a per-frame basis.
Bottom line: Exit rate is another way to measure retention, and it’s clear that hooking people early is key to getting them to stick around for your entire day.
Methodology
Rival IQ analyzed over 18,000 Instagram stories (that’s 91,000+ frames!) posted between July-September 2018.
We included 538 Instagram handles which had at least one Story published during each month of the time frame, and we only included handles with a reach of at least 100 views for each frame on average. Handles were included only if we had all of their data for the entire time period, regardless of how frequently or infrequently they posted.
These handles reached across multiple industries, including beauty, media, influencers, outdoor/adventure, marketing, and more.
Instagram Story metrics
First things first: let’s define all the metrics we’re going to look at so everyone is on the same page. It’s tough to understand how you’re doing if you’re not exactly sure what your metrics for success are, so we’ve got you covered with a handy glossary.
Frame: A single photo or video posted to your Instagram Story.
Story: The set of frames posted to your Story within a single 24-hour day.
Story Viewers: The number of people who saw your Story on a given day.
Impressions: The total number of views of a frame in your Story.
Reach: The total number of unique people that saw a frame in your Story.
Engagement: Measurable interaction on Instagram Stories and posts, including likes, comments, replies, and shares.
Retention Rate: The percentage of your Story Viewers on any given day that see all your frames.
Reach Rate: Your Story Viewers on any given day divided by your follower count, expressed as a percentage.
Post Reach Rate: The reach of a post expressed as a percentage of your followers.
Tap-Forward Rate: The percentage of your impressions that have a tap forward to see the next photo or video.
Tap-Back Rate: The percentage of your impressions that have a tap backward to see the previous photo or video again.
Reply Rate: The percentage of your Story Viewers that replied to your Story on any given day.
Exit Rate: The percentage of your impressions that exit your Stories by swiping right, swiping down, or closing Stories.
Wrapping it up
If there’s one thing we learned researching this study, it’s this: you don’t need to post a lot of frames to make a splash on Instagram Stories.
If you aren’t yet posting Instagram Stories, try to put 2-3 eye-catching frames up consistently for a new way to engage your followers–once you’ve got your followers’ attention, they tend to stick around.
If you’re trying to put up tons of Stories, focus on high-quality, engaging frames that might tempt your followers into the elusive reply, or even a vote or quick reaction. And if you’ve got great content, the sky’s the limit for numbers of frames per day–your most engaged fans will stick around for all of it.
Most of all, we hope these benchmarks help demystify your Instagram Stories analytics so you can conquer this growing trend ?.
And, if you’re ready to see how you measure up, download a copy of this report that you can consult anytime. Or, start a free Rival IQ trial to help you make sense and do more with your Instagram Stories data.

The definitive guide to all things Instagram Stories.
Download the report