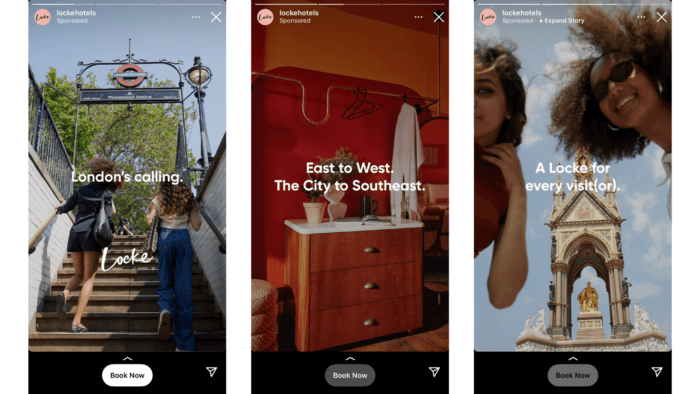
From behind-the-scenes glimpses of a brand’s day-to-day to candid moments shared by influencers, Instagram Stories have become a dynamic and indispensable marketing tool. With a tap, a swipe, and a flick of creativity, you can engage your audience, deliver your message, and leave a lasting impression — all in a span of mere seconds.
Whether you’re a seasoned marketer or just dipping your toes, understanding the ins and outs of Stories metrics is essential for understanding how well your strategy is working. That’s why we’re here to demystify the essential metrics you need to know to amplify your Stories’ performance.
But before we delve into the nitty-gritty, let’s take a moment to understand why keeping a sharp eye on your Instagram Stories analytics matters.
Why Tracking Your Instagram Stories Performance Matters
Tracking your Instagram Stories performance helps you paint the picture of what works and what doesn’t. By peeling back the layers of your Stories’ analytics, you’re letting data do the talking. The numbers give you insight into what resonates with your audience — what content makes them linger, what prompts them to swipe away, and what causes them to “swipe up.”

Dive into the Instagram Stories Benchmark Report and see how you stack up.
Download the report hereWhen you’ve got the performance data on your side, you’re not just guessing at creating content. Data-driven decisions let you refine your approach, experiment with new ideas, and fine-tune your content game to perfection.
Additionally, tracking your Stories’ performance over time lets you uncover trends and patterns that you wouldn’t spot with a quick glance. You’ll see what works for the long term as you learn from past wins and losses and craft a strategy that’s receptive to change and growth.
Ready to dive deeper? Let’s break down the key metrics that’ll turn you into an Instagram Stories pro.
Essential Metrics for Instagram Stories Analytics
From reach and impressions to taps forward and exits, understanding these metrics will empower you to craft Stories that truly resonate.
Accounts Reached
Accounts reached is a key Instagram Stories metric that sheds light on the number of unique users who have seen your Story. This metric is gold when it comes to gauging your content’s reach and popularity.
Followers vs. Non-followers
Diving deeper, you can also study the ratio of followers versus non-followers that you’ve reached.
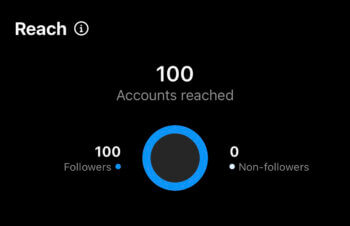
A high ratio of non-followers typically suggests that your content has a broader appeal, attracting users beyond those that follow you. On the other hand, a higher ratio of followers may mean that your content resonates deeply with your existing fan base.
Keeping an eye on this ratio can help you tailor your content to strike a balance between engaging your current followers and attracting new ones.
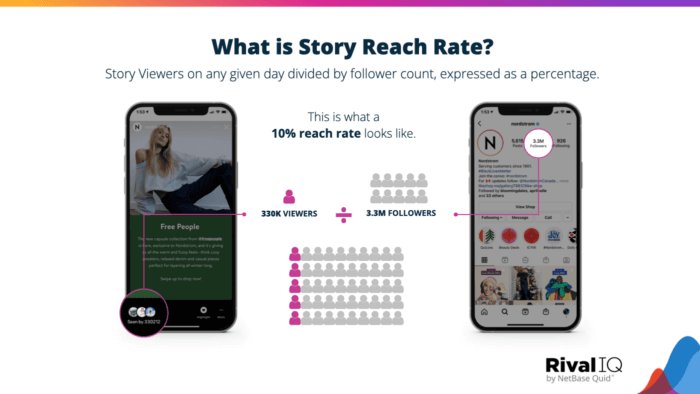
Reach Rate
Your reach rate measures the percentage of your followers who have seen your Instagram Story. It gives you an idea of your Story’s visibility among your followers and beyond.
To calculate your reach rate, divide the number of unique accounts that have viewed your Story by your total follower count and multiply by 100.
Retention Rate
Your retention rate is the percentage of viewers who continue watching your Story after each individual frame in a given period. It’s calculated by dividing the number of viewers at the end of your Story by the number of viewers at the beginning, then multiplying by 100.
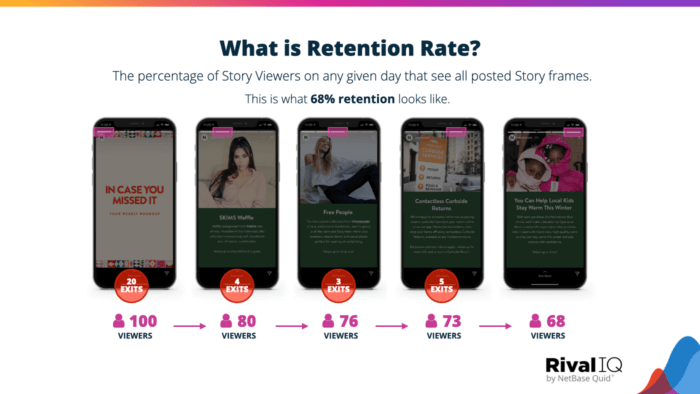
This metric helps you understand whether your content is appealing enough to keep viewers hooked until the end, with a 100% retention rate meaning that everyone who viewed your first Story continued viewing until your last Story. In other words, the higher the retention rate, the more engaging and relevant your content is.
Impressions
Impressions refer to the total number of times your Story was viewed, including repeat views from the same user. This metric is your window into how frequently your content is being seen, offering a gauge of the overall visibility and reach of your content.
When analyzed in comparison to your follower count or the number of accounts reached, a Story’s impressions can also help you understand the virality and shareability of your content. For instance, an impression count that’s greater than the number of accounts reached suggests that your Story is being revisited, reflecting its impact beyond initial views.
Accounts Engaged
The accounts engaged metric goes a step further by calculating how many unique accounts interacted with your Story. According to how Instagram reports it, a Story interaction includes only shares and replies.
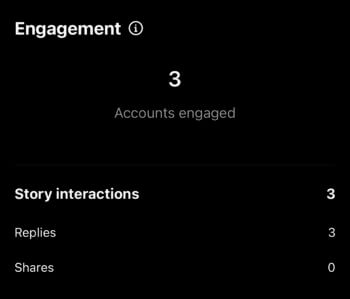
Compare your accounts engaged to accounts reached to better understand how well your content resonates with those who have seen your Story. Higher engagement rates suggest compelling content that strikes a chord with your target audience.
Story Interactions
Instagram calculates Story interactions as the total number of replies and shares for a Story.
Replies reflect the number of direct messages received in response to your Stories, indicating deeper engagement and interaction. The metric includes both text replies, as well as “quick reaction” replies where an emoji is sent. Shares refer to how many users found your content compelling enough to share with their own followers, expanding your reach.
Tracking both metrics tells you how well your content resonates and its potential for going viral. Remember, though, it’s not just about the sheer number but the quality and sentiment behind those interactions. Be sure to review whether people are replying and sharing for positive or negative reasons.
Clicks and Sticker Taps
Understanding clicks and sticker taps can unveil crucial insights into your audience’s engagement. These metrics provide a window into how effectively your stories drive action based on the external links and stickers you use.
Product button clicks
This metric tracks the number of times viewers not only visited a product page through your Story but also took the additional step of tapping the product button. It’s a direct indicator of purchase intent and interest in the showcased product.
High product button click rates suggest that your Story successfully enticed users to explore the product further, possibly leading to conversions.
Link clicks
Measuring link clicks reveals how many users swiped up on your Story’s link, as displayed below.
Whether it’s directing them to a blog post, landing page, or website, this metric gauges the effectiveness of your call to action. The more clicks, the more engaged your audience is with the content you’re leading them to.
Sticker taps
Stickers enhance interactivity. Counting the taps on location, hashtag, mention, or product stickers helps you understand what elements of your story are capturing viewers’ attention.

Tracking this metric guides you in tailoring sticker usage to optimize engagement. More taps on location stickers, for instance, could indicate a strong local following or interest in specific areas.
Navigation
Understanding how viewers navigate through your Stories offers insights into user behavior and content effectiveness. This is where the Navigation metric comes in, which reports the total number of actions taken from your Story and is made up of the number of four different actions: forward taps, back taps, next Story taps, and exit taps.
- Forward: The number of taps to see the next photo or video in your Story.
- Back: The number of taps to see the previous photo or video in your Story.
- Next Story: The number of taps to the next account’s Story.
- Exited: The number of taps to leave your Story.
Keeping an eye on these metrics helps you tailor content for a smoother journey where viewers keep tapping through. For instance, does a particular Story have a high number of exits? Consider what elements may be causing them to leave your Story and refine your content strategy accordingly.
Profile Activity
Profile activity metrics gauge the impact of your Stories on your Instagram profile’s visibility and include profile visits and follows.
- Profile visits measure how many users visited your profile from a Story, indicating interest in exploring more about you or your brand.
- Follows reflect the number of new followers gained from your Stories.
These metrics help you assess the effectiveness of your content in driving user curiosity and building a dedicated audience, allowing you to optimize your content strategy to encourage profile visits and new followers.
Likes
Likes are a basic yet vital metric, displaying how many viewers found your content appealing enough to “heart” it.
While not as robust as other engagement metrics, likes offer a quick gauge of overall appreciation. This instant feedback helps you understand which types of content resonate with viewers, allowing you to tailor your Stories to your audience’s preferences and interests.
Navigating Instagram Stories Analytics Natively
Unlocking the power of Instagram Stories analytics is key to understanding your content’s performance and audience engagement. Fortunately, Instagram offers built-in analytics to help you delve into these insights. Here’s a simple guide to accessing these metrics:
- Navigate to Your Profile. Open the Instagram app and head to your profile by tapping your profile picture in the bottom right corner.
- Access Insights. In your profile, look for the hamburger menu (three horizontal lines) at the top-right corner and tap on it. Select “Insights.” If it’s available, you can also tap on the button titled “Professional dashboard” located right below your profile bio.
- Select Content. Under the “Content You Shared” section, choose “Stories.” Here, you’ll find a detailed breakdown of your recent Stories activity.
- Analyze Performance. Instagram’s native insights report data for many of the metrics above, from accounts reached to your profile activity. Note, though, that the number of likes a Story gets can only be found when you view the live or archived Story.
While native analytics are a great starting point, using a third-party social analytics tool like Rival IQ can take your insights to the next level. Such tools offer a consolidated view of data from all your social media accounts, reporting on metrics, trends, and more. This unified approach saves time, allows for better comparison, and empowers data-driven decisions.
Elevating Your Insights with Rival IQ
Whether you’re a major brand or small business, Rival IQ offers a comprehensive solution to track your Instagram Stories’ performance, while also shedding light on your standing across various other social platforms. By reporting data from other social channels, the Rival IQ platform helps you to grasp the bigger picture and make informed decisions.
Our platform also goes beyond the basics by taking what Instagram reports and using them to calculate advanced metrics for you, such as reach rate, retention rate, tap-back rate, and reply rate. These metrics offer a more detailed understanding of your audience engagement, allowing you to extract actionable insights for your strategy moving forward
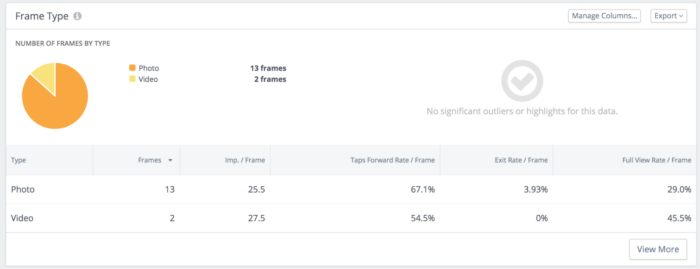
For example, the Frame Type panel makes it easy to compare how your audience engages with photo frames versus video frames. Do your viewers view your full Stories more when you use photos or videos? Which media type tends to trigger a higher exit rate? With this panel, you can skip the extensive calculations and make your conclusions with a quick glance.
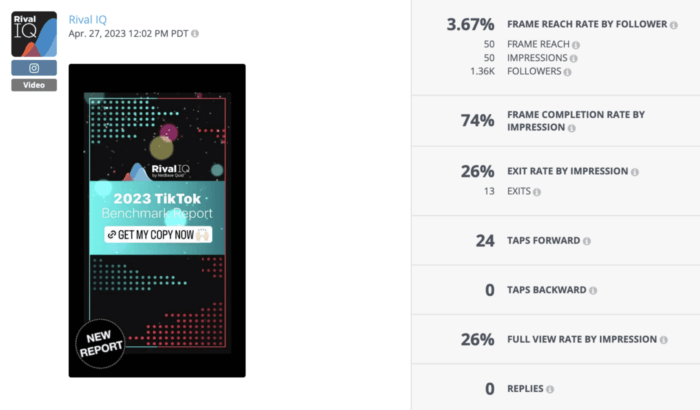
You can also study the details of a particular frame of your Story and learn more about how effective that specific piece of content was. Was its exit rate — 26% for the post below — similar to the exit rates of your other frames? Or was there a stark jump in exits, suggesting there was an element that repelled viewers to leave?
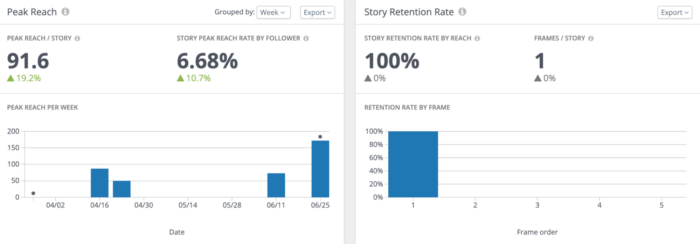
The metrics reported also empower you to benchmark your performance against other brands more accurately. For example, with your reach rate and retention rate clearly displayed, as seen below, you can swiftly see how you stack up against the competition by comparing your rates to others. Want to know if your Story reach is up to par with others? Compare your reach rate by follower to the reach rate typically achieved by brands with similar audience sizes.
You can check out our 2023 Instagram Stories Benchmark Report for a run-down of the engagement numbers from all kinds of industries. With over 72K Instagram Stories analyzed, it’s your ultimate guide to the stats you’ll need to evaluate your Story performance against other brands.
Wrapping It Up
In conclusion, diving into Instagram Stories analytics unveils valuable insights to supercharge your brand’s performance. The story of your content’s performance is told through data — each tap, swipe, and view adds to its narrative. Get into the numbers and you’ll discover insights that’ll help you craft compelling Stories that captivate your audience.