“How do I stack up against my competitors?”
We hear this question all the time from our customers. The data-driven marketer doesn’t just want to know how her post is doing; she wants to know how it’s doing against similar posts by her competitors.
This report gives you the data you need to truly benchmark your social media performance against your industry. After all, we know from experience that with great data comes great social strategy (and bigger marketing budgets!).
You’ll find the following inside this report:
The Benchmarks:
The most important metrics across 10 top industries from January-December 2017: Fashion, Food & Beverages, Health & Beauty, Higher Ed, Home Decor, Hotels & Resorts, Influencers, Media, Nonprofits, and Sports Teams.
Industry-specific sections:
Each section dives into the metrics that matter across Facebook, Twitter, and Instagram. From hashtags to post media types, it’s here. Oh yeah, and we go beyond the numbers to provide insights you can start using today to influence your social strategy.
September 2018 Update: We did a month-by-month breakdown of the data behind this report in our newest piece of research. There’s even a webinar, in case you’re interested.
Read on, savvy marketer.
Methodology
To spot trends and identify benchmarks, we focused our search on the top three social channels for brands: Facebook, Instagram, and Twitter. We used Rival IQ to dig deep into engagement rates, posting frequency, post types, and hashtags.
We define engagement as measurable interaction on social media posts, including likes, comments, favorites, retweets, shares, and reactions. Engagement rate is calculated based on all these interactions divided by total follower count.
We expanded our list this year to 10 industries (industries with an * are new this year).
- Fashion
- Food & Beverages
- Health & Beauty
- Higher Ed
- Home Decor*
- Hotels & Resorts*
- Influencers*
- Media
- Nonprofits
- Sports Teams*
Within this report, we provide a representative sample of national and international companies in each industry by selecting 150 companies at random from each industry from our database of over 150,000 companies. Companies selected had active presences on Facebook, Instagram, and Twitter as of January 2017, and had Facebook fan counts between 25,000 and 1 million as of the same date.
We used median performance from the companies selected for each industry to compile the data for this report.
The All-Industry Benchmarks
There are tons of ways to slice and dice your social performance, but benchmarking helps you go beyond the vanity metrics. With the right data, you can figure out if you’re succeeding or failing against your strategy and your competitors. Why? Because benchmarks are relative.
Anyone can have a million Facebook fans or Twitter followers, but you’re only reaching those fans successfully if you’re doing it better than your competitors occupying the same airspace. With benchmarking, you’ll establish the context you need to see how your industry performs, for an accurate understanding of how you measure up.
This report features a wide range of companies in each industry, from the juggernauts to those just starting out, to give you a true sense of how your industry performs.
Hungry for more benchmarking? We have three ways to help you get more!
- Use our free live social media benchmarking dashboards to compare up-to-date metrics from every industry featured in this report, including top-performing hashtags and posts, posting frequency, and more. Use these live stats to dig deeper than ever before into how top brands in your industry are performing. (Bonus: if you’re a Rival IQ customer or trial customer, you can pop those stats right into your Rival IQ account for even more comparisons.)
- Use our free head-to-head social media analytics tools to measure yourself against the benchmark averages from this report. They’re really, truly free!
- Use our 2018 Instagram Stories Benchmark Report to help you get a handle on the Stories retention, reach, tap-forwards, and so much more that you should be seeing on Instagram. As comprehensive as this report but with a sole focus on Instagram Stories!

The Metrics That Matter
If social media success were measured on followers or page likes alone, companies with the most resources to buy fans would lead their industries, but that’s rarely the case. The savvy marketer knows a page fan isn’t the same as a paying customer, and that strong engagement is the bridge between the two.
We bet that you already have a great sense of your baseline metrics. This report looks to measure engagement and engagement rate so you can see how you compare to the leading companies in your industry against the metrics that matter most to your bottom line.
This report focuses on the three channels most often used by top brands: Facebook, Twitter, and Instagram. Each section features the following metrics, along with actionable insights you can start using today:
- Posts per day
- Posts per week
- Engagement rate
- Top hashtags by engagement rate
We also focus some report real estate on comparing each industry together, so you can see the types of posting frequency and engagement you can expect across the board.
Need an example of how to use this all-industry section? Maybe you’re tweeting your brains out and still not finding much engagement traction (hello, media!). By viewing Twitter posting frequency across every industry, you can see that’s a particularly crowded channel for companies like yours, and that it might be time to diversify your channels or post types.
All-Industry: Facebook
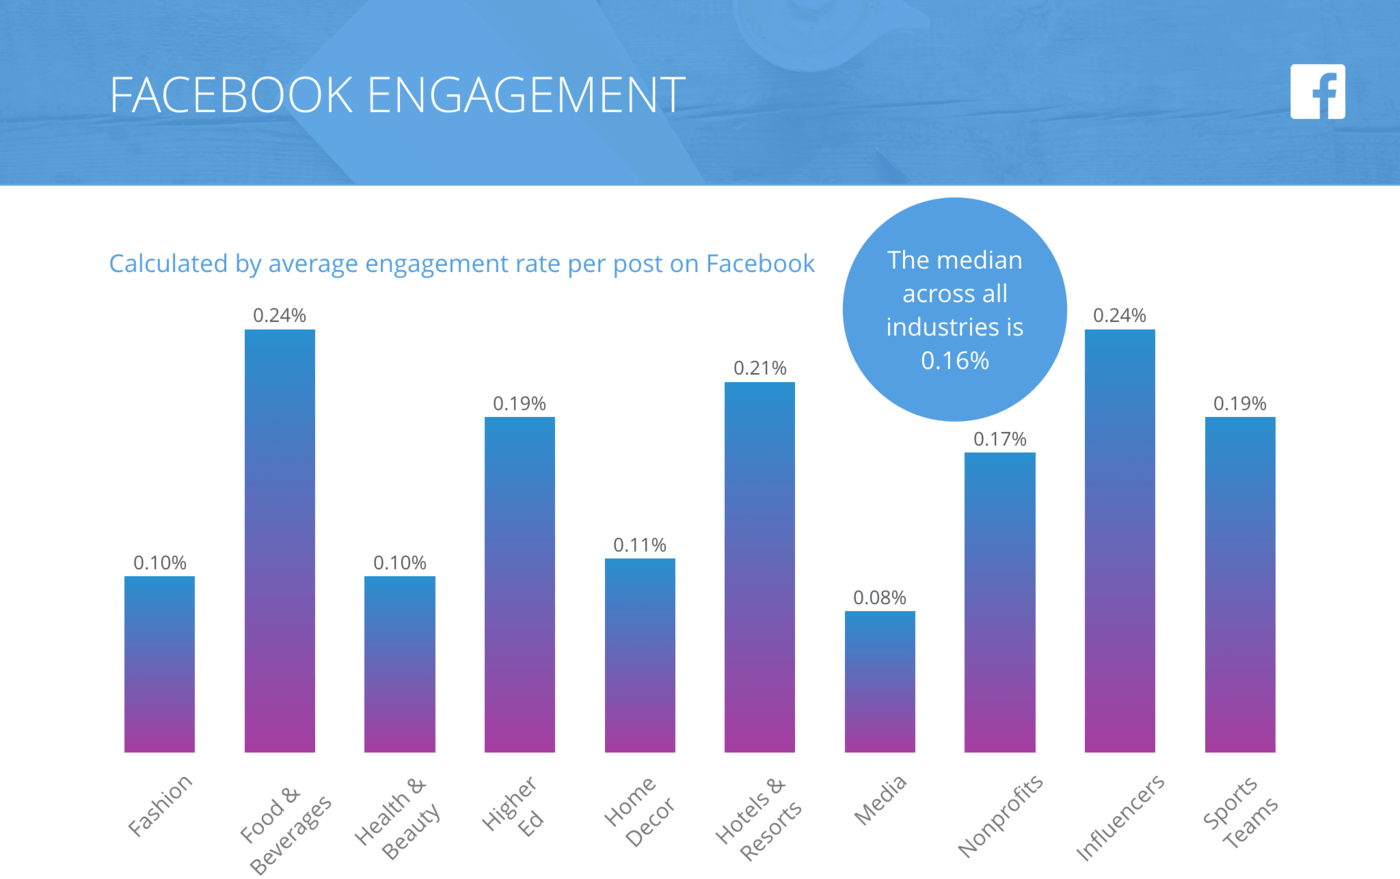
Facebook Engagement Rate per Post, All Industries
Less than two tenths of one percent separate the lowest engagement from the highest engagement rates. All industries included in last year’s study saw a change in engagement rate, but not necessarily a decrease.
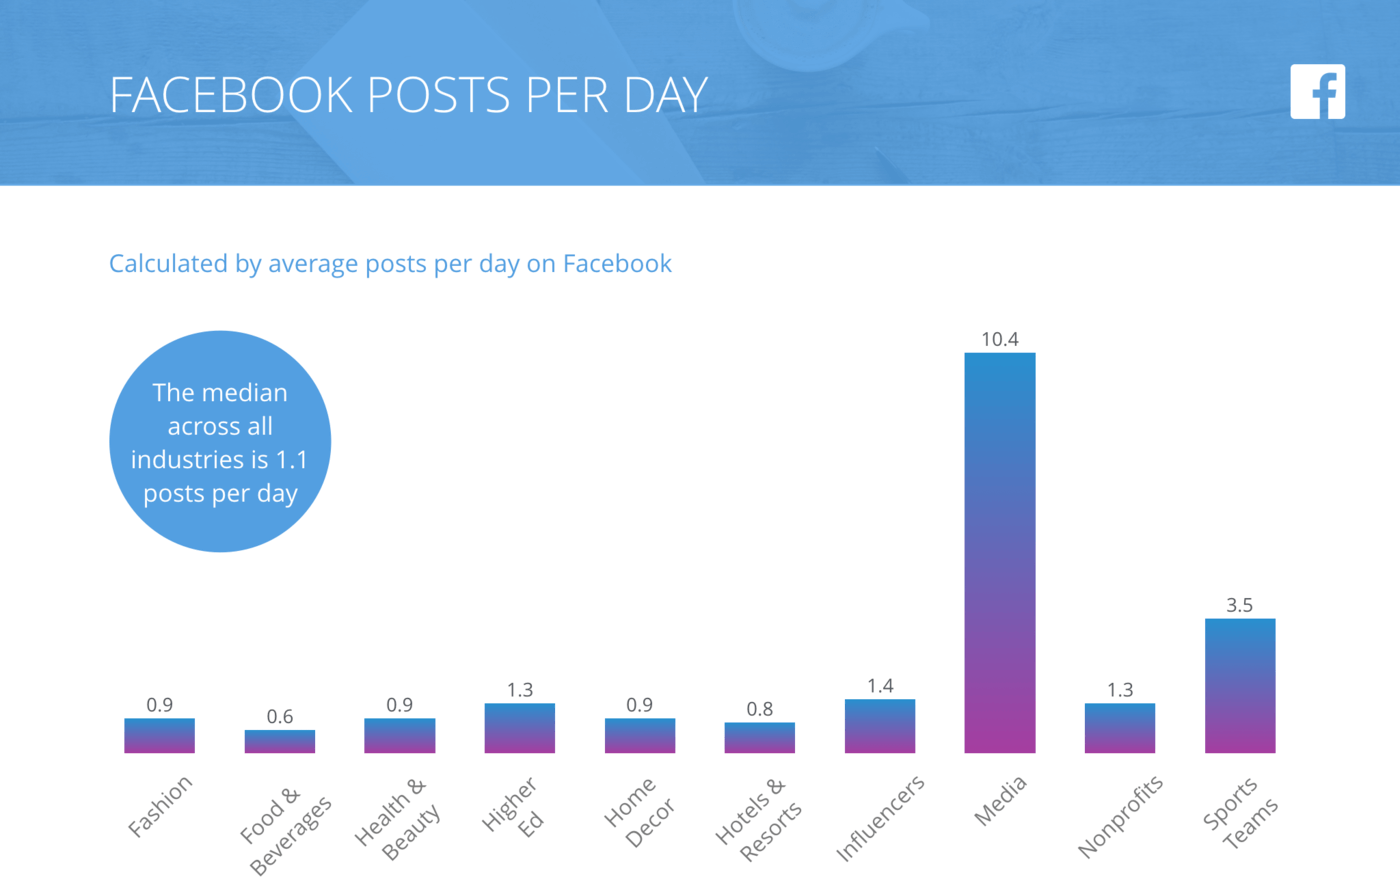
Facebook Posts per Day, All Industries
Without media (a big outlier), the average of about one Facebook post a day may reflect a brand’s reliance on Facebook algorithms. For most industries in last year’s study, the frequency has remained flat.
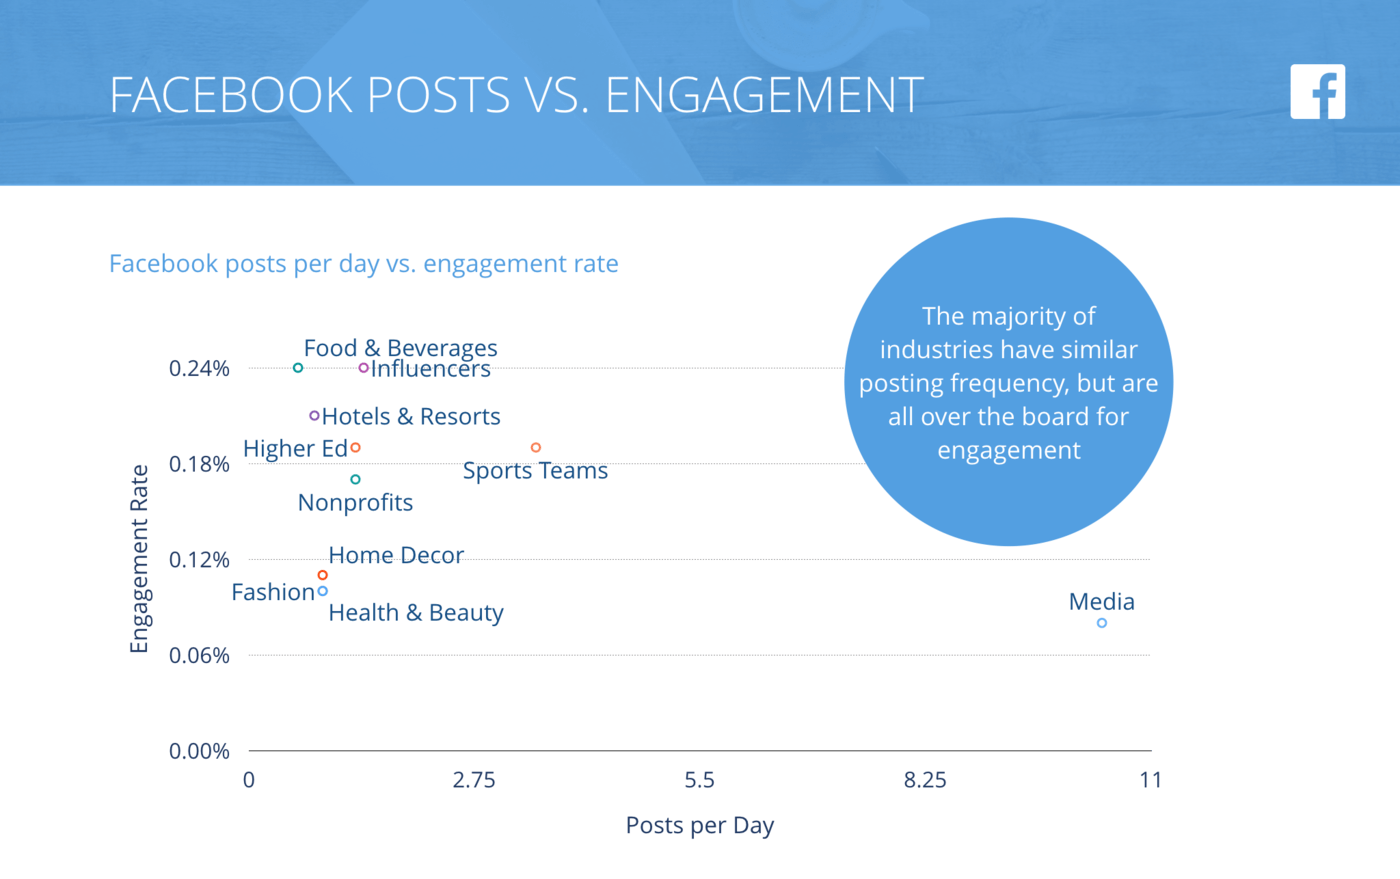
Facebook Posts per Day vs. Engagement Rate per Posts, All Industries
Food & Beverages and Influencers lead, but only by one-hundredth of a percent.
All-Industry: Instagram
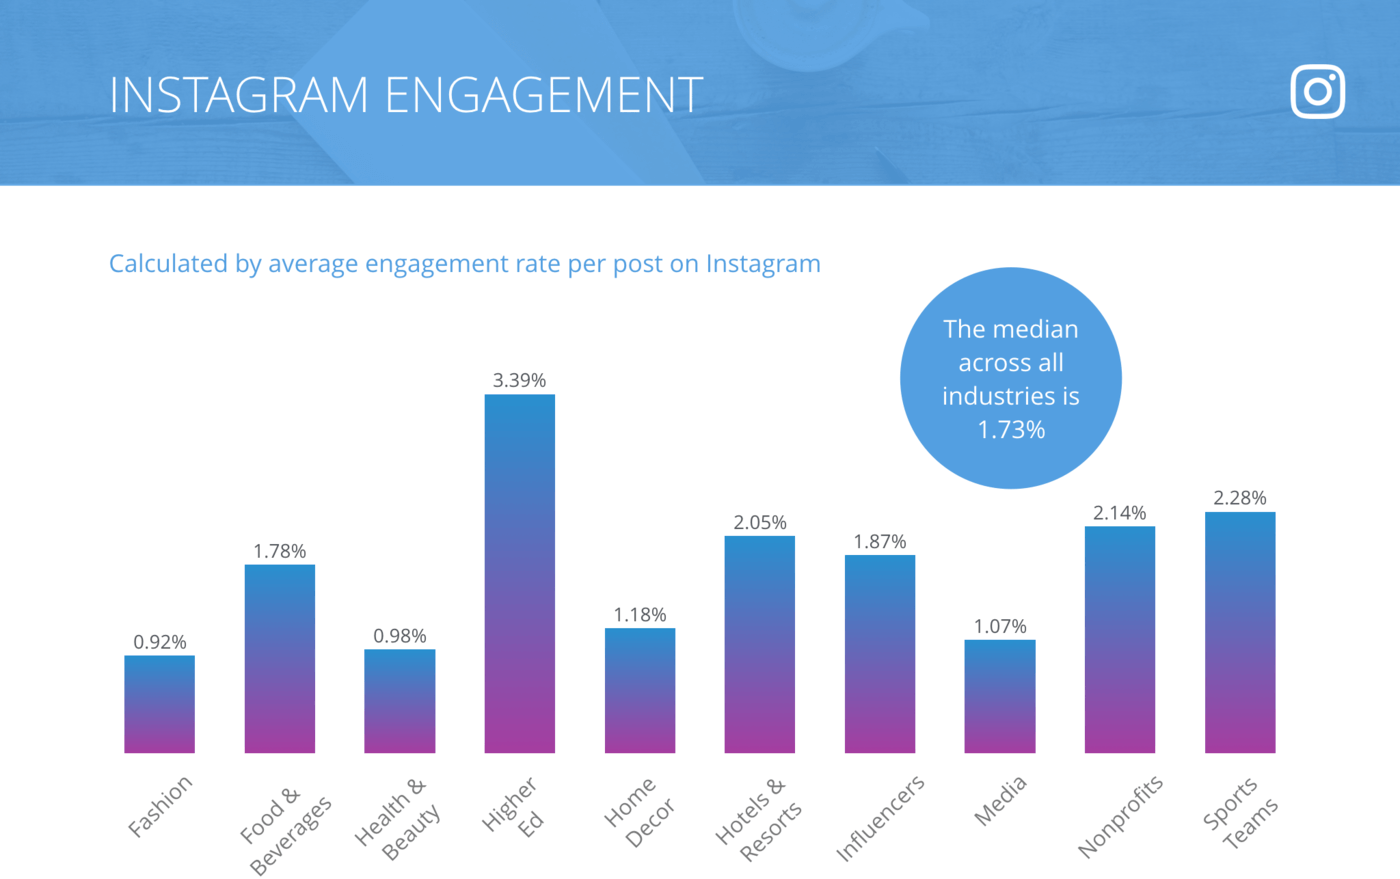
Instagram Engagement Rate per Post, All Industries
Higher Ed outperforms every industry by a wide margin, with highly regarded industries like Fashion and Health & Beauty performing the worst.
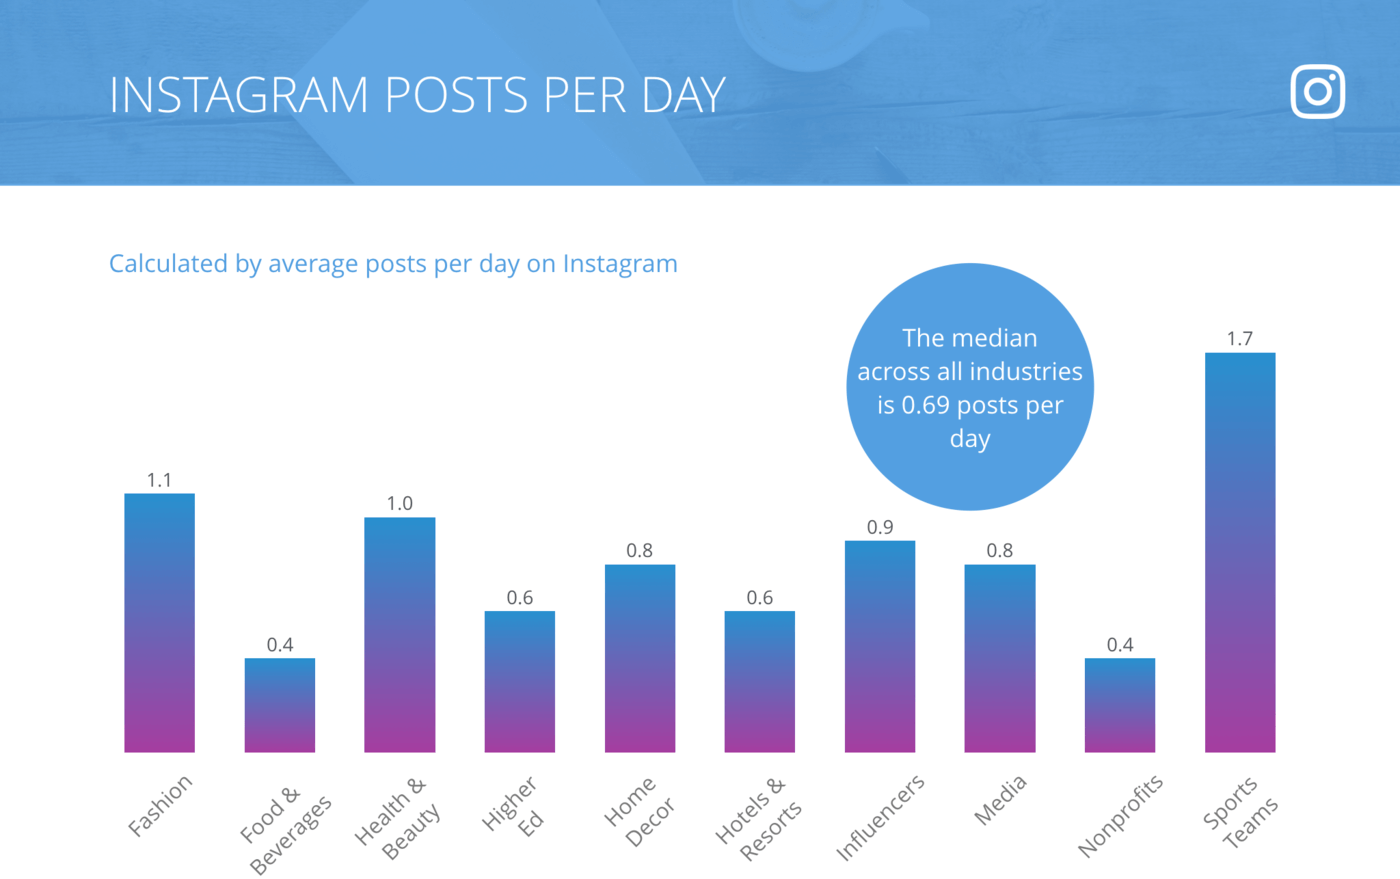
Instagram Posts per Day, All Industries
Industries in this study post as frequently as once a day to every three days. With such wildly different frequencies, dialing into your audience is key.
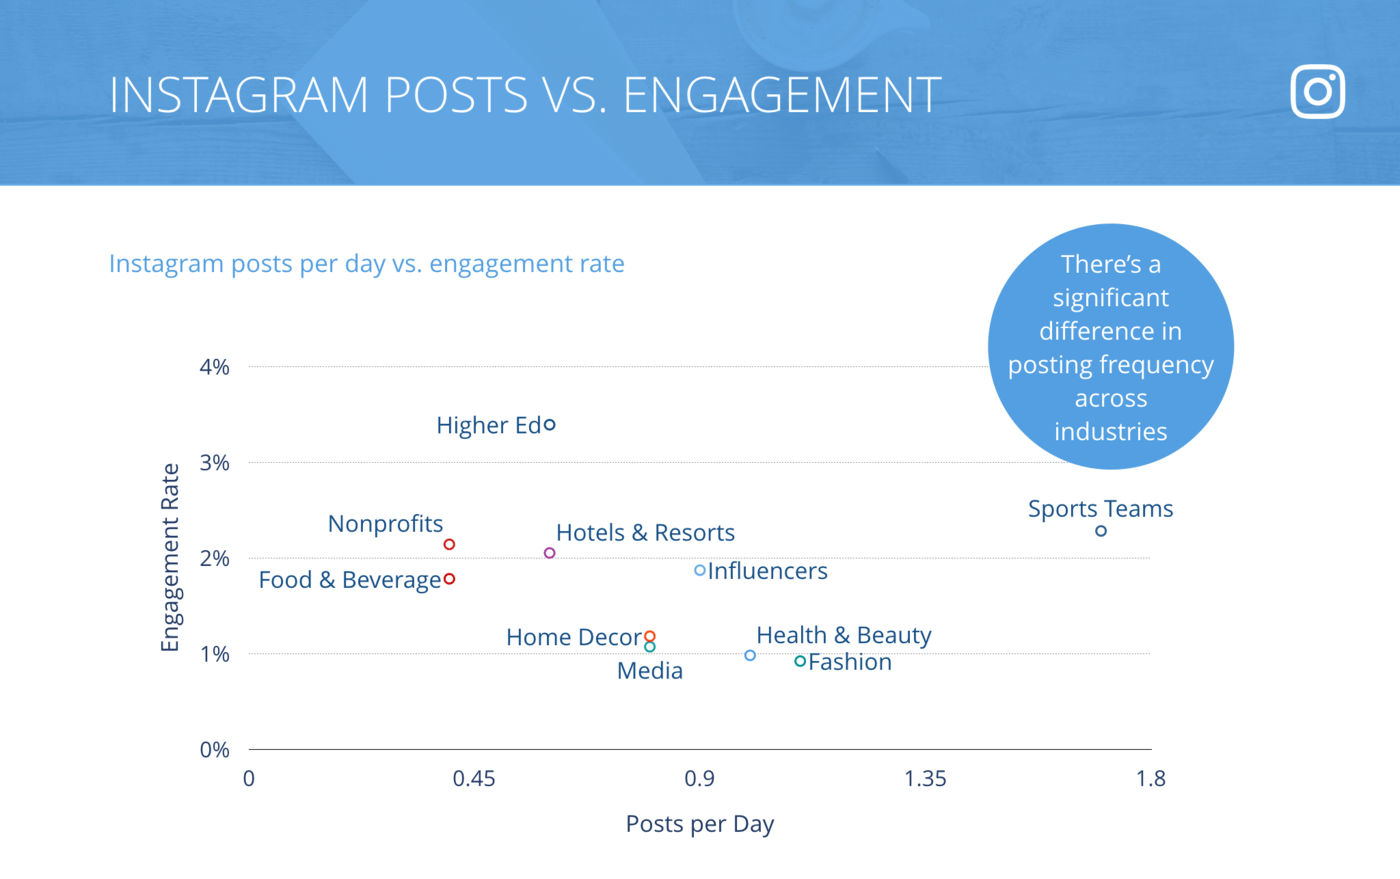
Instagram Posts per Day vs. Engagement Rate per Posts, All Industries
Engagement doesn’t correlate with posting more. Higher Ed’s higher engagement rate may reflect a hyper-targeted and engaged audience.
All-Industry: Twitter
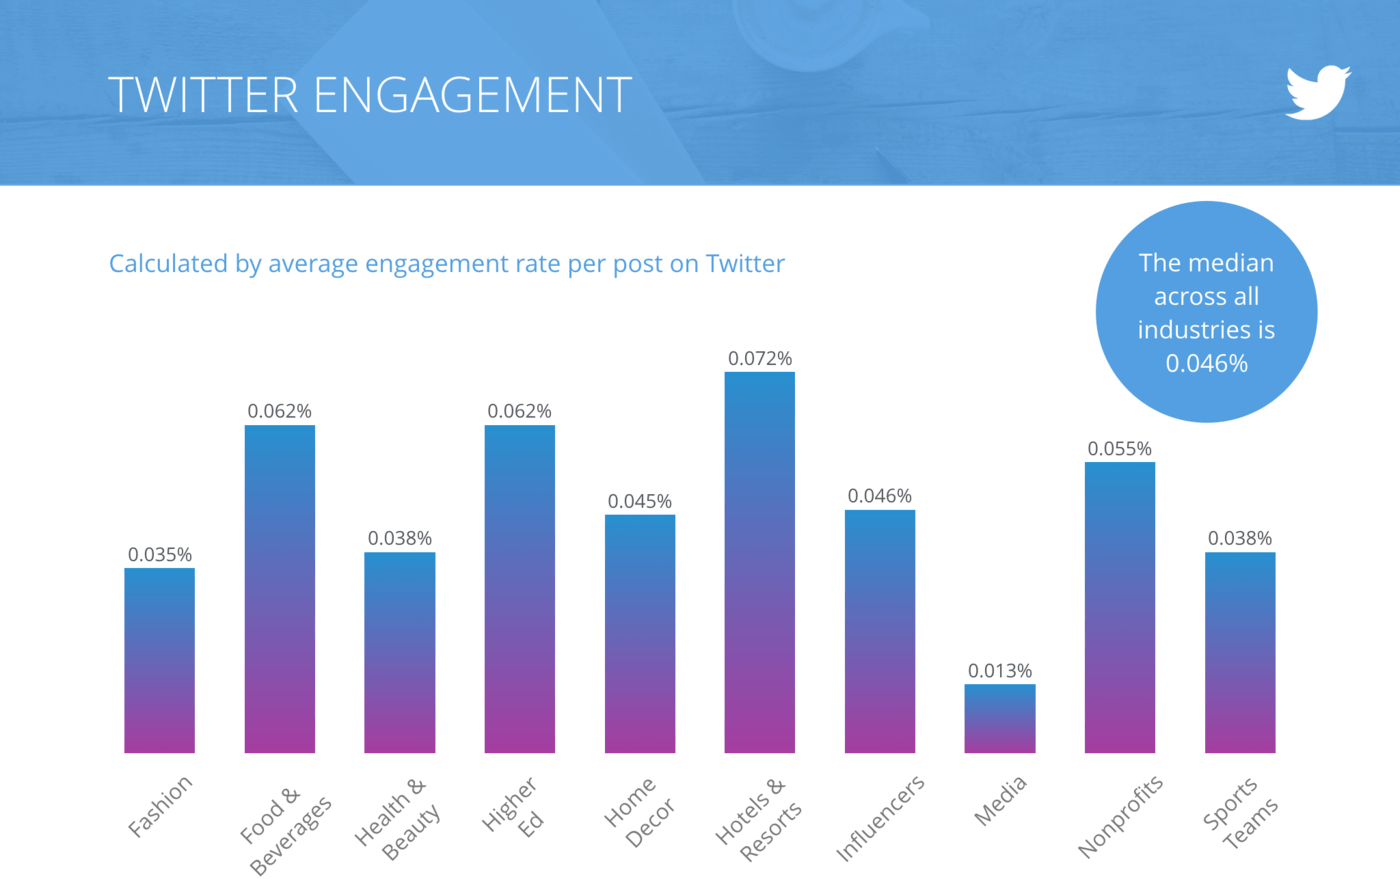
Engagement Rate per Tweet, All Industries
Compared with last year’s Twitter engagement rates, this year’s data is less consistent across industries.
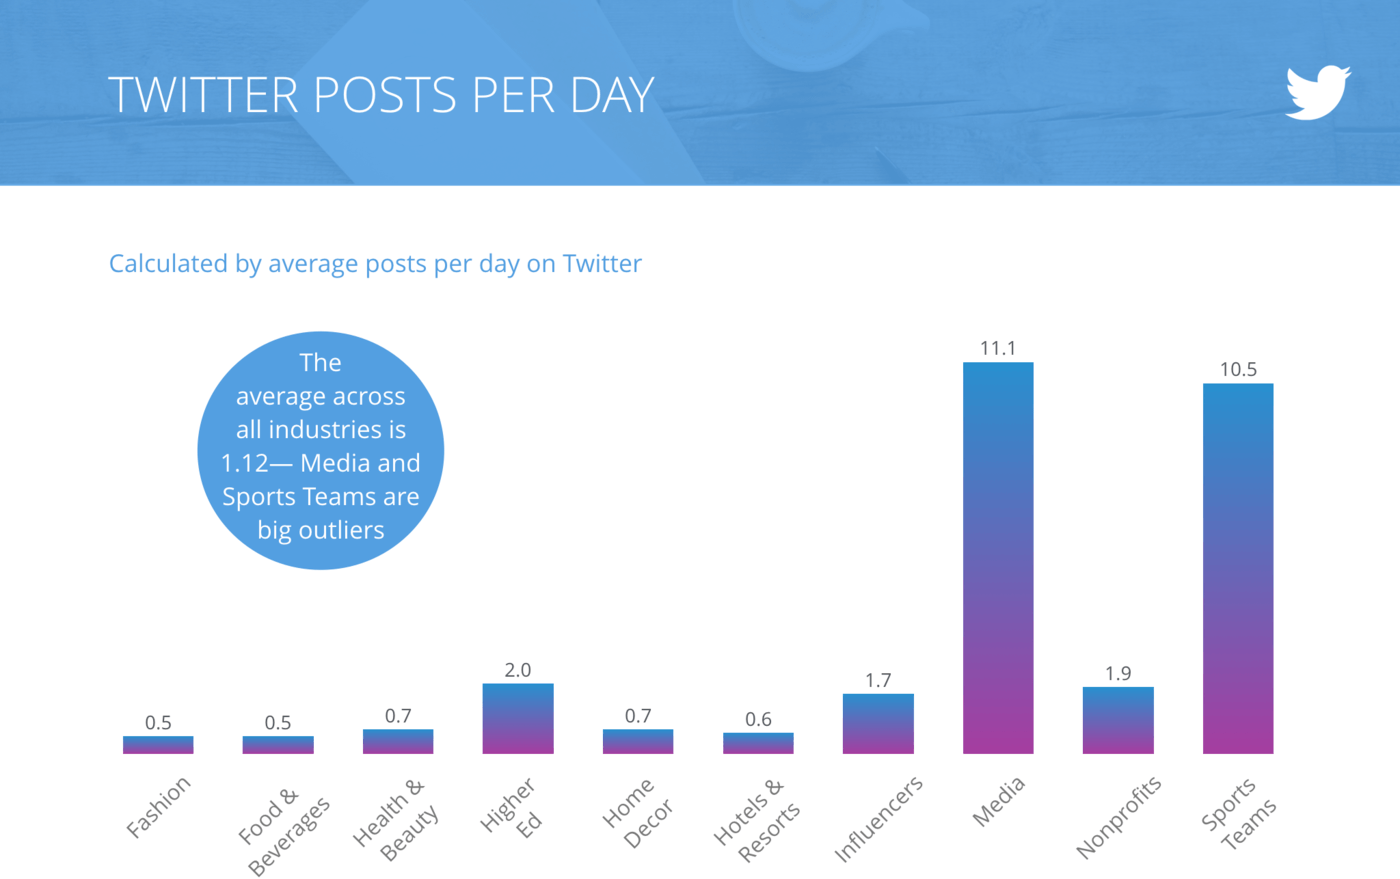
Tweets per Day, All Industries
Industries from last year’s study decreased or remained flat in their frequency with the exception of Media. Given today’s media landscape, this doesn’t surprise us…
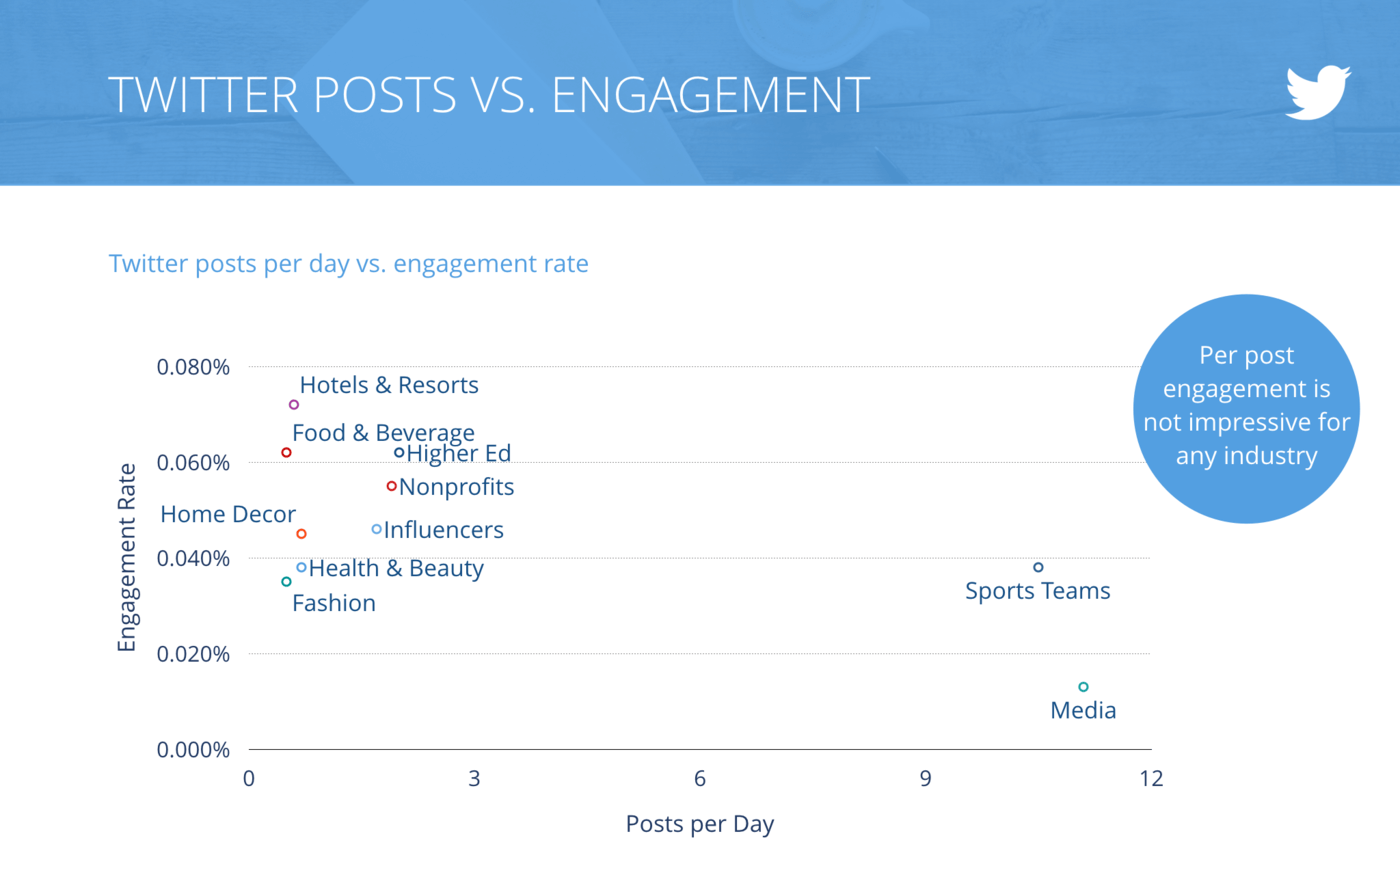
Tweets per Day vs. Engagement Rate per Tweet, All Industries
As is evident in this graph, engagement doesn’t correlate with posting frequency. And the adage that more is better doesn’t prove true on Twitter.
Industry Snapshot: Fashion
For Fashion Brands, our overall take is that they are investing in Instagram. Fashion Brands are seeing the highest engagement rate by channel on Instagram, and have upped their posting frequency there accordingly. Carousels fared best on Instagram, suggesting Fashion customers are willing to swipe and engage with the right set of images.
Some suggestions for Fashion Brands:
- Up Instagram engagement by posting more carousels
- Focus Facebook and Instagram posts on photos, but status updates win the day on Twitter in this industry
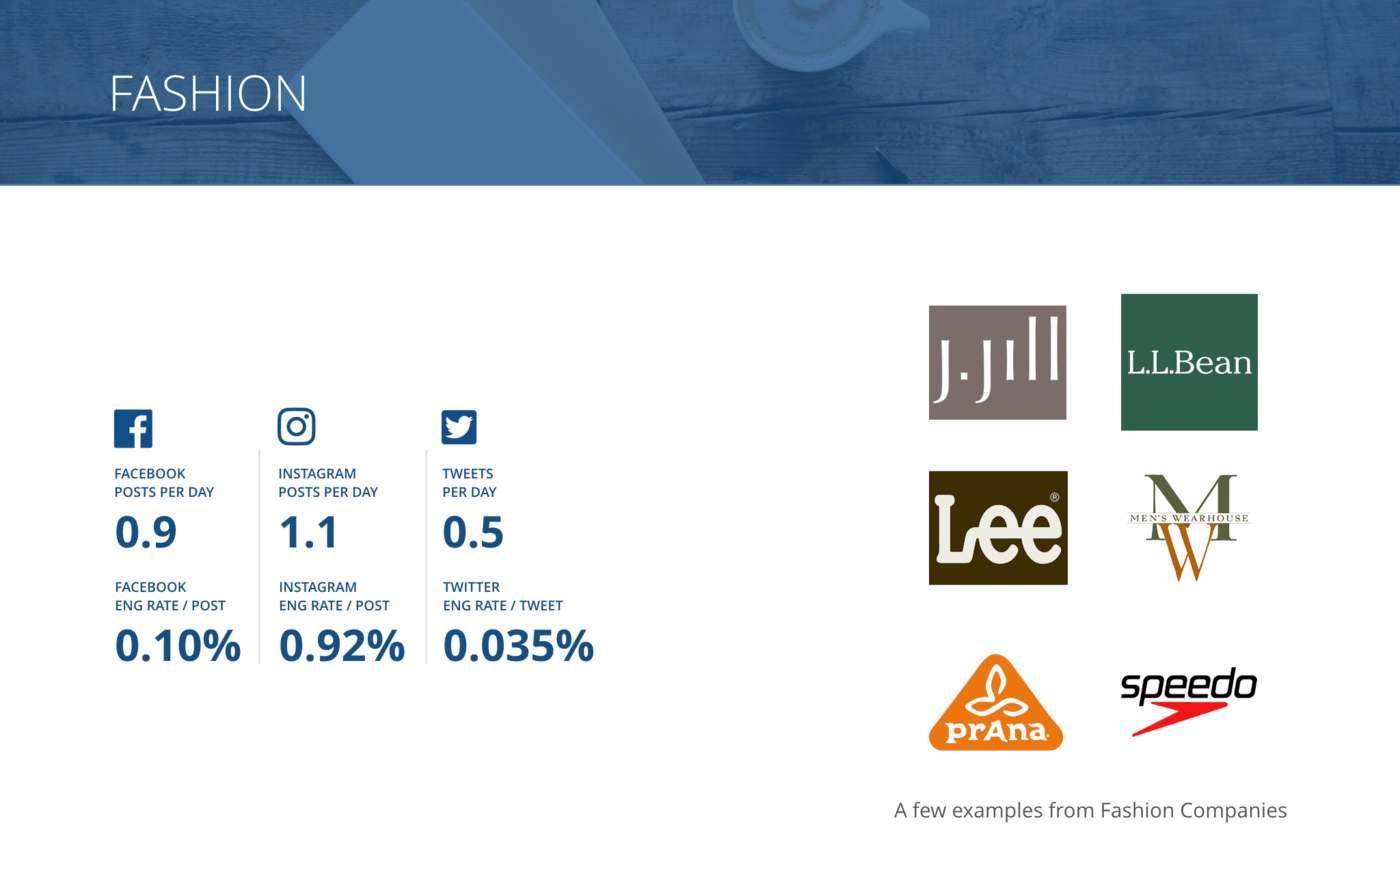
Overview of all benchmarks for fashion
Some of the notable brands our sample of Fashion Brands include J. Jill, L.L. Bean, Lee, Men’s Warehouse, Prana, and Speedo.
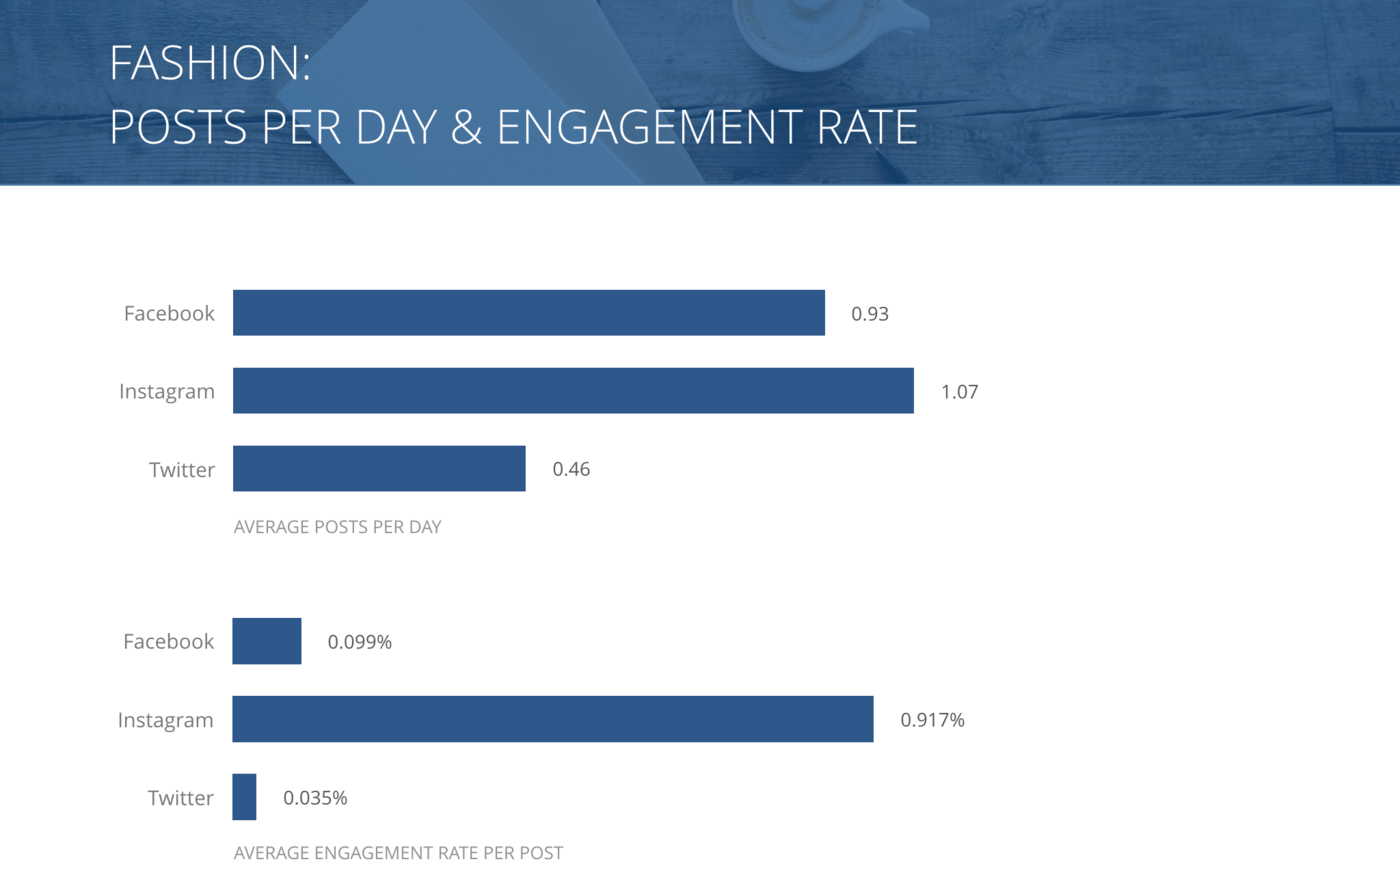
Posts per Day and Engagement Rate per Post, Fashion Brands
Instagram engagement rates dropped by about 25% from last year to this year for Fashion brands. These companies need to continue their focus on engaging content in the face of ever more Instagram content.
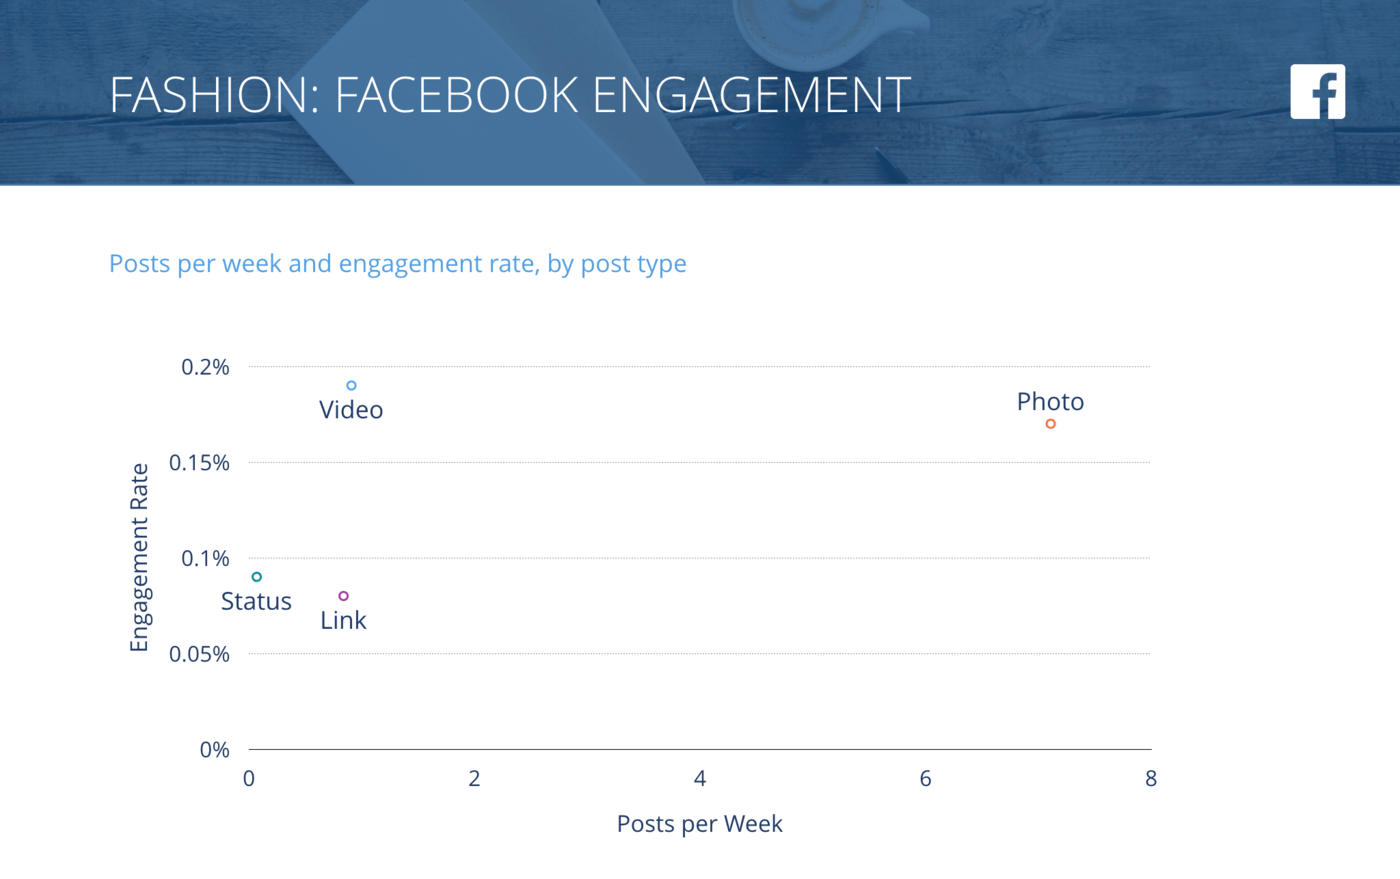
Facebook Posts per Week vs. Engagement Rate per Post, Fashion Brands
Fashion videos fared best on Facebook, so up your video game on this channel. With only about one video per day, there could be more room for increased engagement here.
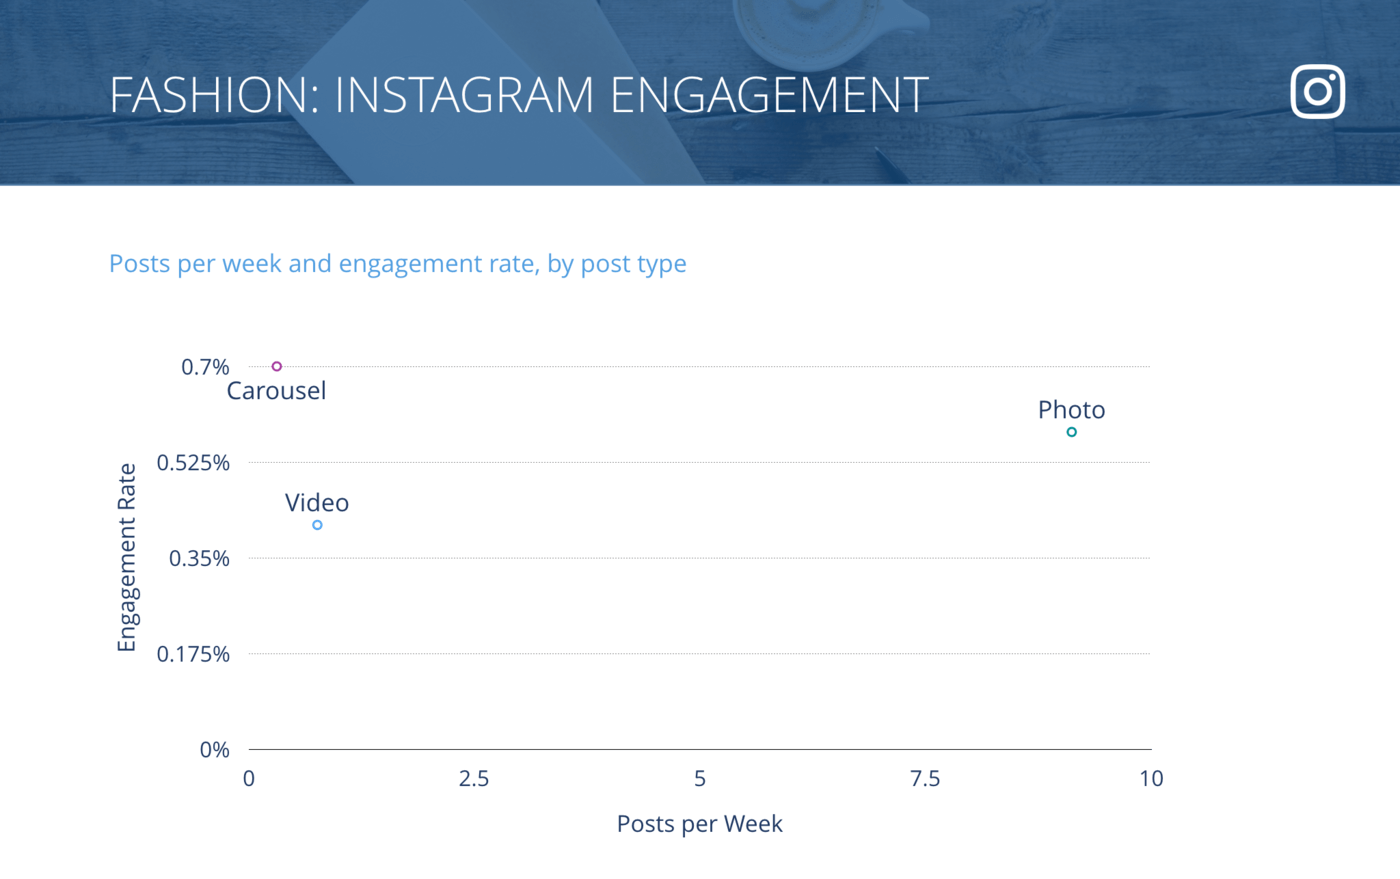
Instagram Posts per Week vs. Engagement Rate per Post, Fashion Brands
Carousels saw top engagement and low posting frequency on Instagram, so look at increasing these posts in 2018.
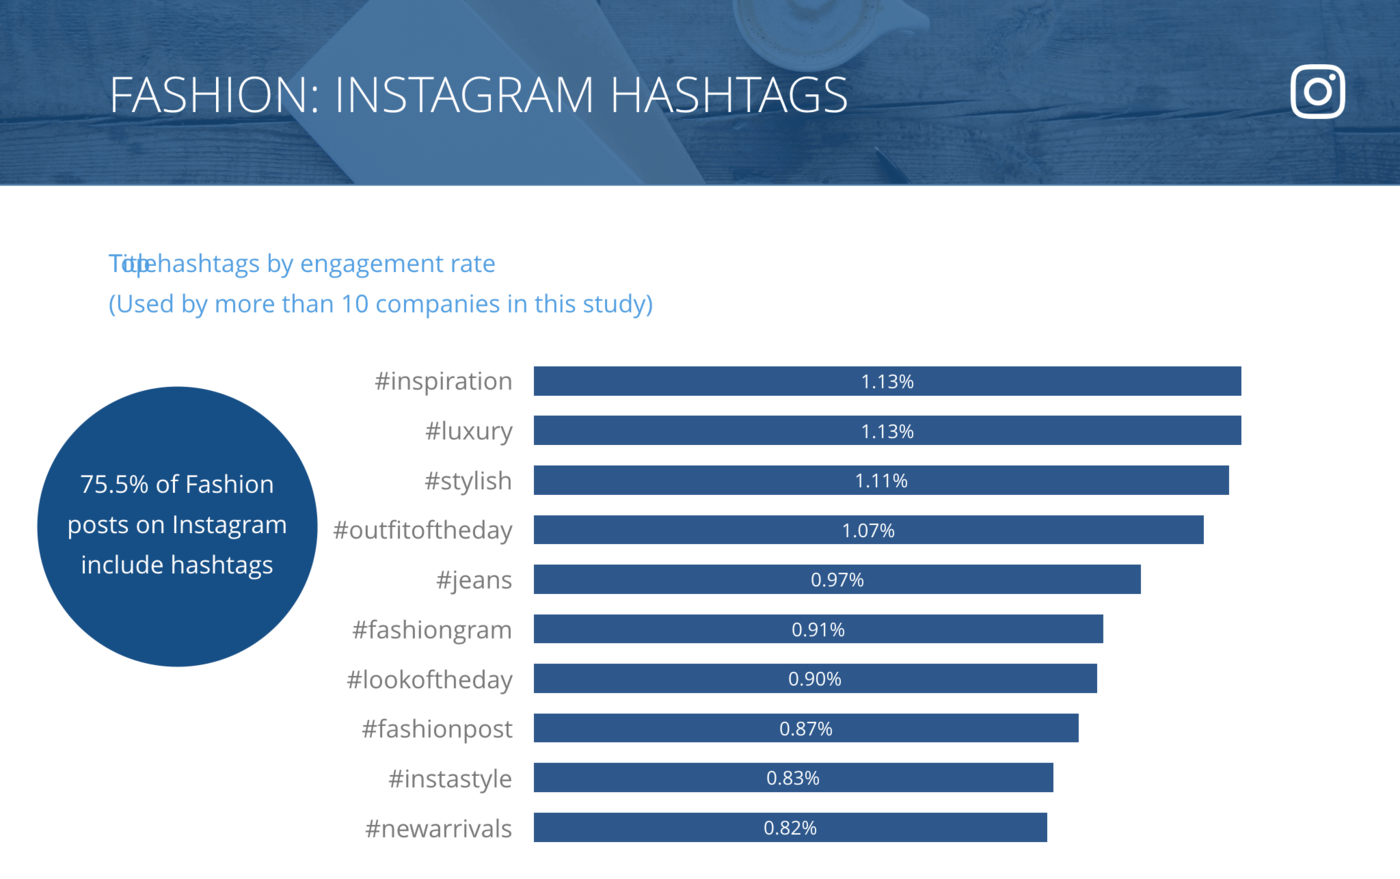
Instagram Top Hashtags by Engagement Rate per Post, Fashion Brands
Fashion the lowest engagement rates with Instagram hashtags of all the industries we surveyed.
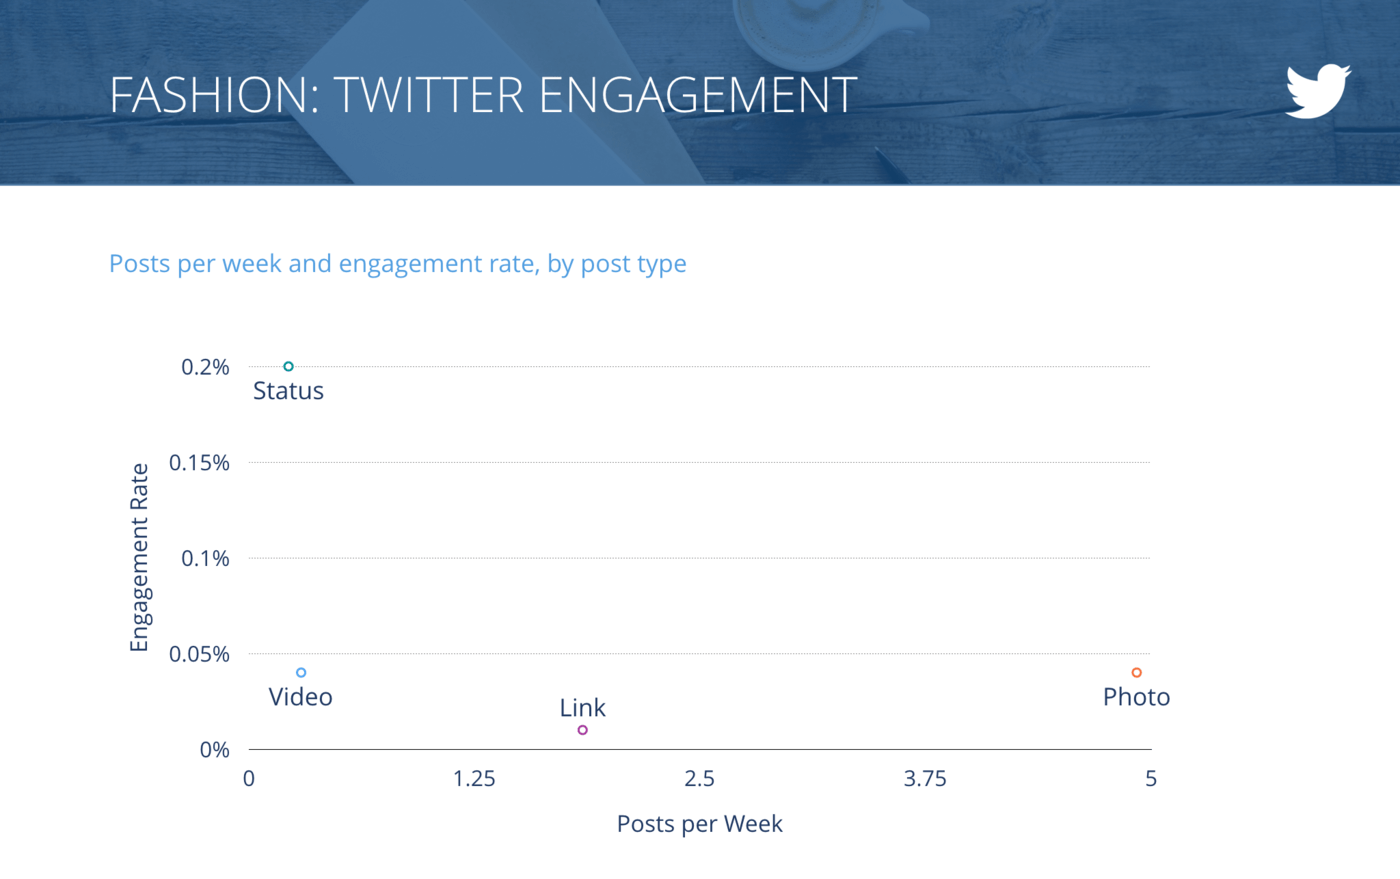
Tweets per Week vs. Engagement Rate per Tweet, Fashion Brands
Status updates didn’t do well in every industry, but Fashion customers were definitely hungry for them on Twitter.
Industry Snapshot: Food & Beverages
Food & Beverage ties for first place with influencers for highest Facebook engagement rate across this study, and boasts a high engagement rate on Twitter as well. They’re among the lowest posters on high-performing Instagram, which is a place to look to increase social impact next year.
Other ideas for improvement:
- Hashtags perform well, so keep an ear to the ground for high-performing food-related hashtags to use
- Continue to up your Twitter game–unlike other industries, Food & Beverage is still getting traction on this channel
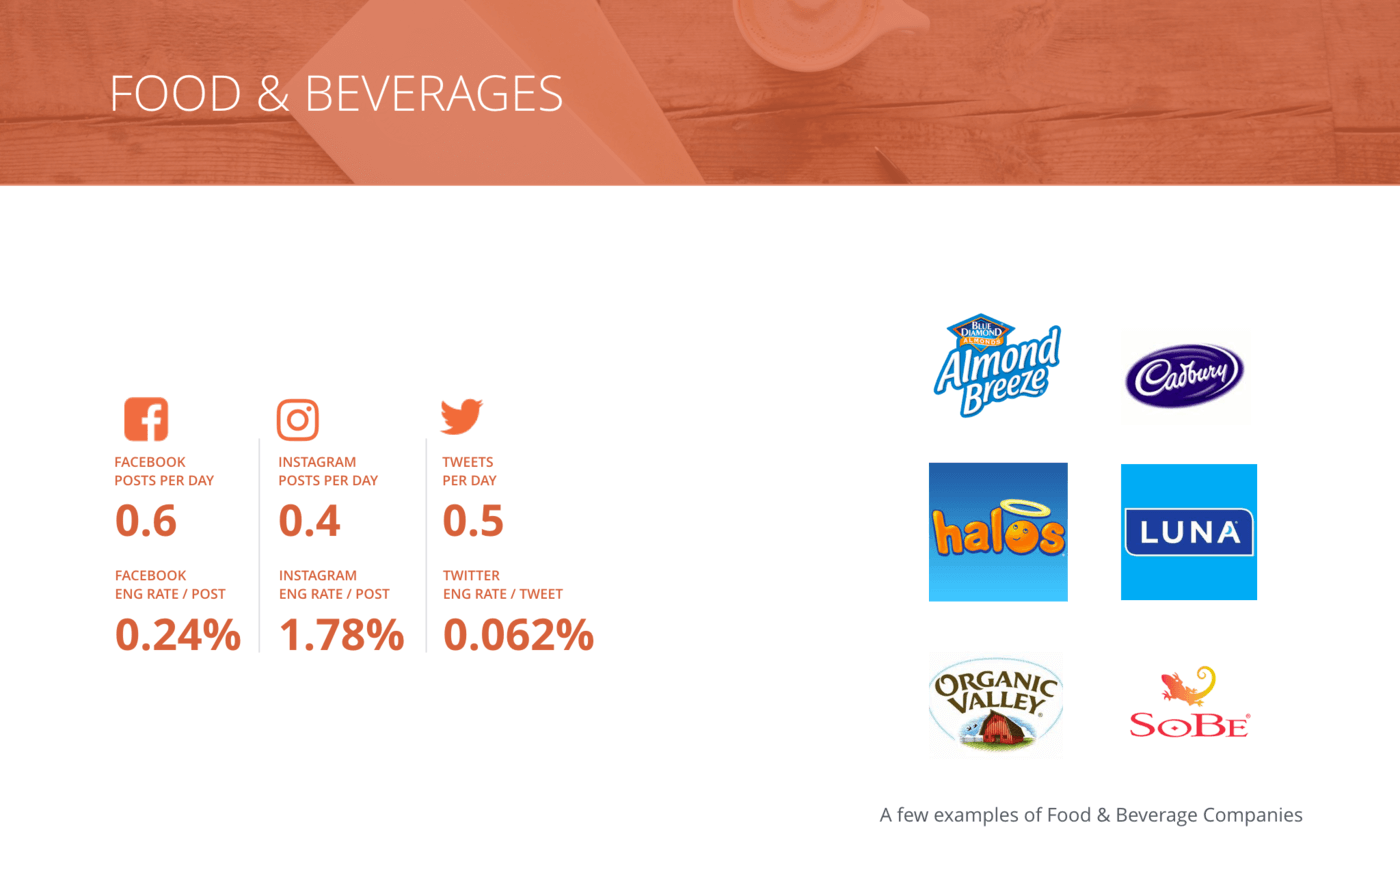
Overview of all benchmarks, Food & Beverages
Some of the notable brands from our sample of Food & Beverages companies include Cadbury, Luna, Organic valley, and SoBe.
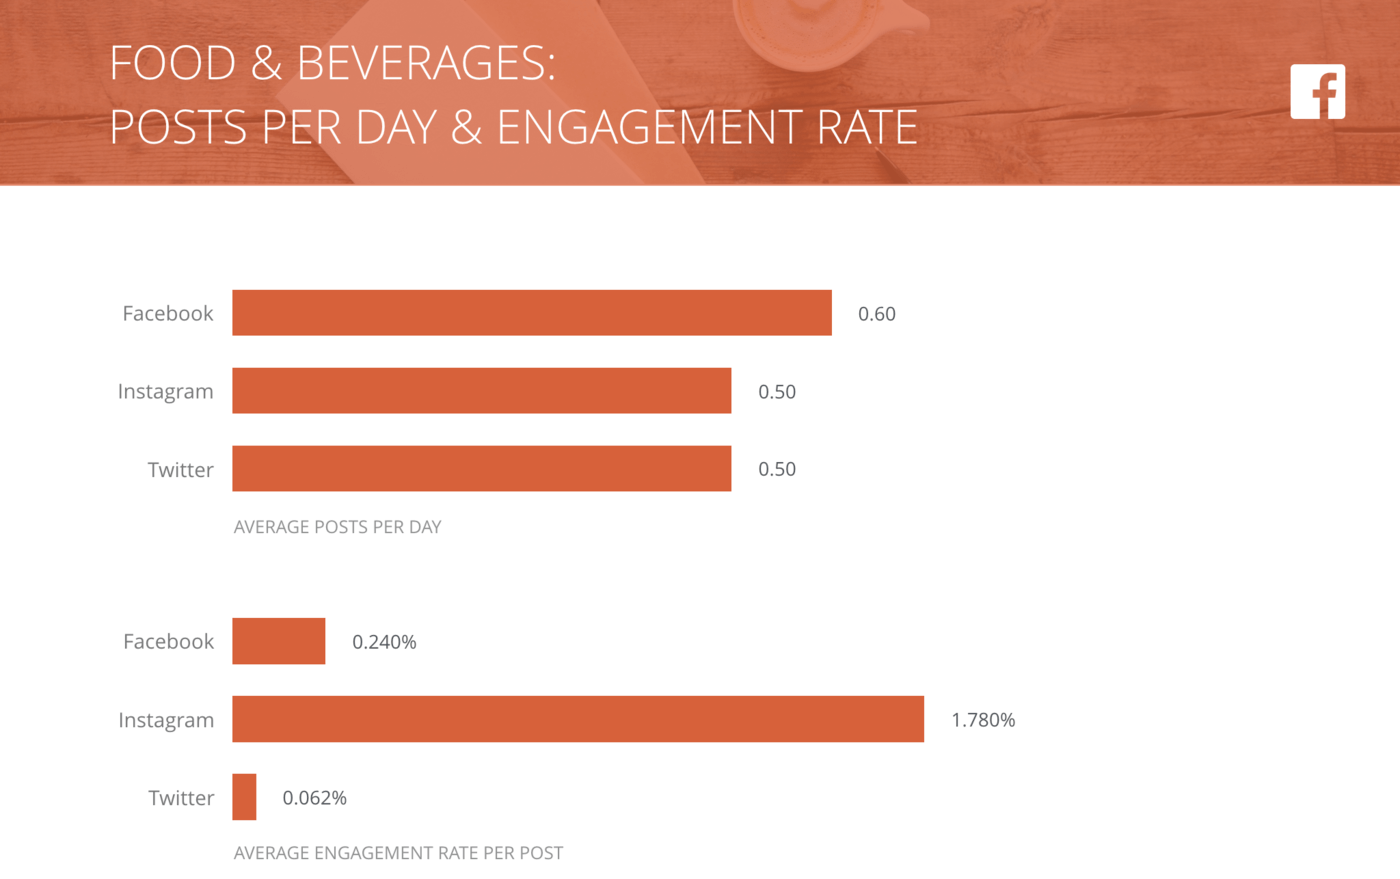
Posts per Day and Engagement Rate per Post, Food & Beverages
Food & Beverages brands dropped their posting frequency from last year but enjoyed similar engagement rates, reminding everyone that more isn’t always better.
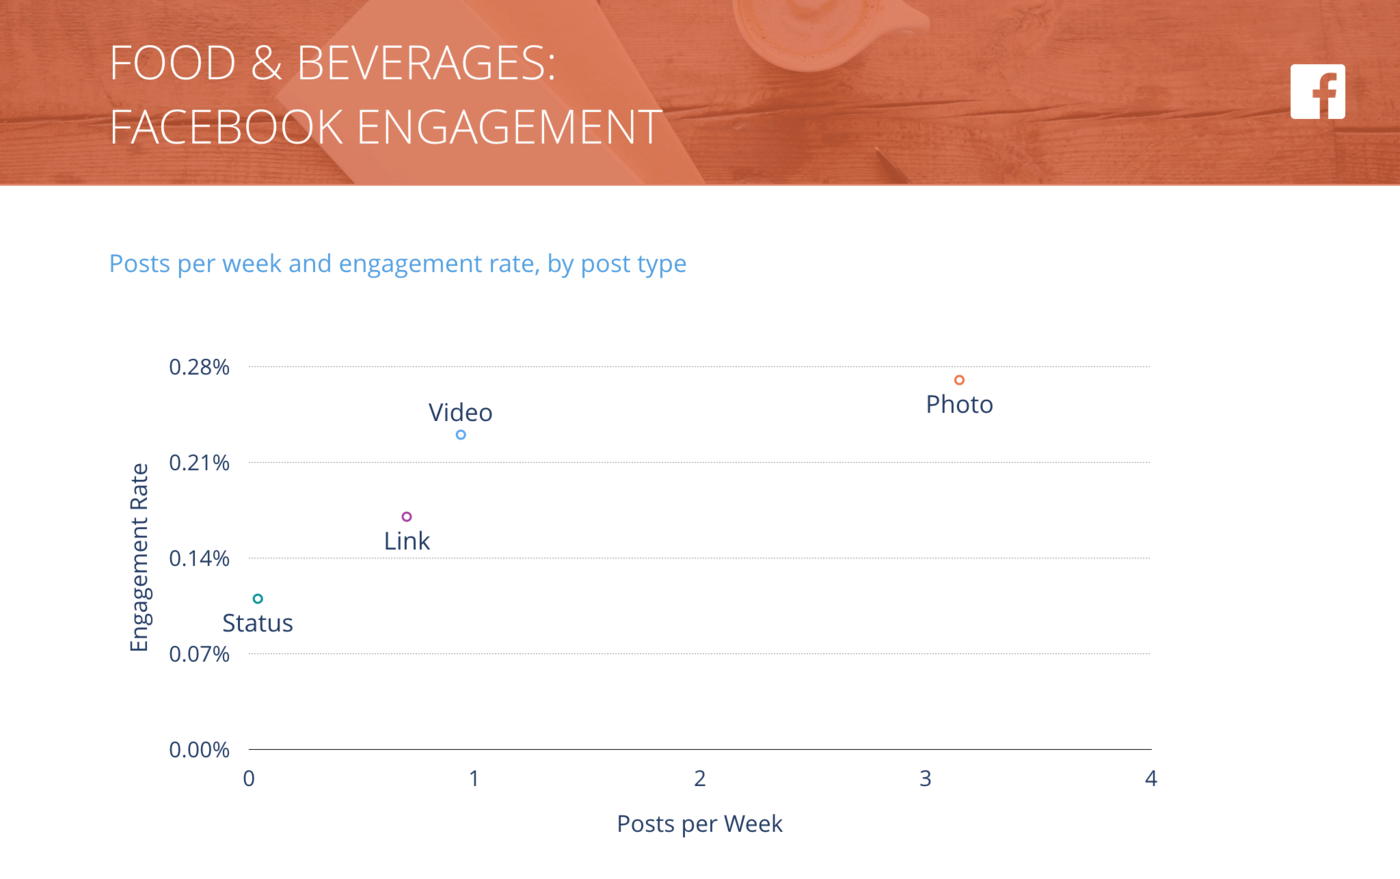
Facebook Posts per Week vs. Engagement Rate per Post, Food & Beverages
Consumers love Food & Beverages photos on Facebook, but video is right behind photos in popularity.
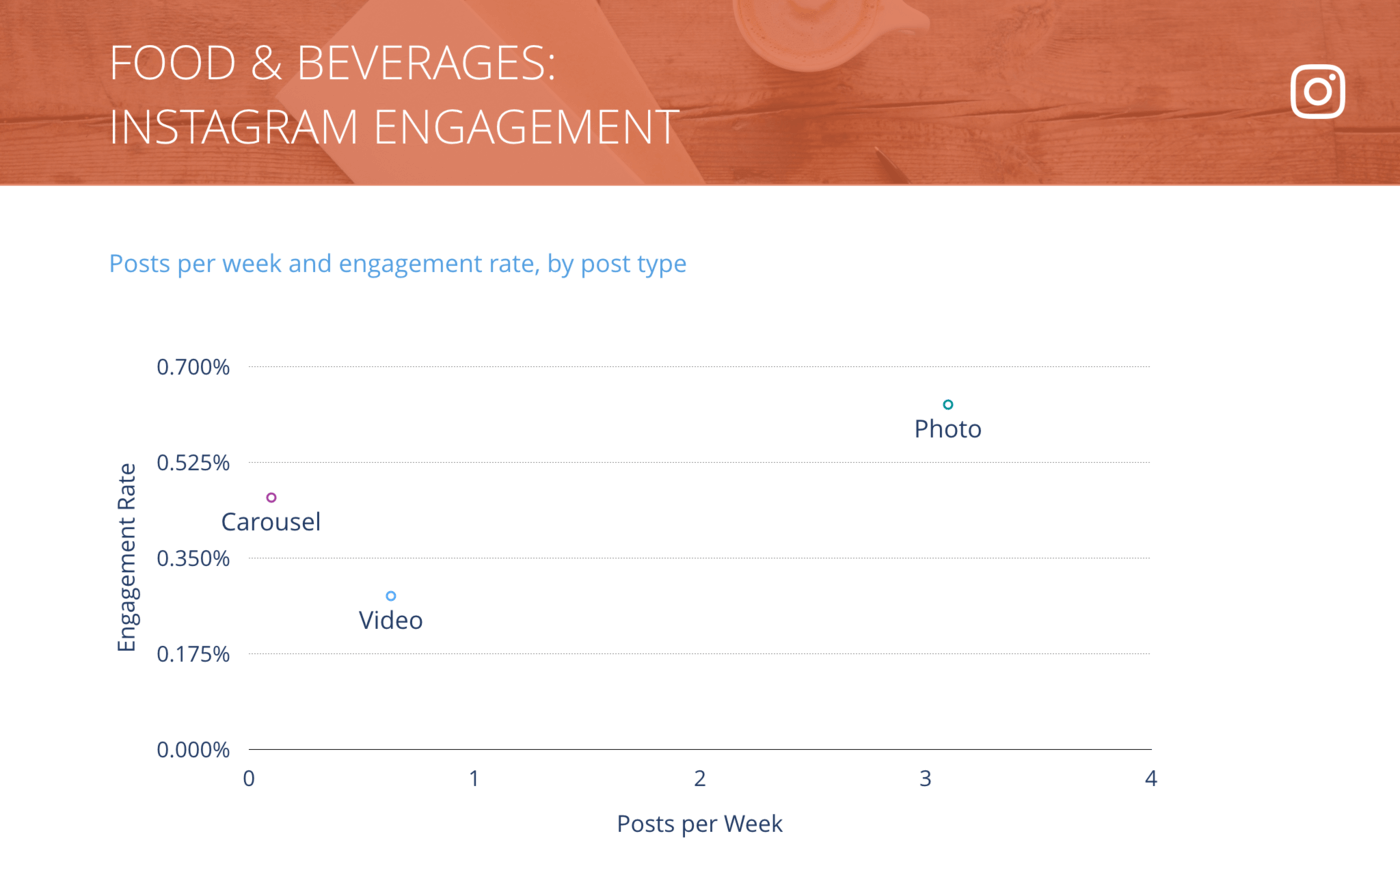
Instagram Posts per Week vs. Engagement Rate per Post, Food & Beverages
Photos on Instagram consistently foster the most engagement across almost all industries, and Food & Beverages-themed photos are among the top performers.
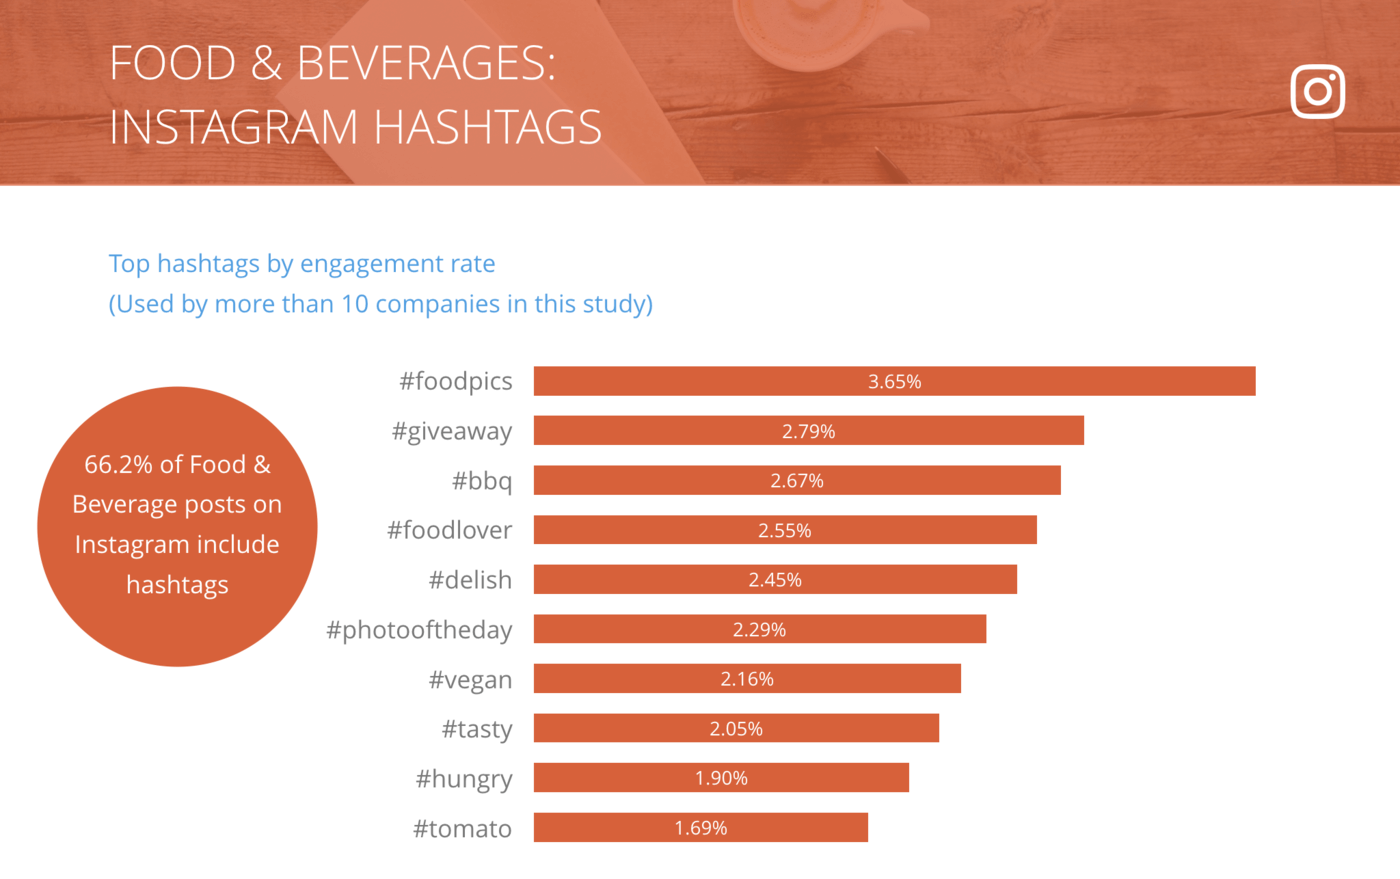
Instagram Top Hashtags by Engagement Rate per Post, Food & Beverages
Food & Beverage companies are less likely than other industries to include hashtags on Instagram, but when they pick the right one, they perform well.
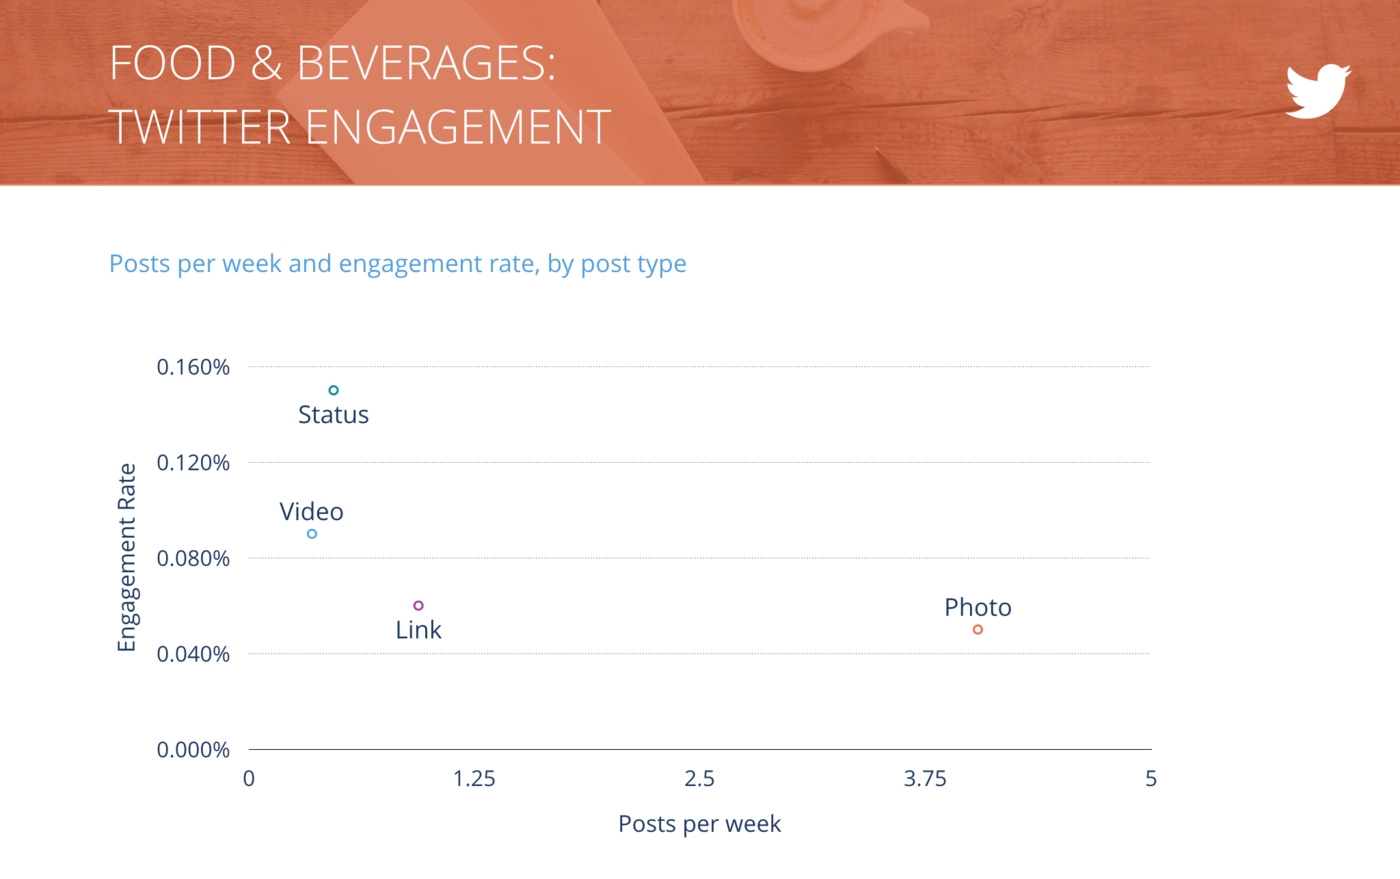
Tweets per Week vs. Engagement Rate per Tweet, Food & Beverages
Status updates performed twice as well as the next-highest performing content type on Twitter, which is real bang for your buck.
Industry Snapshot: Health & Beauty
For the second year in a row, Health & Beauty underperformed despite its stellar reputation of high social engagement.
Health & Beauty companies focused their posting on their highest-performing channel, Instagram, suggesting that they know where to find their customers.
Two opportunities for growth:
- Photos win the day across all three channels, so continue to focus efforts there.
- Videos perform best on Facebook and Instagram, so it’s okay to pull back on Twitter video efforts.
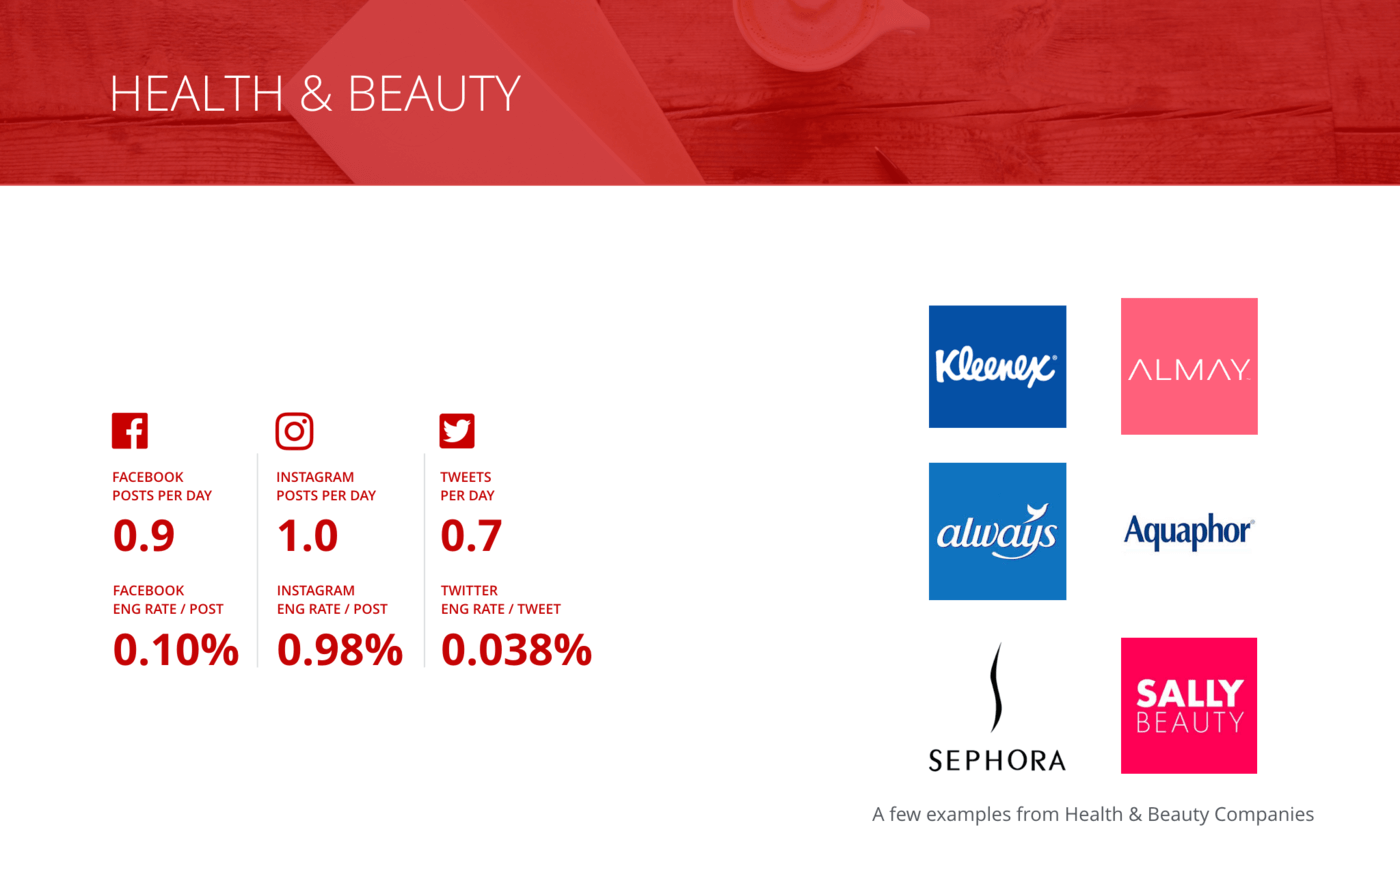
Overview of all benchmarks, Health & Beauty
Kleenex, Always, Aquaphor, and Sephora are a few of the notable brands from our sample of Health & Beauty companies.
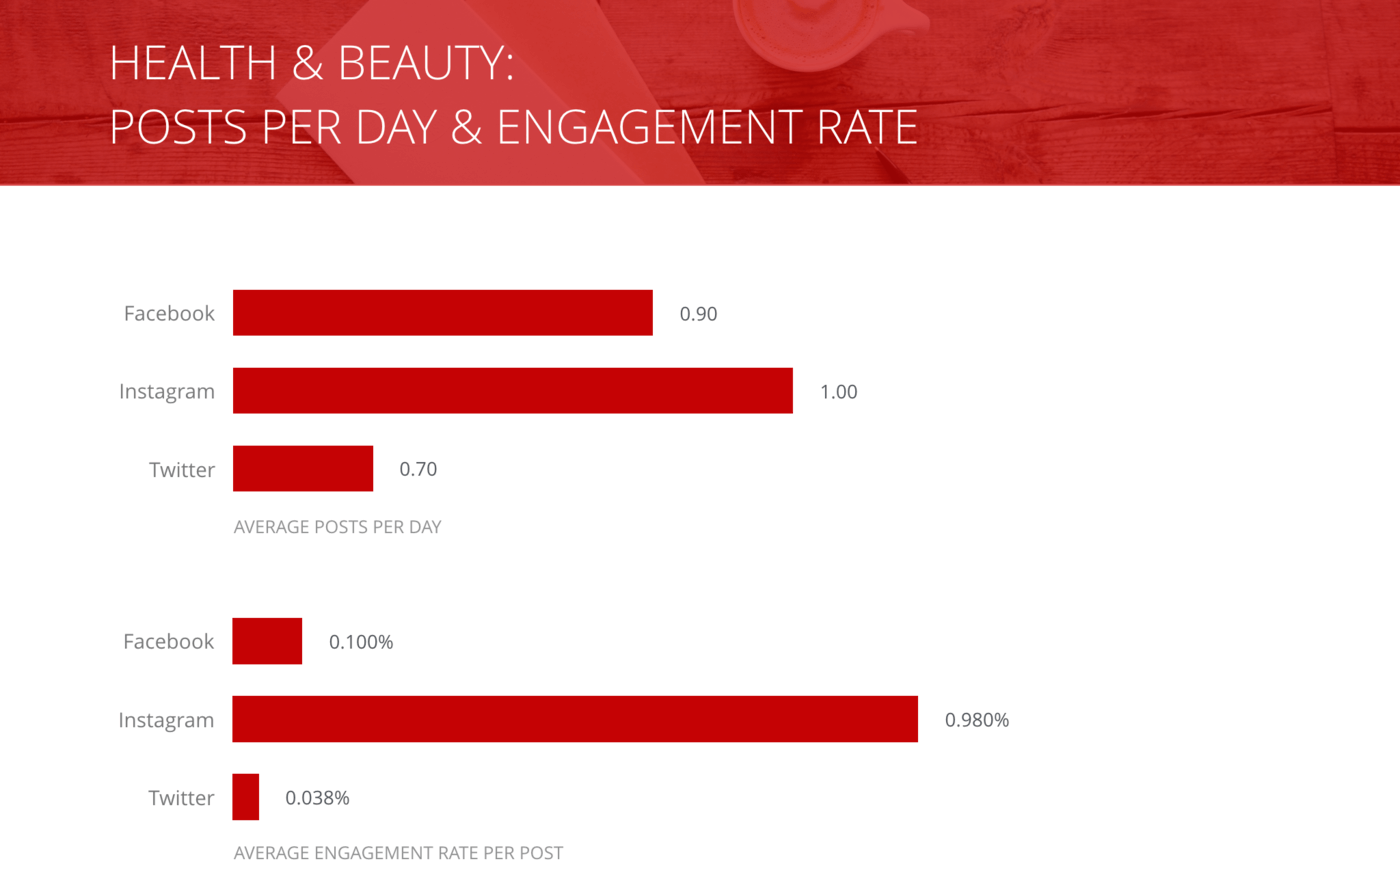
Posts per Day and Engagement Rate per Post, Health & Beauty
Health & Beauty are devoting serious social media resources to Instagram.
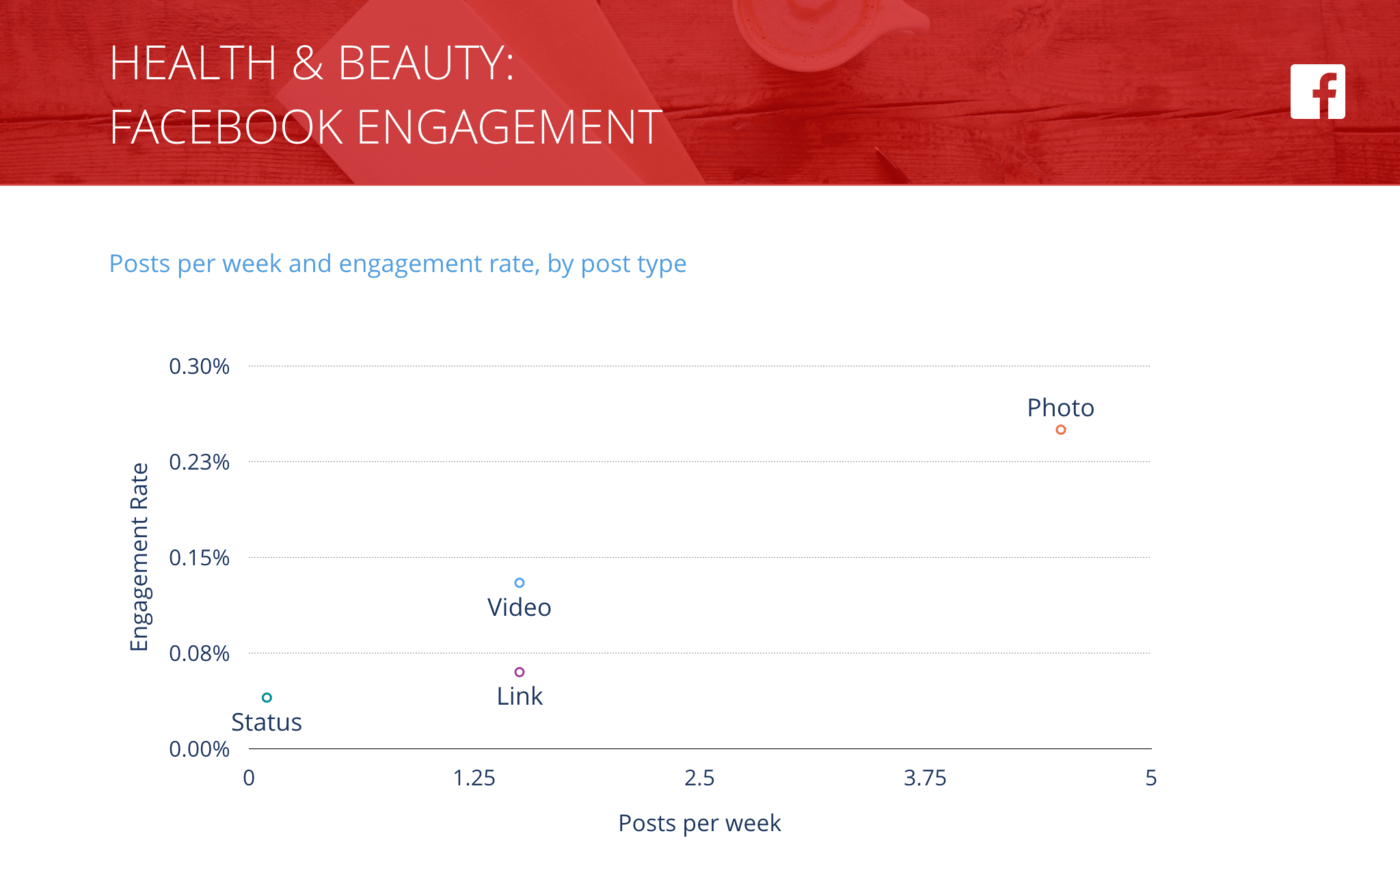
Facebook Posts per Week vs. Engagement Rate per Post, Health & Beauty
As in many industries, Facebook status updates have fallen by the wayside.
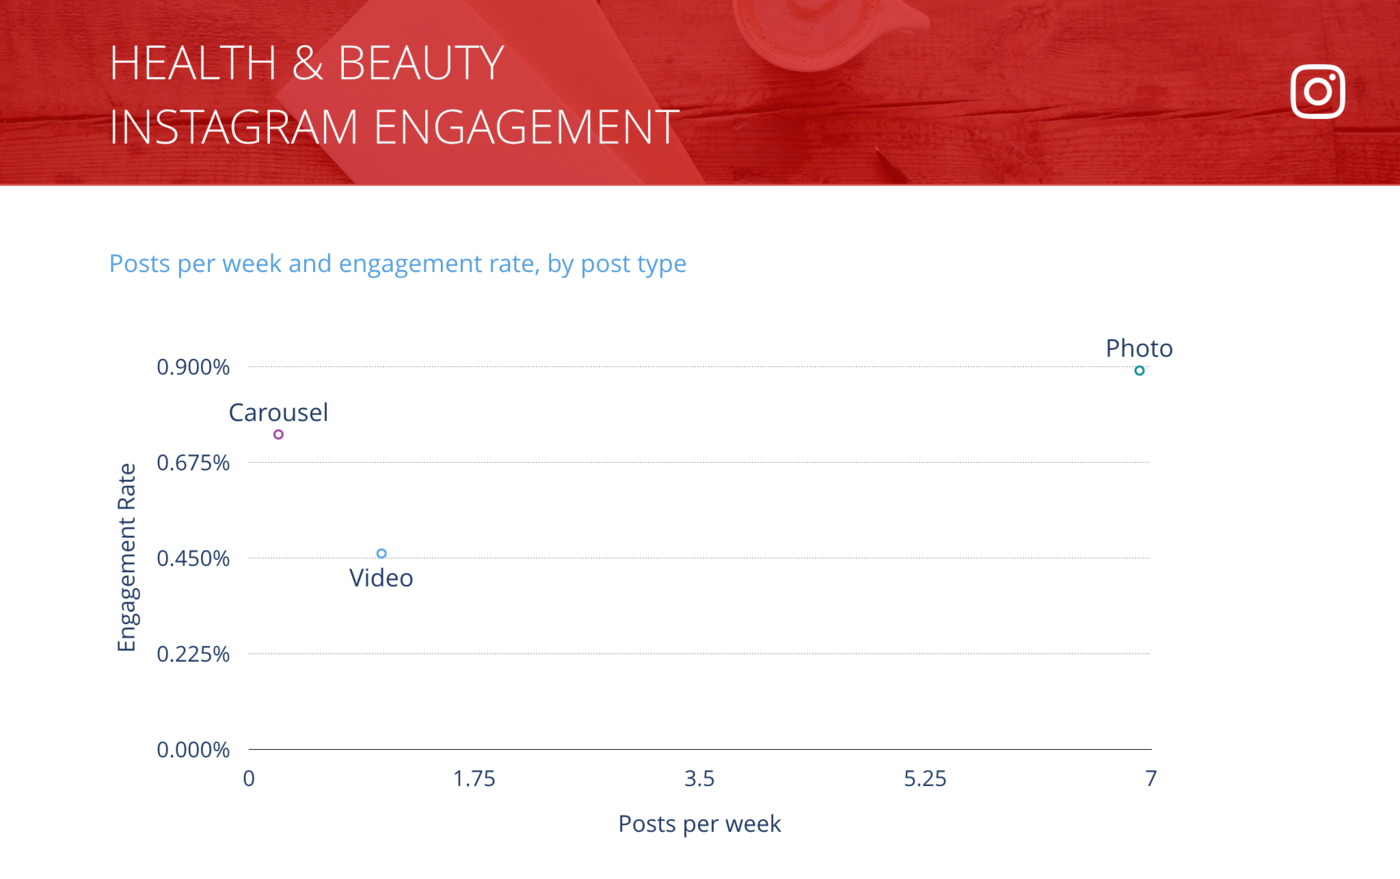
Instagram Posts per Week vs. Engagement Rate per Post, Health & Beauty
Health & Beauty are making the most of their sweet spot: photo posts on Instagram.
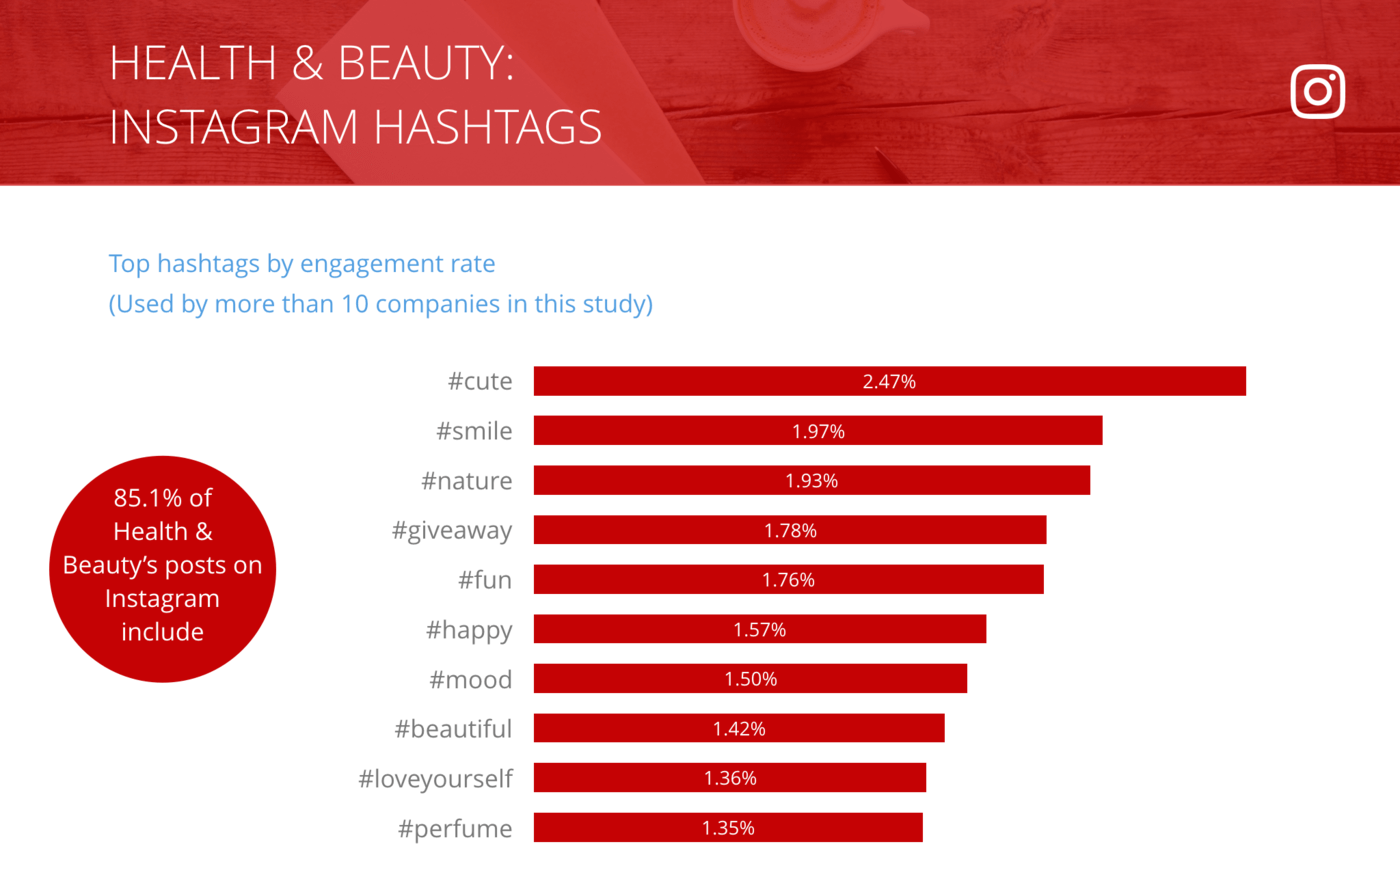
Instagram Top Hashtags by Engagement Rate per Post, Health & Beauty
9 of ten of Health & Beauty’s most popular hashtags weren’t specifically tied to the industry.
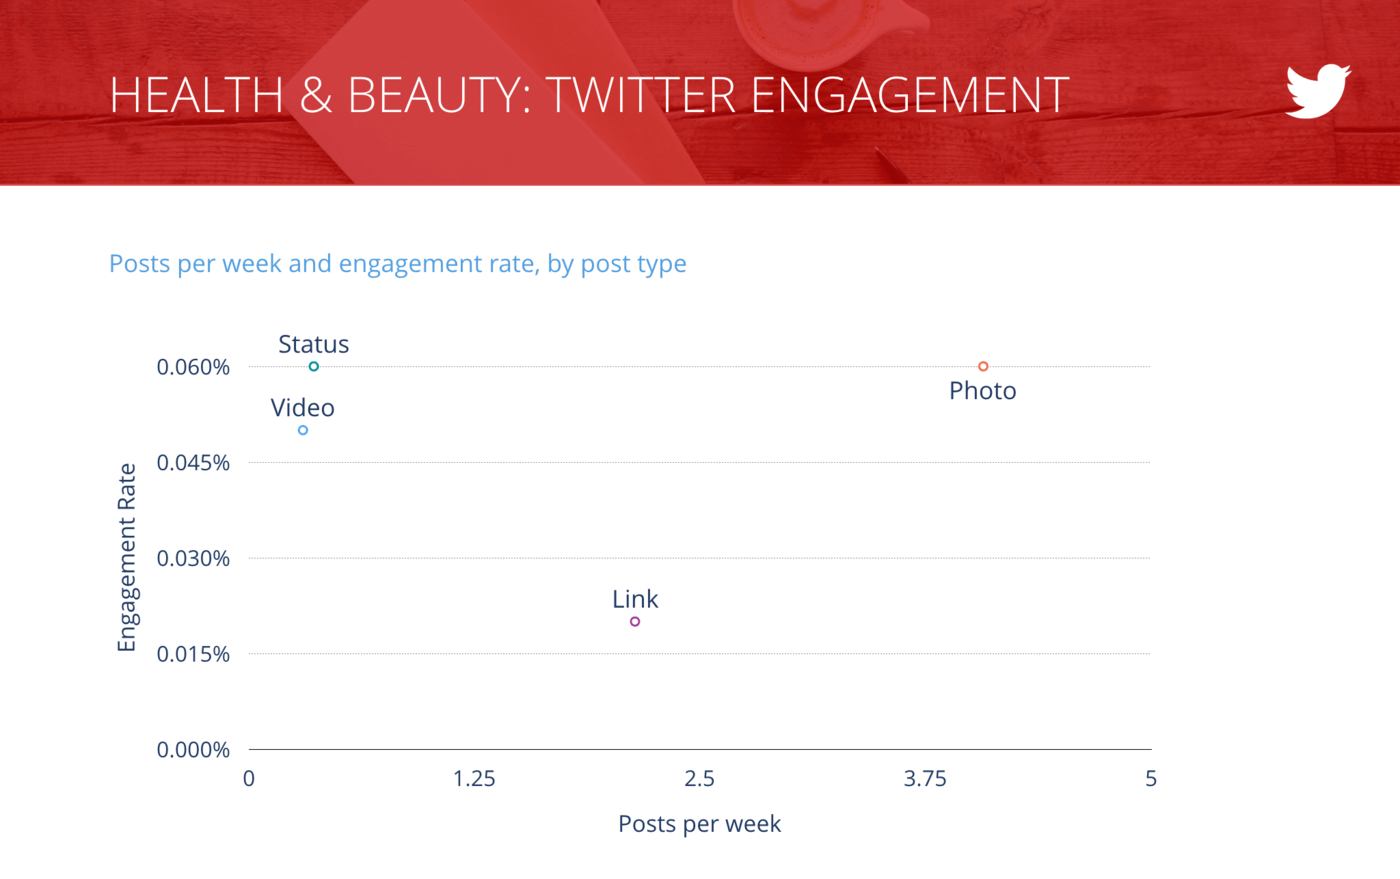
Tweets per Week vs. Engagement Rate per Tweet, Health & Beauty
Status engagement took a big leap forward this year for Health & Beauty, with a 6x increase from .010% last year.
Industry Snapshot: Higher Ed
Higher Ed maintains its domination on Instagram, but like many industries, it experienced a decline in engagement on Facebook. Losing almost half the engagement rate marks this as the biggest drop out of the industries in last year’s study.
Based on this study, there’s one opportunity to improve engagement rates:
- Decrease posting links on Facebook, and instead leverage high engaging content like photos
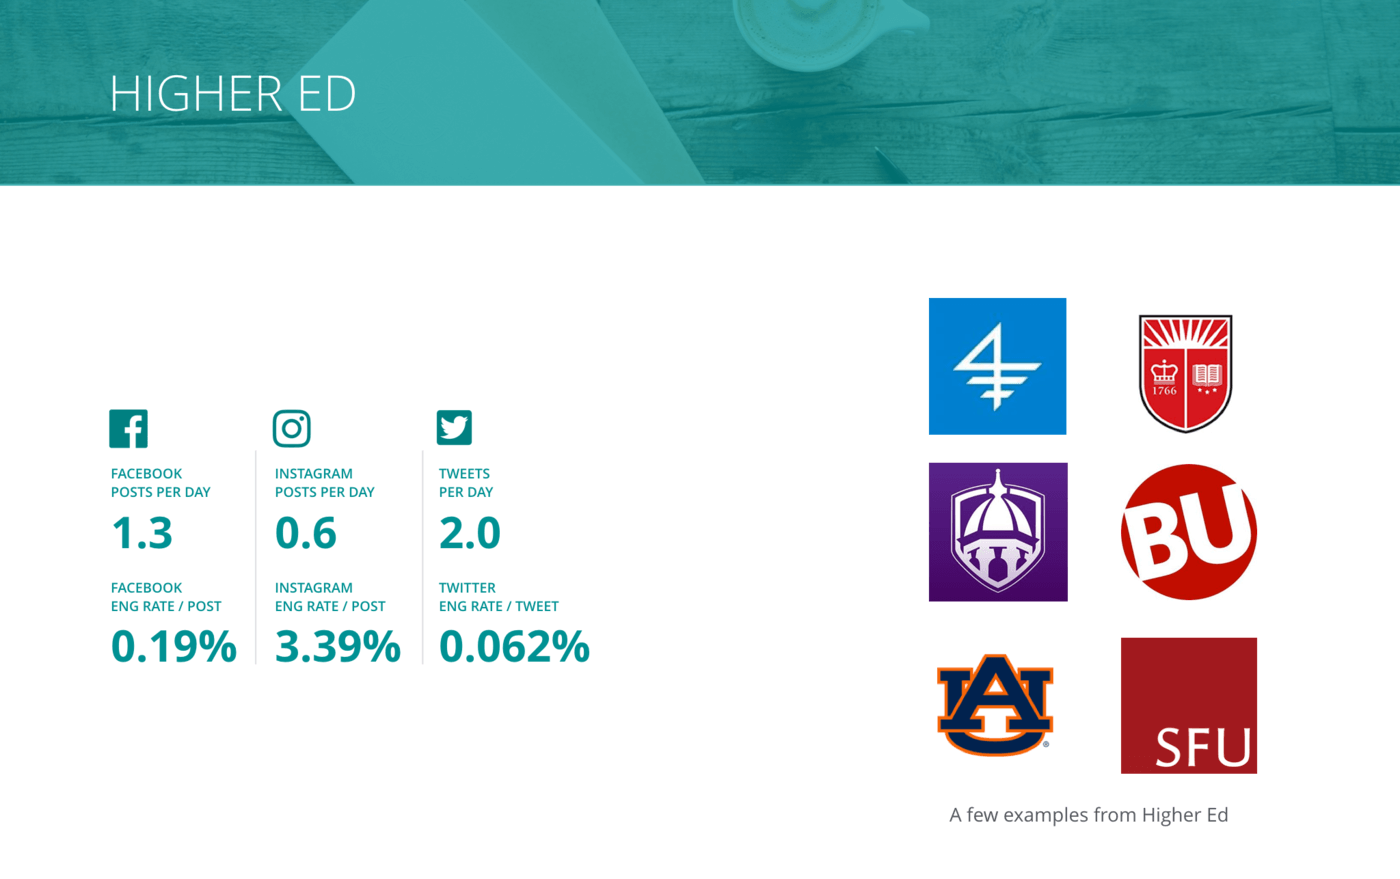
Overview of all benchmarks, Higher Ed
We included colleges and universities like Simon Fraser University, Auburn University, Boston University, and Columbia Business School in our sample.
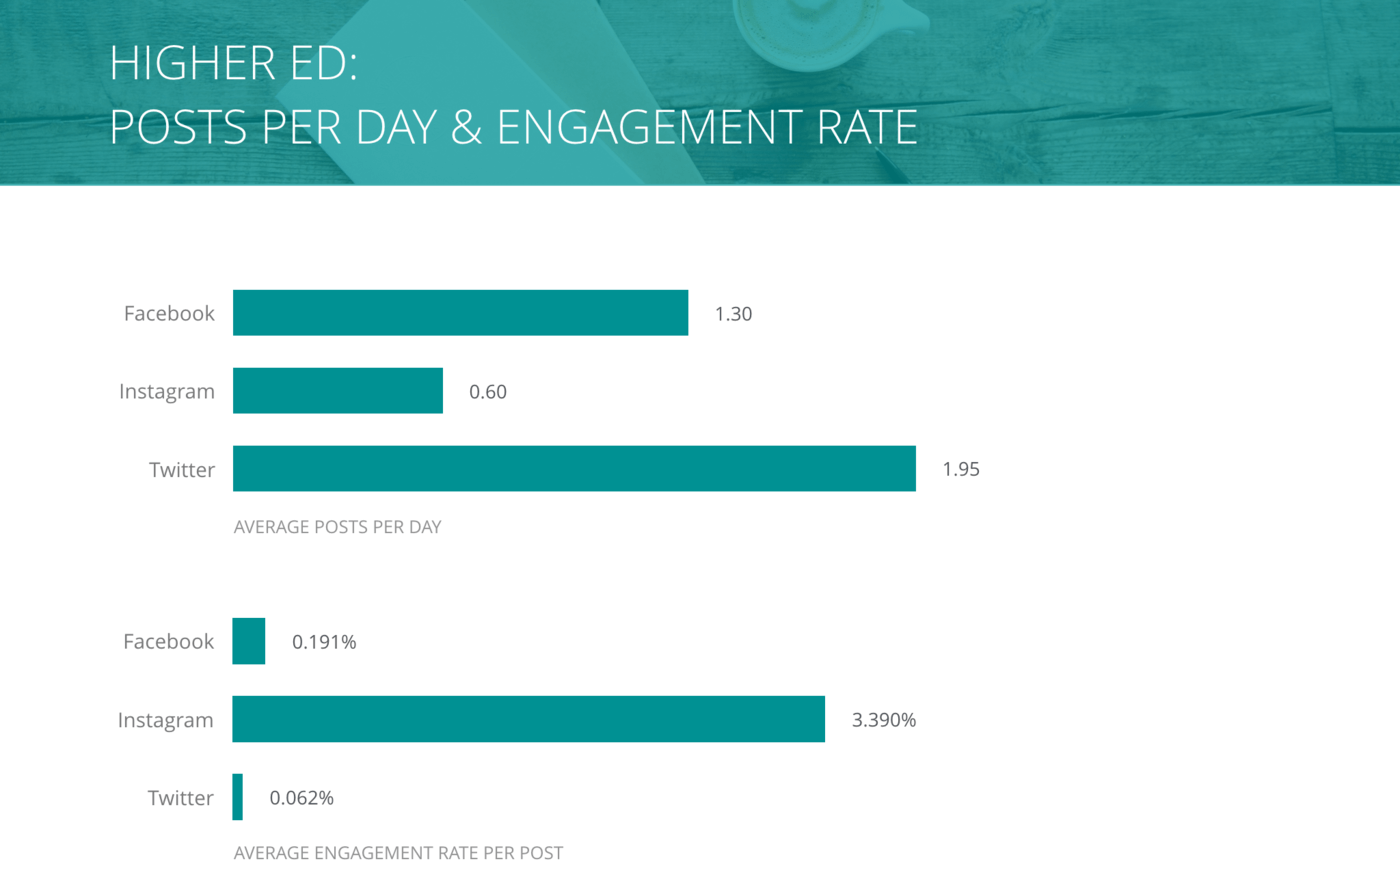
Posts per Day and Engagement Rate per Post, Higher Ed
Higher Ed has the highest engagement on Instagram out of all the industries in this study. Posting frequency to Twitter decreased from last year, which may account for the slight increase in engagement.
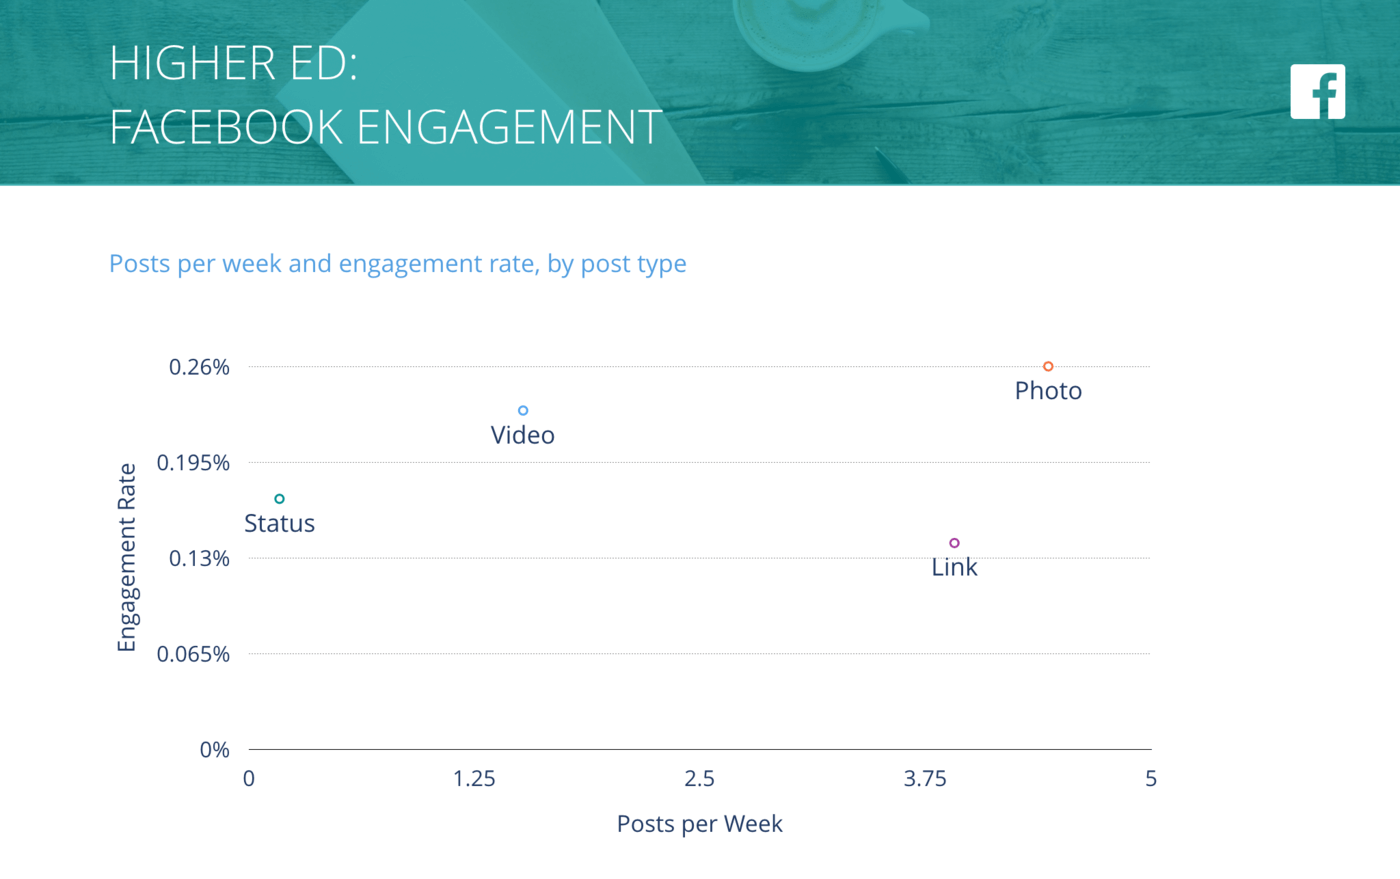
Facebook Posts per Week vs. Engagement Rate per Post, Higher Ed
Facebook Engagement took a nosedive for Higher Ed compared to last year. Not surprisingly, photos and videos drive the most engagement.
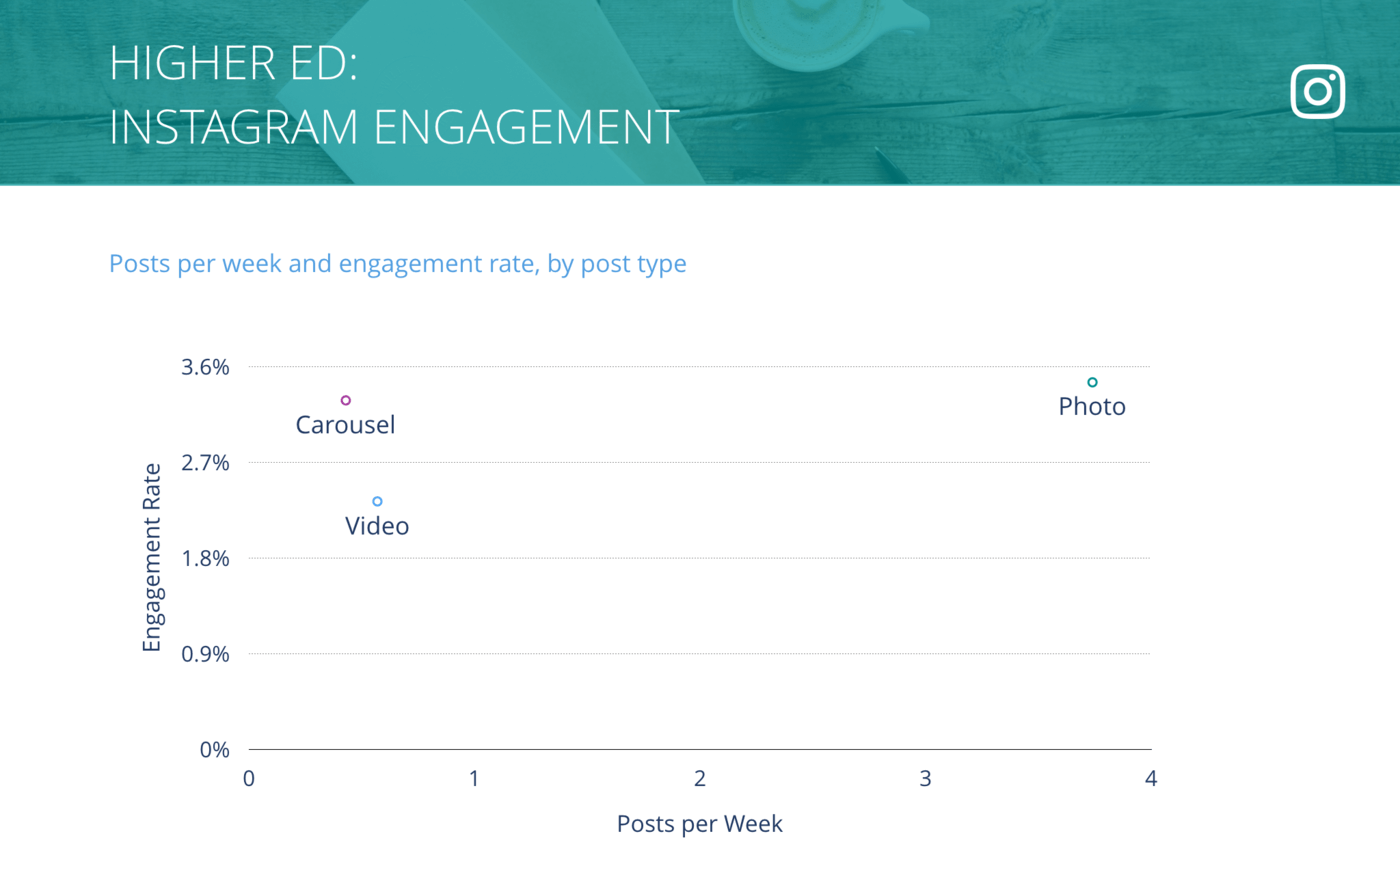
Instagram Posts per Week vs. Engagement Rate per Post, Higher Ed
Higher Ed Instagram drives the highest engagement out of all the industries and has the lowest number of video posts per week. Coincidence?
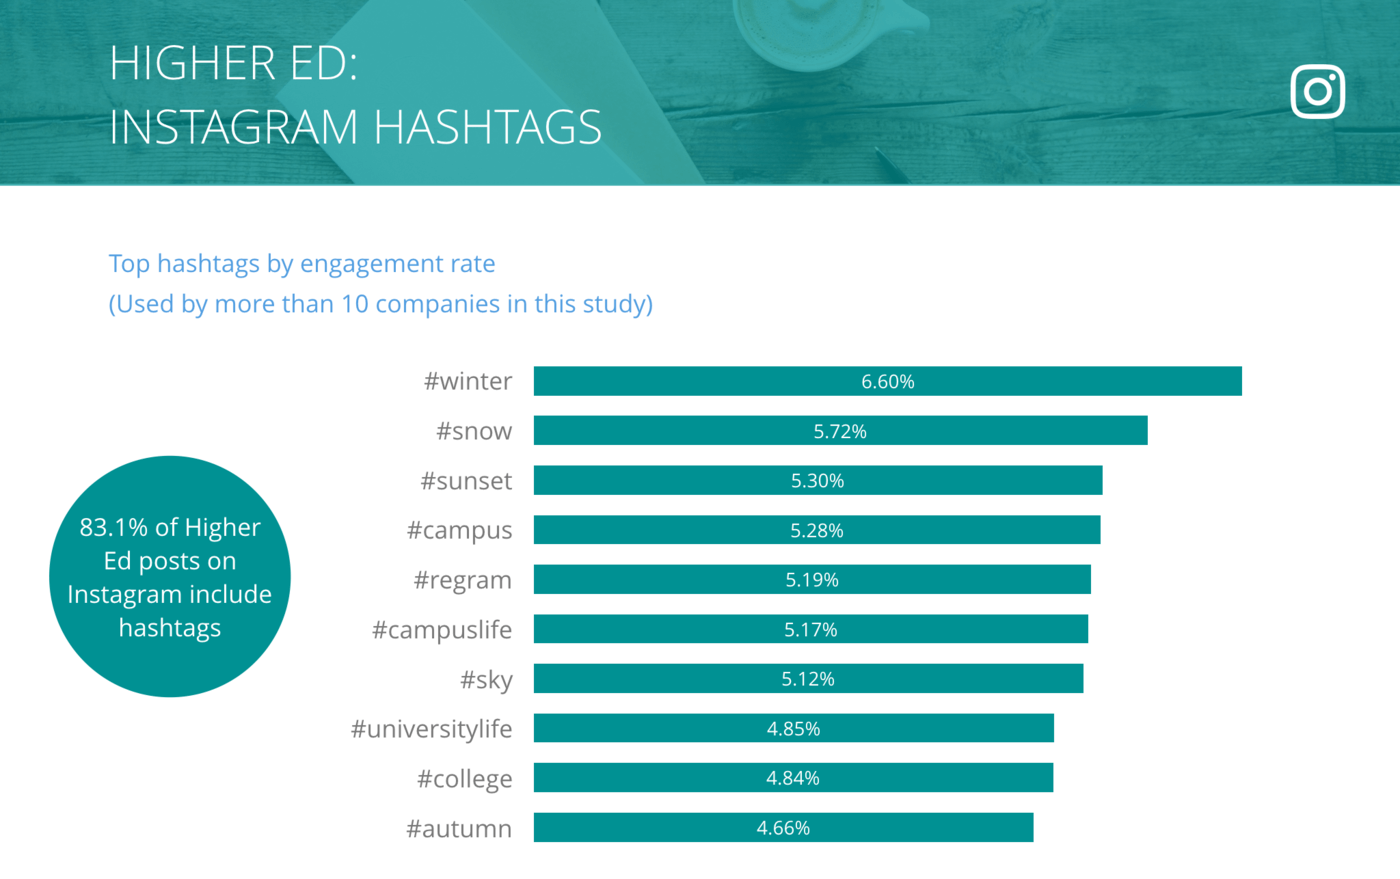
Instagram Top Hashtags by Engagement Rate per Post, Higher Ed
Consistent with last year’s top hashtags, seasonal or nature hashtags continue to be wins. New this year are: #campuslife, #universitylife, and #college. These engagement rates outshine every other industry.
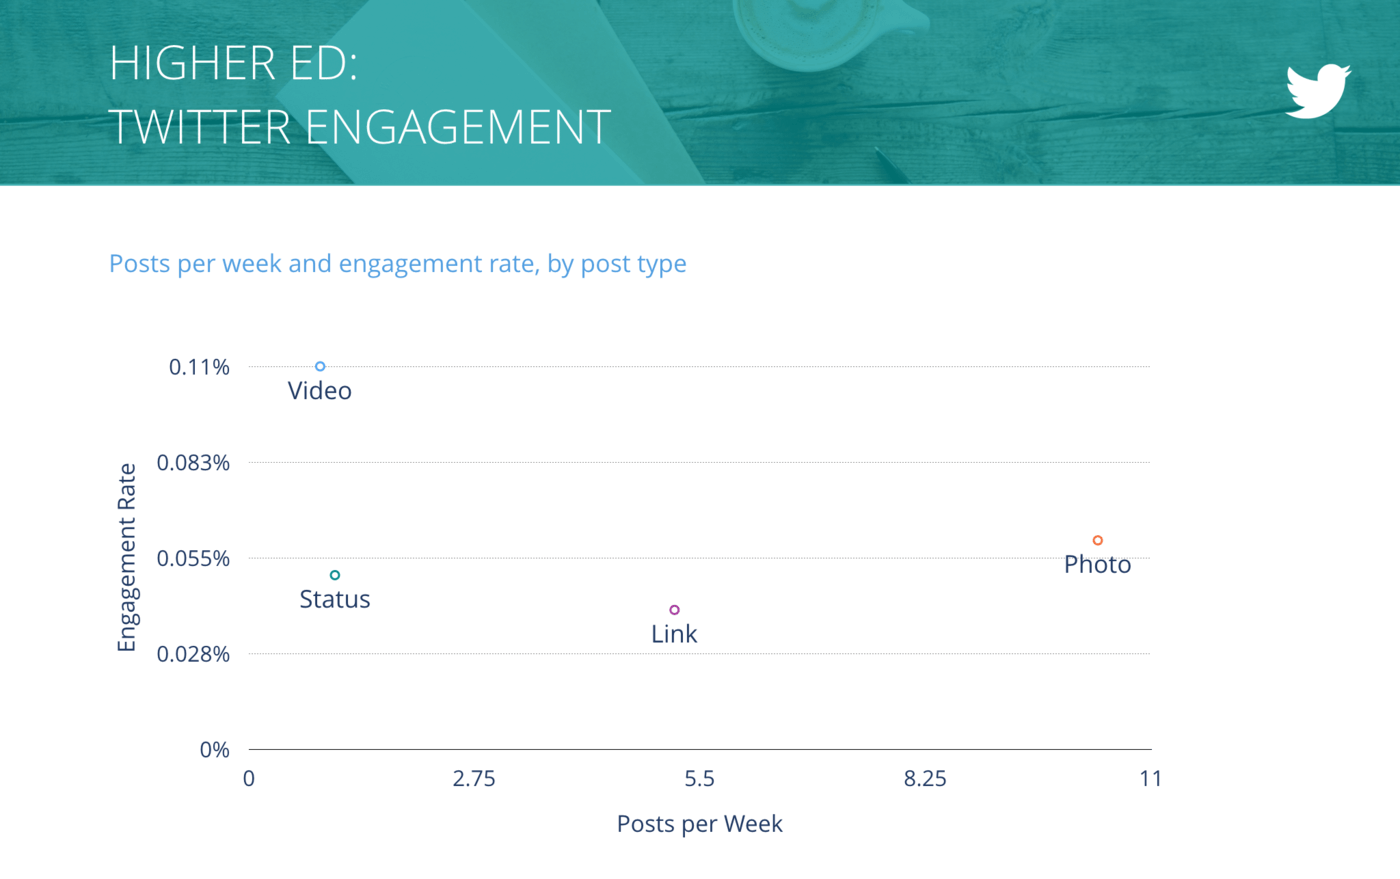
Tweets per Week vs. Engagement Rate per Tweet, Higher Ed
Video on Twitter drives almost double the engagement than all other post types.
Industry Snapshot: Home Decor
Video garners high engagement across Facebook, Twitter, and Instagram for Home Decor brands, suggesting customers like to visualize their purchases before they buy. Photos perform well across all channels too.
Facebook and Instagram engagement rates are slightly below average of the industries we surveyed, while Twitter was right on par.
Some ideas for growth:
- Increase posting frequency on Instagram to take advantage of customers hungry for visuals and video
- Invest in video content and strategy that can be repurposed across channels
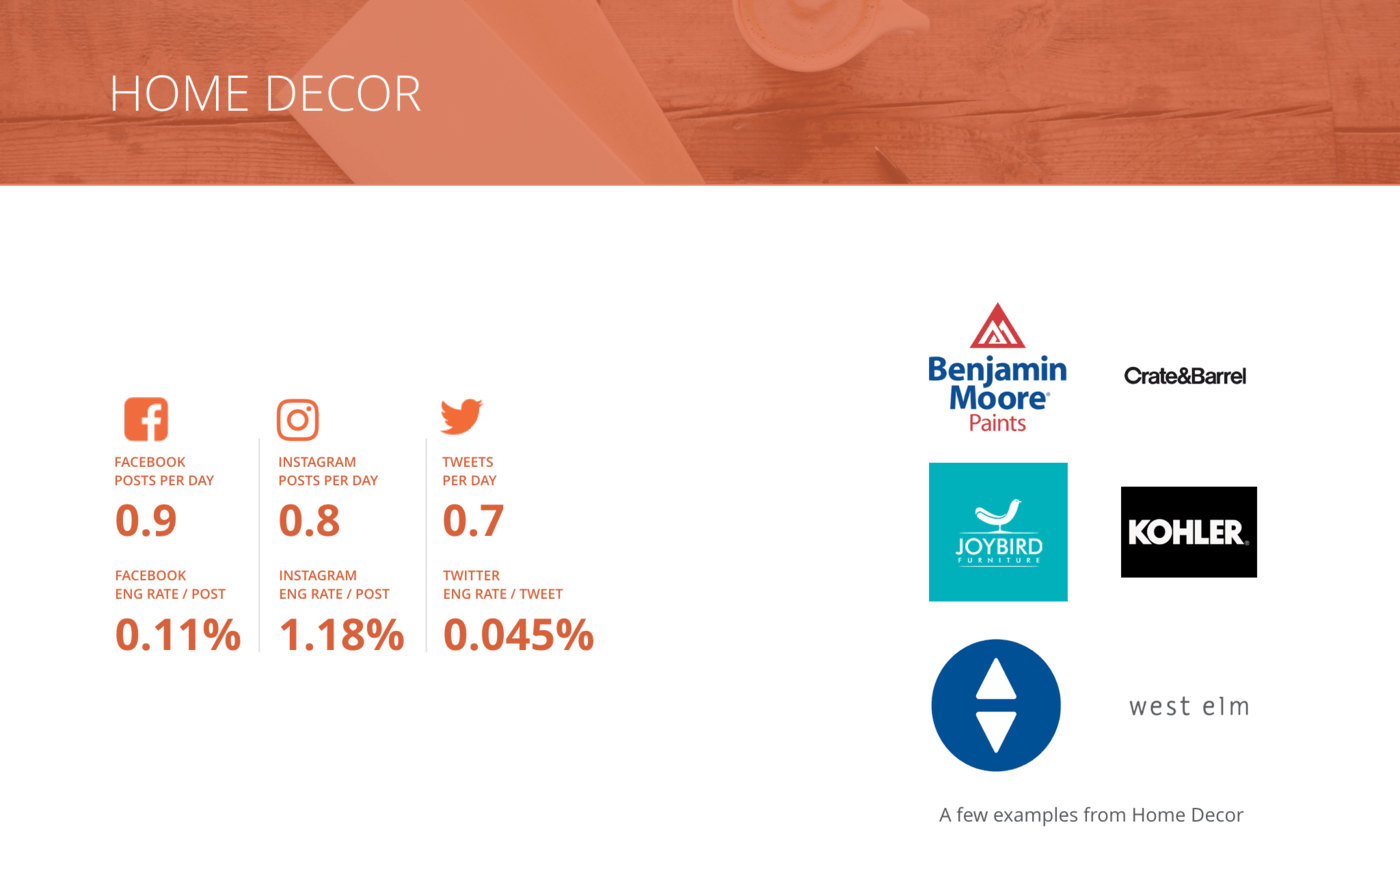
Overview of all benchmarks, Home Decor
West Elm, Kohler, Benjamin Moore, and Sleepnumber are just a few of the Home Decor companies represented in our sample.
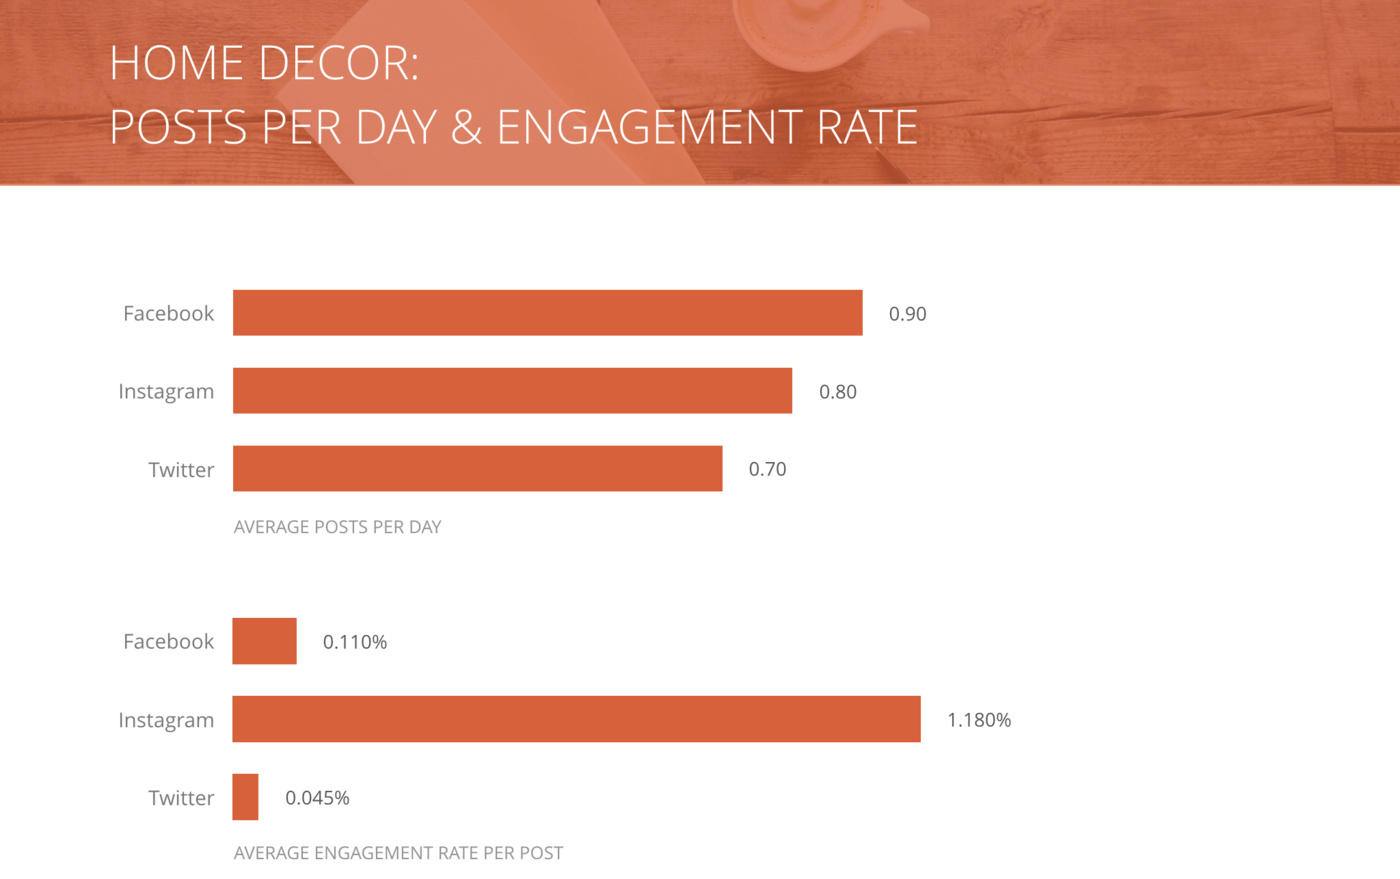
Posts per Day and Engagement Rate per Post, Home Decor
Consistent with other industries, Instagram leads the engagement pack.
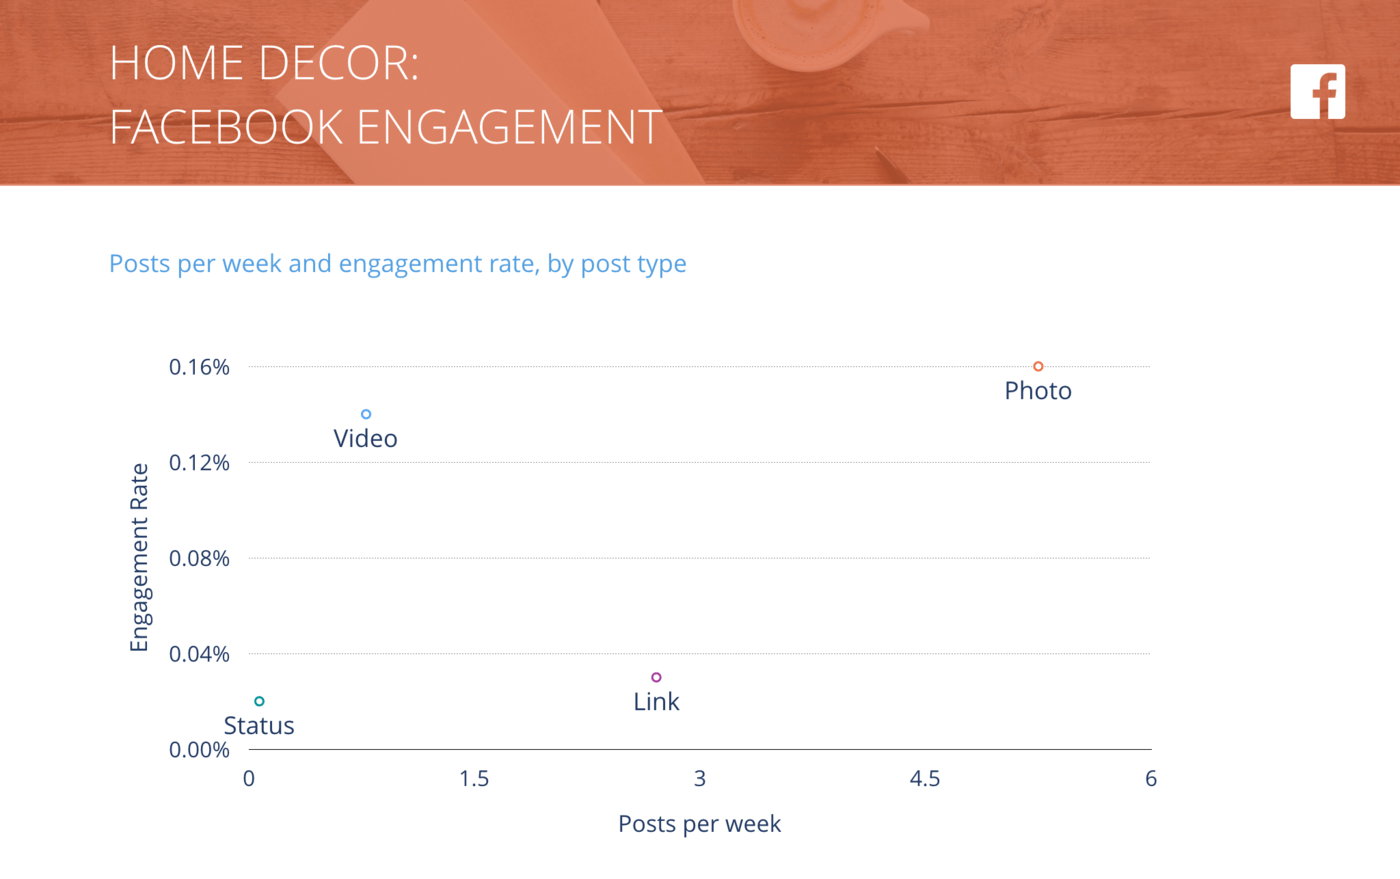
Facebook Posts per Week vs. Engagement Rate per Post, Home Decor
Increasing posting frequency of videos on Facebook will make the most of its high engagement rate.
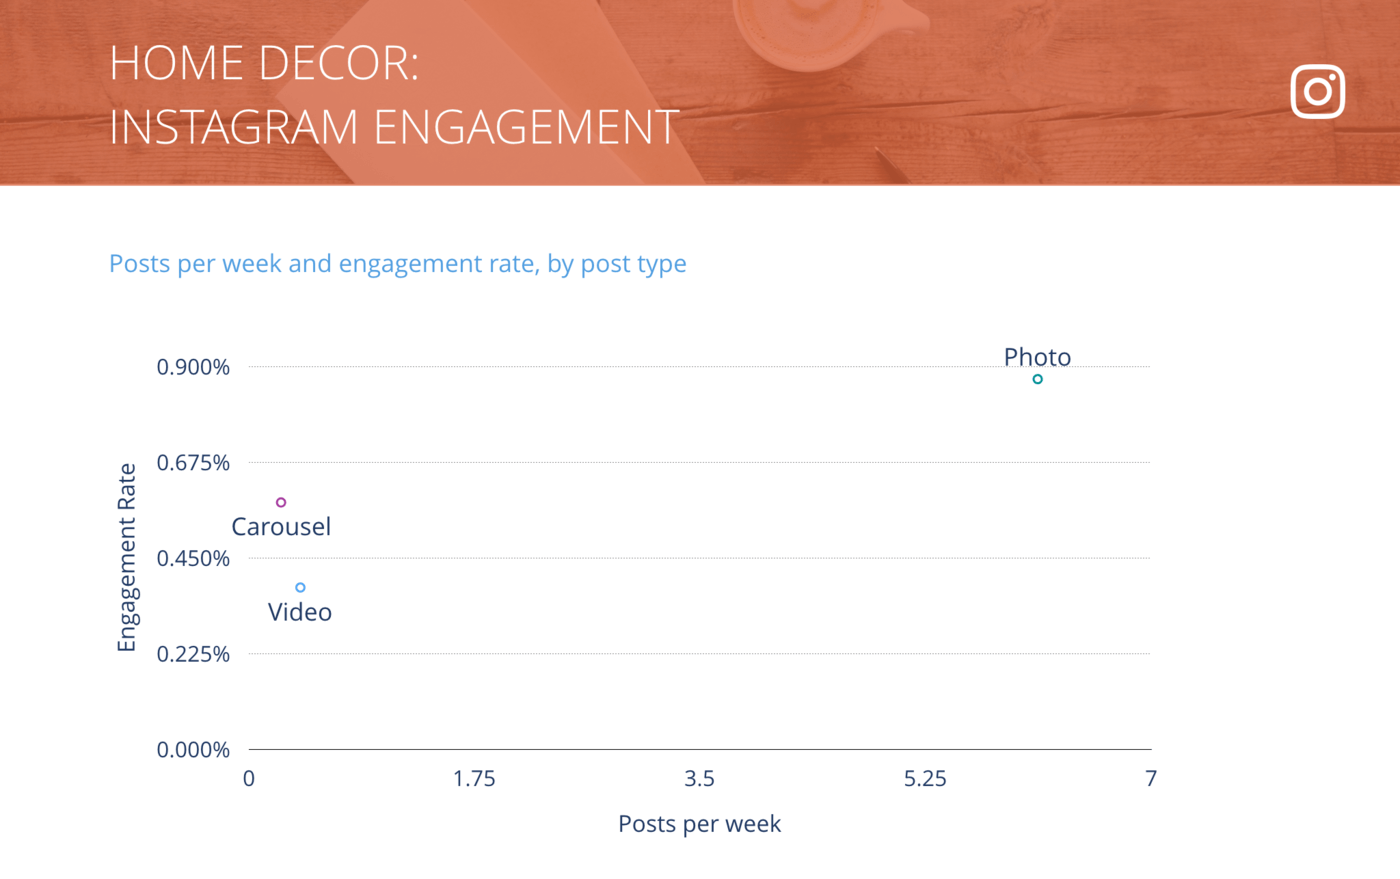
Instagram Posts per Week vs. Engagement Rate per Post, Home Decor
Home Decor brands are concentrating Instagram efforts on photos, which drive the best engagement on this channel.
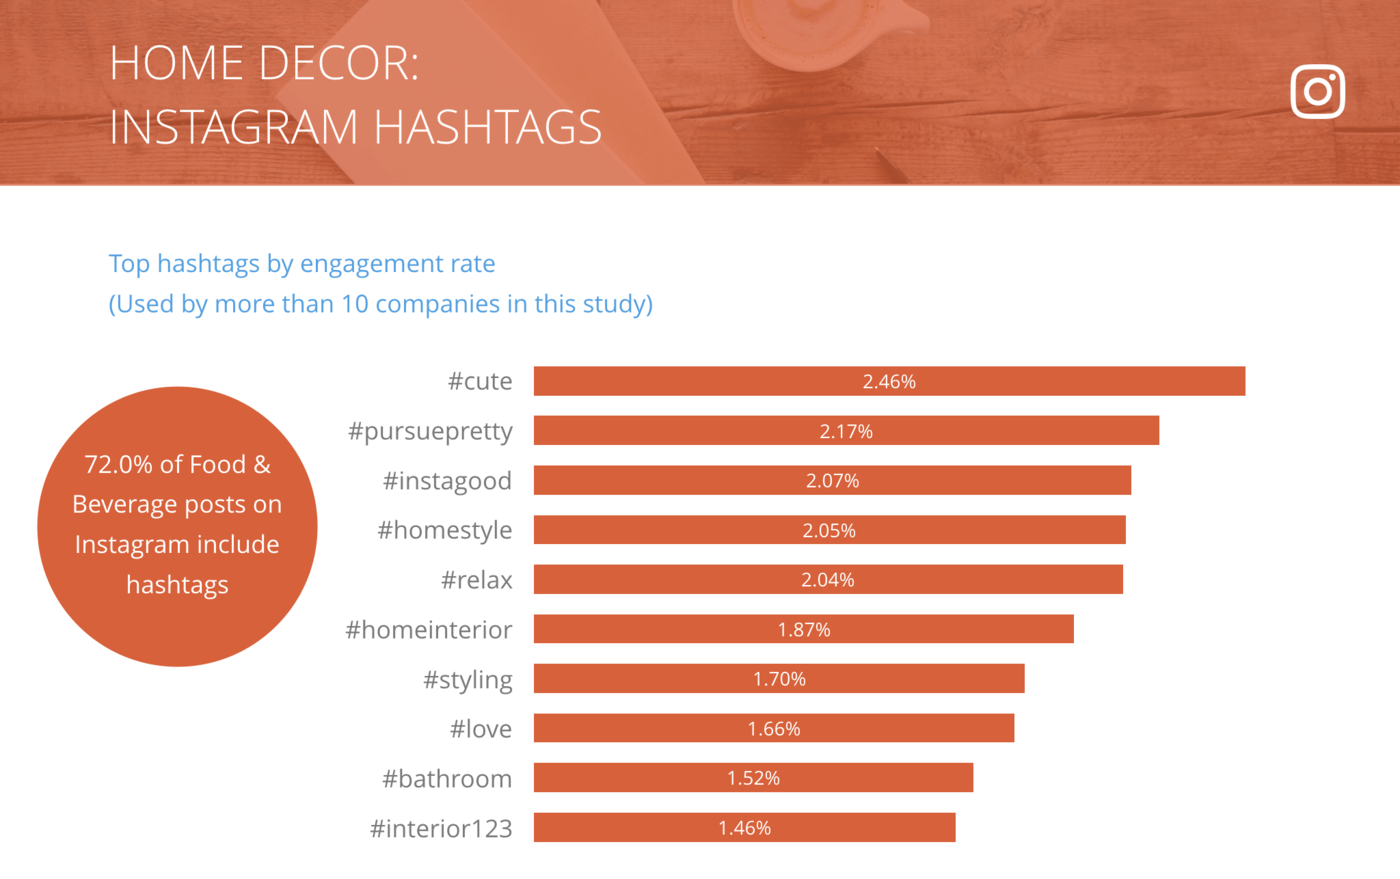
Instagram Top Hashtags by Engagement Rate per Post, Home Decor
With just two thirds of Home Decor brands including hashtags on Instagram posts, there’s room for improvement in seeking out and using the right hashtags.
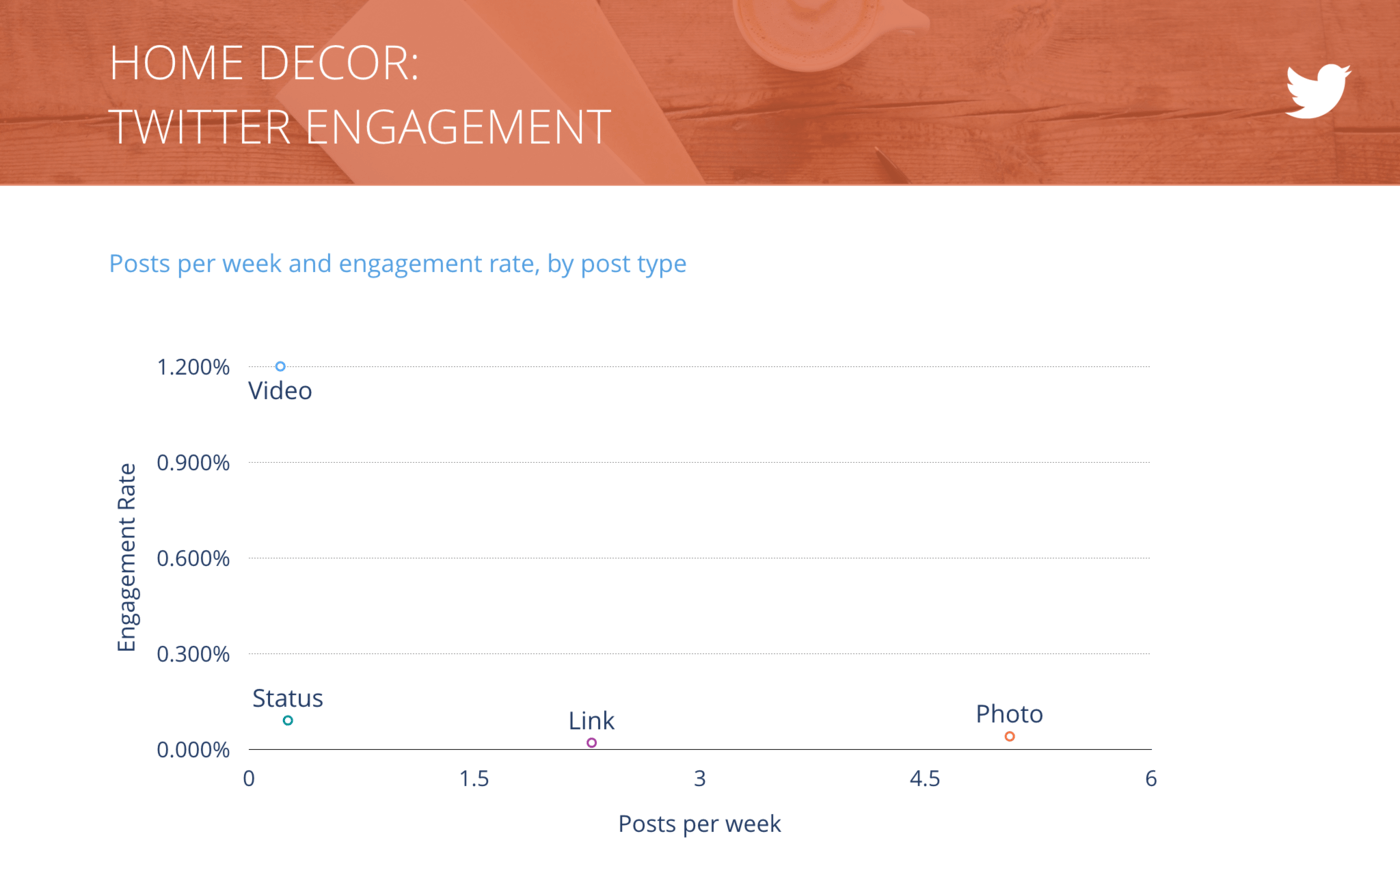
Tweets per Week vs. Engagement Rate per Tweet, Home Decor
Photos perform well on Facebook and poorly on Twitter for Home Decor, so decrease photo frequency on Twitter and focus on videos.
Industry Snapshot: Hotels and Resorts
Hotels and Resorts boasted the highest Twitter engagement of any industry we surveyed, and ranked high for both Facebook and Instagram engagement as well. Customers are eager to engage with these brands from home to browse amenities and take advantage of responsive customer service before booking their next vacation.
A few suggestions to keep up the social momentum:
- Invest in more video to take advantage of hunger for this posting type across all channels
- Keep using hashtags, which see strong engagement in this industry
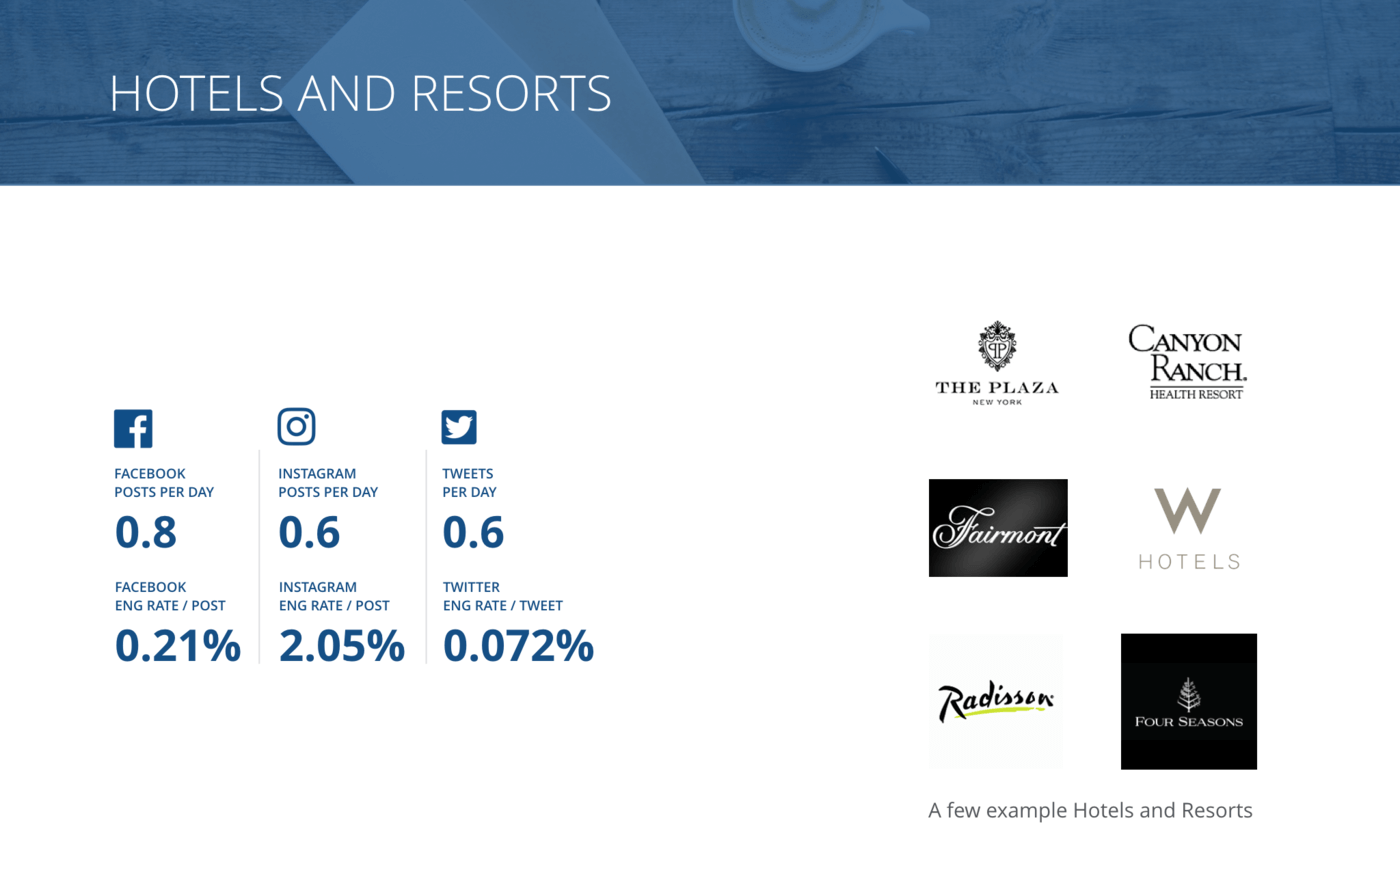
Overview of all benchmarks, Hotels & Resorts
We included The Plaza, The Fairmont, Radisson, and many more Hotels & Resorts in our sample.
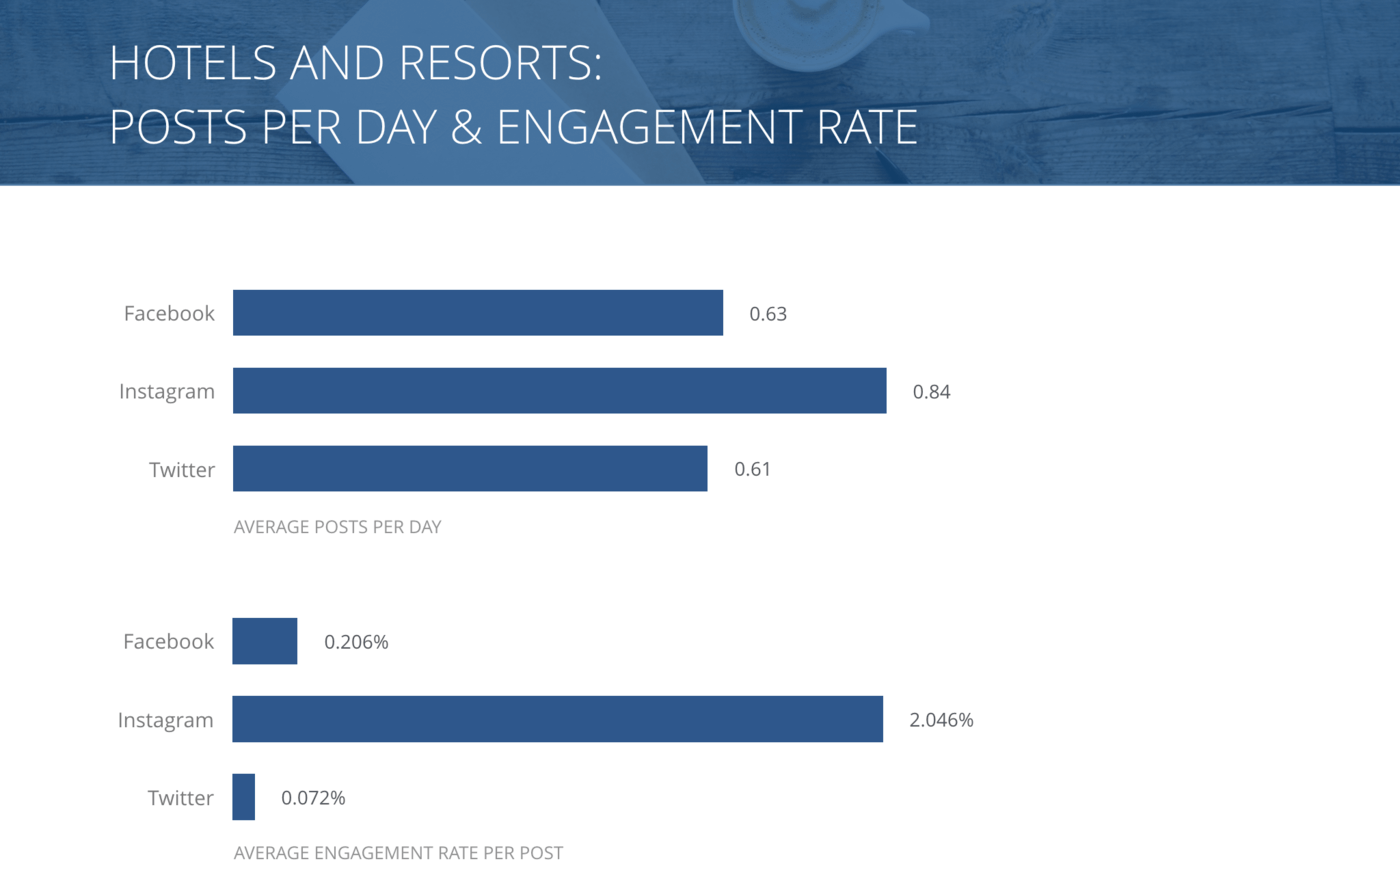
Posts per Day and Engagement Rate per Post, Hotels & Resorts
Hotels and Resorts are making the most of high engagement rates on Instagram by posting most often to that channel.
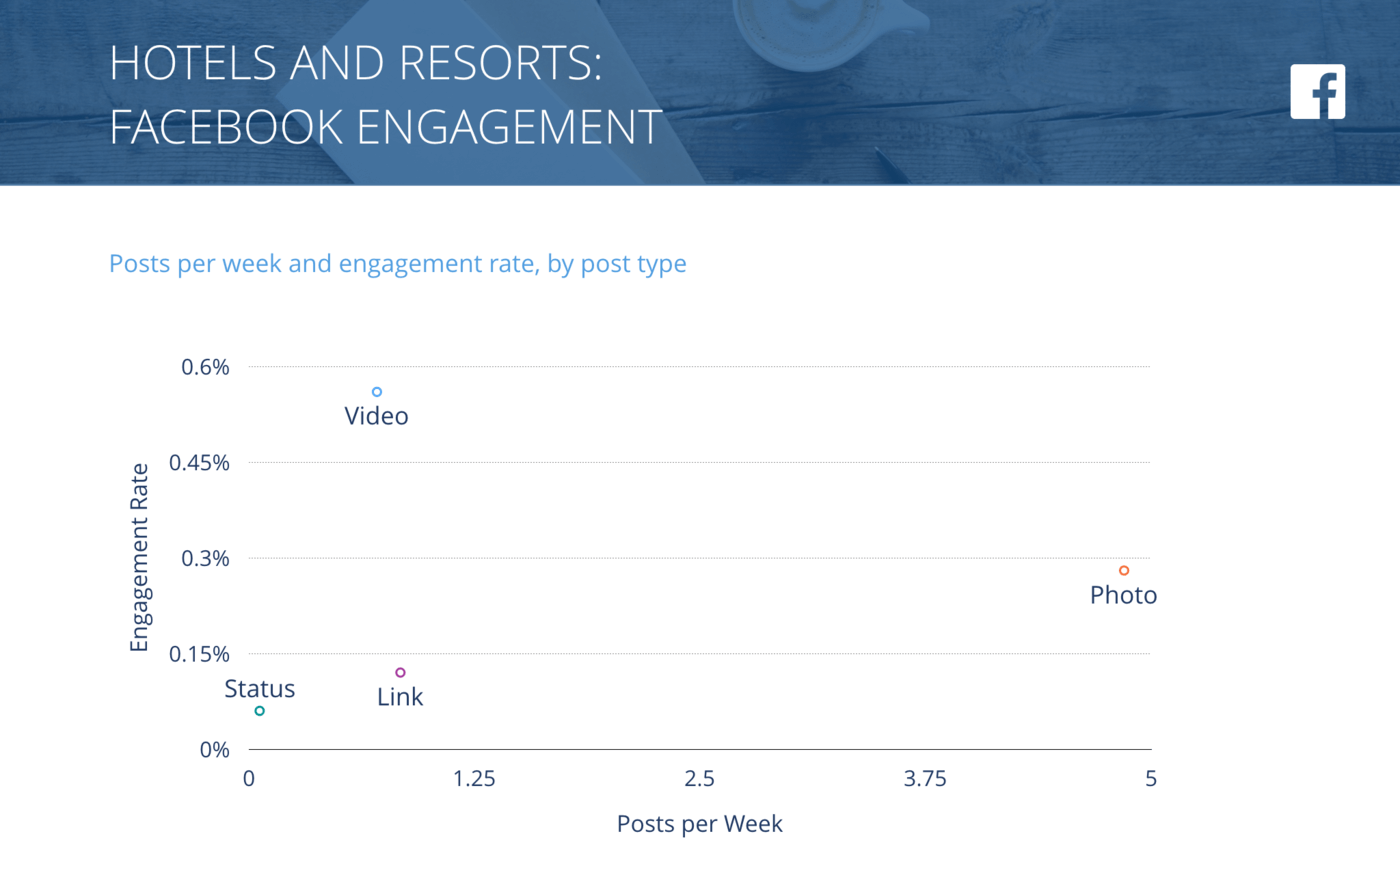
Facebook Posts per Week vs. Engagement Rate per Post, Hotels & Resorts
Visual posts fare best on Facebook for Hotels and Resorts–no surprise for such a visual industry.
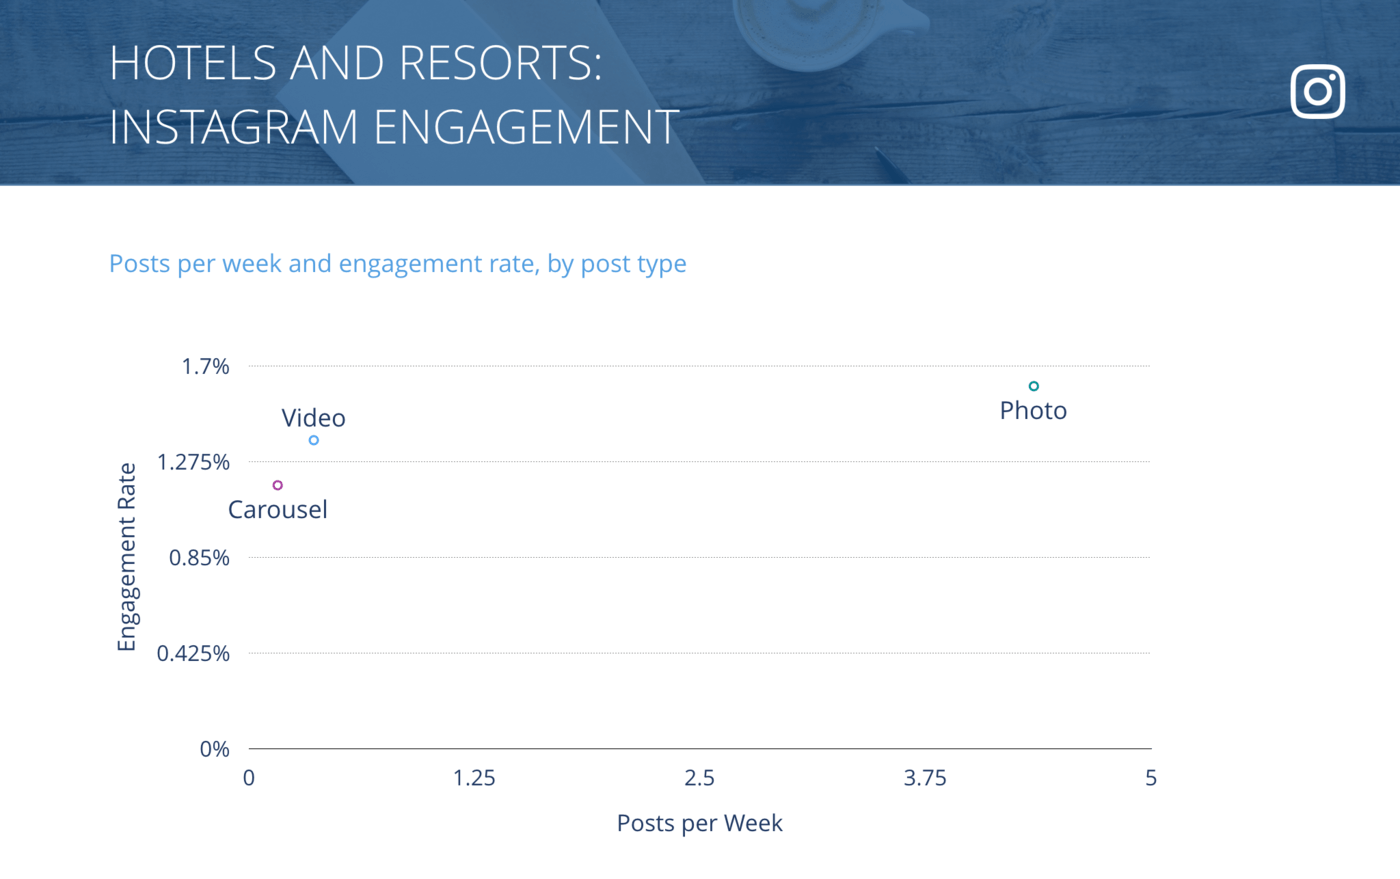
Instagram Posts per Week vs. Engagement Rate per Post, Hotels & Resorts
As with most industries surveyed, photos did best on Instagram, but video is a top performer here as well.
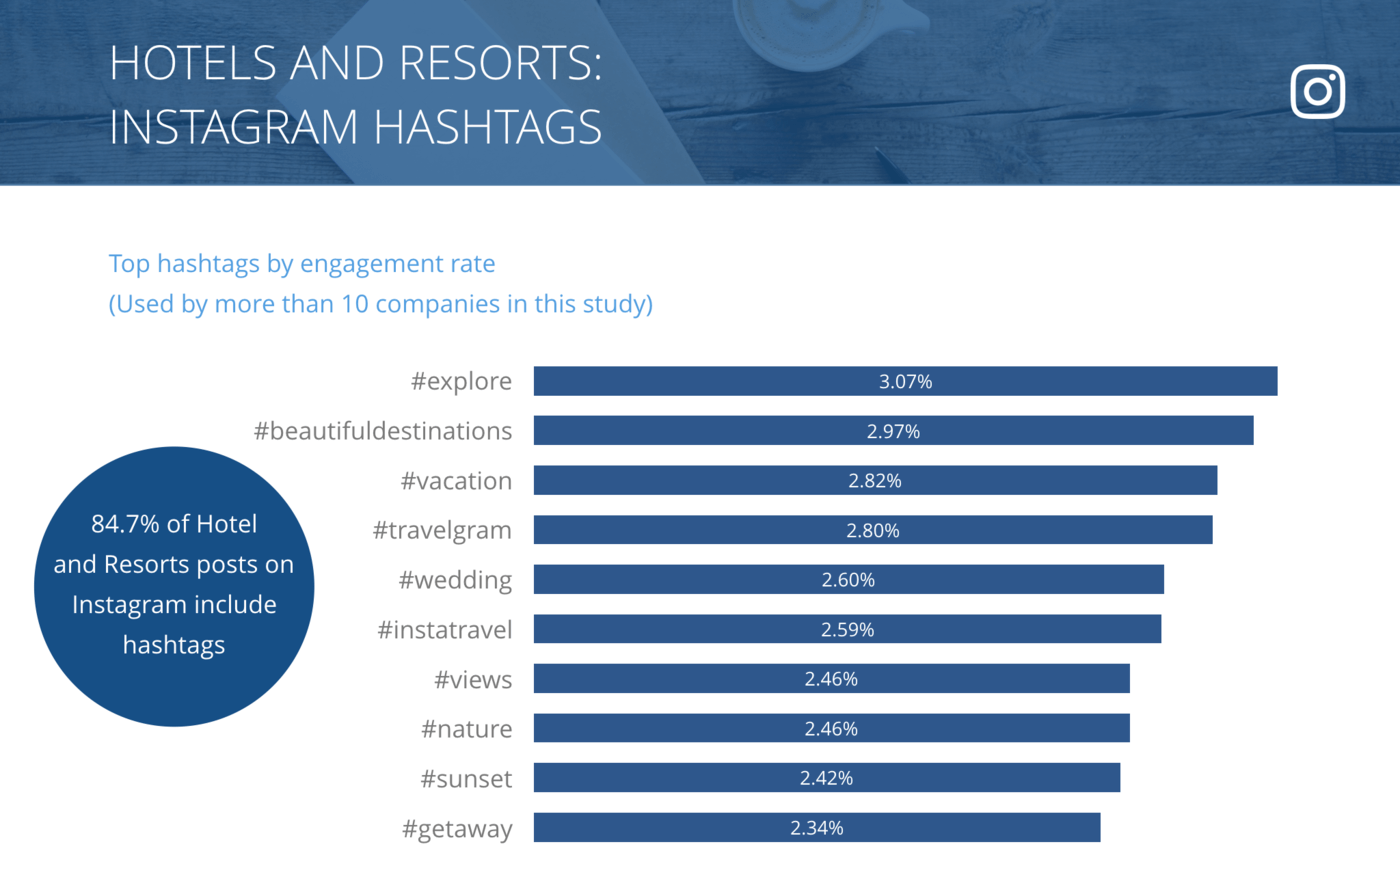
Instagram Top Hashtags by Engagement Rate per Post, Hotels & Resorts
Hotels and Resorts make the most of hashtags that help their customers get into the vacation mindset: #explore, #beautifuldestinations, and #vacation fared well.
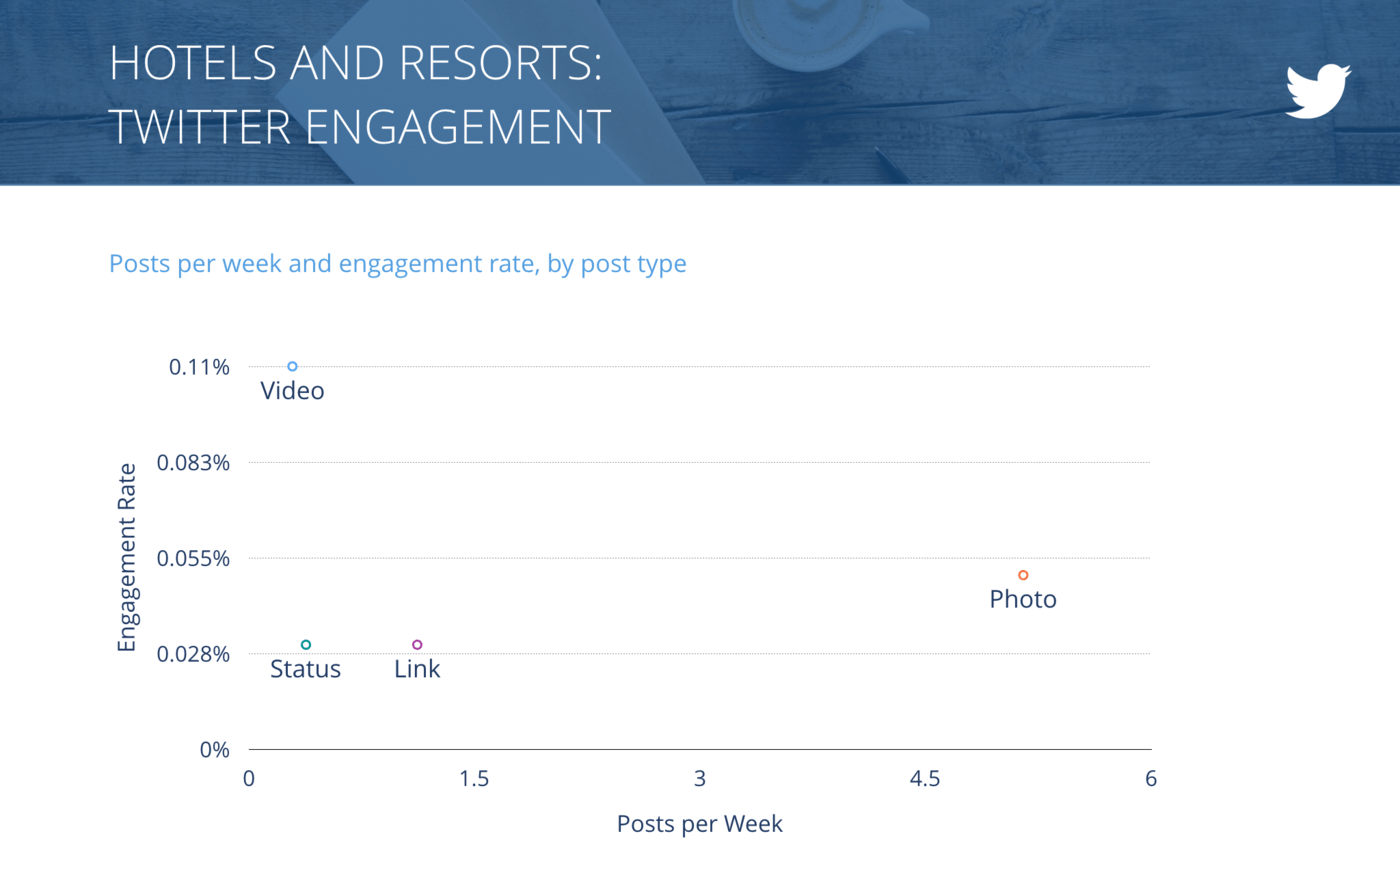
Tweets per Week vs. Engagement Rate per Tweet, Hotels & Resorts
Hotels and Resorts saw stellar video engagement on Twitter, which is a great place to focus content efforts in the coming year.
Industry Snapshot: Influencers
Influencers find success with video on Facebook, where they invest their resources to post over three videos a week. Unfortunately, the belief that Influencers garner high engagement on Instagram is false—getting just over an average engagement rate.
Based on this study, there are two opportunities that could improve that engagement rate:
- Increase status updates for Twitter
- Utilize hashtags more frequently on Instagram
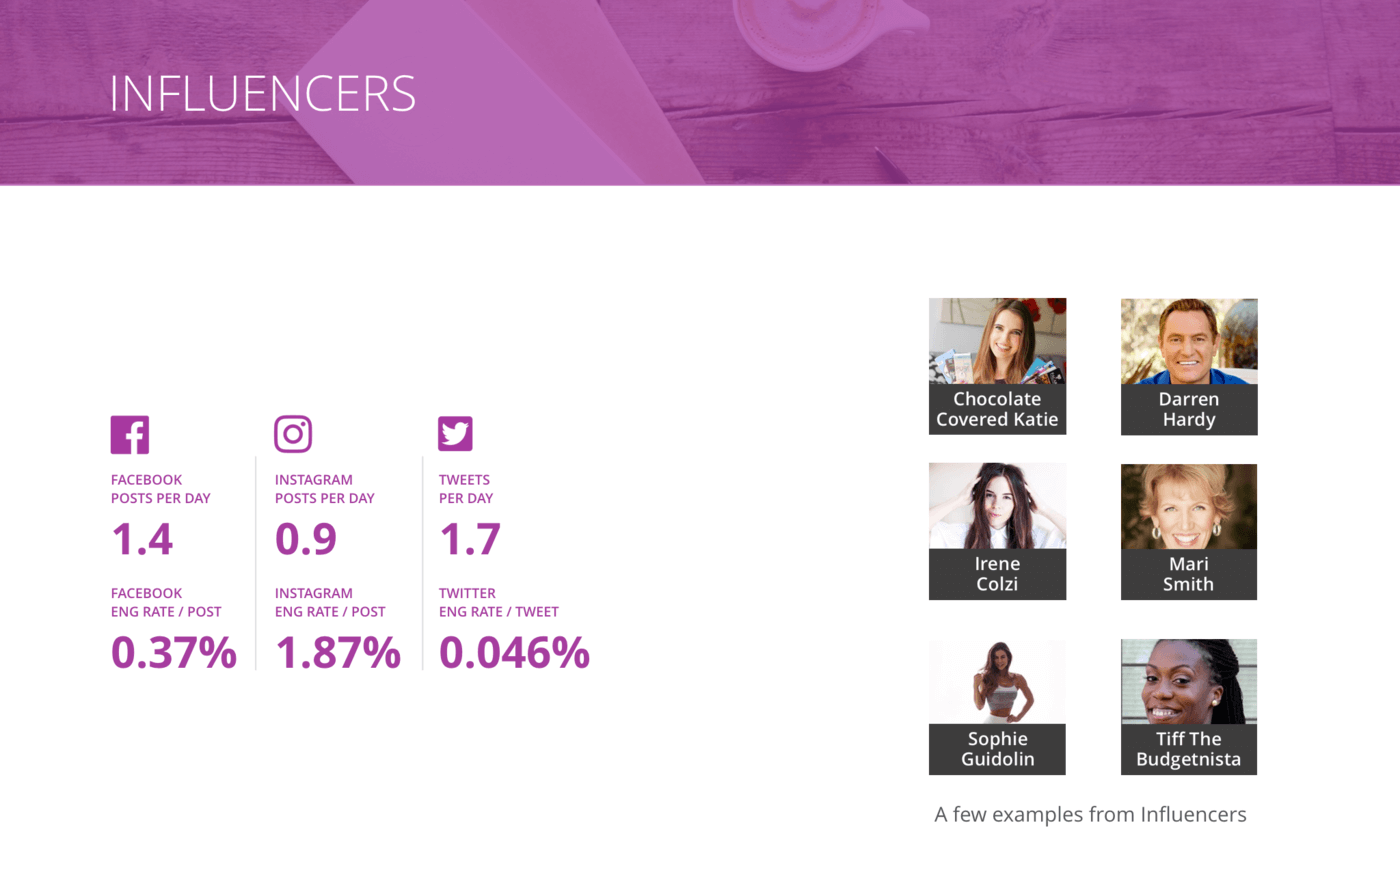
Overview of all benchmarks, Influencers
Chocolate Covered Katie, Darren Hardy, and Tiff the Budgetnista are a few of the Influencers we included in our sample.
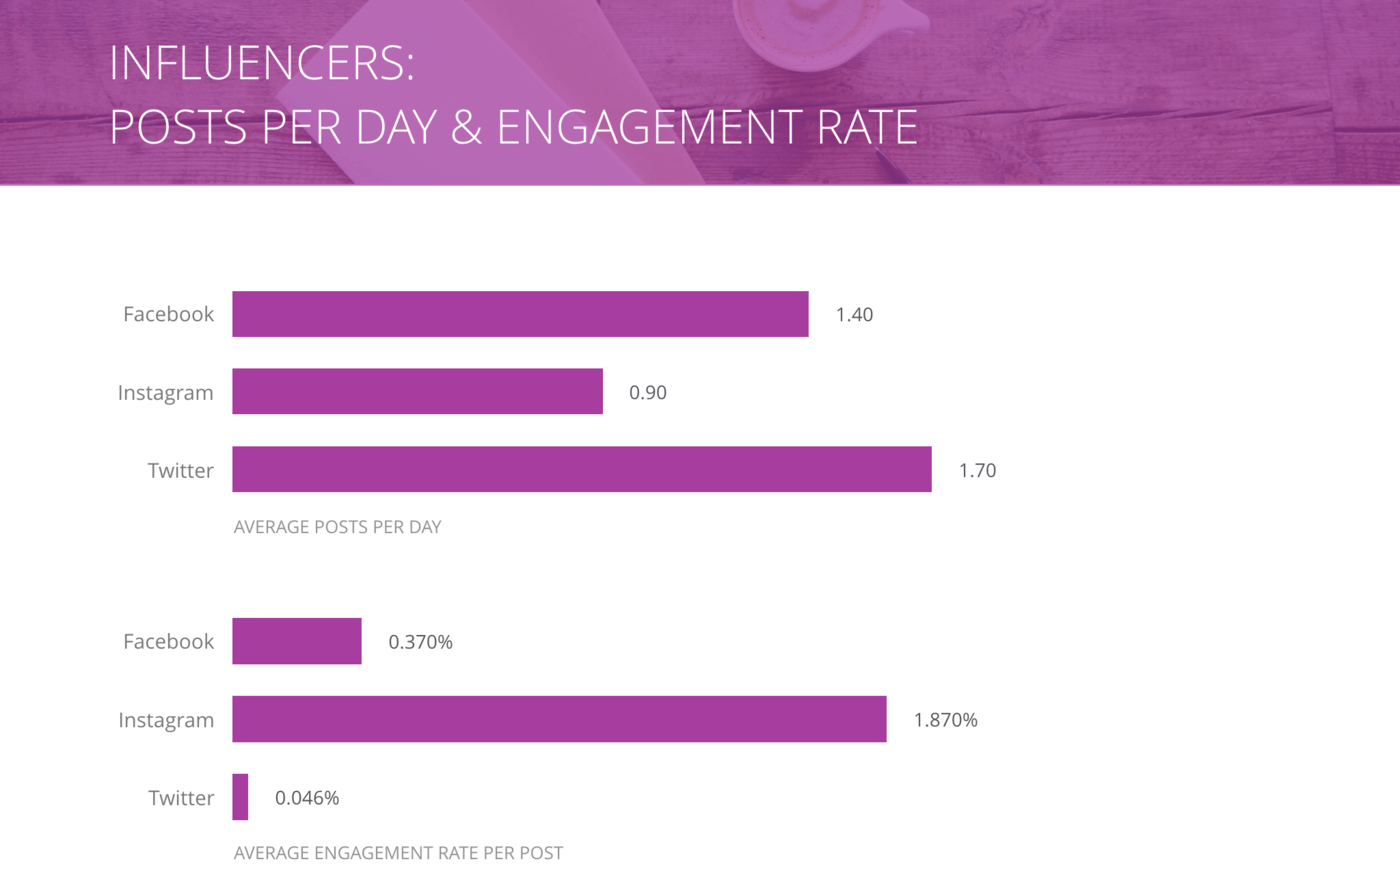
Posts per Day and Engagement Rate per Post, Influencers
Influencers rank highest alongside Food & Beverages for Facebook engagement despite posting more frequently.
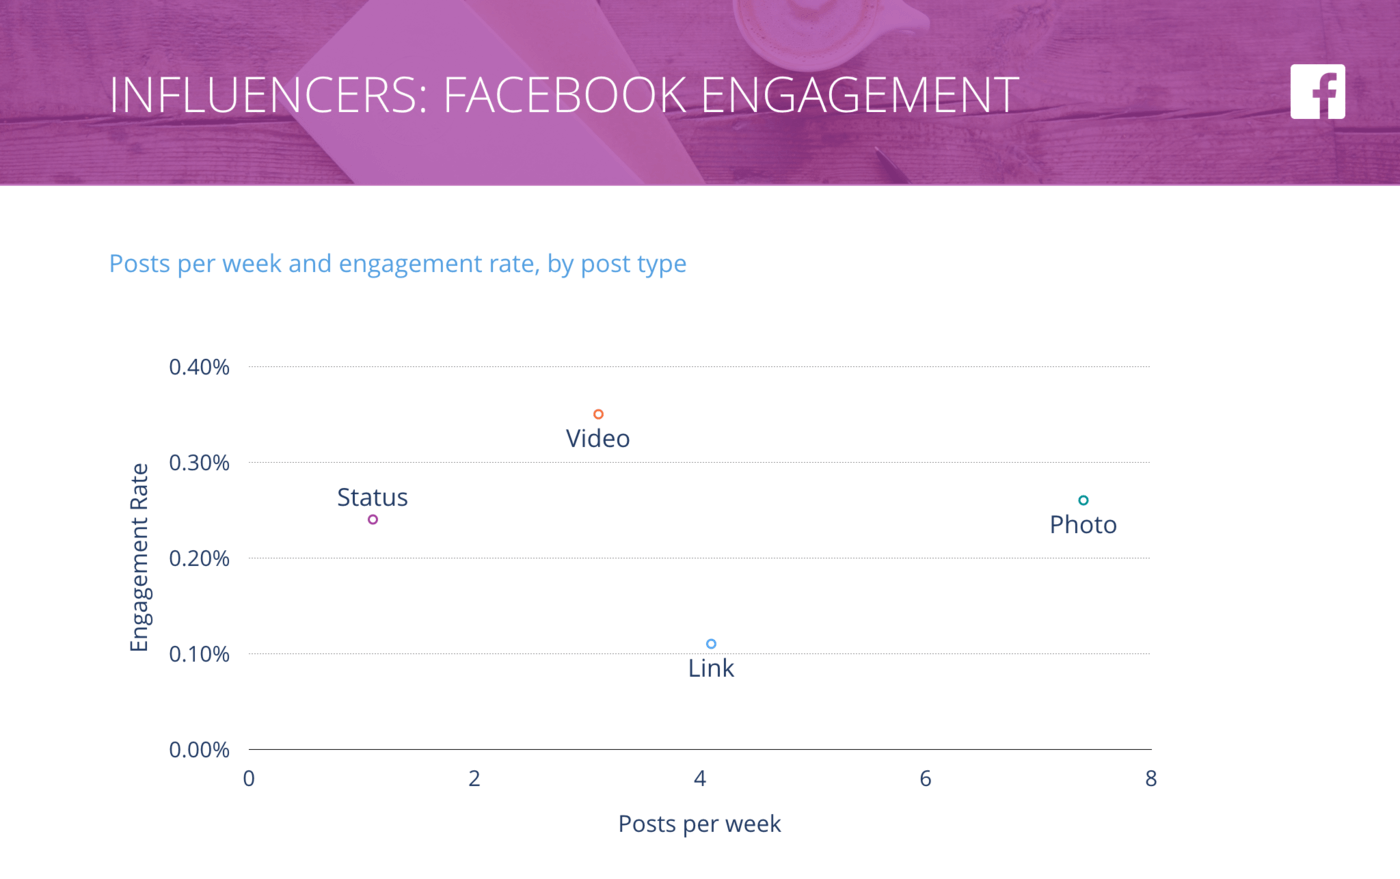
Facebook Posts per Week vs. Engagement Rate per Post, Influencers
Video drives the highest engagement for Influencers, which may explain why the claims that video performs best still circulate, despite engagement not always reflecting that in other industries.
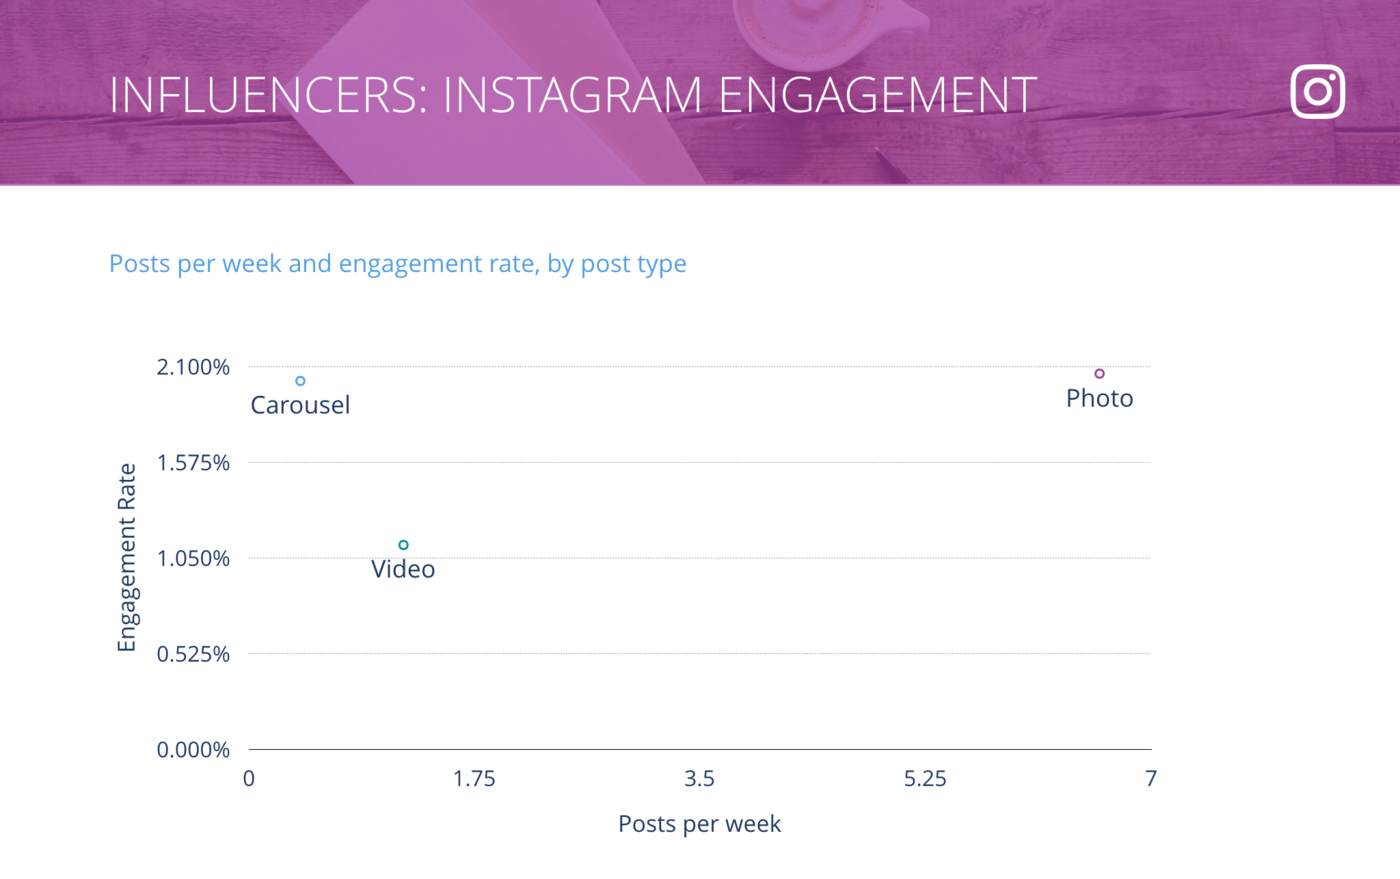
Instagram Posts per Week vs. Engagement Rate per Post, Influencers
Photo and carousel posts drive almost double the engagement for Influencers on Instagram as Video posts.
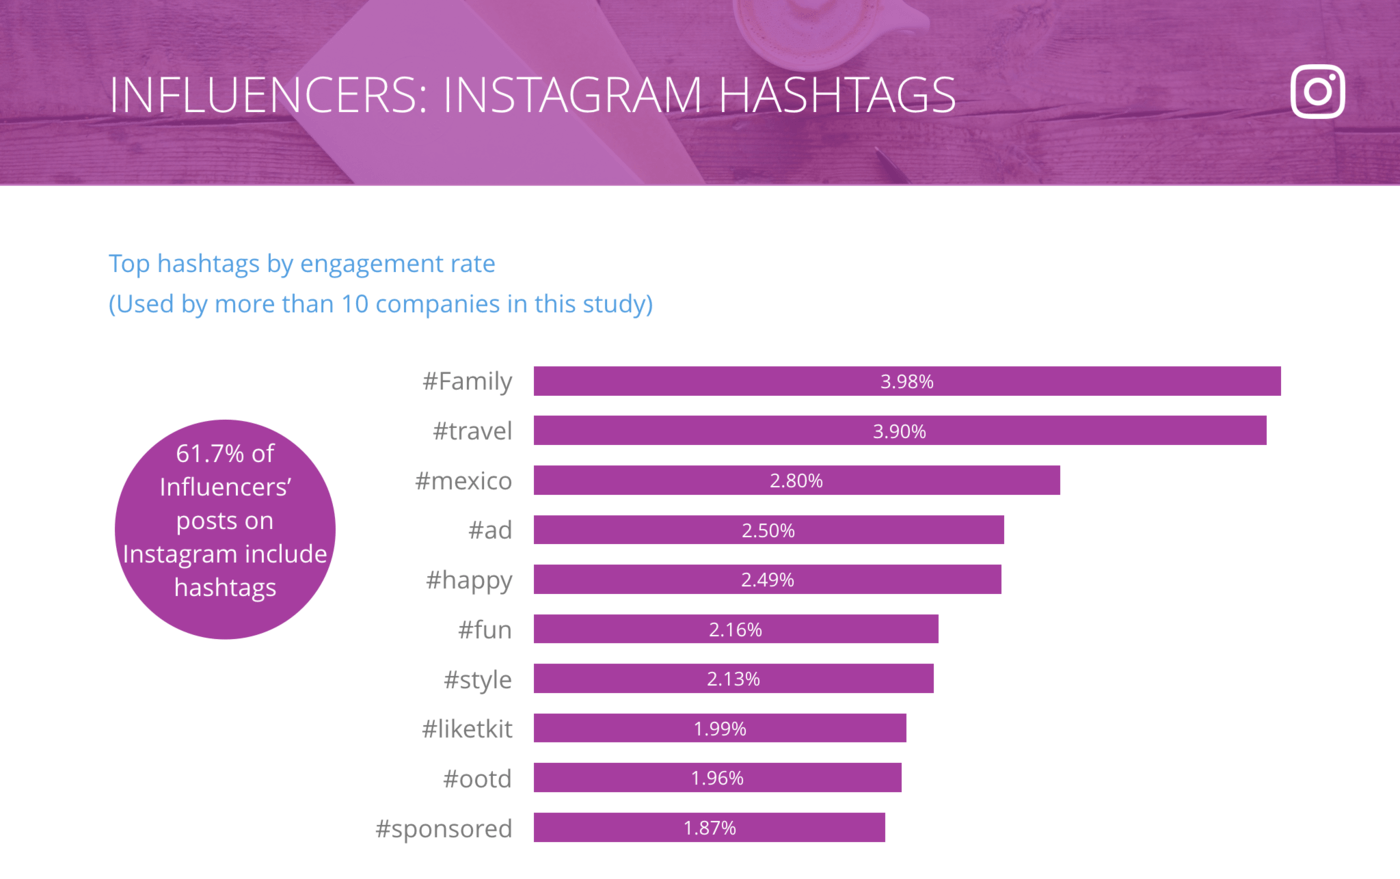
Instagram Top Hashtags by Engagement Rate per Post, Influencers
The FCC requires sponsored posts to be clearly identified as such. Though Influencers are not required to use the ad or sponsored hashtags, they often do. (And doing so doesn’t hurt engagement.)
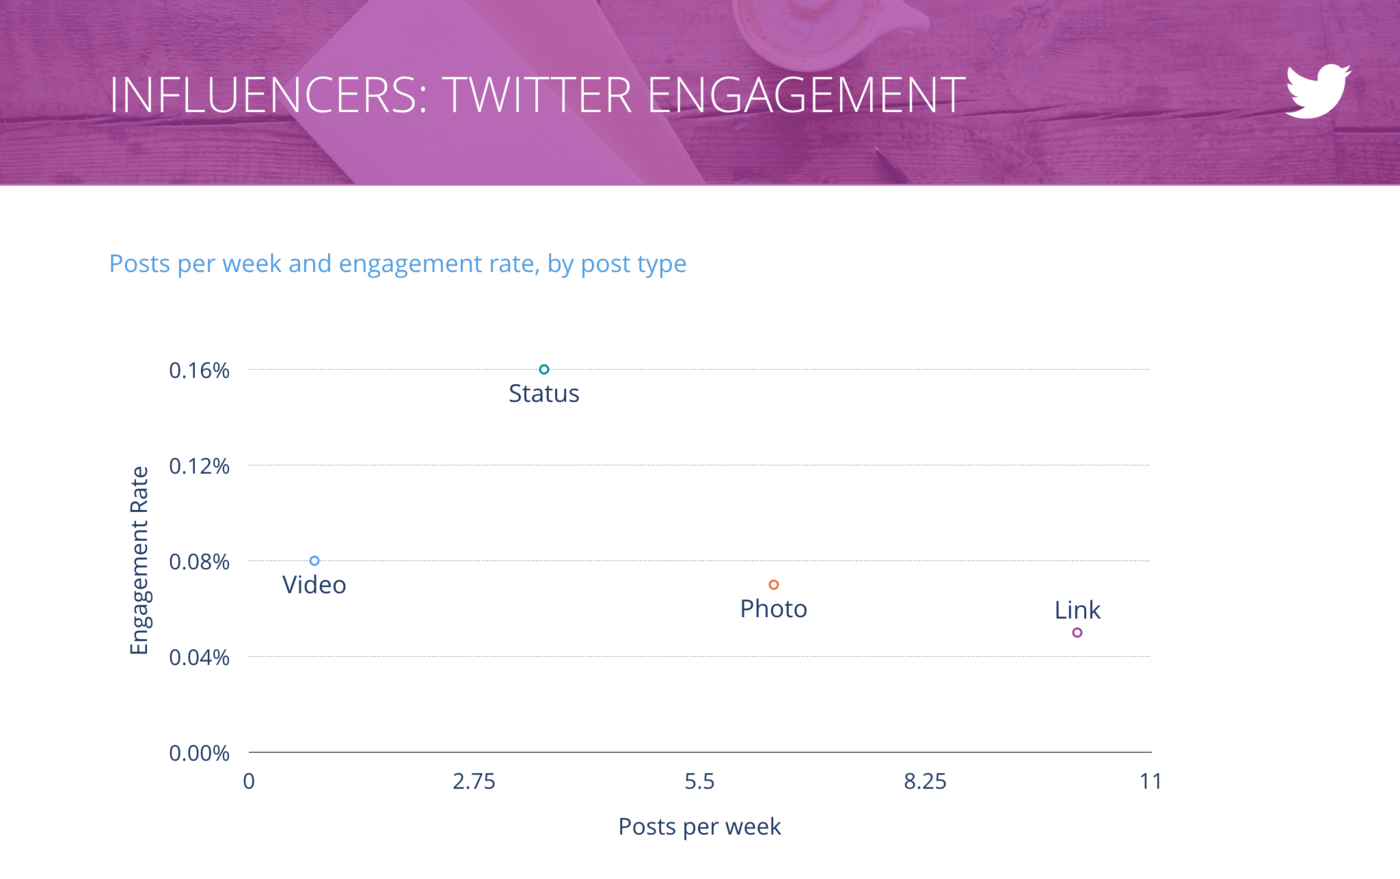
Tweets per Week vs. Engagement Rate per Tweet, Influencers
Influencers double their engagement with status posts on Twitter. Brands looking to collaborate with Influencers should note how low links perform in engagement, but that may not correlate with clicks.
Industry Snapshot: Media Companies
High posting frequency and low engagement rates that creep lower than last year’s study keep Media Companies at the lowest performance for both Facebook and Twitter.
While video doesn’t help every industry, for Media Companies the higher engagement says it all.
Based on this study, there are two opportunities that could improve that engagement rate:
- Increase investment in video and leverage across platforms
- Optimize link posts to encourage and enable sharing
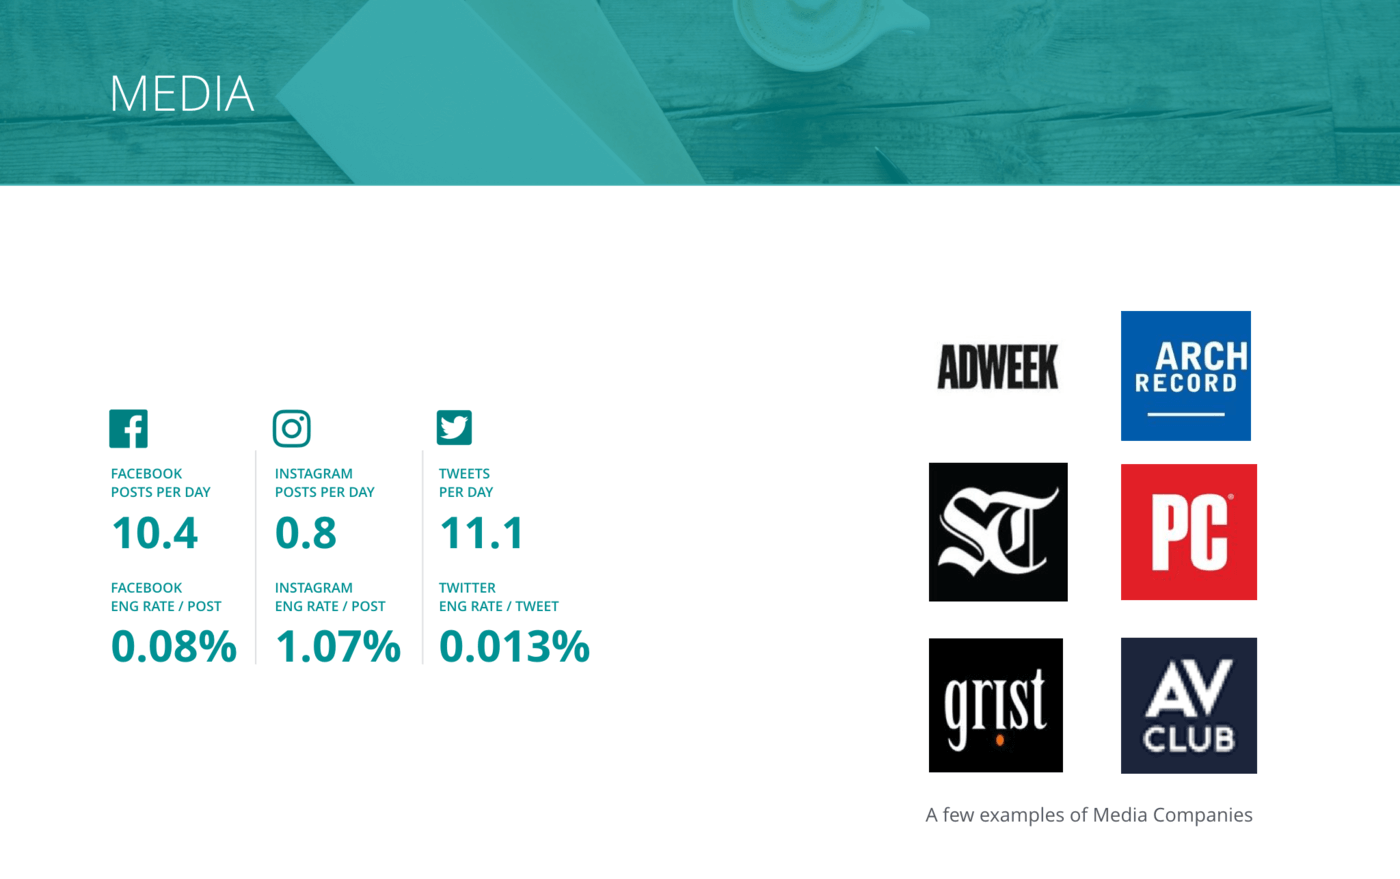
Overview of all benchmarks, Media Companies
Some of the notable examples in our sample of Media Companies include AdWeek, Arch Record, the Seattle Times, PC Magazine, Grist, and the AV Club.
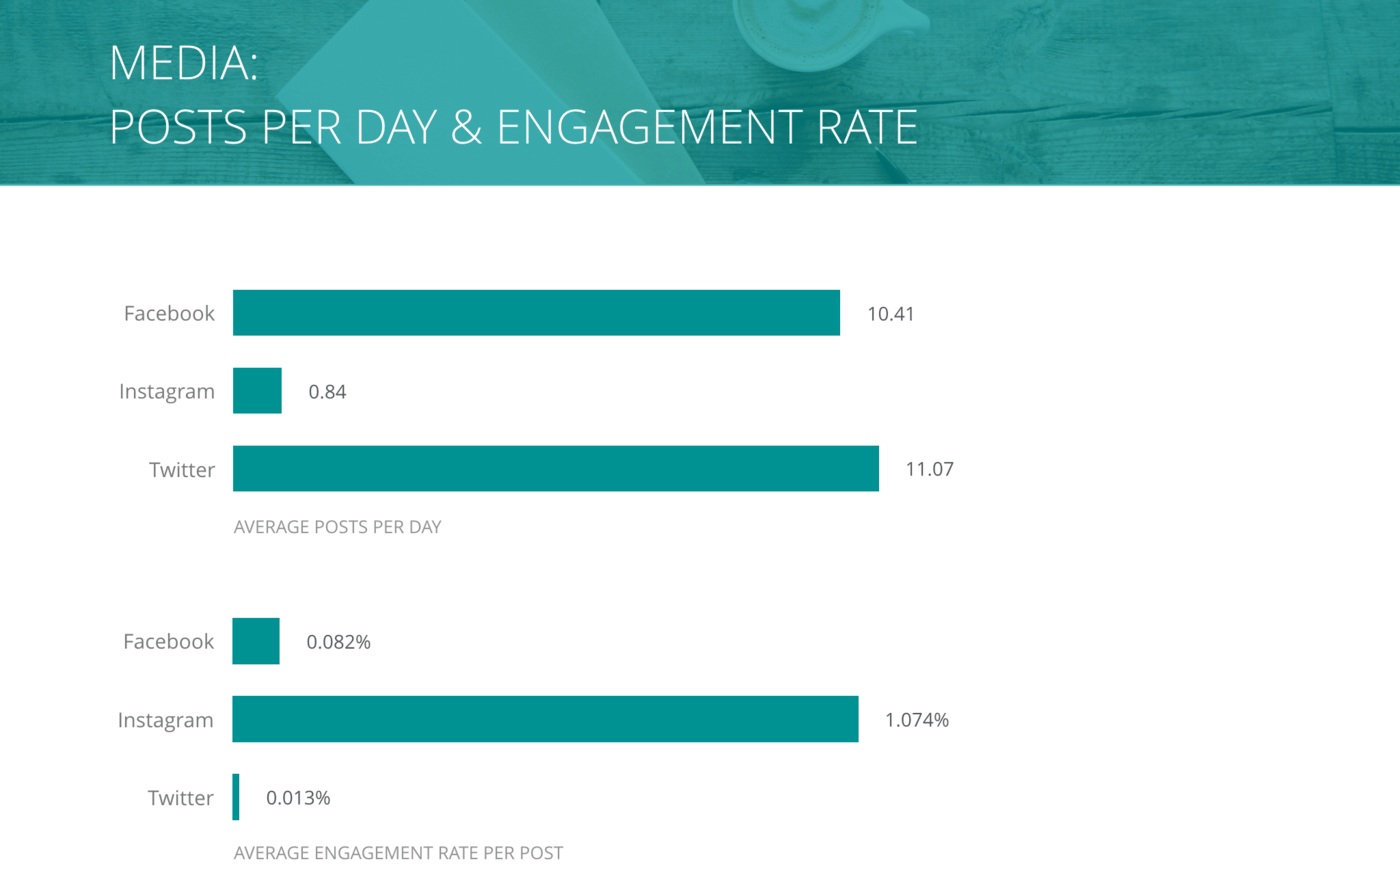
Posts per Day and Engagement Rate per Post, Media Companies
Media repeats last year’s performance with the lowest engagement rate and the highest frequency of posts on Twitter and Facebook.
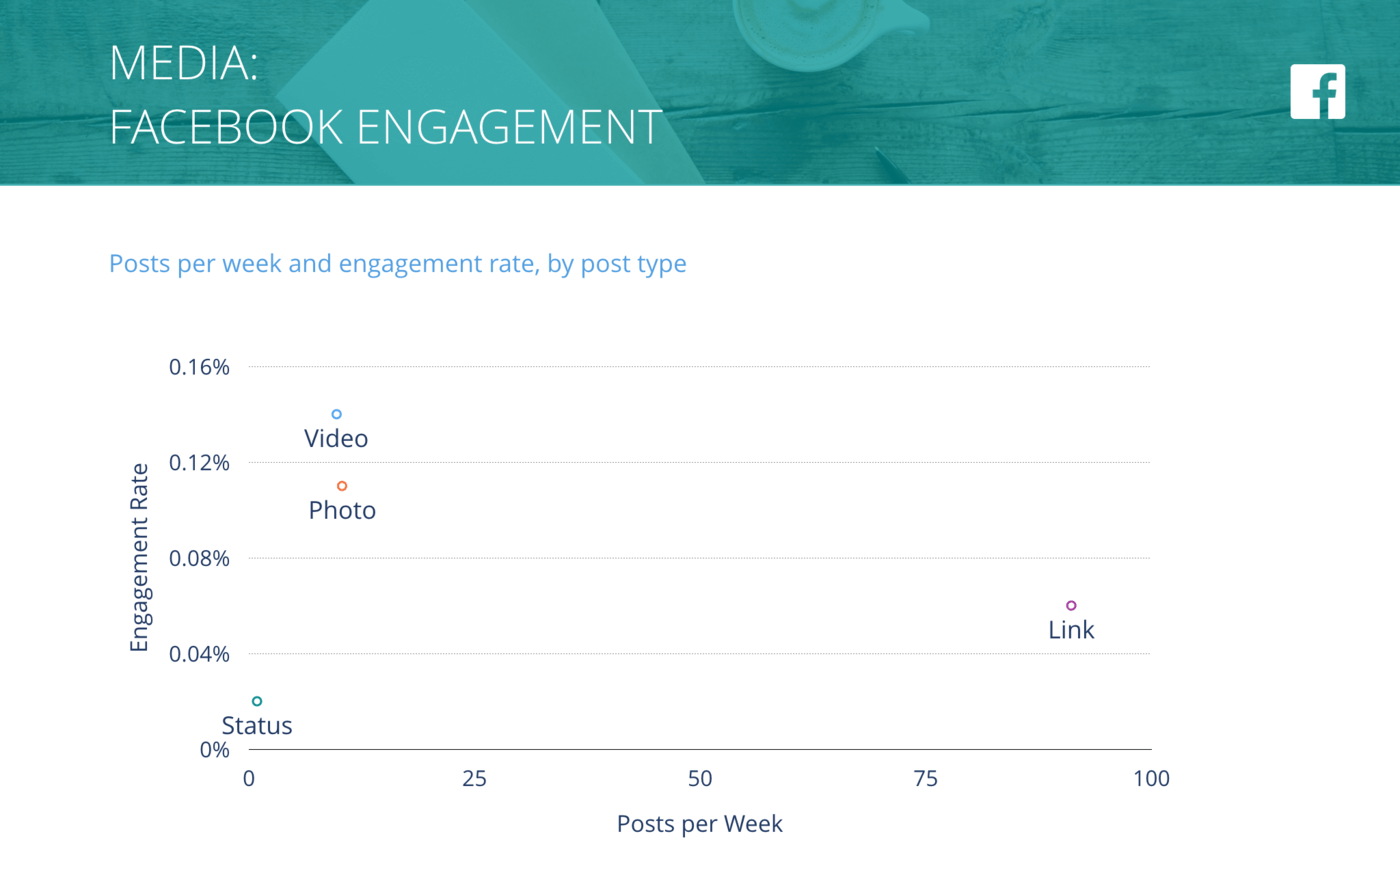
Facebook Posts per Week vs. Engagement Rate per Post, Media Companies
By optimizing content for sharing, which improves engagement, Media can increase the link post engagement rate.
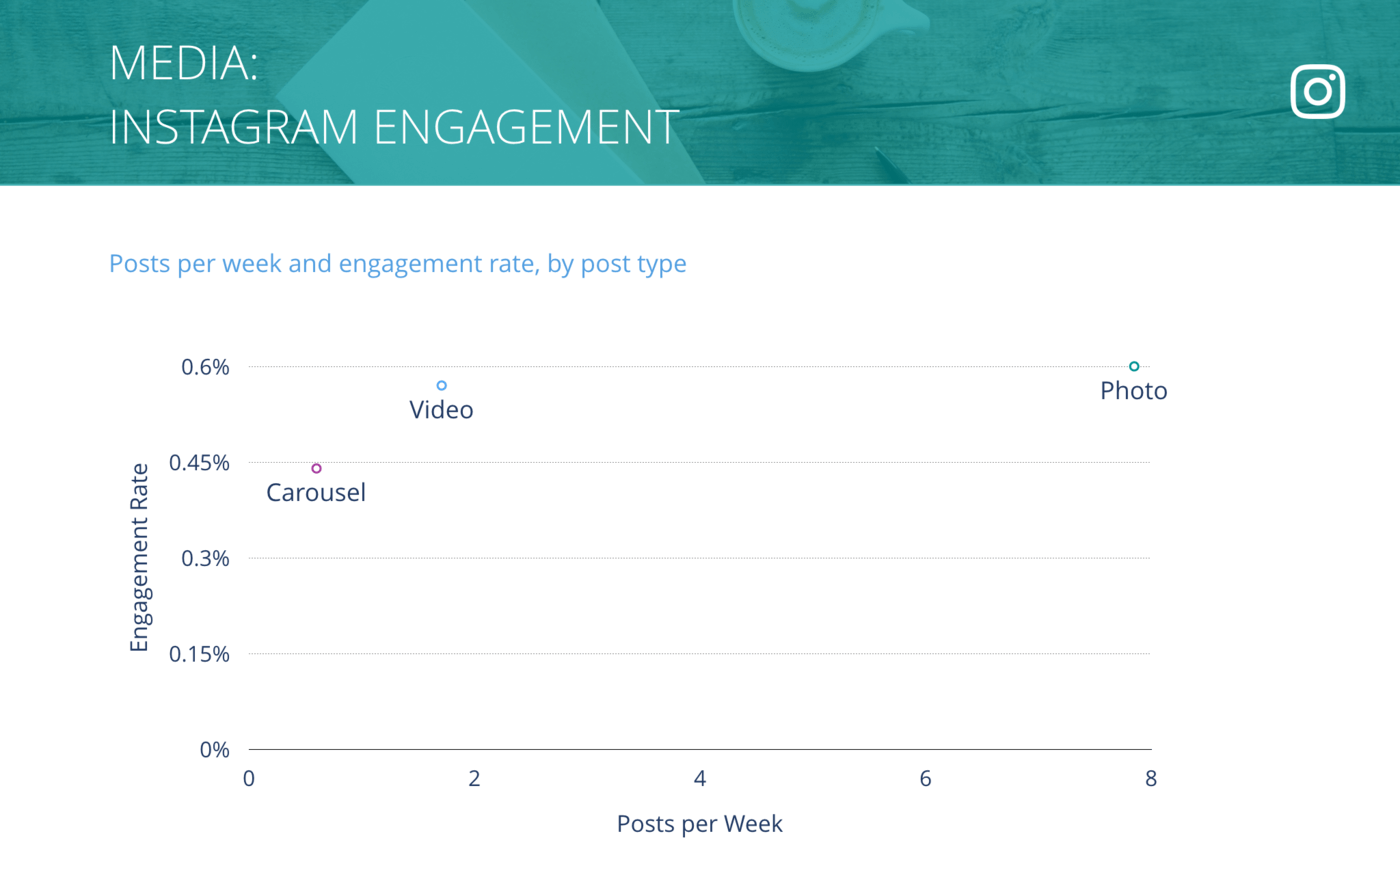
Instagram Posts per Week vs. Engagement Rate per Post, Media Companies
Like most industries, Media sees the highest engagement with Photos, but the difference between post types isn’t as striking.
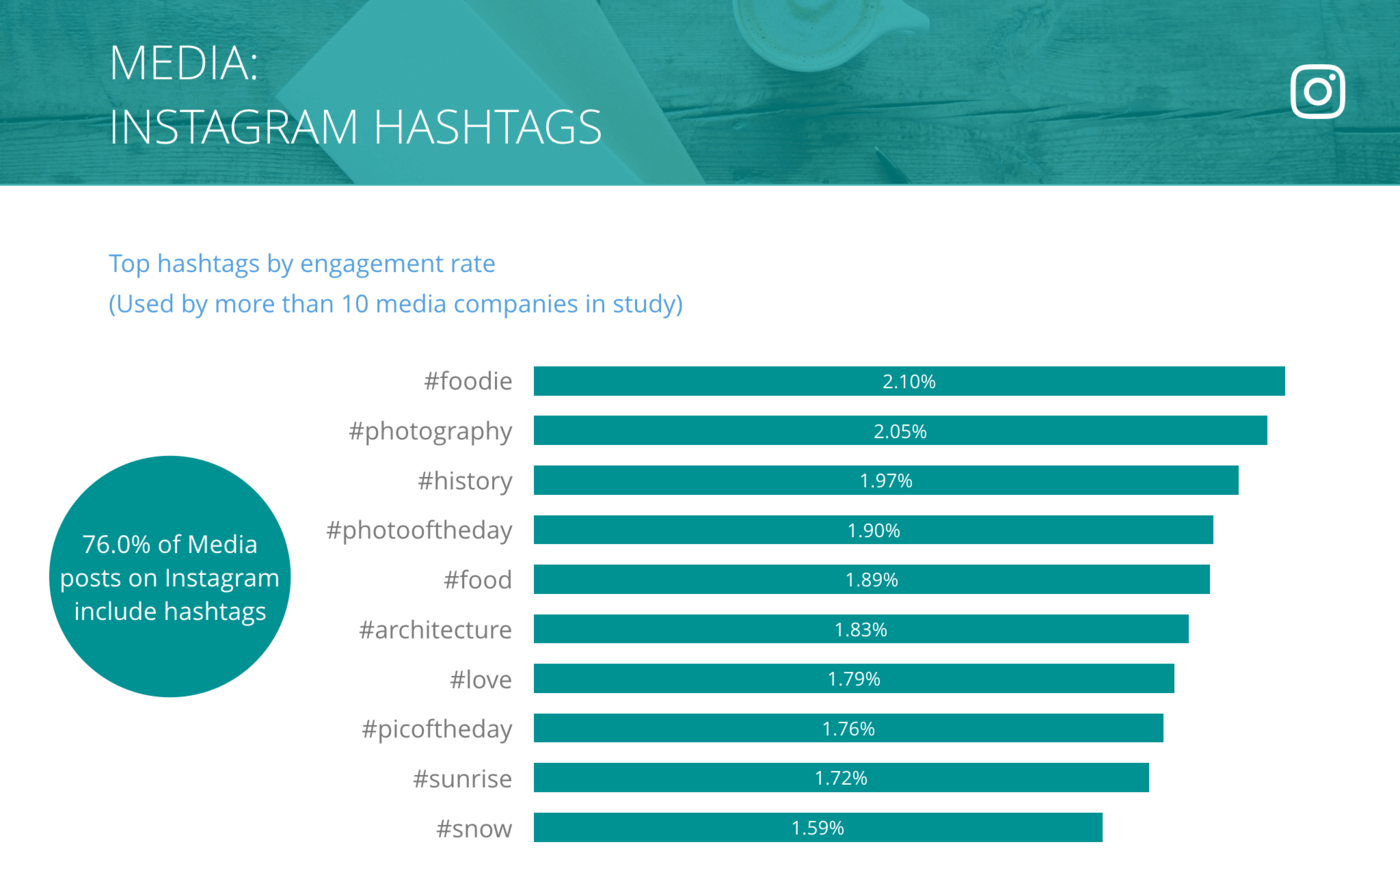
Instagram Top Hashtags by Engagement Rate per Post, Media Companies
Unlike last year, the top hashtags are less current event or weather related. As these hashtags reflect broad topics and content, this may be a tactic media companies utilize to reach beyond their followers.
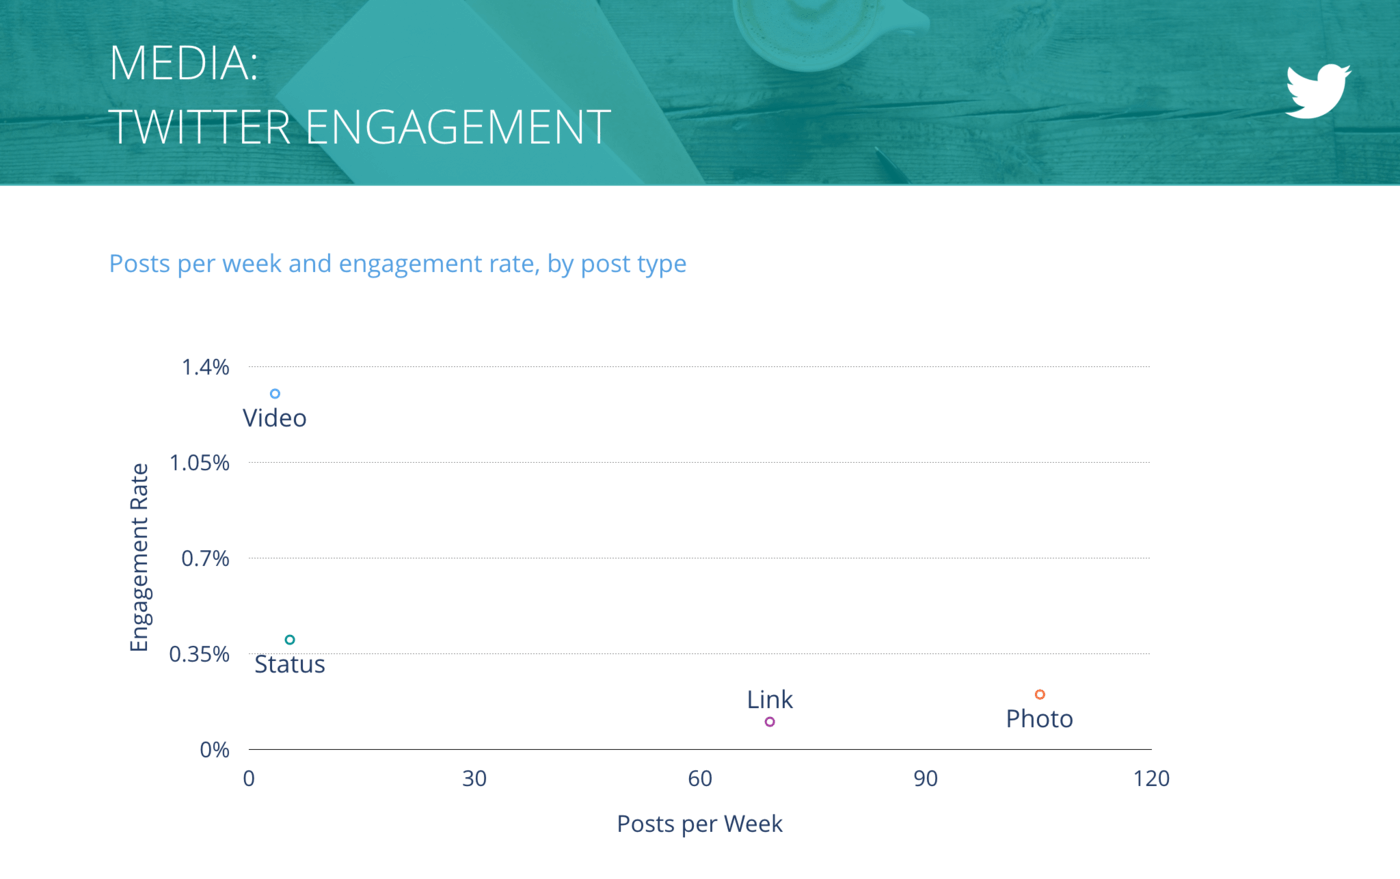
Tweets per Week vs. Engagement Rate per Tweet, Media Companies
Media should consider repurposing Facebook videos for Twitter since video outperforms all other types with over three times the engagement.
Industry Snapshot: Nonprofit Organizations
Nonprofits enjoyed serious engagement on Instagram in 2017, ranking third just behind Higher Ed and Nonprofit Organizations. Despite this Instagram success, Nonprofits are posting much less frequently here than on Facebook or Twitter.
Two areas for improvements for nonprofits:
- Focus on Instagram, even if it means diverting efforts away from Twitter
- Photos do best across all three channels, so be sure to show your story whenever possible
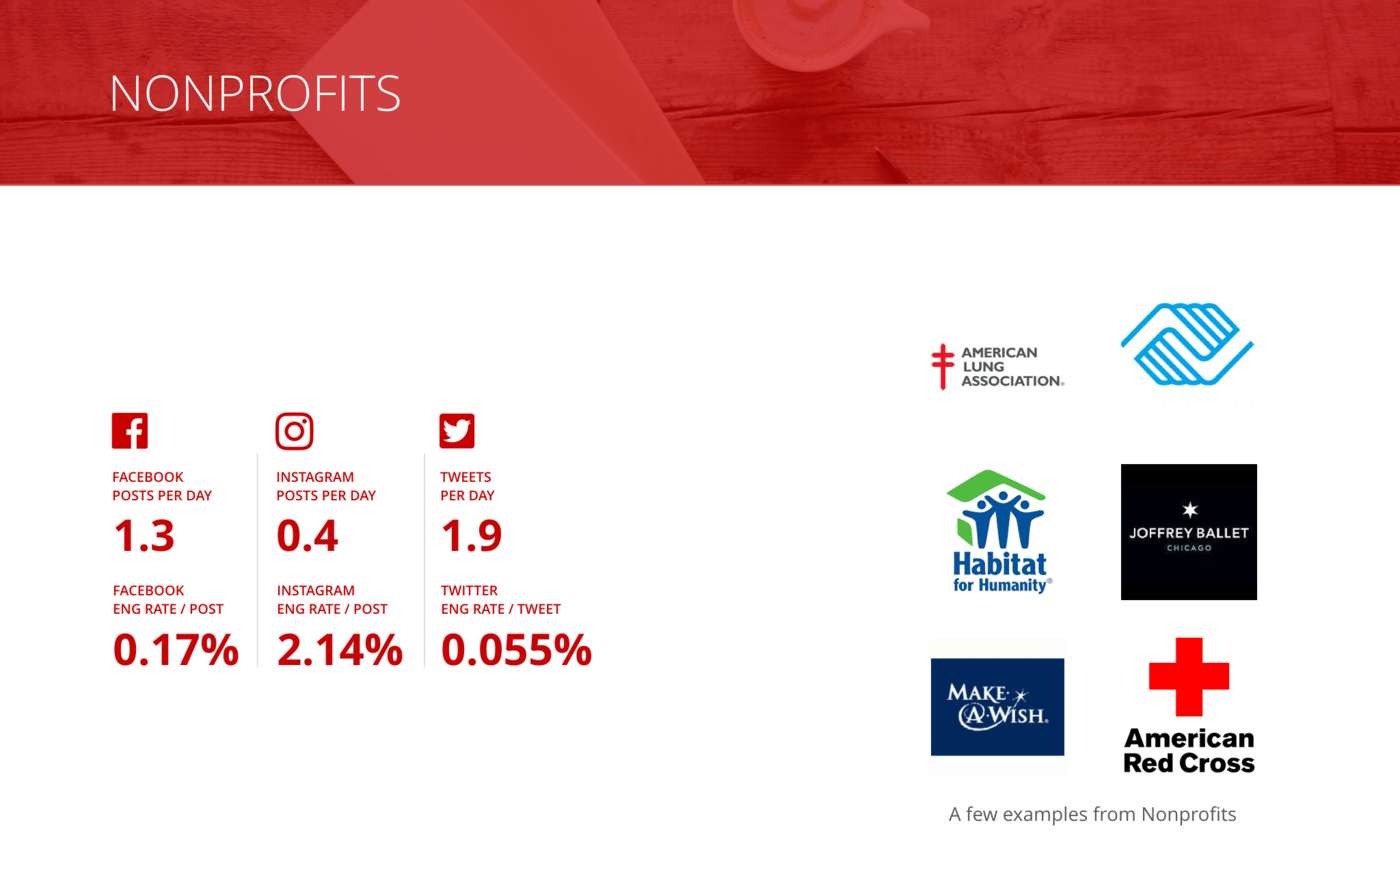
Overview of all benchmarks, Nonprofit Organizations
Some of the notable organizations in our sample of Nonprofits include the American Lung Association, the Boys and Girls Club, Habitat for Humanity, Joffrey Ballet, Make-a-Wish Foundation, and the American Red Cross.
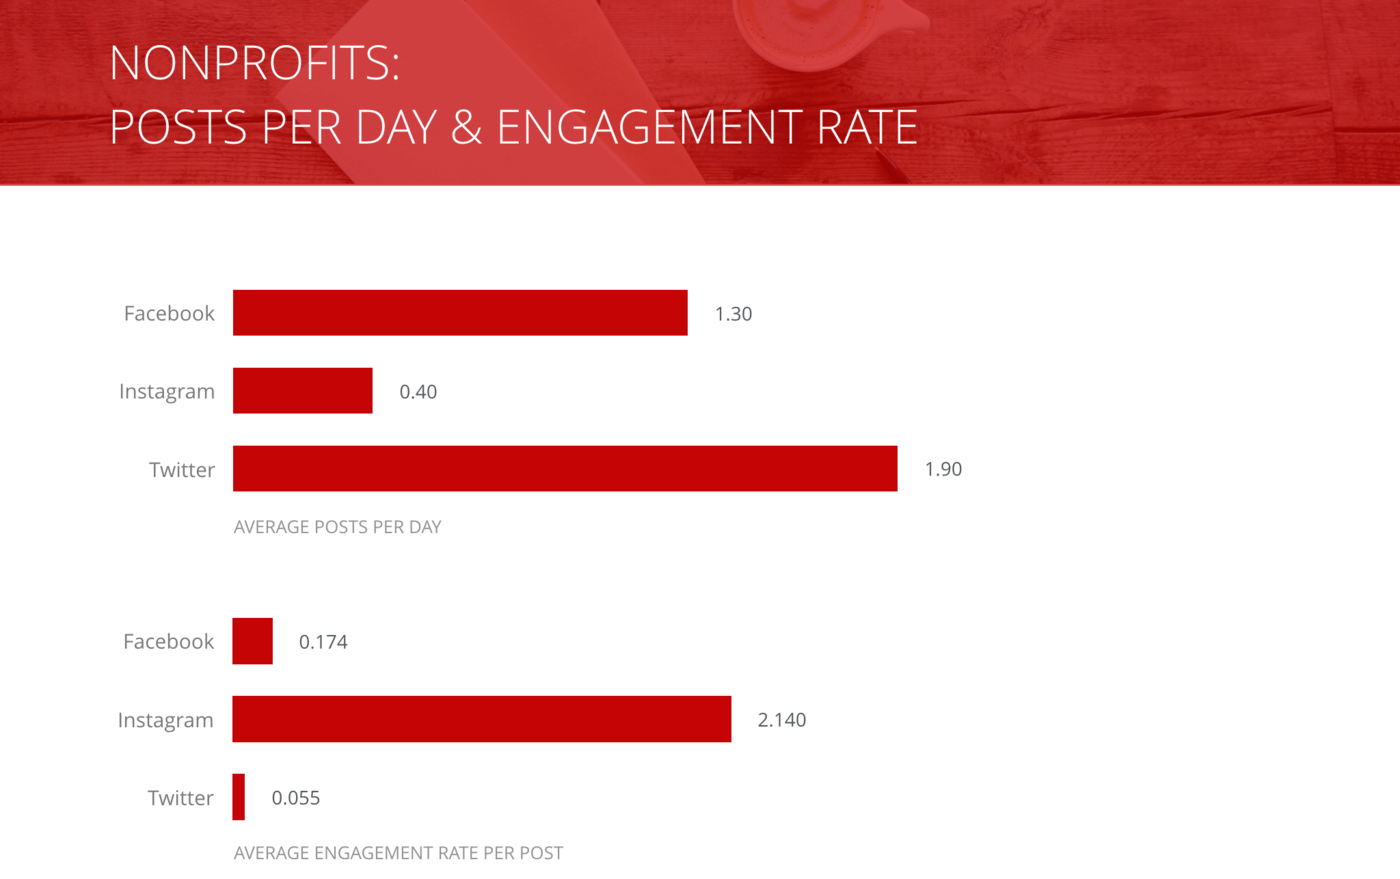
Posts per Day and Engagement Rate per Post, Nonprofit Organizations
Nonprofits have halved their Twitter posting frequency since last year, and haven’t seen any decline in engagement on that channel, suggesting a smart allocation of social resources.
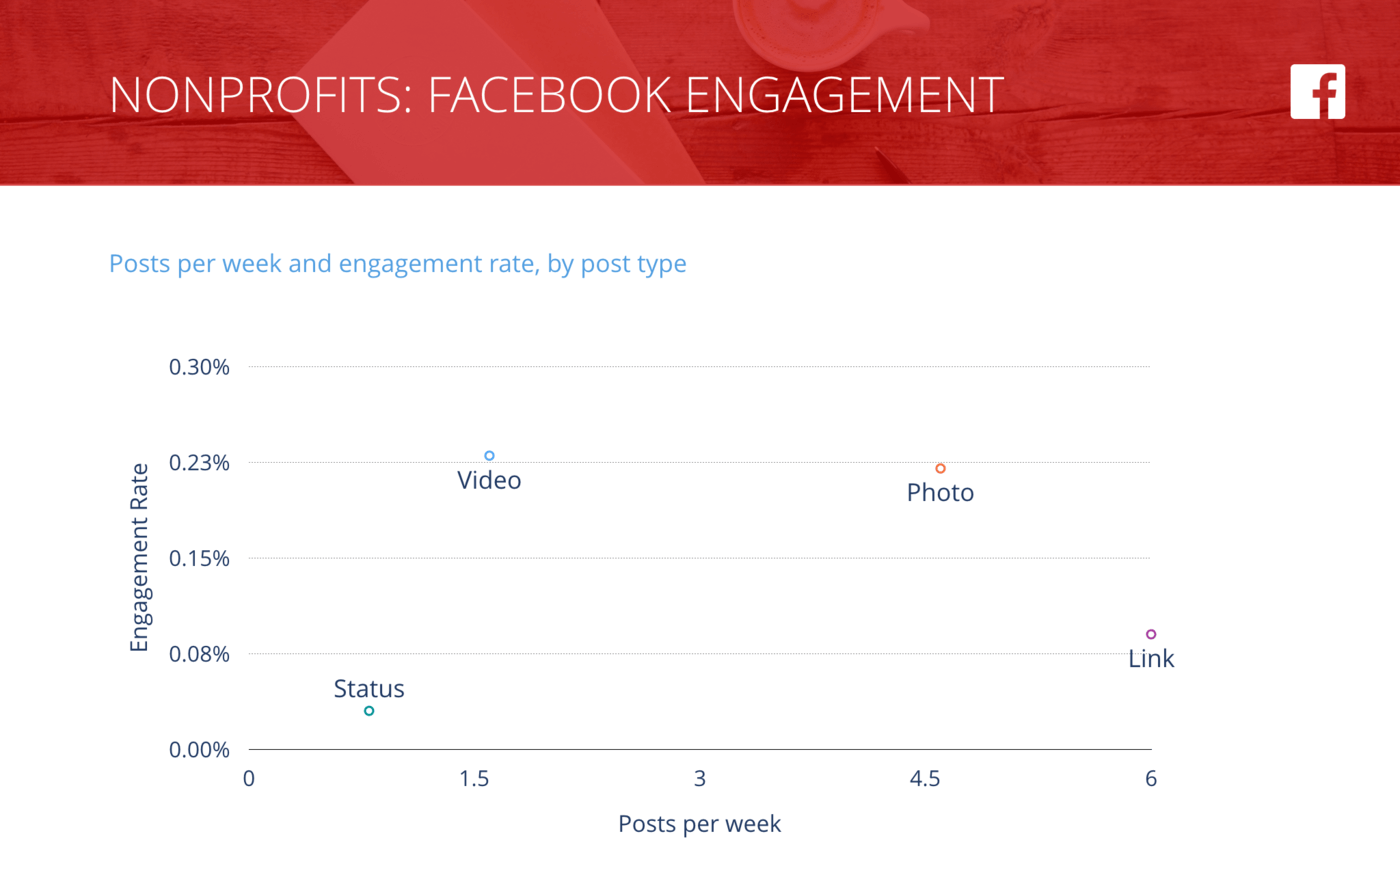
Facebook Posts per Week vs. Engagement Rate per Post, Nonprofit Organizations
Photo and video posts see three times as much engagement as the next highest post type (link).
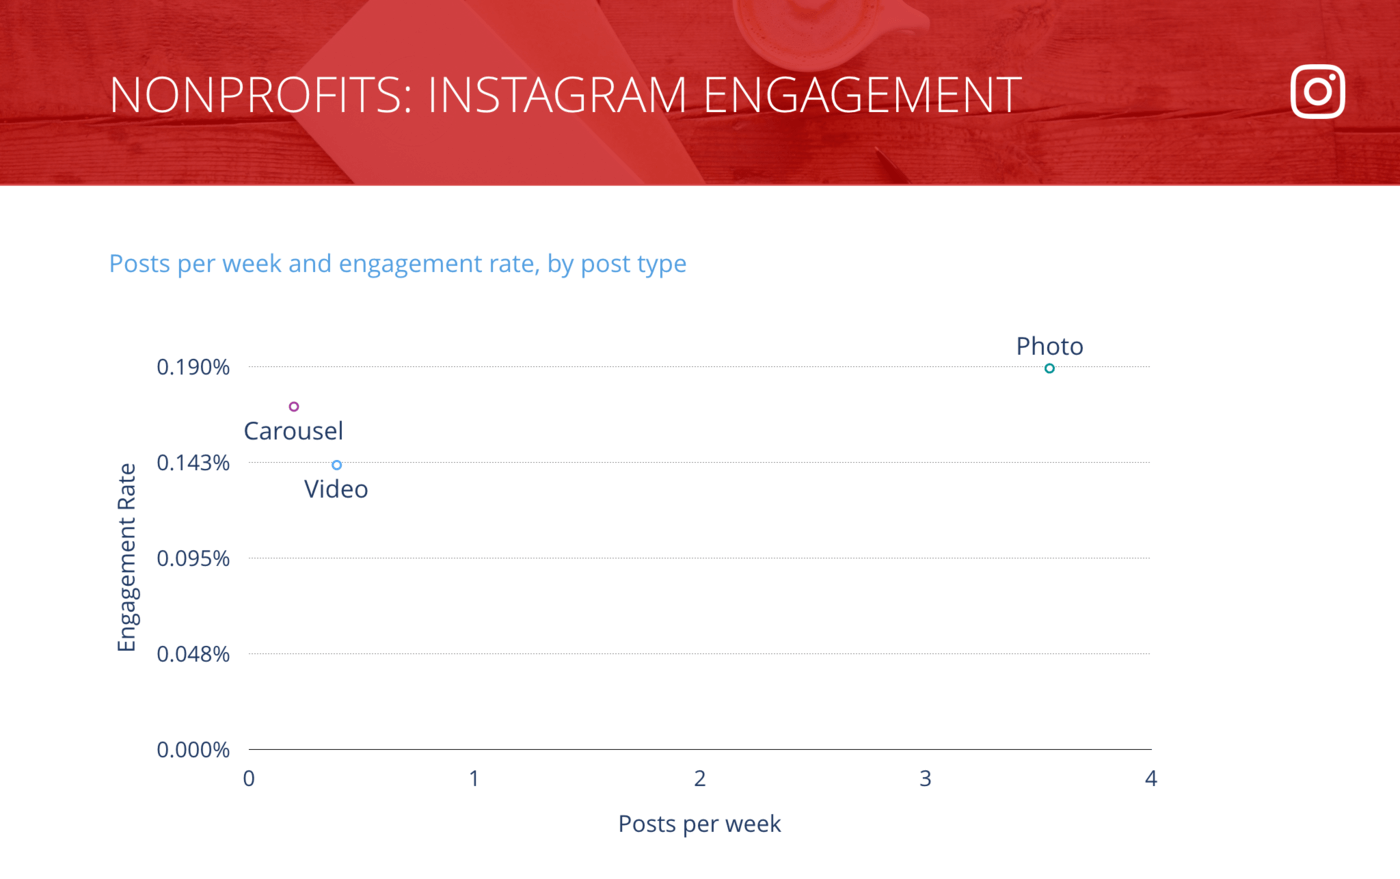
Instagram Posts per Week vs. Engagement Rate per Post, Nonprofit Organizations
Photos continue to outshine carousel and video post types in both engagement rate and post frequency.
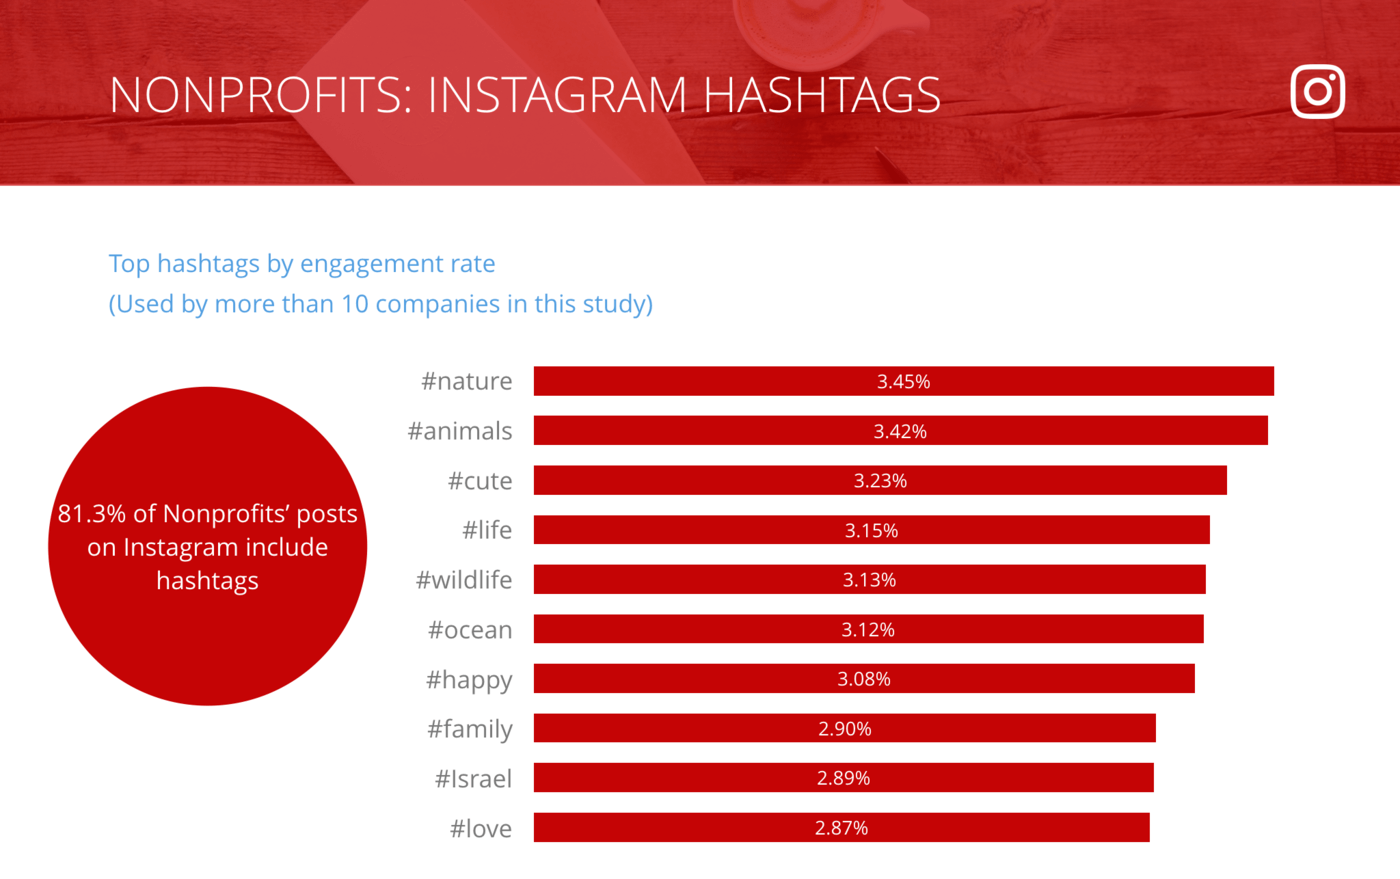
Instagram Top Hashtags by Engagement Rate per Post, Nonprofit Organizations
Hashtags about the natural world fare especially well for Nonprofits on Instagram.
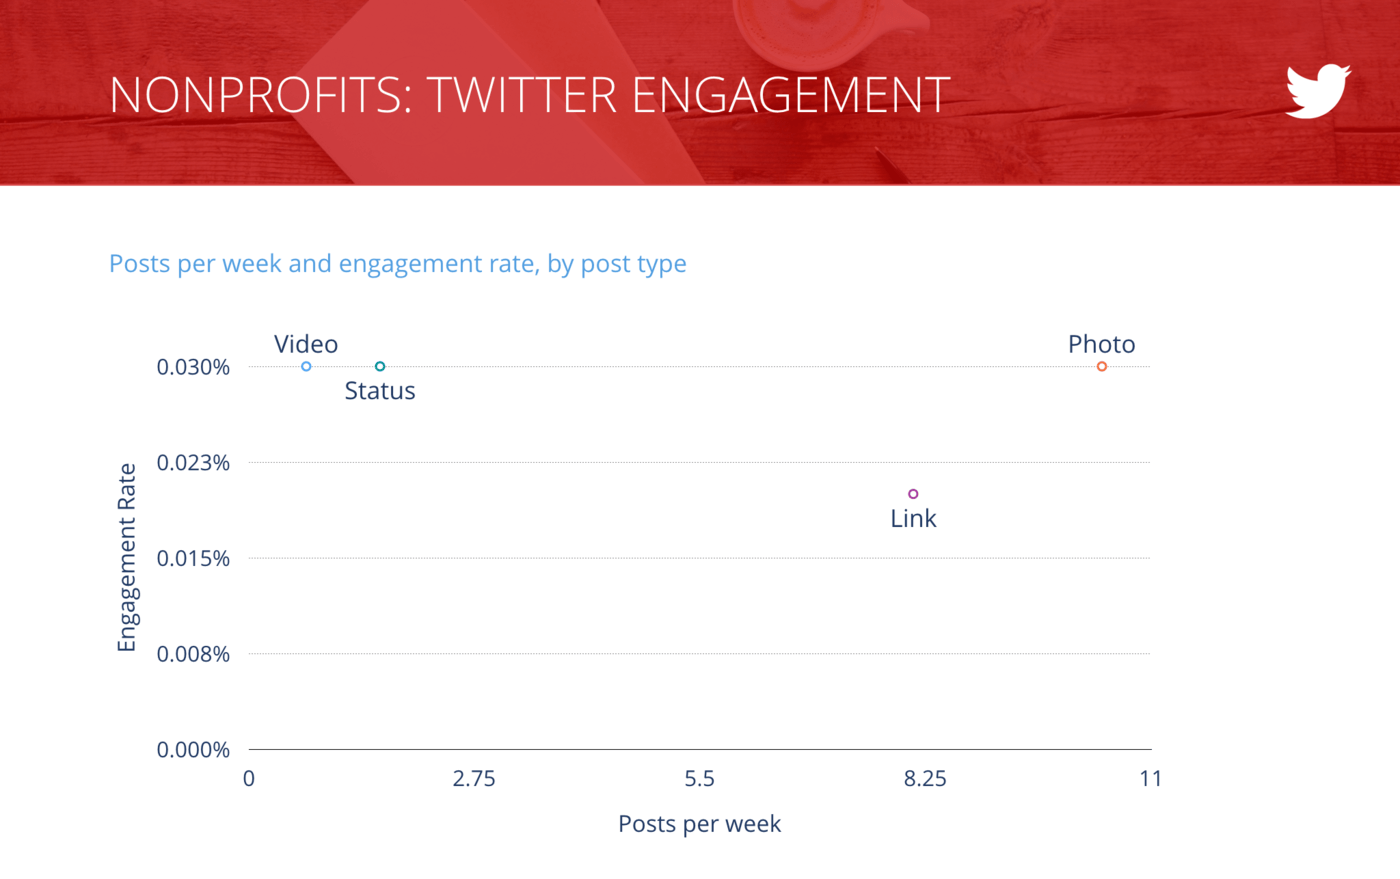
Tweets per Week vs. Engagement Rate per Tweet, Nonprofit Organizations
Nonprofits are doing what they can to maximize engagement on Twitter by concentrating on photo updates.
Industry Snapshot: Sports Teams
We it comes to the volume of content published, Sports Teams are vying for the crown of Top Content Producer. As more sports teams focus on engaging fans and becoming the number one news source for their team, it’s not surprising to see their posting frequency is nearly the same as media across channels. But their engagement is more then double that of media, a clear indication that followers are getting what they asked for.
Based on this study, there are two opportunities that could improve that engagement rate:
-
- Focus on engagement and conversation on Twitter
- Use hashtags on Instagram to reach a broader audience
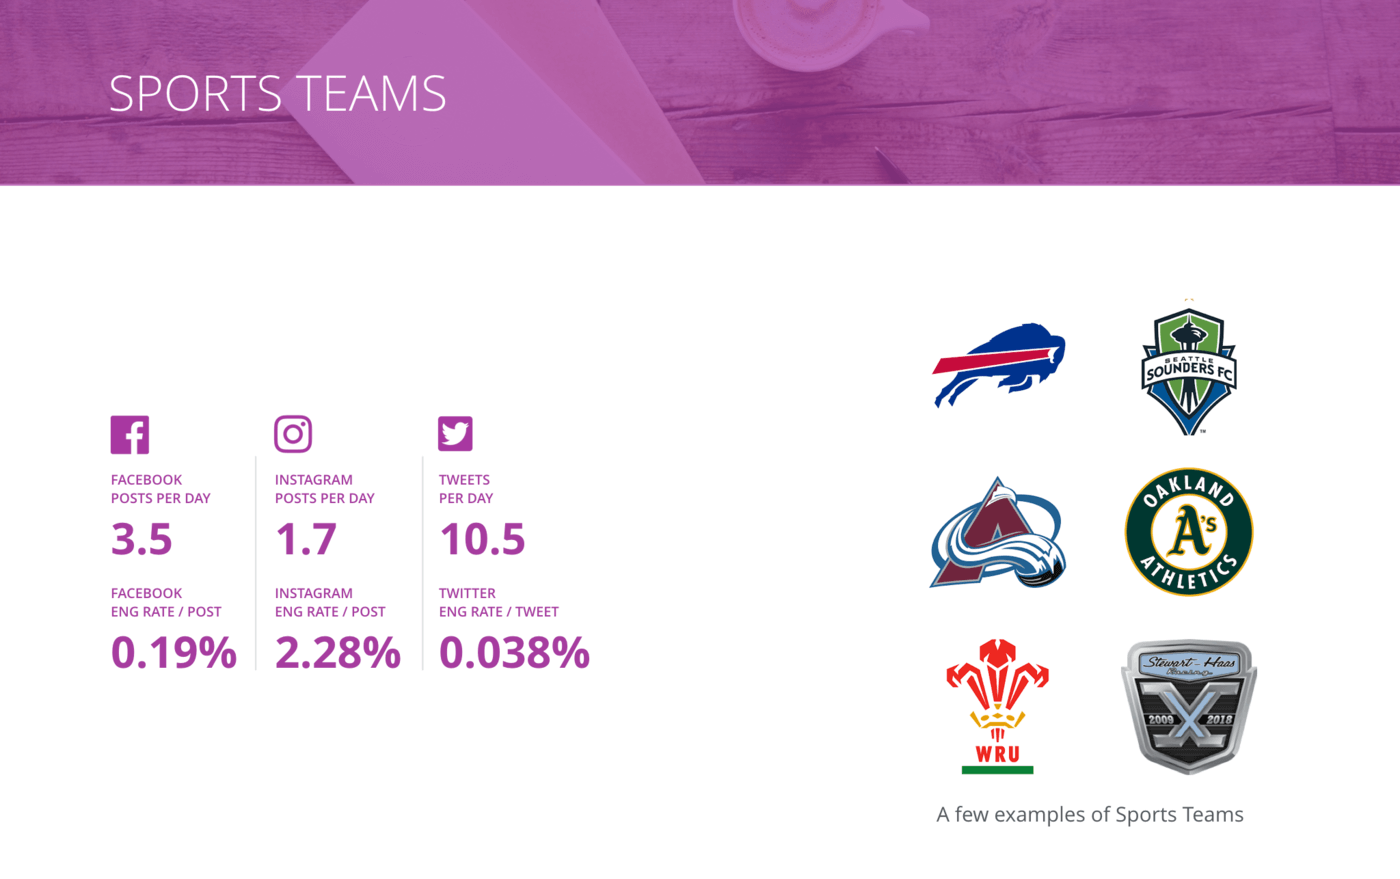
Overview of all benchmarks, Sports Teams
Some of the notable teams in our sample of Sports Teams include the Buffalo Bills, the Seattle Sounders, the Colorado Avalanche, the Oakland Athletics, Stewart-Haas Racing, and the Welsh Rugby Union.
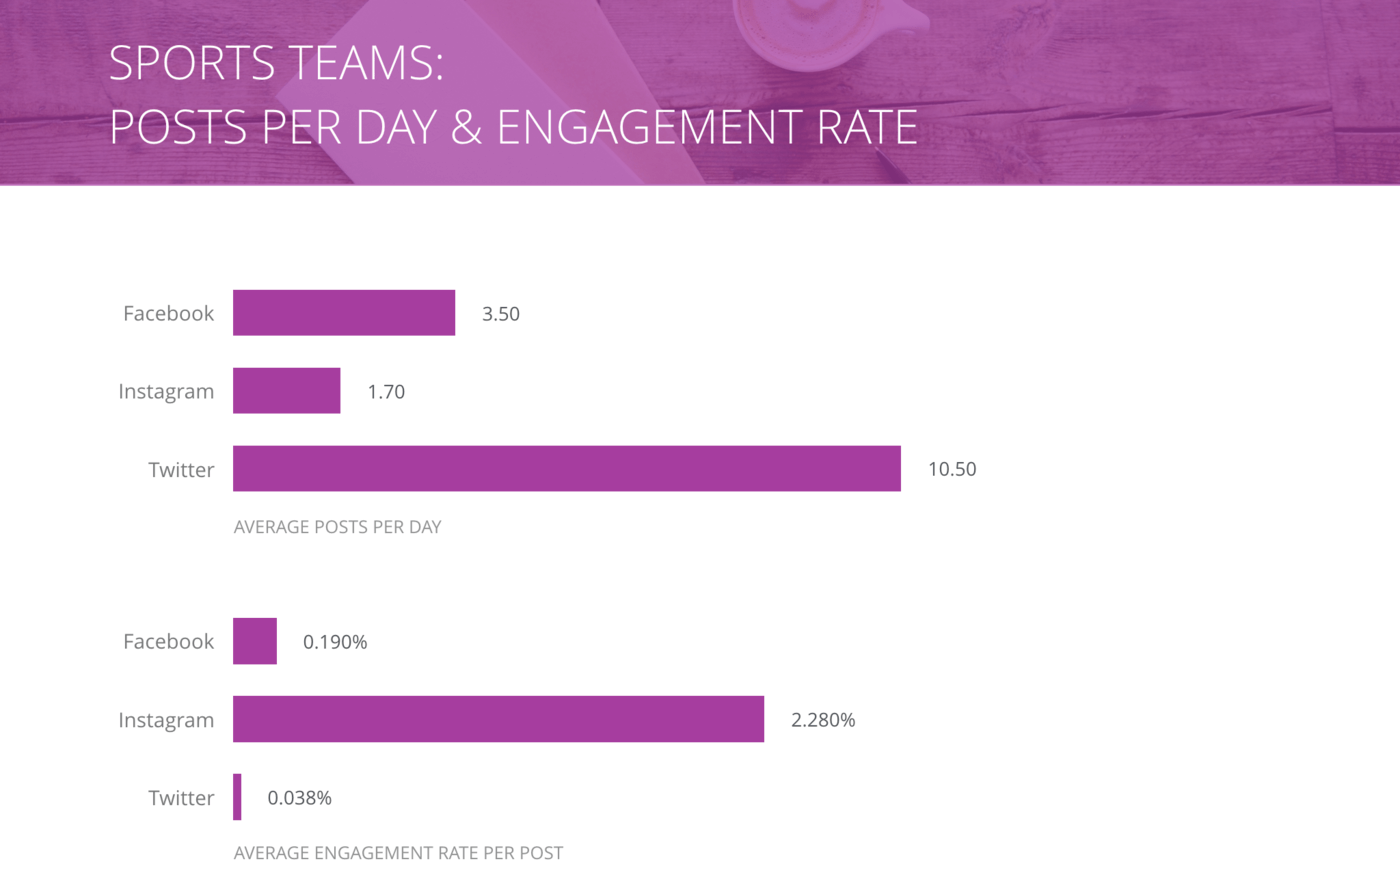
Posts per Day and Engagement Rate per Post, Sports Teams
On Instagram, Sports Teams get more engagement than all industries except Higher Ed. Even on Facebook, where their posting volume is considerably higher, their engagement is still slightly above average.
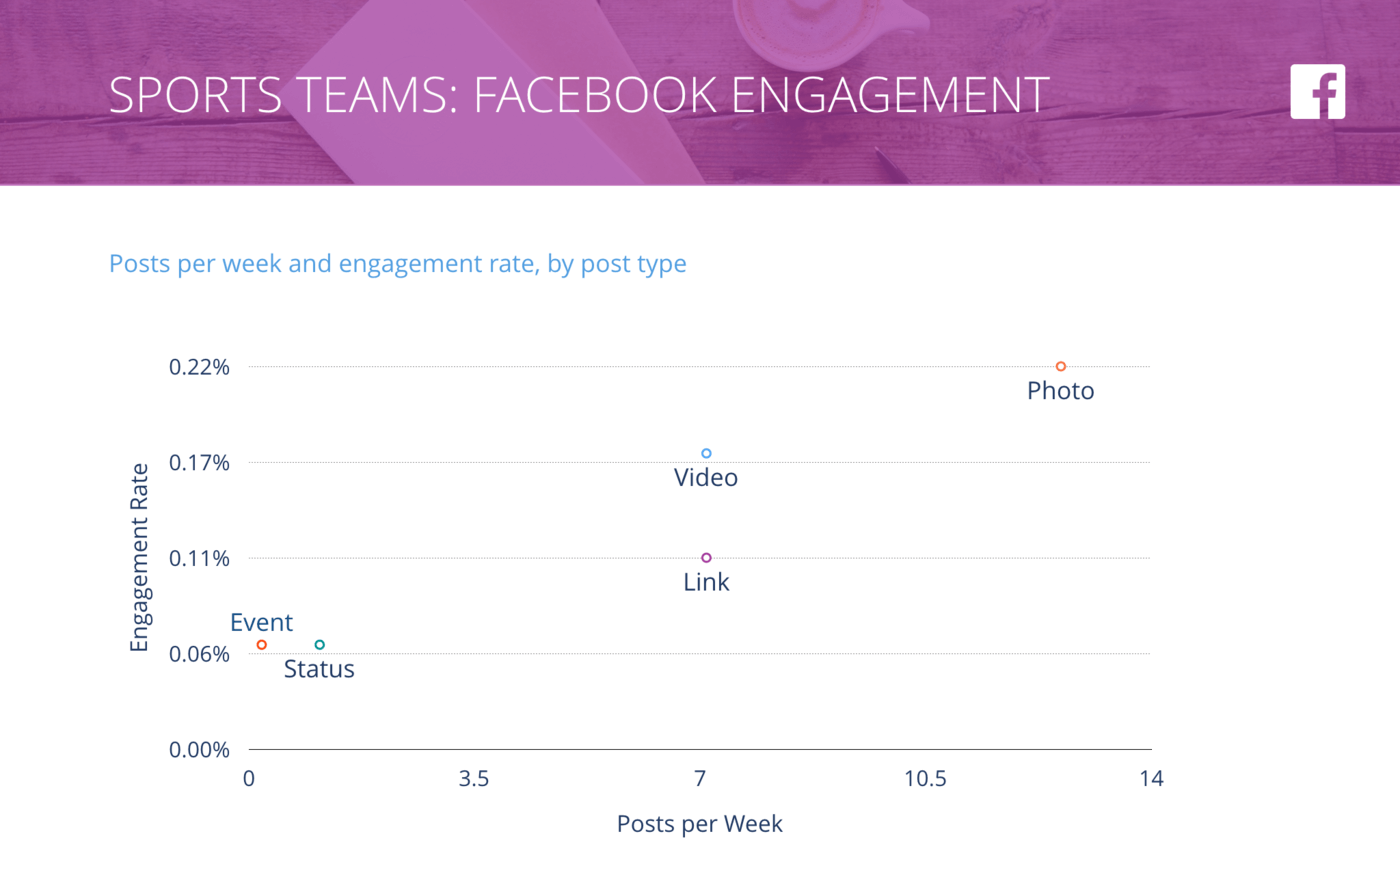
Facebook Posts per Week vs. Engagement Rate per Post, Sports Teams
Sports Teams hit the mark with frequent photos that garner high engagement. While video isn’t far behind, it may not prove a wise investment when considering resources.
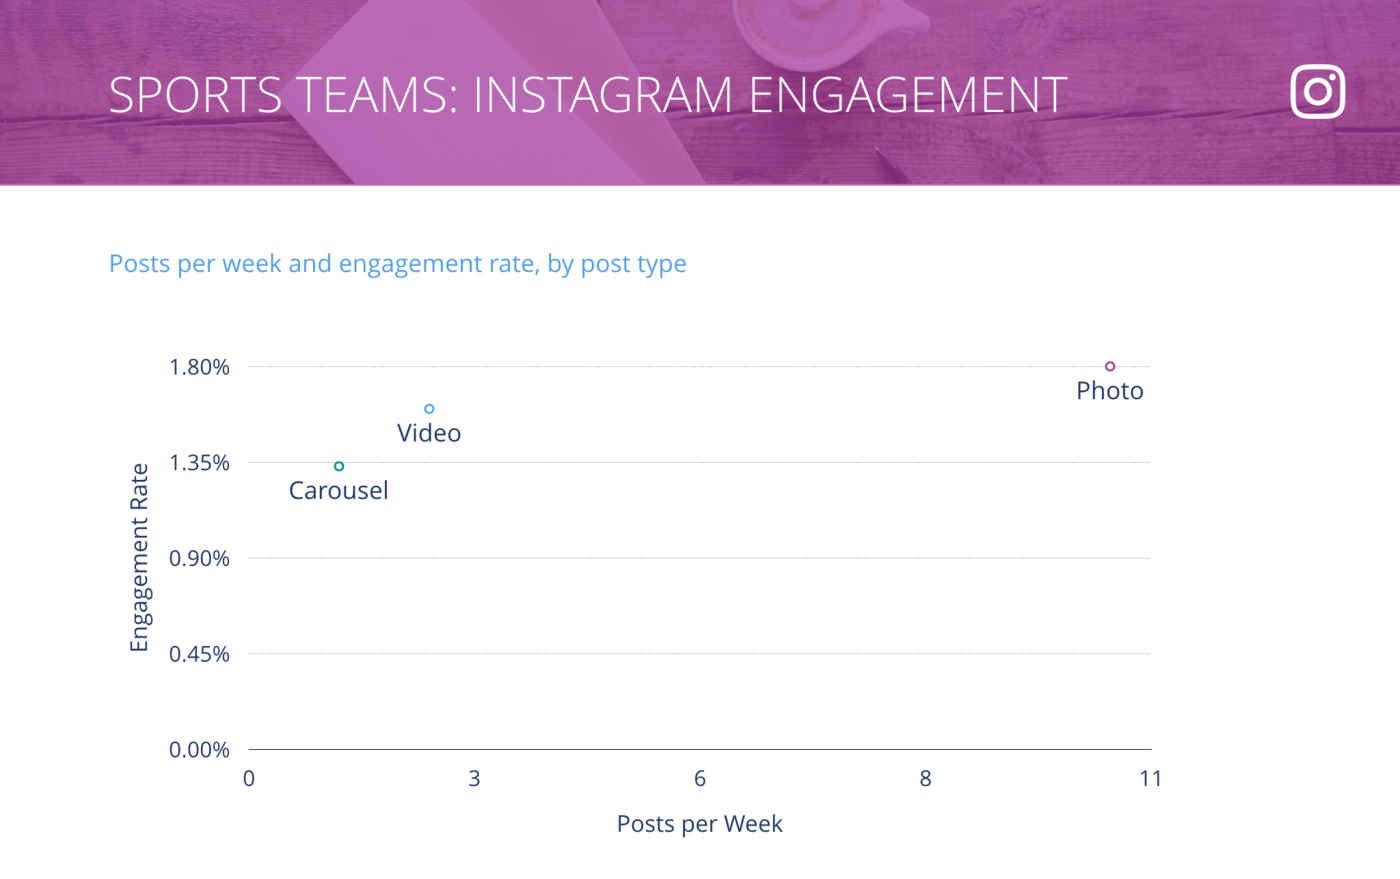
Instagram Posts per Week vs. Engagement Rate per Post, Sports Teams
Photos win the day on Instagram for Sports Teams, but unlike other industries, the difference in performance across post types is much smaller.
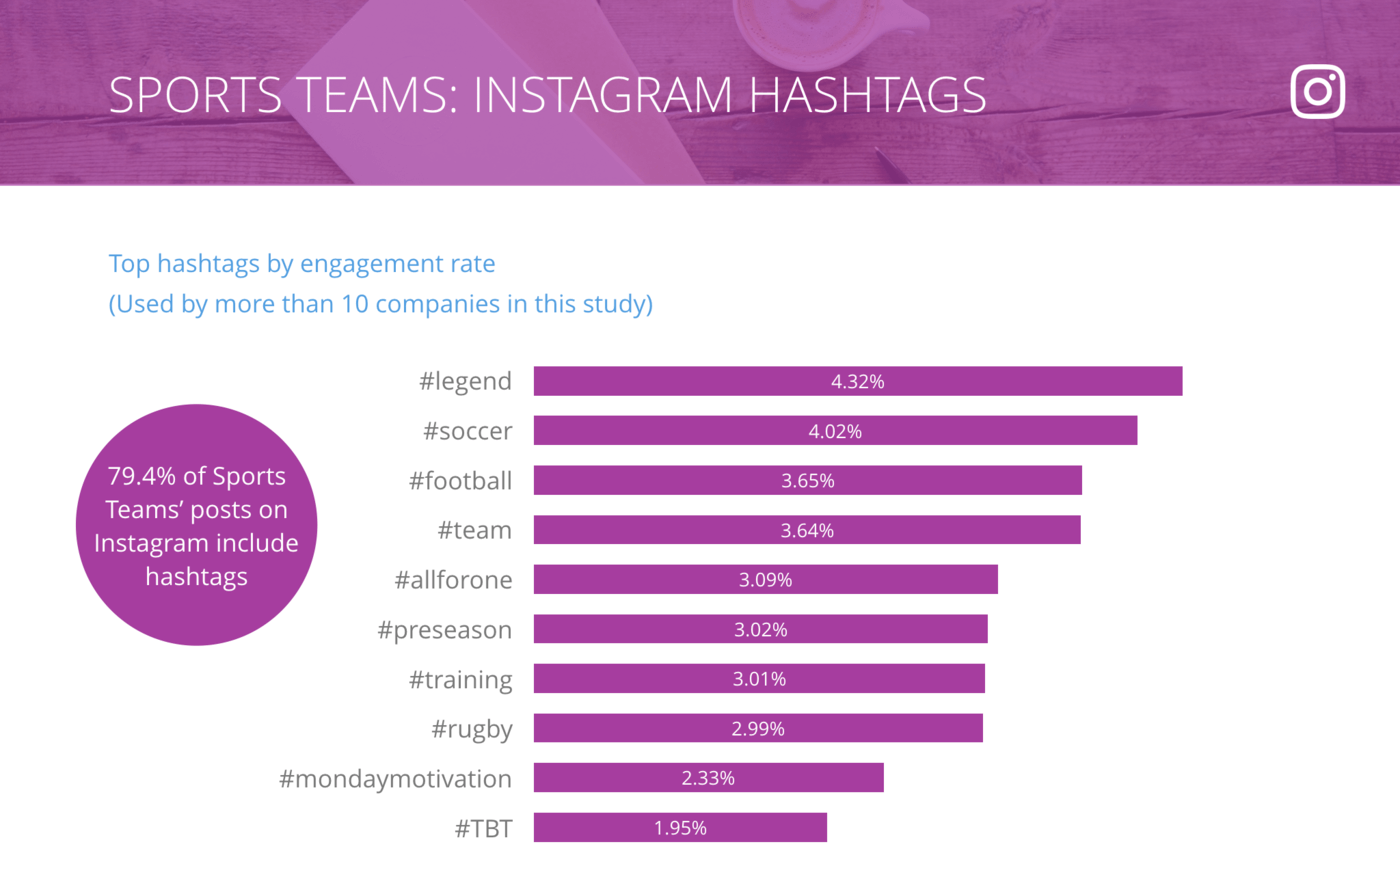
Instagram Top Hashtags by Engagement Rate per Post, Sports Teams
With 3 of the top hashtags relating to specific sports, Sports Teams can’t skip the basics. The mix of sports-related, though not sports-exclusive hashtags may indicate a way to engage a broader audience.
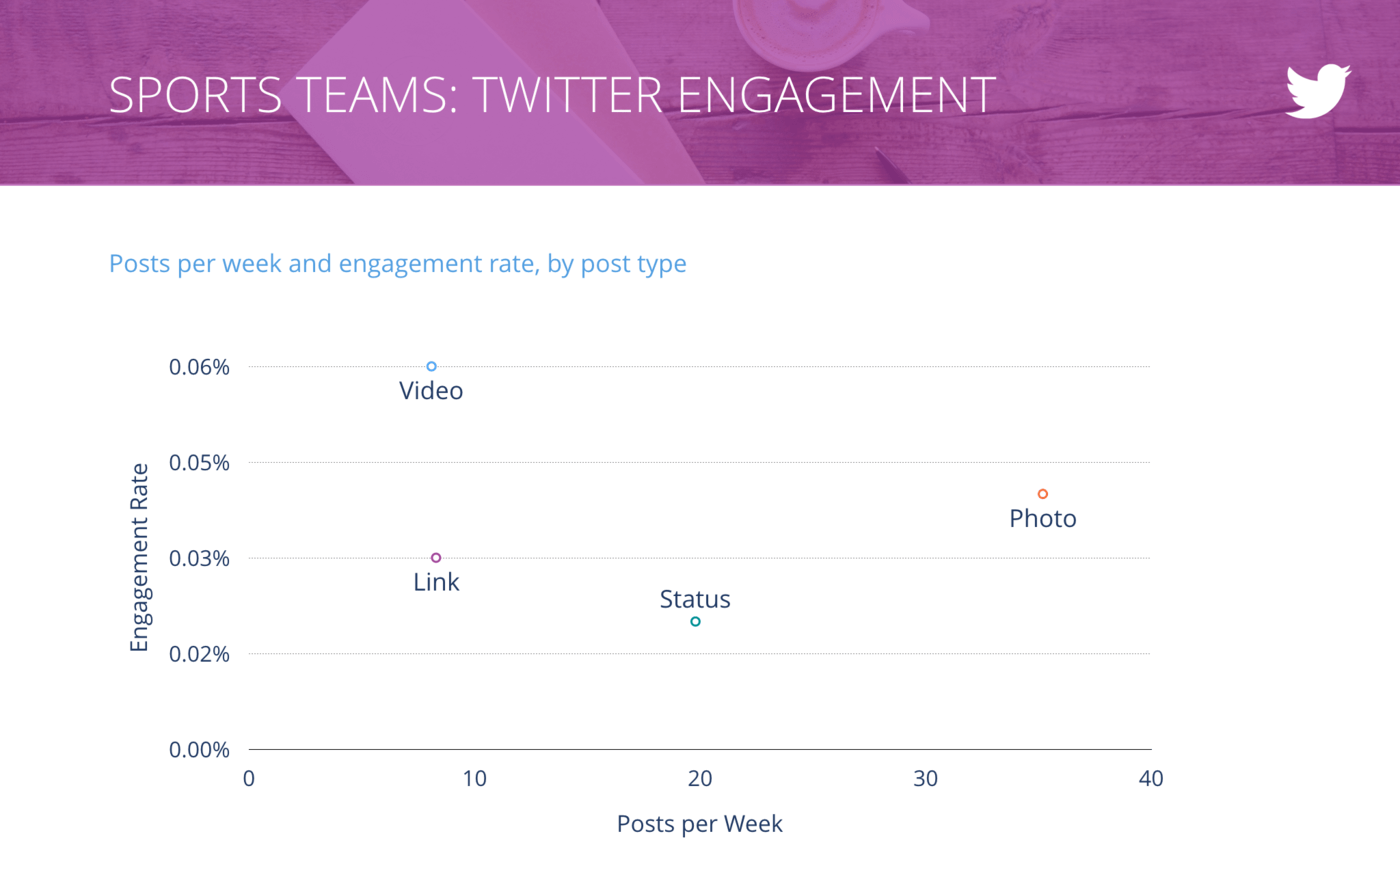
Tweets per Week vs. Engagement Rate per Tweet, Sports Teams
Based on the posting frequency, it’s likely the videos from Facebook are repurposed to Twitter—which garners the highest engagement.
Wrapping It Up
Channel champion: It’s no surprise that Instagram dominated on engagement rate while Twitter lagged across all industries this year. We’re looking forward to seeing whether Instagram can keep up its momentum in the year to come (and all the beautiful, visual posts we can expect from brands and companies on the channel).
Hottest post type: Photos continue to perform best overall in the “bang for your buck” department. Wise marketers continue to invest in video, but it eclipsed other post types just 1/3rd of the time, which surprised us.
Frequency vs. engagement: Media’s high posting frequency and low engagement rate is a cautionary reminder for all of us that more isn’t always better (even when there’s so much to talk about).
What strikes you about this year’s social media benchmarks? If you want to share your thoughts or request an industry for inclusion next year, drop us a line on Facebook or Twitter.
Sign Up Now