
Rival IQ makes it easy to report on many companies at once or just about “you”!
Rival IQ is all about helping you beat your competition in digital marketing. But sometimes we all just want to focus on ourselves, or, on our own companies. You could do this by going into each social media network and using the channel-specific analytics or insights. Or – you could save yourself a ton of time by using the “Me” tag in Rival IQ’s social media analytics for six channels in one place!
What’s the “Me” Tag?
In Rival IQ, everything revolves around what we call a Landscape. Think of a Landscape as just a group of companies or social brands you want to compare against each other across social media analytics, social content, SEO keyword rankings and more.
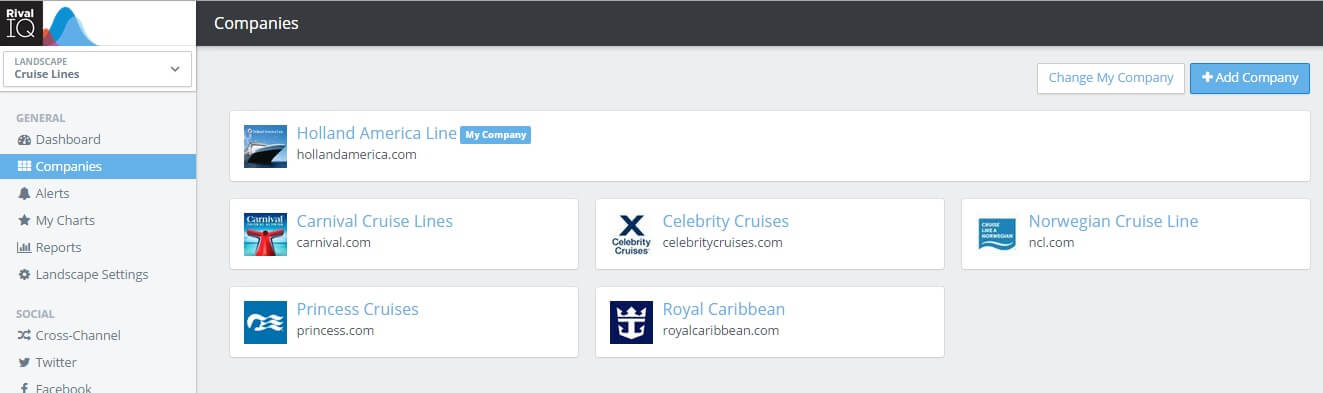
This is a Landscape of Cruise Lines in Rival IQ.
We also provide a way for you to slice and dice brands in a single Landscape using “Tags”. A Tag allows you to filter the reports based on just those companies to which you assign each tag. Think of a Tag as a label that gets attached to a company or companies in Rival IQ. Using this technique makes it really easy to filter the available information in the report to just your company or to your company and only one other company.
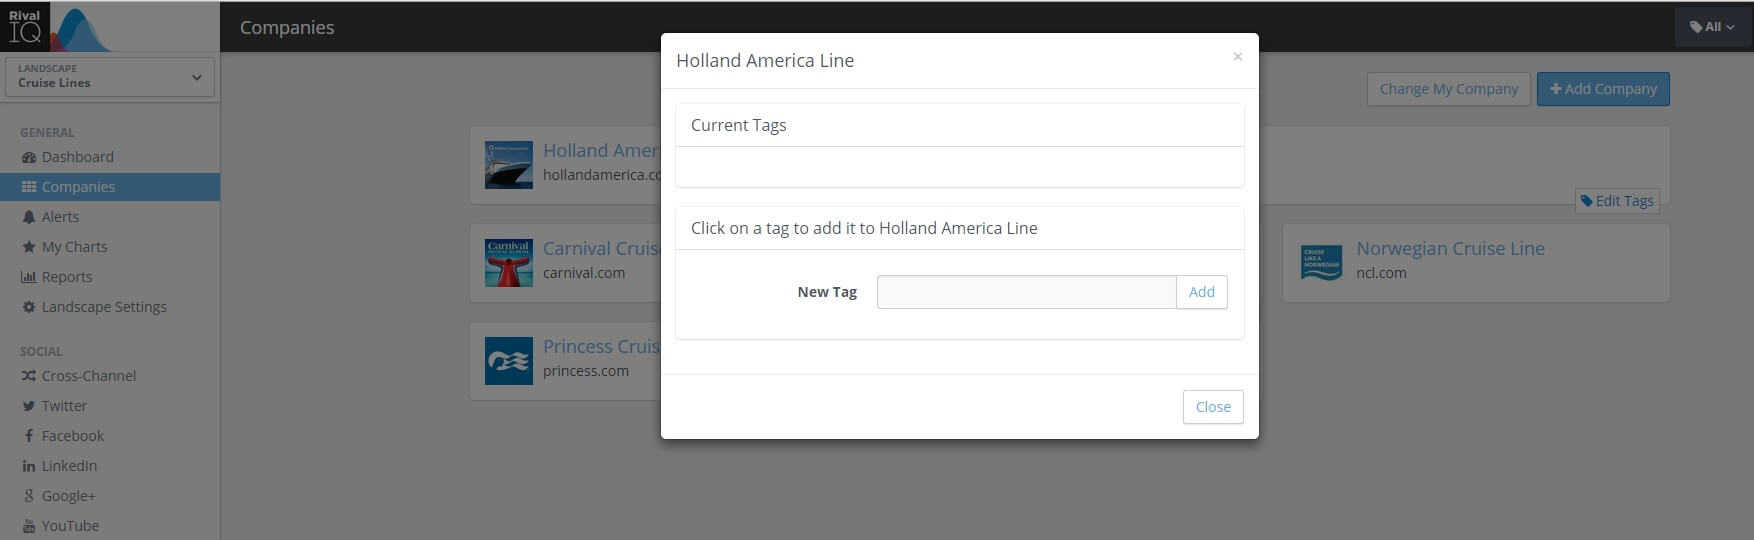
You can create Tags and then add or remove Tags from each company in a Landscape
In this case, you would create a “Me” tag and only assign it to your company (or you!). Setting up the “ME” tag in Rival IQ gives you an instant pulse for how your company is doing, and gives you the tools to make head-to-head comparisons anywhere in the Rival IQ application.
You can create a Tag called “Me”
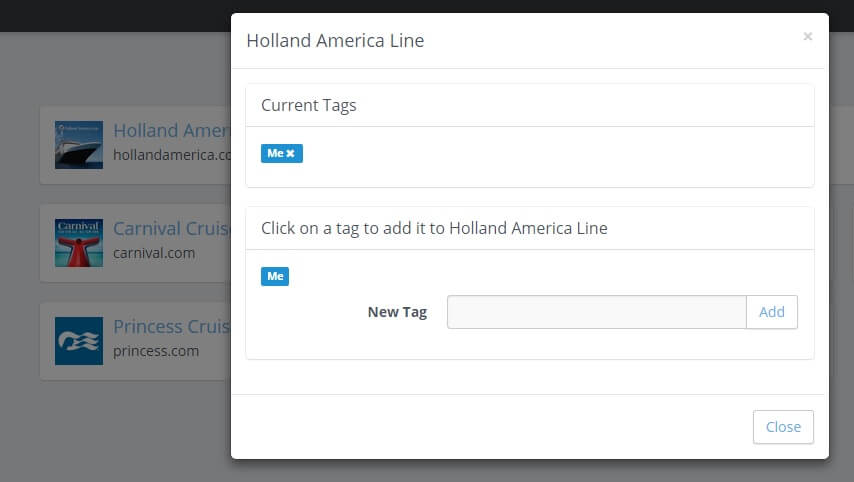
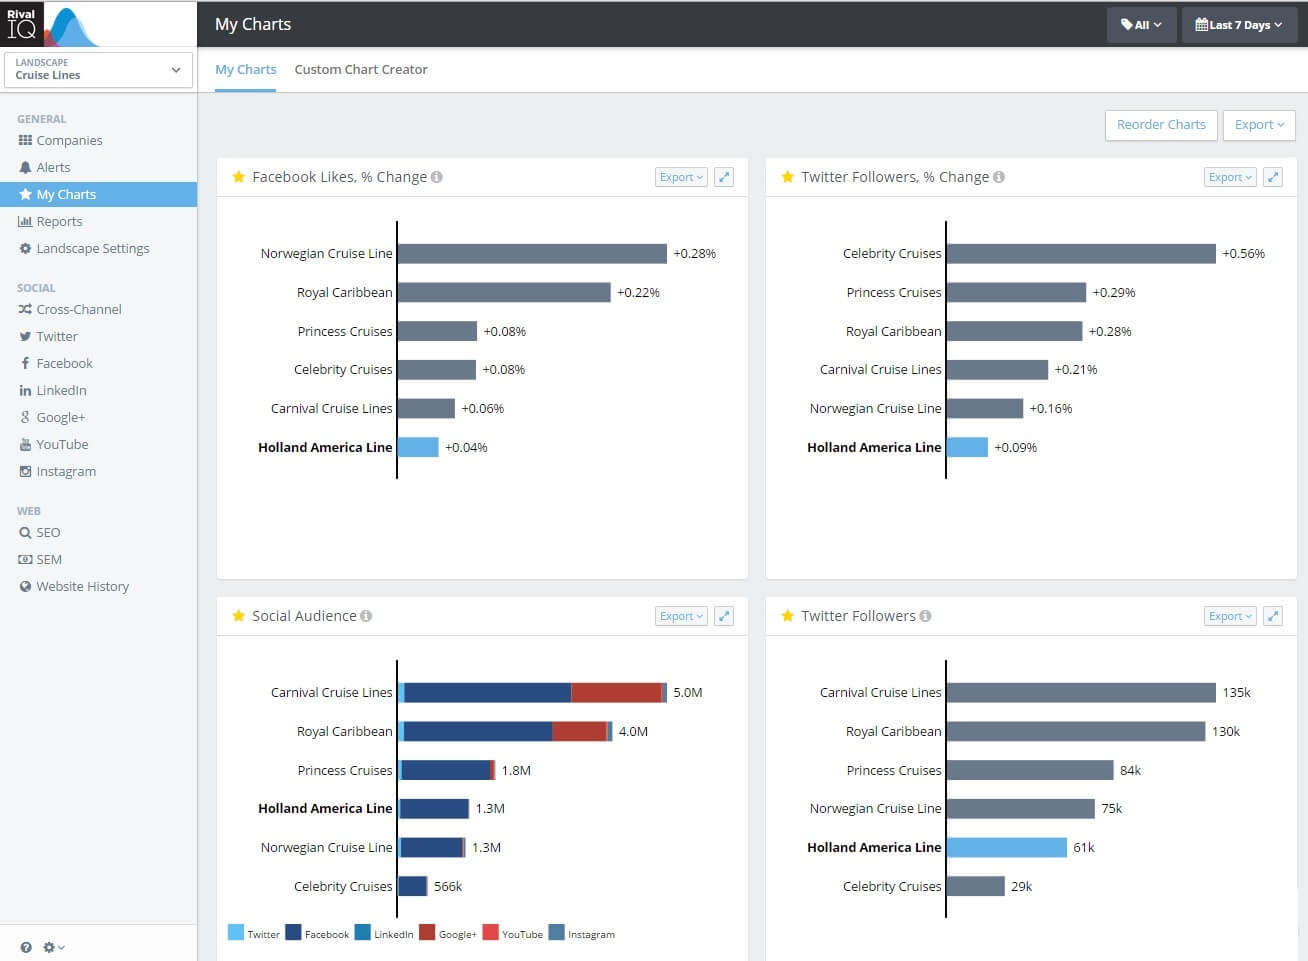
Now when I add the “Me” Tag to my company – in this case I’m pretending Holland America is “me” – I will see all reports across Rival IQ just for Holland.
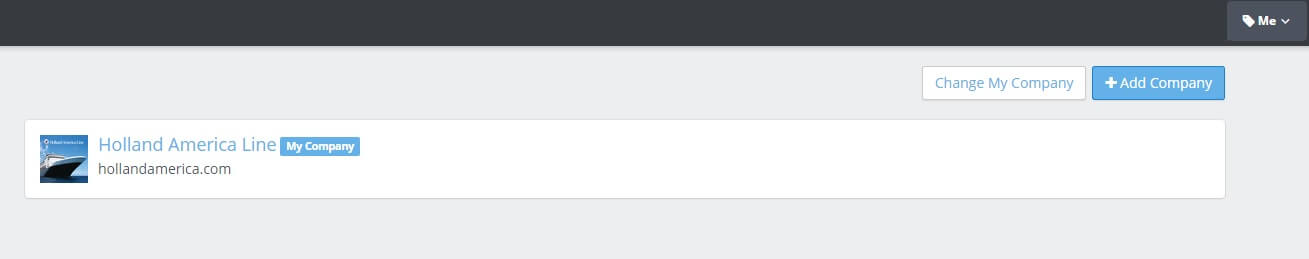
Now the only company in the Landscape I will see is Holland America.
5 Steps for Successful Tagging
Step 1: Create and set your tags
To get started, go to the companies area of your Rival IQ landscape and create a tag for each company. (If you haven’t created a Rival IQ landscape yet, here’s an example landscape for you to try.)
You’ll create a tag for each company by hovering over the lower right-hand corner of each company tile and clicking “Edit Tags”. Then, enter a tag for each company that matches its name, e.g. for a company called Eat24 you would create a tag called “Eat24”, and tag each company in the landscape. If you’d like to make a special tag for your own company – like “Awesome” – have at it!
Congratulations! You now have a super-selector for your landscape to give you the version of the report or graph you are viewing, scoped only for the companies tagged with the tag you select.
Step 2: Select the Me tag to analyze just your company
This will give you information only for your company.
Use this technique when you are looking at a Top Content Report or at an individual graph in the My Charts area to limit the scope of data to your company.
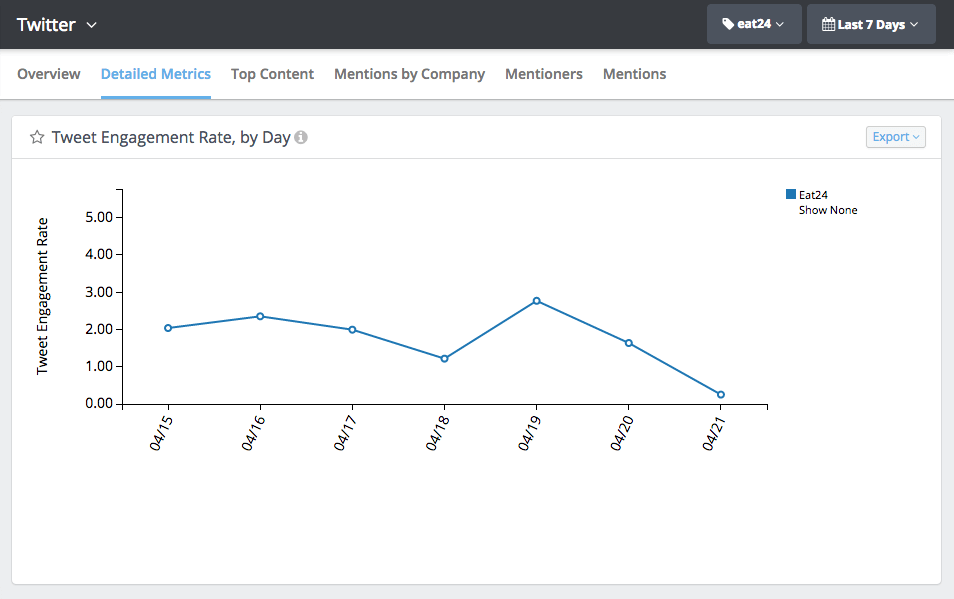
Here’s what it looks like to see the “ME” view. It’s particularly useful when you are looking at a series of data and want to see the daily, weekly, or monthly trending for the engagement rate per Tweet of your content on Twitter.
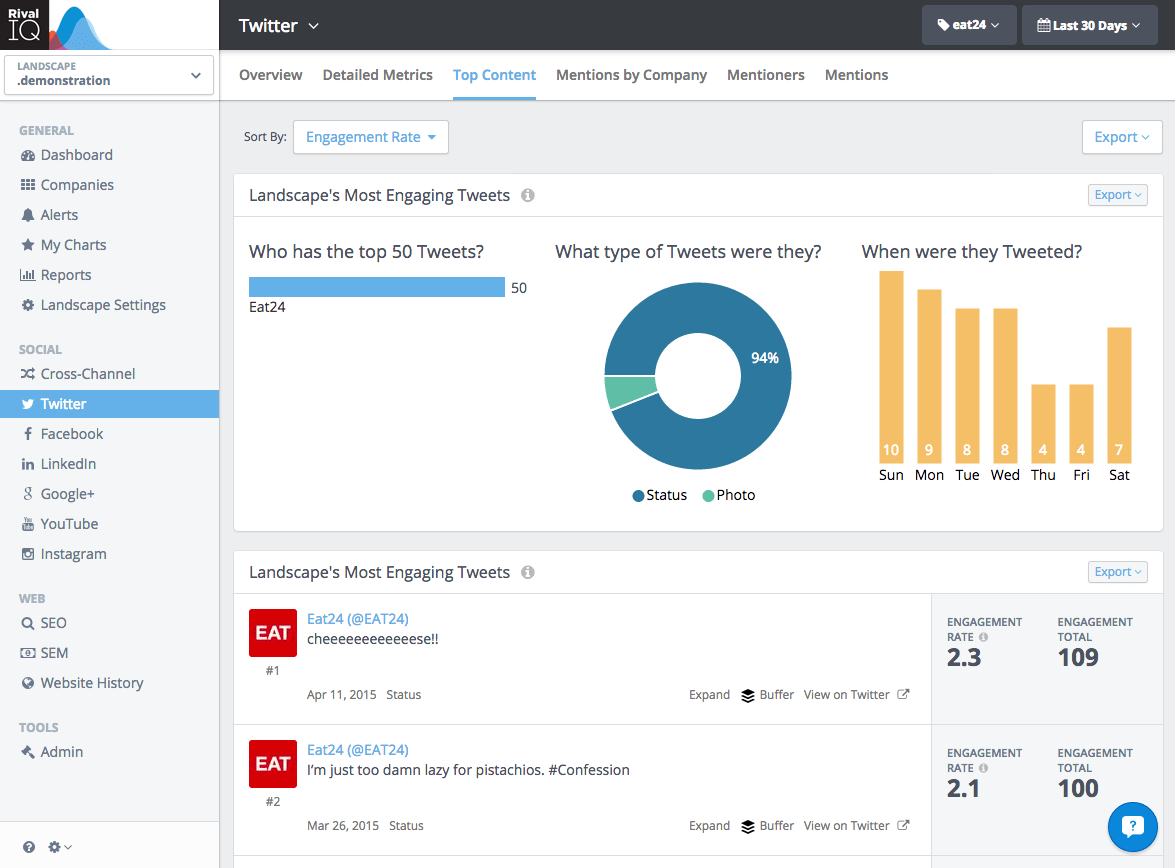
You might also choose to view your Top Content for Twitter using the “ME” tag to see the latest posts you created on Twitter that got the most Total Engagement from your Twitter Fans.
There’s a lot of flexibility here – we’d love to know what you choose as your go-to report.
Step 3: Select another company’s tag to do a head-to-head comparison
Assuming you’ve followed the steps above, then you’ve created tags for all of the companies in a landscape. By selecting one of those tags, the landscape will now show only that tagged company and your focus company (your company).
Use this technique when you want to compare your company to one other company in the landscape, or to specific companies (close competitors, companies in the same city, etc)
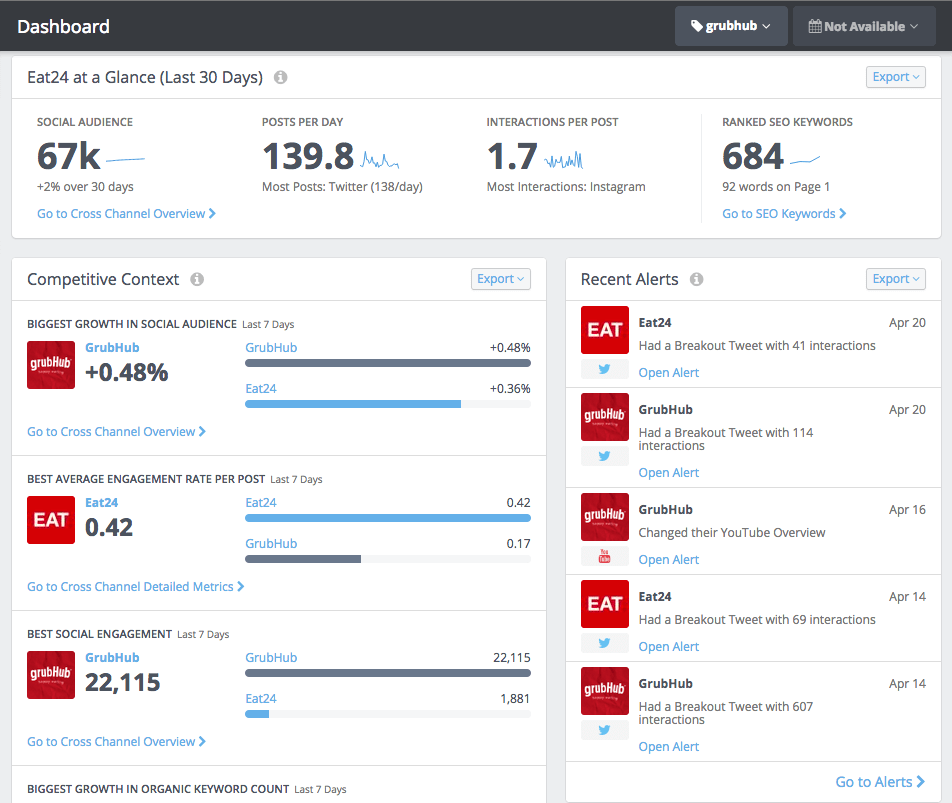
Our Rival IQ Dashboard is the killer app for comparing your company with one other company in your landscape. In one at-a-glance view you get information on audience (where your fans are), activity (where you’re putting effort and posting), and engagement (your response rate to those posts). Seeing this information against one other company gives you insight into the content you’re producing, the mentions you’re getting, and surfaces key information in alerts for your company and about your rival.
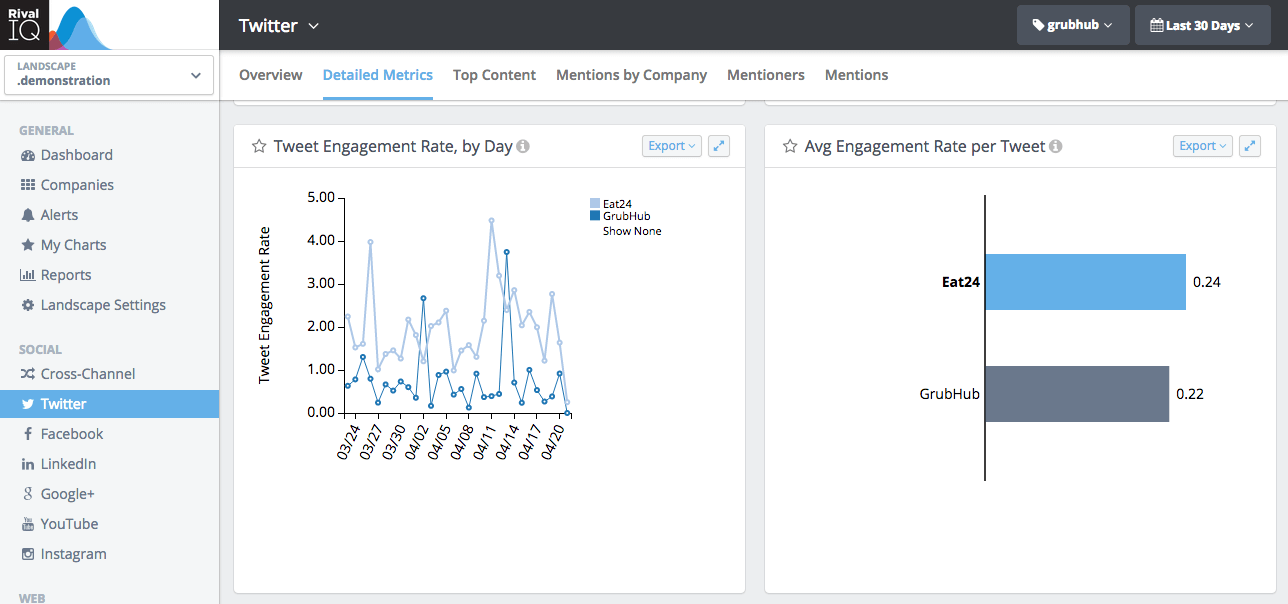
Selecting at least one other company gives you more details on the Detailed Metrics area of each channel. Check out how all of the companies are doing in one place using the Cross-Channel Overview or drill into individual days that produced the best results on Instagram. It’s up to you – you can compare the companies in your landscape in any way you like.
Step 4: Use the analysis to update your strategic direction
Don’t just view the reports about just you and the information about you and a competitor – put it into action based on what you learn. As you are analyzing the data and content, ask yourself these questions:
- What am I doing right?
- Where am I missing the mark and how can I improve?
- Where is my greatest social growth happening – and what can I learn from that to use with other channels?
- What influencers am I engaging with best?
- Who are my followers and am I engaging with the right people?
- What content of mine is most successful and how can I do more of that? What content, when posted, where posted, etc?
- How am I performing based on my goals and metrics?
Based on the answers to these questions, put together an action plan to further improve your performance.
Step 5: Report your success and strategic plans
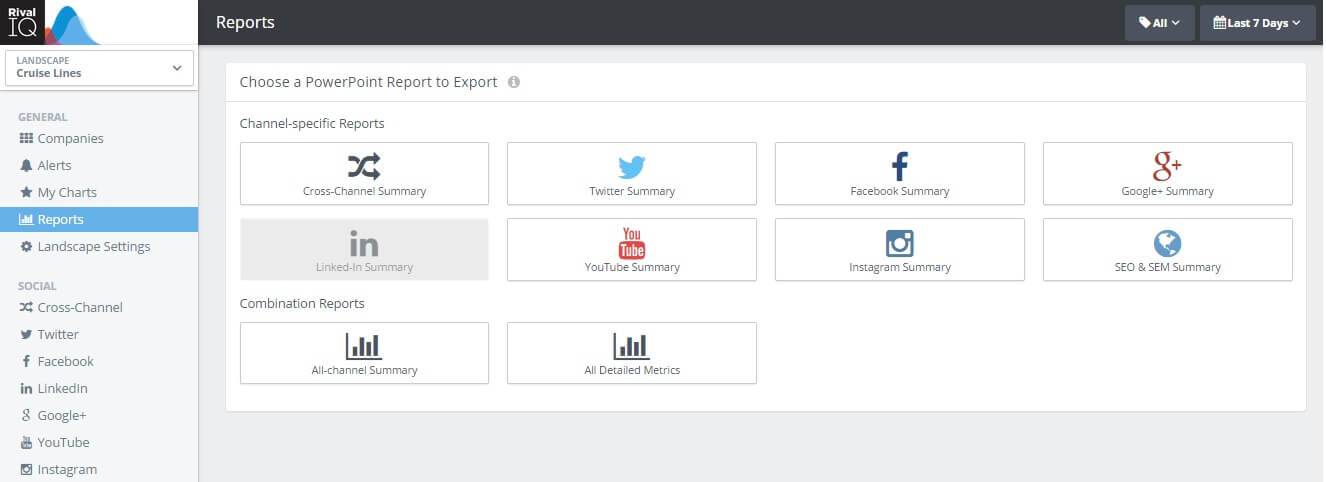
Not only does Rival IQ make it easy to quickly create analytics and content for one or many companies, it’s also super simple to run reports for any set of data or content you want. After you’ve done your analysis and updated your strategic plan, then create a report showing where you’re rocking it, where you’re improving, and where you will focus your attention next.
You can choose from one of Rival IQ’s many curated set of PowerPoint reports, which you can download with a click!
Or you export charts and content from anywhere in the application to PowerPoint, PDF and other formats, using the export function. You can also create your own set of curated reports in the “My Charts” area, where you can develop customized trending analytics or organize charts to export in a customized order.
Sometimes it’s okay to ask “WIIFM?” (What’s in it for me?)
The “ME” Tag – and tags in general in Rival IQ – gives you the easy ability to filter all of the information presented in Rival IQ for a refined target. You get what you need at the time you need it.
Use tags to show only information about your company or as a quick select tool to find out how you’re doing against your closest competitors.
If you have other great ways to use tags in Rival IQ, please let us know – we’d love to hear about it.