Trying to be a good listener is an excellent quality both for marketers and people in general. Feedback helps you and your business grow, and everyone likes to feel like their opinions are important to you.
The same holds true for social listening, especially if you’re involved in the world of social media marketing. When you use social listening, you’re tracking what people are saying about your brand, competitors, and industry as a whole. Although it often gets confused with social monitoring, the difference between the two is that social monitoring is more passive. When you use social listening, you’re using the information you’ve gathered to take action and engage with your audience.
From McDonald’s to Barbie, brands have seen major success with social listening because they pay attention to the many different social listening metrics that can help boost their brands. Whether you’re looking to generate more leads or create buzz about your business, social listening can help. Let’s get into the top social listening metrics and how they can be a boon to your brand.
7 Social Listening Metrics and What They Do
1. Mentions
As the name implies, social media mentions refer to when someone mentions your brand online. Mentions can be done in a variety of ways. Your brand may be directly tagged in someone’s post, which is a sign that the social media user is trying to get your attention. However, mentions aren’t always this direct.
Mentions can also simply be someone talking about your brand, perhaps in a conversation with another user. Or they may just feel like making a post about your brand. The high number of mentions isn’t good or bad on its own. Mentions can be positive, negative, or neutral.
More mentions do demonstrate greater brand awareness, regardless of whether they are positive or negative. The more people talk about your brand online, the more people will see your brand.
They also provide you with the opportunity to engage with your fans, something fast food brand Wendy’s does particularly well. One of the company’s top tweets of 2022 came about from a mention. When Twitch streamer @HeyStani caught sight of a new character skin in the game “Fortnite,” he noticed that it looked quite a bit like Wendy’s mascot and tweeted at Wendy’s with an image comparing the two.
Wendy’s reshared the post with a caption playfully calling their mascot a “goat,” aka the greatest of all time. The retweet earned an engagement rate of 0.68%, about 5x the brand’s average engagement rate on Twitter.

2. Post volume
Post volume and mentions go hand in hand, as post volume refers to the number of posts containing mentions. Just like mentions can be positive, negative, or neutral, a higher post volume isn’t necessarily good or bad. However, more posts do mean that your name is spreading more across the online world, for better or for worse.
The higher your post volume is, the more people are seeing your name on social media channels, which is why it can be beneficial to your brand awareness. Let’s take a look at coffee brand Starbucks’ post volume over the last 30 days. According to our social listening feature, Instant Search, we can see that Starbucks was mentioned in 249K throughout the past 30 days.

Think about how many posts are published in a day. Instagram last shared this metric in 2016, claiming that 95 million posts were created in a day on the platform alone. Considering Instagram’s growth since then, the number is likely far higher. With all those photos, videos, and Stories, it’s easy for your own content to be drowned out. That’s why it’s so crucial as a business to build up your online fanbase so they can be your biggest cheerleaders on social media.
They’ll spread your business’s name throughout the many social media platforms. In turn, your brand awareness will grow. In this way, you’ll create a cycle. One fan mentions you, that post gains you more attention online, and then your new fans will become champions of your brand. Ideally, post volume should be an ever-increasing metric, though you’ll likely experience some spikes depending upon things like new product launches.
3. Share of voice
When you talk about share of voice (SOV) in terms of social media, you’re referring to how much people are talking about your brand in comparison to others in your industry. To track this metric, you could look at the overall number of posts mentioning you and a group of your top competitors written over a specific amount of time. Then, calculate the percentage of posts with mentions that were specific to your company.
It’s essential to know where you stand in your industry. While tracking mentions and post volume can help you engage with your audience and get an idea of how you’re growing online, knowing your SOV can help you create benchmarks.
These numbers can help you understand how quickly you’re growing for your industry and evaluate where you stand. Like mentions and post volume, SOV can help with brand awareness, as your goal is to become more well-known than your competitors online. Knowing your post volume is helpful, but what’s more beneficial is being able to compare that post volume to others in your industry.
Start social listening with Rival IQ. 
For instance, let’s say Wendy’s wanted to know what their SOV was in comparison to McDonald’s. With our Saved Searches feature, we can keep track of how the two fast-food brands are faring online in terms of their SOV. Over the last 30 days, Wendy’s has received 152K posts mentioning them.

When we compare the number of posts from the same time period for McDonald’s, we see that the brand significantly outpaced Wendy’s, earning 1.3M mentions. Therefore, compared to McDonald’s, Wendy’s SOV is only about 11%.
4. Sentiment
We’ve already discussed how mentions, post volume, and SOV aren’t necessarily positive or negative. You may have more posts talking about you because they’re written by your fans. Or you may have more posts because you’re in the news for a negative reason.
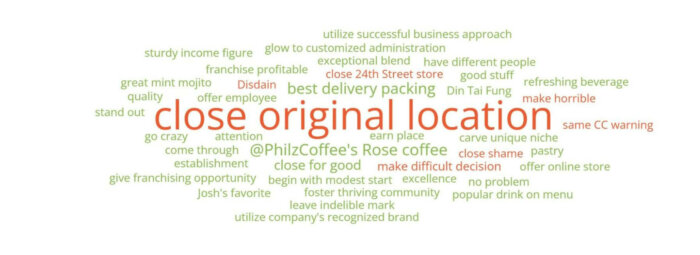
Sentiment tells you if your mentions are more positive, negative, or neutral. Let’s consider coffee chain Philz Coffee. Over the last 30 days, its net sentiment was only 28%. Typically, this popular Bay Area brand fares much better with its audience. So, what happened?
The brand had 110 positive posts mentioning them but 72 negative posts. According to our Sentiment Drivers by Type word cloud, which pulls together the most frequently said words appearing in the posts mentioning the brand, the most prominent negative words were “close original location.” Judging by this information, we can venture to say that the negative sentiment comes from fans being unhappy that the brand chose to close its first location, located in San Francisco’s Mission District.]
5. Reach
Reach is defined as the total number of people who choose to see and engage with your post. One person who views your post is equal to one unit of reach.
Reach is challenging to determine. You might expect your reach to equal your follower count, but that’s typically not the case. Your content will most likely not be seen by all of your followers. For example, according to our 2023 Instagram Stories Benchmark Report, brands with the largest followings actually saw the smallest reach rate on Instagram. And there are a variety of reasons why this statistic is occurring.
For one thing, your content is competing with not only the other Stories on Instagram but also all the other forms of content on the social media platform, like posts and Reels. But with a growing number of social media channels, like TikTok and Threads, you’re also competing with all of the content on these other applications.
A lower reach rate may also tell you it’s time to switch up your content. On social media, posts and Stories are prioritized on people’s pages based on whether or not the app thinks they’ll want to see them. If you’re getting a low reach rate on a particular channel, that social media platform may be telling you that your followers don’t care to see your content.
Reach can help with lead generation because the more people who see your content, the more potential customers you can create. Though higher reach doesn’t directly translate to more buyers, it can help you in the long run as you may convert a social media fan to a customer.
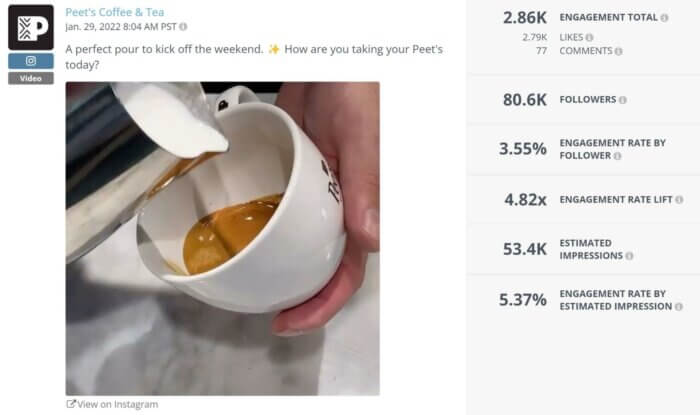
On Instagram, reach is a private metric that a social media team can see on their analytics page, but what if we wanted to take a look ourselves? If you’re a competitor to Peet’s Coffee, you might be curious about what kind of reach they’re getting. One of their top posts of 2022 on Instagram simply asked their audience to share how they would take their coffee alongside a video of a latte being made.
The post earned 2,790 likes and 77 comments, totaling 2,867 engagements. Assuming that some people may have both commented and liked the post, we know that Peet’s reached at least 2,790 people with this post.
6. Impressions
Reach and impressions often get confused with one another, but they have an important distinction. While reach refers to the number of people who see and interact with your content, impressions are defined by the number of times your content is seen.
Consider the above Peet’s example. While this post’s reach was only at least 2,790, its impressions are estimated to be around 53,400.
When you post content on social media, it may be viewed by your audience several times. So, why does it matter? Well, someone may be viewing the content multiple times because they want to, which shows that you may have a highly invested audience. But even if they view the content unintentionally, more impressions may still help you with lead generation.
Analyze all the top metrics with Rival IQ. 
In the marketing world, we often talk about the Rule of 7. The Rule of 7 claims that people need seven touchpoints with a brand before they take action, with the goal usually being that the action is to make a purchase. If your audience is viewing your content many times, they’re creating those touchpoints for you. The more they see the content, the more likely they’ll engage with your brand and perhaps even make a purchase.
7. Engagement rate
What exactly is engagement? At Rival IQ, we define engagement as the measurable interaction on organic and paid social media posts, which includes likes, comments, favorites, retweets, shares, and reactions.
Your engagement rate can be calculated in many ways, but we generally focus on two forms. The first is engagement rate based on follower count, which is calculated by dividing the number of engagements by the number of followers. The second is engagement rate by impressions, which is when the number of engagements is divided by your impression count.
Either form can help you see how your social media strategy is faring. Still, because these engagement rates typically differ, you should stick to either the follower count engagement rate or the impressions engagement rate when comparing data. Otherwise, you may get an inaccurate picture of your social media success.
Your engagement rate can give you a deeper understanding of how your content (or your competitors’) resonates with your audience. While more engagement doesn’t necessarily translate to more sales, it can help you spread further online and get in front of people who are more likely to buy your products. According to content planning application Planable, posts with more engagement tend to rank higher on hashtag pages and the Explore page on Instagram. The social media platform will be more likely to show your post to people directly interested in your content and potentially your company.
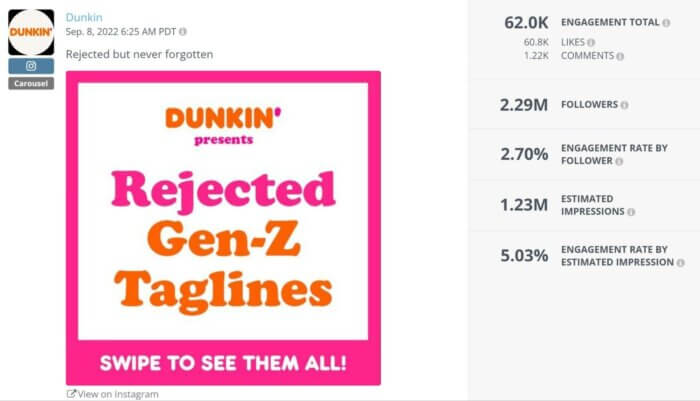
One of coffee brand Dunkin’s top posts of 2022 was a carousel of “rejected taglines” filled with Gen Z vernacular. The post earned an engagement rate of 2.70% by follower but scored 5.03% as its engagement rate by impression.
How to Measure Your Social Listening Metrics on Rival IQ
What if you wanted to measure these social listening metrics using Rival IQ? Let’s walk through how to use these additions to the Rival IQ suite of tools.
You’ll find the social listening features in the left-hand column under “Social Listening.” From there, let’s take a look at Instant Search.
This feature tracks all the posts mentioning the words you search across the online world, including blogs, Reddit, Twitter, news sites, and much more. You can start with one of our recommended searches or look up a brand or phrase yourself. To encompass more of your mentions, you can search multiple terms at once. For instance, if you wanted to see how many times Starbucks was mentioned in the last 30 days, you might look up Starbucks, #Starbucks, and @Starbucks.
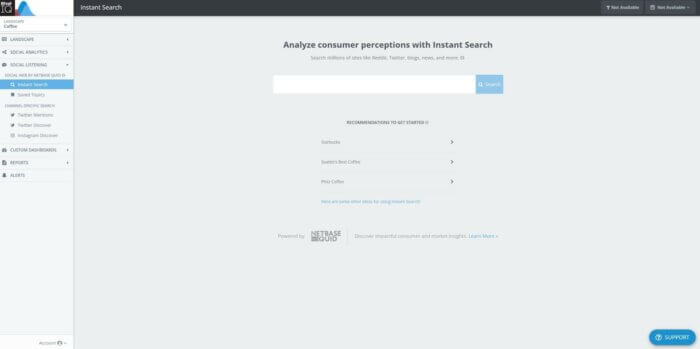
Let’s continue on with Starbucks. From there, you’ll get an in-depth look at Starbucks’ post volume, mentions, and sentiment for the last 30 days. You’ll get breakdowns of your post volume alongside the sentiment of those posts, the most commonly said words about your brand and whether they’re positive or negative, and what the sources of these posts are.
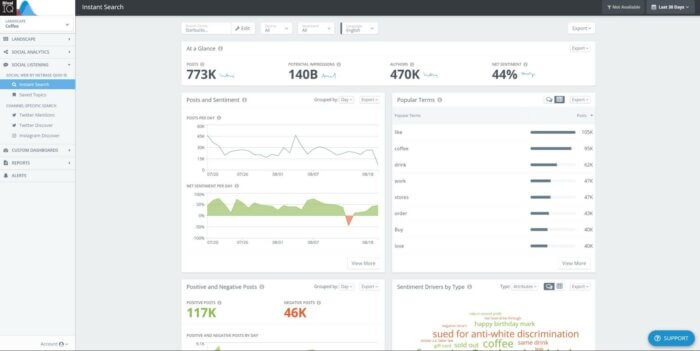
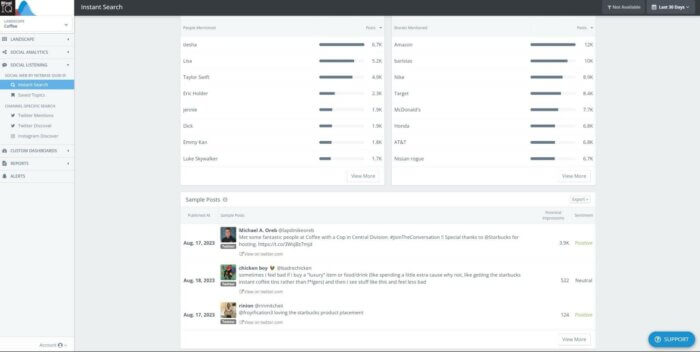
You’ll also get detailed lists of popular terms appearing in these posts, the most common hashtags in these posts, the domains that post about you most often, the authors who talk about you the most, the most common people and brands mentioned in posts about you, and which hashtags appear in posts about you the most.
Scrolling further down, you can dive deeper into these social listening metrics by checking out the Sample Posts section. This section will show you the top posts mentioning you, as well as additional information like the post’s impression count and sentiment. You can also see more about specific sections by clicking the View More button.
You can refine your search if you only want to look at specific sources or want to exclude posts with particular words or phrases. At the top of the page, you can select the source you want to look at, as well as choose to look at just posts with positive, negative, or neutral sentiment. Or you can click the Edit button to edit your search further.

If you select the Edit button, you have several options for narrowing down your search. Choose the sources you want to look at, include or exclude posts with specific words, exclude authors or domains, or reduce noise by excluding things like sponsored posts, coupons, or profanity.
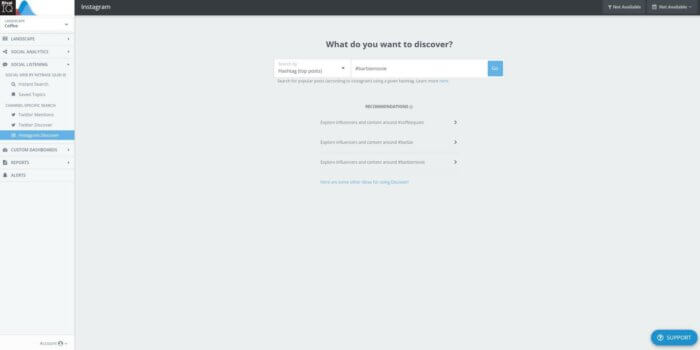
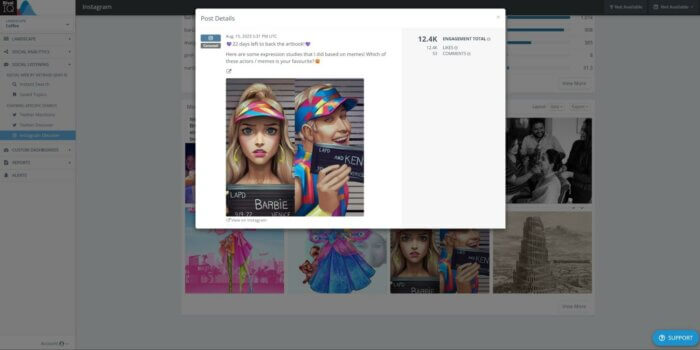
Rival IQ also has additional social listening features, including Twitter Discover and Instagram Discover tools. With Twitter Discover or Instagram Discover, you can search for mentions in a variety of ways. Search for a specific handle or look for how many times a hashtag appears, either in top posts mentioning it or in recent posts containing the hashtag. Let’s search for #BarbieMovie on Instagram, looking for top posts with the hashtag.
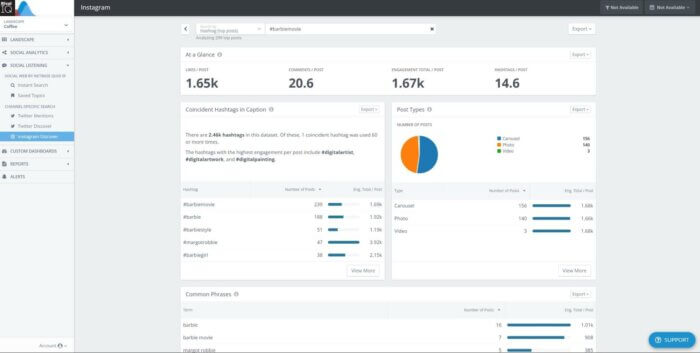
From there, you’ll get an overview of the hashtag’s usage, including post volume, how many likes on average posts containing this hashtag get, how many comments, total engagement, other hashtags used alongside this one, and other common phrases appearing in these posts.
Want to learn more about the engagement on these posts? Scroll further down to find the Most Engaging Posts mentioning your hashtag or handle. From there, you can click View More to see more posts or click on a specific post to learn more about its engagement.
Wrapping Up Social Listening Metrics
Paying attention to your own online performance can help you boost your business online, but social listening takes things a step further. By staying on top of your social listening metrics, you can engage your target audience better, turning your followers or even your competitors’ followers into fans.
However, some brands may be getting hundreds or even thousands of mentions a week, which is hard to keep track of. Social listening tools can help you stay ahead of your competitors and engage with your audience in a timely manner. Using such a tool makes social listening much more manageable, so you don’t have to scour the web on your own.
Looking for more ways to use social media to help your brand? Check out our guide to the best ways to use social listening to give your marketing a boost.
