Over the past few months, we have added multiple new features and reports to the Rival IQ application, including SEO keyword rankings, Twitter mentions and much more. Now, we are excited to launch a new and improved user interface and design, making it easier for you to find, use and report on all of the rich data and content in Rival IQ.
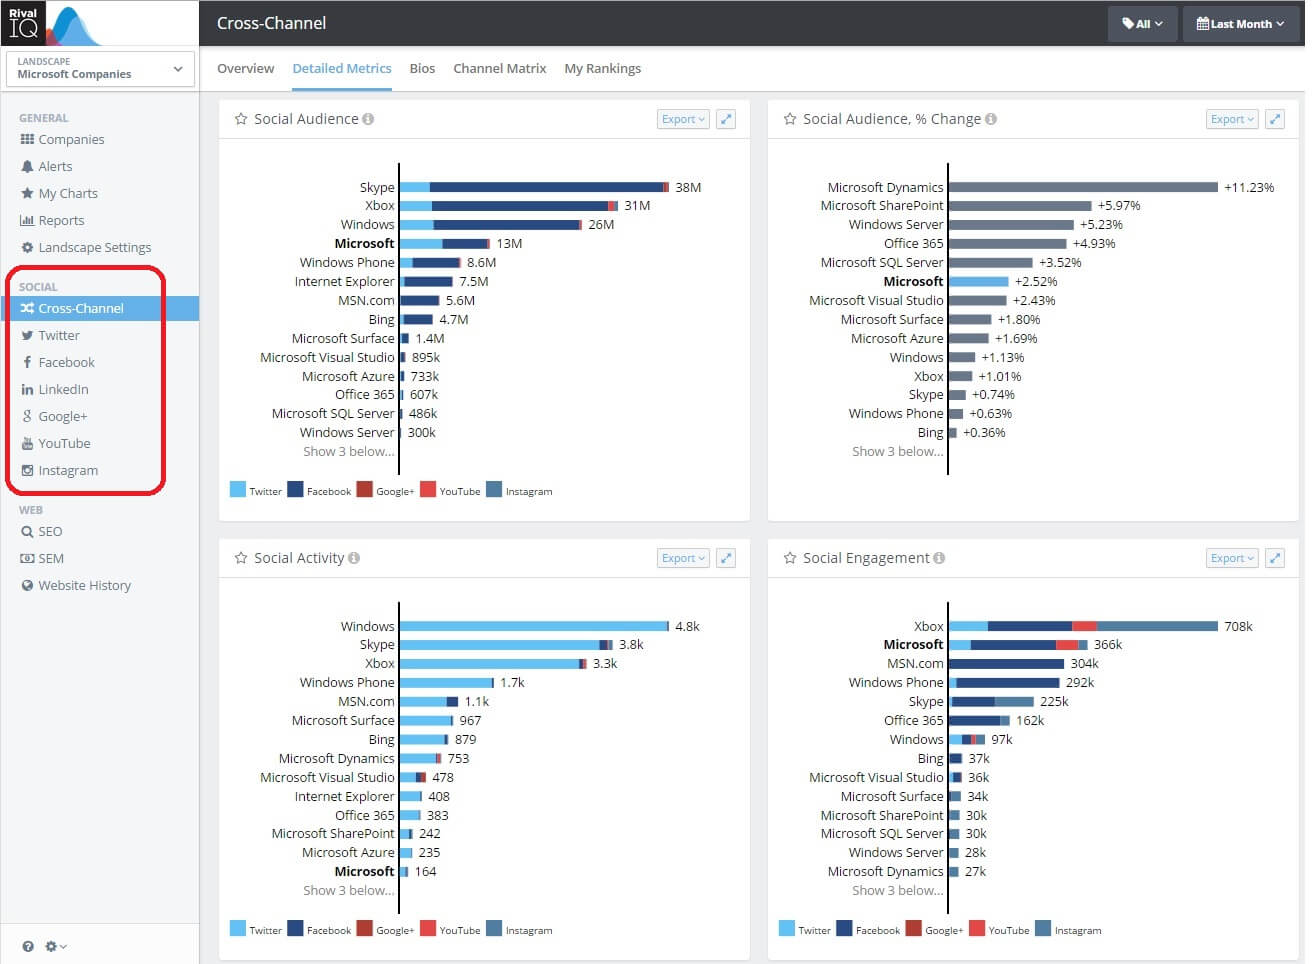
Rival IQ’s new user interface makes it easy to find all reports by channel or cross channel!
The new interface organizes content by digital channel rather than by report type, making it easy to find the information you need for single channel or cross-channel analysis across social media, SEO, SEM and Web content.
We received a lot of customer feedback and incorporated this valuable input into the updated version. And we look forward to receiving additional comments and feedback from our customers, so we can continue to improve the user experience and more quickly solve the challenges marketers face.
Improved User Interface Plus New Features!
In addition to improving the overall user experience and workflow, we also are launching some new functionality and improvements, including:
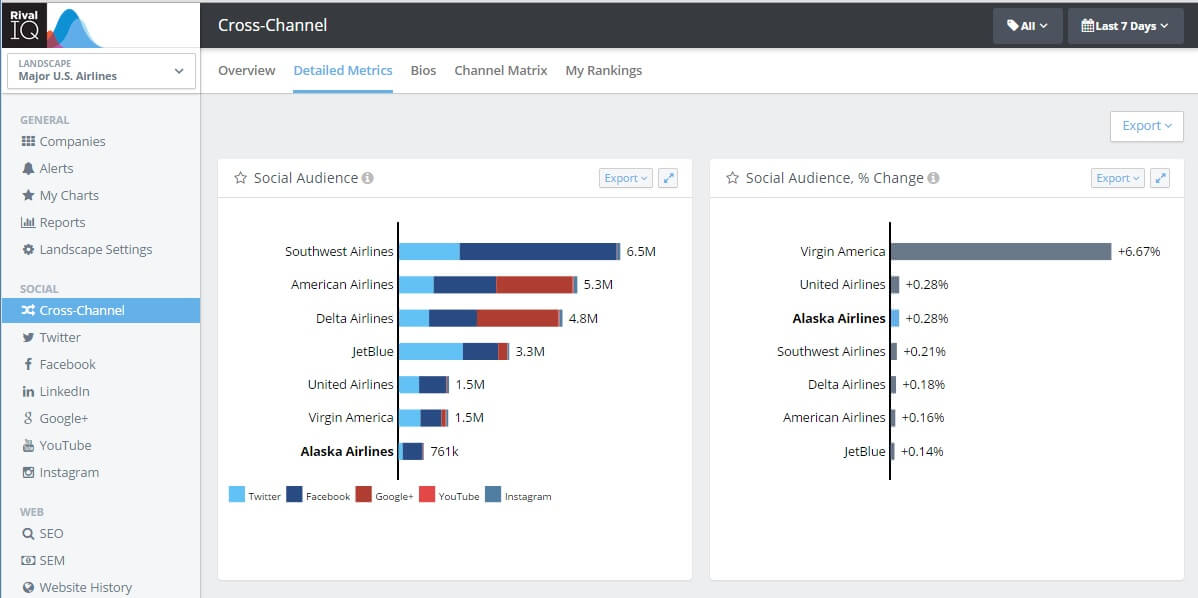
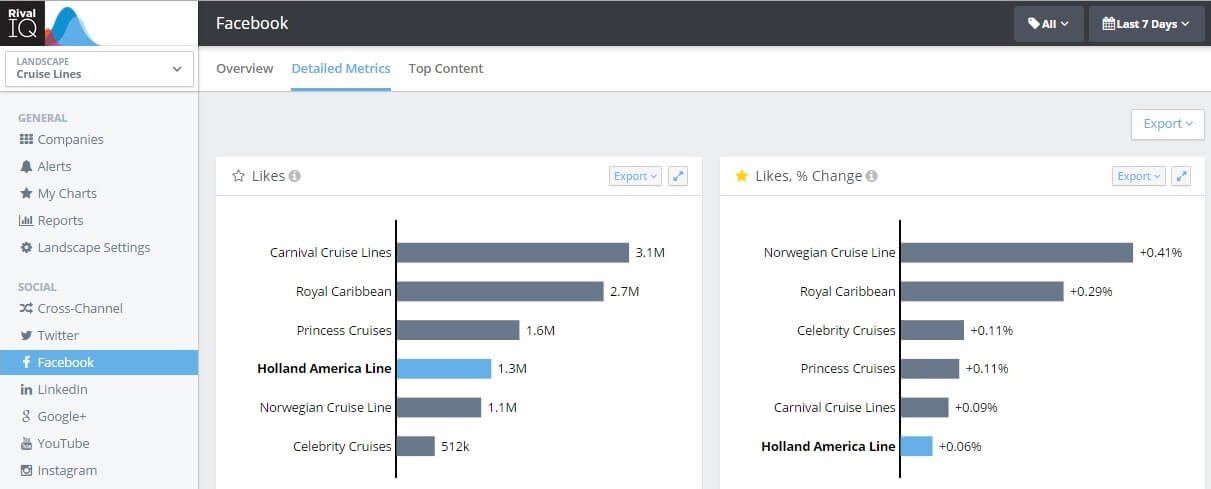
- Side by side charts of related metrics for easier analysis: Metrics like number of social followers and follower growth are now side by side, making it easy to immediately understand what is happening with a social audience for both you and your competition, either for a single social media network or across all six social channels Rival IQ tracks.
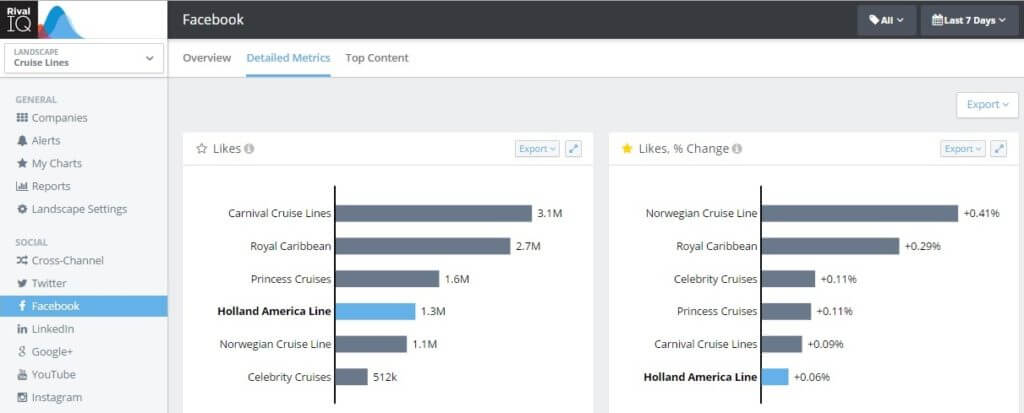

Now related reports are shown side by side for faster analysis of a single area, like audience, activity or engagement!
- Consistent exporting of charts and reports across all areas of the application: Rival IQ has always had awesome export to PowerPoint, PDF, csv and .png, and now that export capability is extended across the entire tool, so in a single click, you can download one or several reports in the format you want!
- Top content reports now easier to find and download: We’ve always had a strong set of curated reports, but we’ll admit not everyone found them right away. Now, there’s a special section called (you guessed it!) “Reports”, where we’ve assembled the most frequently downloaded reports by channel or for larger sets of cross-channel reports.
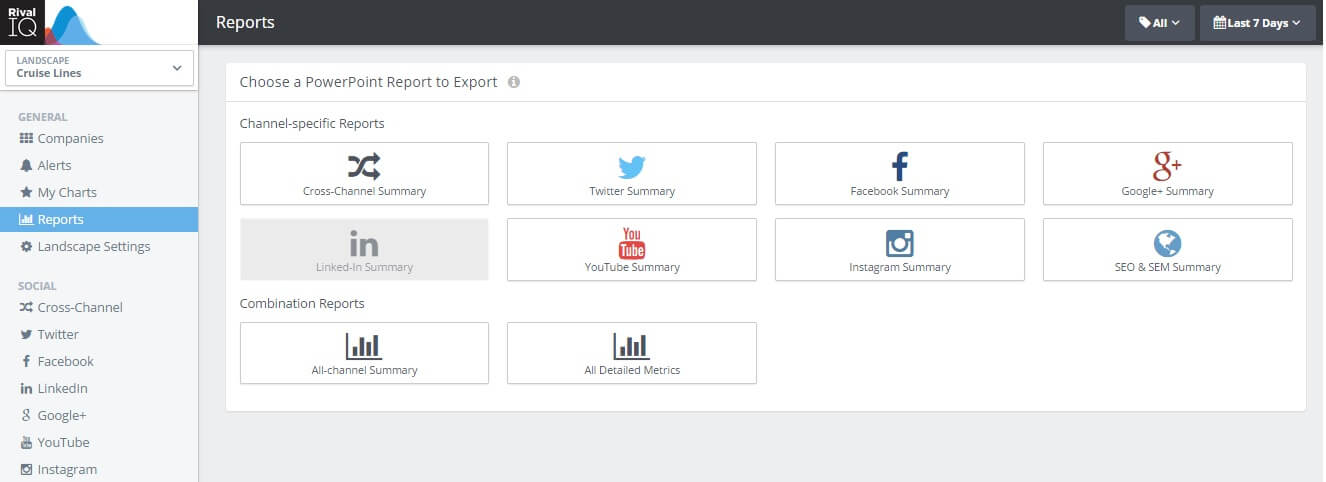
All top curated reports are available in one easy place for fast export!
- Single company export now available: Sometimes you just want to export reports about one company, rather than all the companies in your Market Landscape (what Rival IQ called a group of companies you compare against each other). Now, you can!
- New “My Charts” where you can create your own set of curated reports: There’s always been the ability to create your own one or two dimensional charts in Rival IQ, but we’ve made it easier and added some new functionality, like trending and more report options. And it’s now easy to find under “My Charts”, where you can create your own personal “dashboard” of reports and create customized charts.
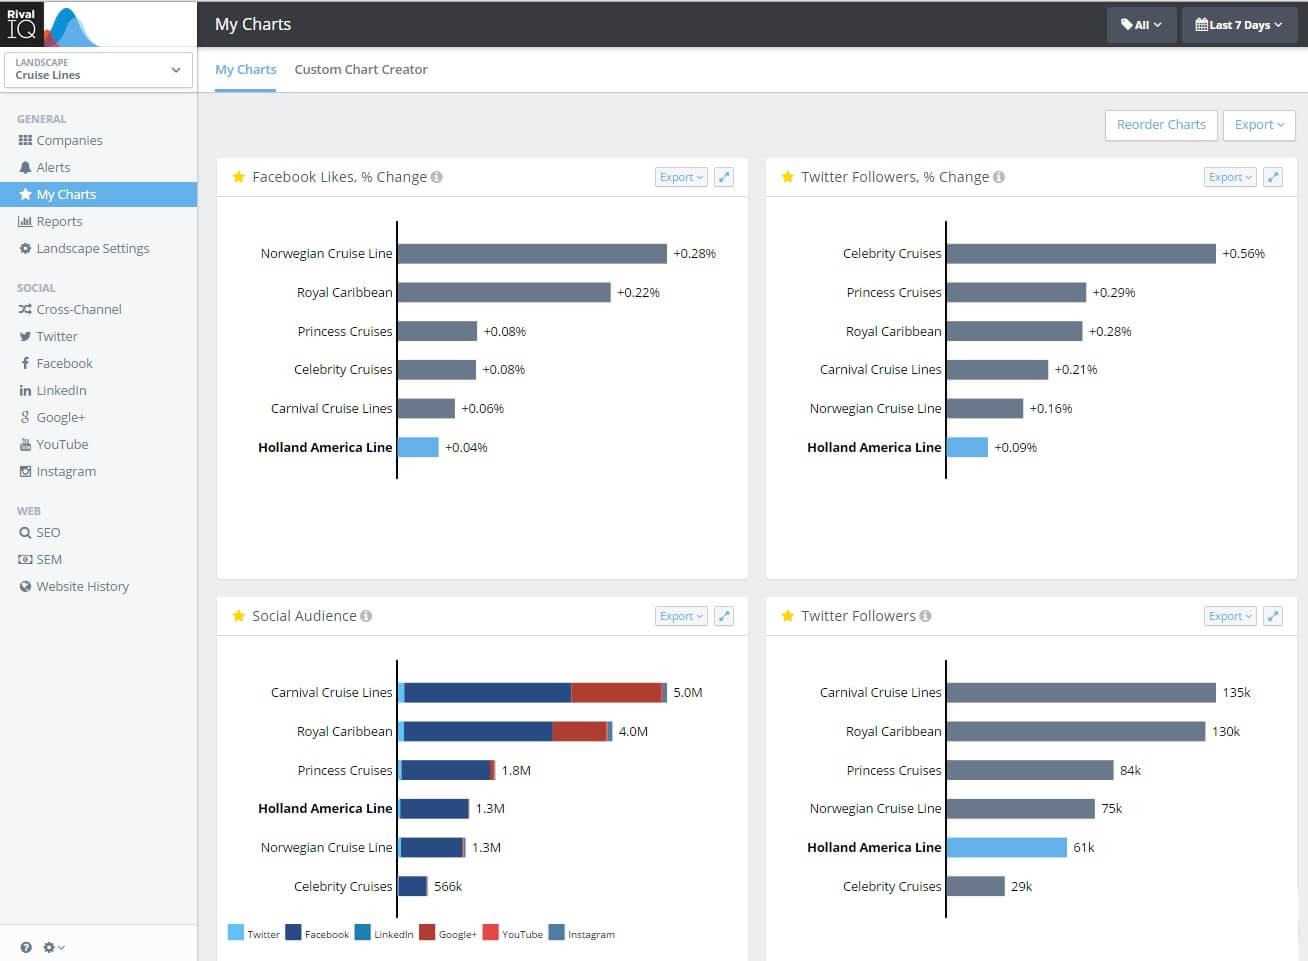
In “My Charts” you can create your own customized charts and a personalized set of curated charts.
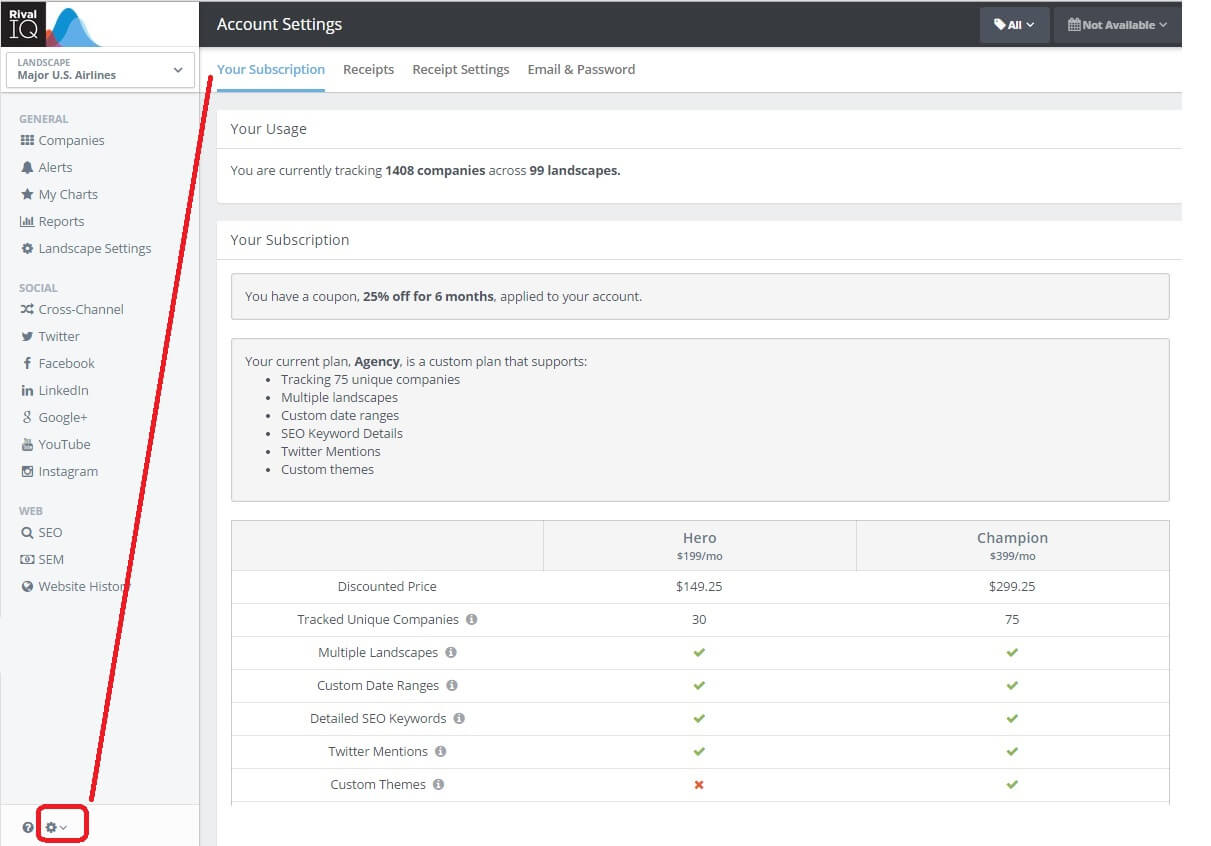
- Ability to Download Receipts and easily update your Invoice Settings: Since Rival IQ is a software-as-a-service application, customers asked to more easily download receipts and update invoice settings. We’ve done both those things, and made them easy to find under the settings tool.
New User Interface Navigational Structure
With this new user interface, the application is now organized into three key areas:
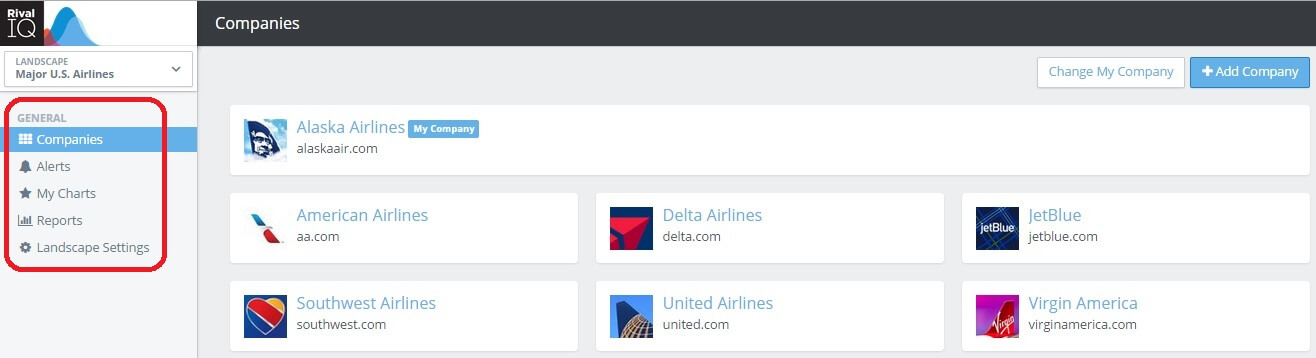
1. General: The first section of the application incorporates key information about your Landscapes, settings, alerts and reports. You can think of this as the area of Rival IQ where you manage your core content, companies and reports.
2. Social: This section includes summary reports and detailed metrics for top content, social media analytics and trending data for six social networks: Twitter, Facebook, LinkedIn, Google+, YouTube and Instagram. It also provides cross-channel analytics, providing aggregated data for a holistic view of a landscape on social media.
3. Web: This area of the application brings together content and analytics for organic search (SEO) and paid search (SEM) as well as website history.
Functions Available at All Times
There are also helpful guides and content available on every page as you navigate through the charts and reports.
- Landscape: Shows which Landscape is active at the time, with an easy dropdown to change the report views to a different Landscape or to create a new Landscape. One of the great benefits of using Rival IQ is the ability to create multiple Landscapes. These could be your top competitors, companies in your market who you want to track, companies you admire, or, if you’re a large enterprise, a group of your firm’s geographically-specific brands or sub-brands.
- Tags: Shows you which tag is being used to filter reports or if all companies in a Landscape are being analyzed. Tags are a great way to create sub-groupings to analyze certain companies in a single Landscape.
- Date Range: Shows you the date range being used to filter report results, and enables you to change the date range on any page.
- Help: This question icon takes you to helpful resources about the Rival IQ app, including How To Videos.
- Blue Message Bubble: The blue circle with a question mark gives you an easy way to message Rival IQ support straight from the app.
- Account Settings: Here is where you manage your subscription, your profile settings, such as email and password and manage your receipts.
Check out the new user interface for yourself!
To help you quickly experience Rival IQ and our new user interface, here are 5 steps to getting started:
Step 1: Set up a great landscape
Make sure your landscape has at least three competitors. Why? Because you need context! Have other companies to benchmark and compare yourself against. Not sure what companies to put in your landscape, use my Cruise Lines landscape to see how the analytics and reports work, and then create your own!
Step 2: Review social channels & company information:
Review the Social Channel Matrix for a fast analysis of the social presence for each company in your landscape. Review the handles and make sure we got it right. See an issue? Make a change request, so we can fix it as soon as possible and make sure your data is correct.
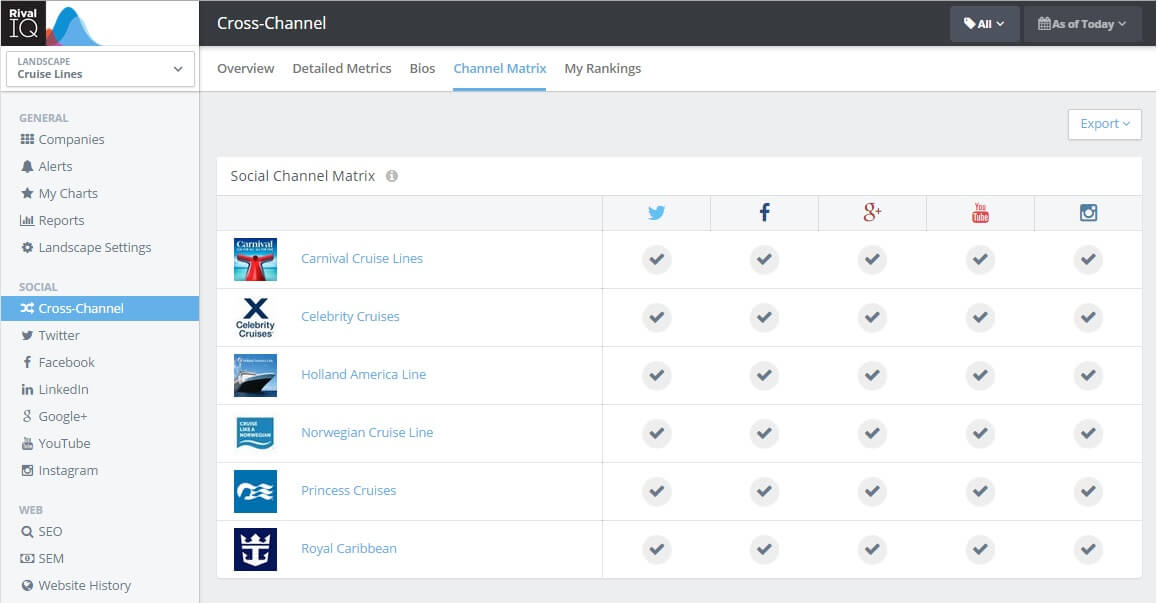
The Social Channel Matrix gives you a quick analysis of each company’s social media presence.
Step 3: Benchmark overall social metrics
Now, it’s time to analyze the landscape with the Social Overview. Where do the companies in the landscape have the most social fans? Where are they most active? And which channels are driving the most engagement? Once you review this landscape’s social profile, you are ready to dig into channel-specific data.
Step 4: Analyze detailed metrics per social channel
Pick the top channel (such as Facebook) for this landscape, and see the list of the top 50 posts in that channel for the time period. Who is posting the most engaging content? When was that content posted? And what type of post landed in the top 50? This is a great report to use on a regular basis to improve your posts and increase engagement!
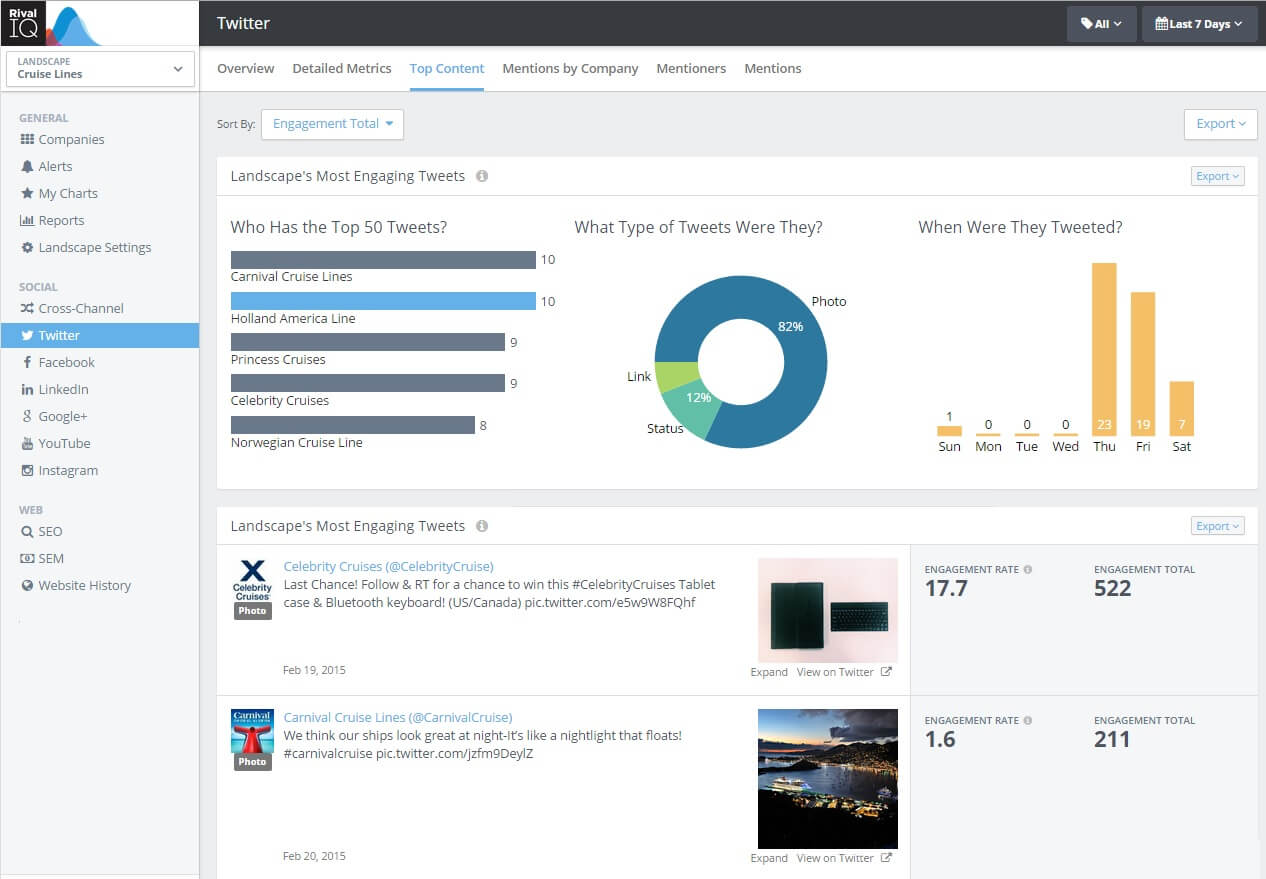
Here’s an example of Top Content for Twitter.
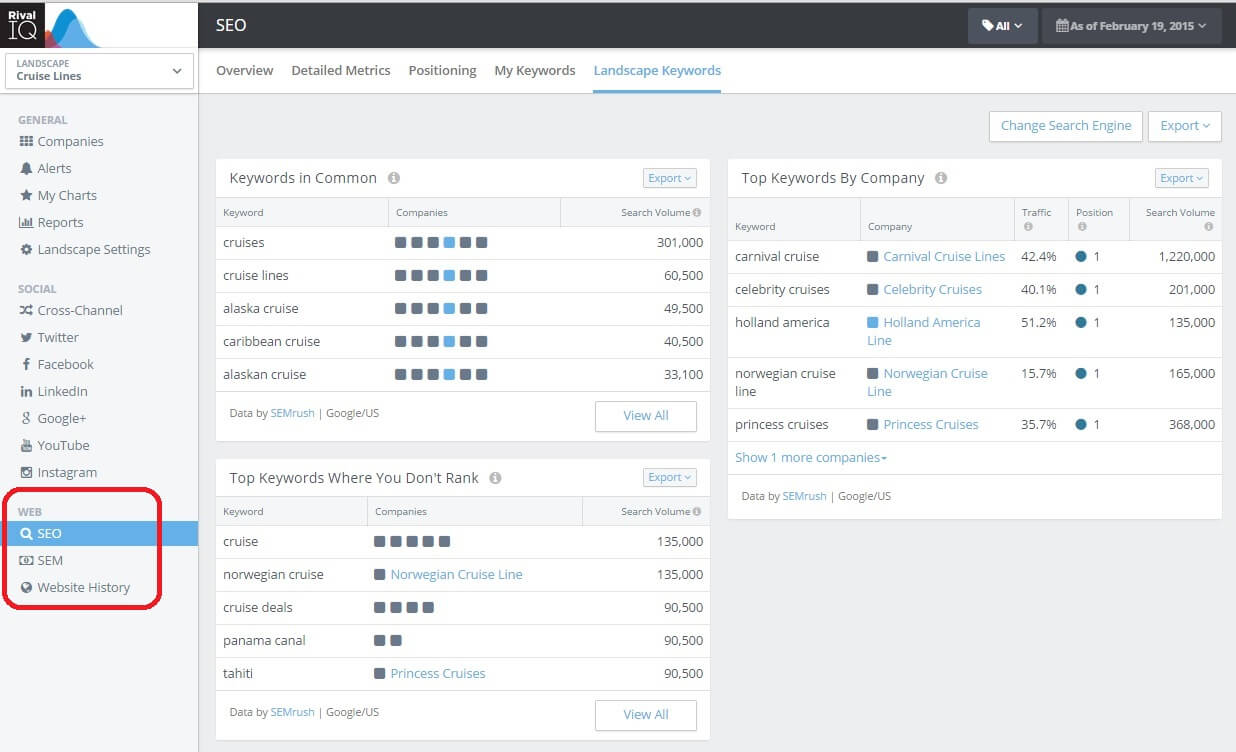
Step 5: Understand competitive SEO keyword rankings
In this SEO report, you can start to understand what keywords are the most critical for you and the companies in your landscape. What keywords are driving the most traffic to your website? Start using those terms in your social media posts! What keywords are your competitors ranking but you aren’t?
Now, Put it to Action!
After going through these steps, put your short-term action plan together.
Are you missing from a key social channel? Make a plan to get your presence established. Too few followers? Time for a follower campaign! Not enough engagement? Start modeling your posts and borrowing the best practices you are seeing in Rival IQ to improve your own content!