One of our absolute commitments at Rival IQ is engaging with our customers to make sure we understand how they are using our application and what new features or functionality they would like to see us add. One area we have received consistent feedback is around SEO analytics and the challenges marketers and agencies face in obtaining fast, easy to understand and compelling SEO data – not only for their own companies or clients but compared to the competition.
With Google increasingly removing organic keyword source data from its own analytics product, it’s become more difficult than ever to know which keywords are working, which ones to optimize for, and which words your competition is owning and you aren’t, and to fully understand the content needed for success.
Also, our customers have asked for a single destination for both social and SEO analytics with this comparative view, and this is what we are delivering.
I am excited to announce the beta launch of our new SEO Analytics feature. Our SEO reports provide the same rich comparative data, fast analytics, easy-to-read graphs and dynamic PowerPoint reporting for SEO analysis that we do for social media channels. We have built this new analytics feature based on our work with hundreds of companies, who we help measure, analyze and understand how they are performing in social media as well as track and learn from what their key competitors, market leaders or other companies are doing.
The SEO Analytics feature includes several reports for SEO positioning and keywords, including highest traffic keywords, keywords in common, top keywords your company doesn’t own and top keywords per company. We are partnering with SEMRush to provide the comprehensive data behind our analytics reports.
The SEO Analytics feature is available now in Beta as part of all monthly subscription packages, and we welcome their feedback as we add more capabilities moving forward. Free trial and Pro users receive the dashboard reports for all five SEO reports. Customers of our ProPlus and Enterprise/Agency packages also receive detailed charts across our five report areas.
At beta launch, we are providing five report areas, each presented as an overview dashboard and with more detailed charts.
- Key Positioning & Recent Changes for your company: This shows your search result position on Google search for the top 100 keywords, showing where your keywords rank and where you’ve most improved and declined in ranking.
- Highest Traffic Keywords for your company: This includes what estimated percentage of traffic that keyword drives to your website, the search volume, and your current position on Google.
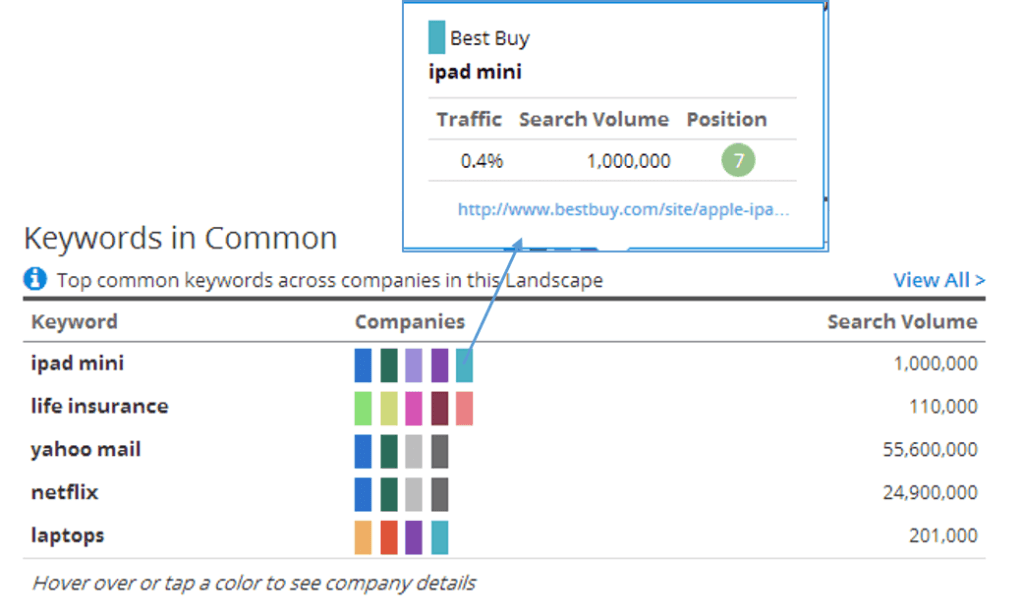
- Keywords in Common: This report shows keywords ranked by two or more companies in a market landscape, revealing how multiple companies are competing for a keyword. This report also reveals the traffic volume, cost-per-click (CPC), the company’s search ranking and the source URL for that keyword in one easy-to-read graphical chart.
- Top Keywords Your Company Doesn’t Own: This report enables you to see the top keywords each company across your market landscape own, including the corresponding search volume, web traffic, source URL and current search position for that keyword.
- Top Keywords per Company: This report shows which keywords are driving the most traffic for each company in your landscape, including search volume, percentage of traffic, CPC, and search ranking for each company’s keyword.
Additional capabilities will be added based on customer feedback and our own data analysis, and we look forward to continuing to receive feedback and ideas from our customers!
Here’s an example of one report – Keywords in Common – from my Fortune 100 Market Landscape, which is what we call a group of companies you track and compare against each other. In our SEO Analytics reports, you can easily scroll over companies to get more detail on that result, including source URL, estimated traffic volume and more.
With our new SEO Analytics reports, data is easy to read and obtain more details

