At Rival IQ, we love writing social media engagement reports.
The process is usually something like this:
- Find an interesting industry to report on
- Develop a list of the top brands in that industry to include in the report (this is often much harder than you’d think!)
- Look at how those brands compare to one another across social channels on metrics of audience and engagement
- Develop best-practice recommendations for other brands in that industry.
Having written seven of these reports myself, I was excited when we chose the NFL for our next subject for a couple of reasons:
First, as a recent immigrant to the US from Australia, I’ve thrown myself into learning about college football and the NFL as a way of integrating and understanding American culture. As a result, I’m a raving fan of both the Huskies and the Seahawks (can you tell I live in Seattle?). But don’t worry: this report is completely objective.
Second, and more important, this is the first ‘industry’ that afforded me the chance to look not only at social media success, but at real-life success on the field, and to compare and contrast these two metrics. This approach resulted in some truly fascinating insights into how each NFL team engages on social media.
You can download the 2017 NFL Social Engagement Report here.
The Methodology
Before we dive into the results, I’d like to outline the method used to develop this report. I began by loading all 32 teams into Rival IQ and chose to study only the regular season (September 9, 2016 – January 1, 2017) in order to give a fair footing to all teams. I then used Rival IQ’s reporting to gather all the data on each team’s engagement rate. (Engagement is defined as measurable interaction on social media posts, including likes, comments, favorites, retweets, shares, and reactions. Engagement rate is calculated based on all these interactions divided by total follower count.)
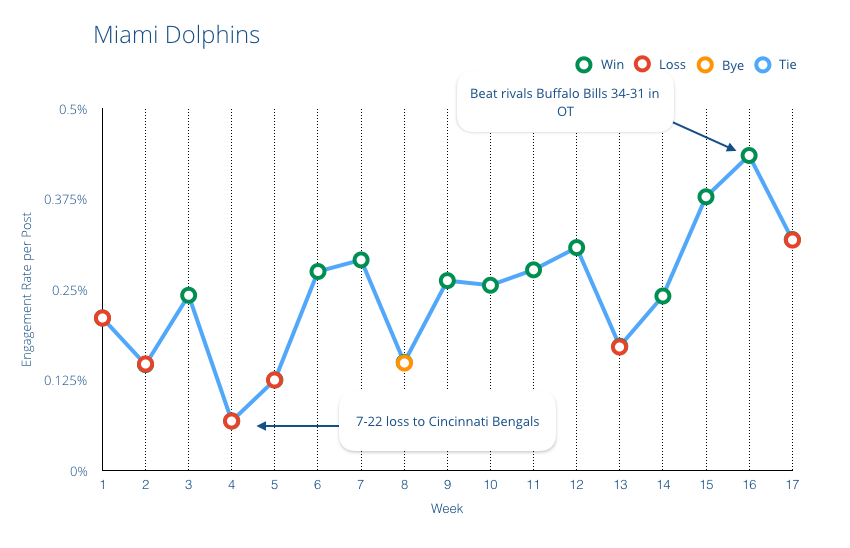
After exporting all of this data for each team on a week-by-week basis, I then added columns for whether the team won, lost, or tied, as well as whether the team was at home or away. I then superimposed the win/loss data on week-by-week graphs of social engagement for every team.
Here’s an example of that data shown across the season for the Miami Dolphins:

Understanding loyalty with the Fair-Weather Fans Index
By tying all this data together, I was able to develop what I’ve christened the ‘Fair-weather Fan Index.’ This index takes the difference between the average engagement rate when a team wins vs. the average engagement rate when a team loses. The bigger the gap, the more fair-weather the fans.
So, who has the most loyal fans in the NFL? I’m not sure anyone would be surprised to learn that the New York Jets’ fans are at the top of the list. The Jets were the only team whose fans engaged at a higher rate when the team lost. That said, their average engagement rate (0.163%) was much lower than the NFL average of 0.23%. The Jets are closely followed by the Panthers, Redskins, and Ravens when it comes to fan loyalty.
But here’s what you really wanted to know: the team with the most fair-weather fans is the Philadelphia Eagles. (Are you really surprised?) When the team wins, their fans engage at a rate of 0.313% while when they lose, engagement drops to 0.159% – 50% lower! Accompanying the Eagles at the bottom of the list are the Vikings, Browns, and Bears fans. As someone in the office put it, ‘You can’t blame Browns or Bears fans for going a bit wild when they finally win something.’
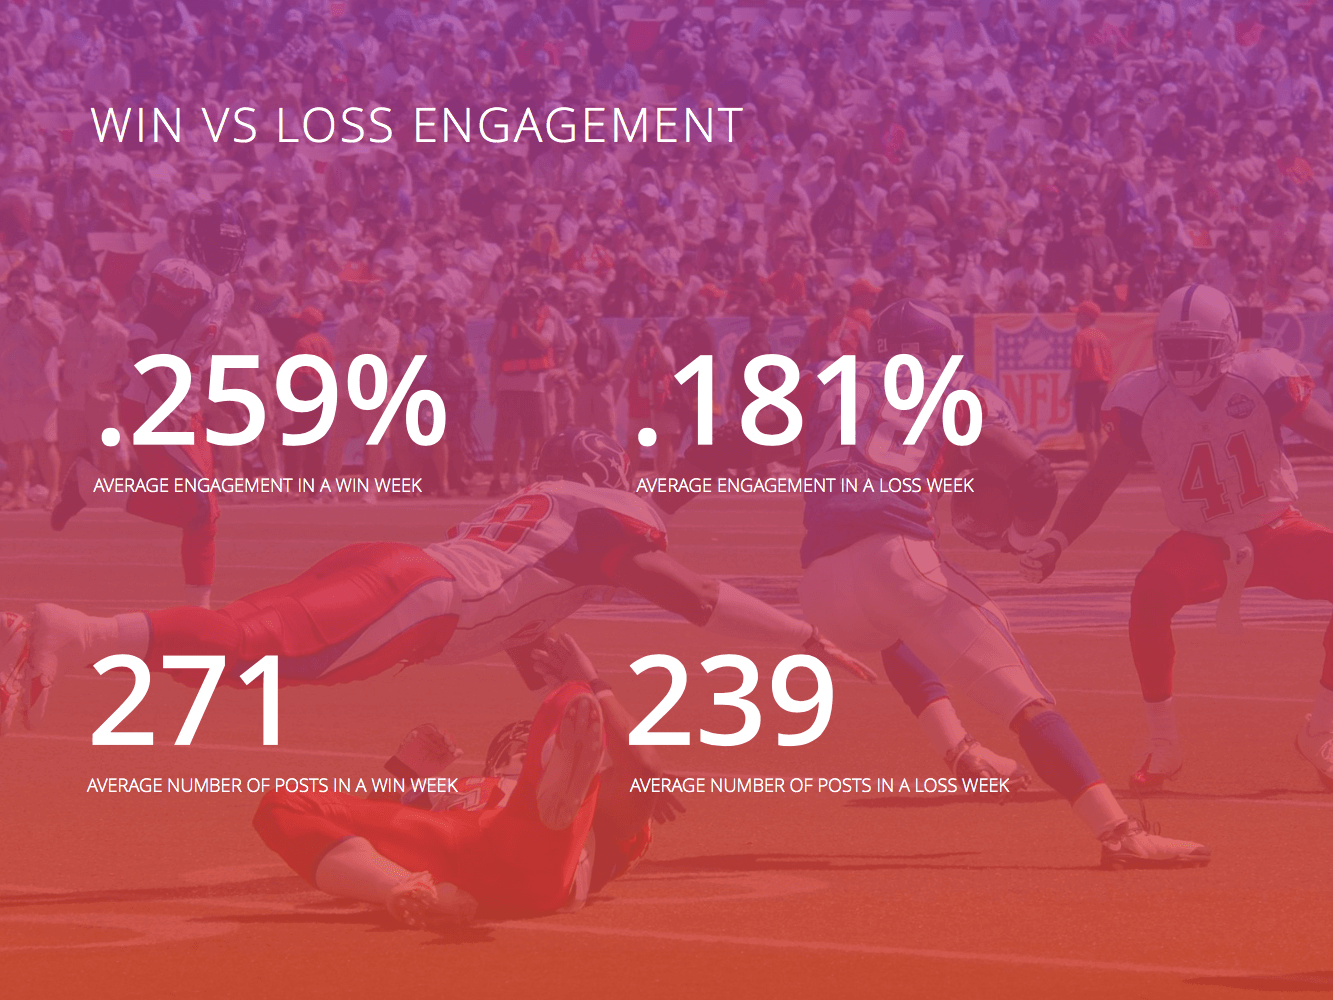
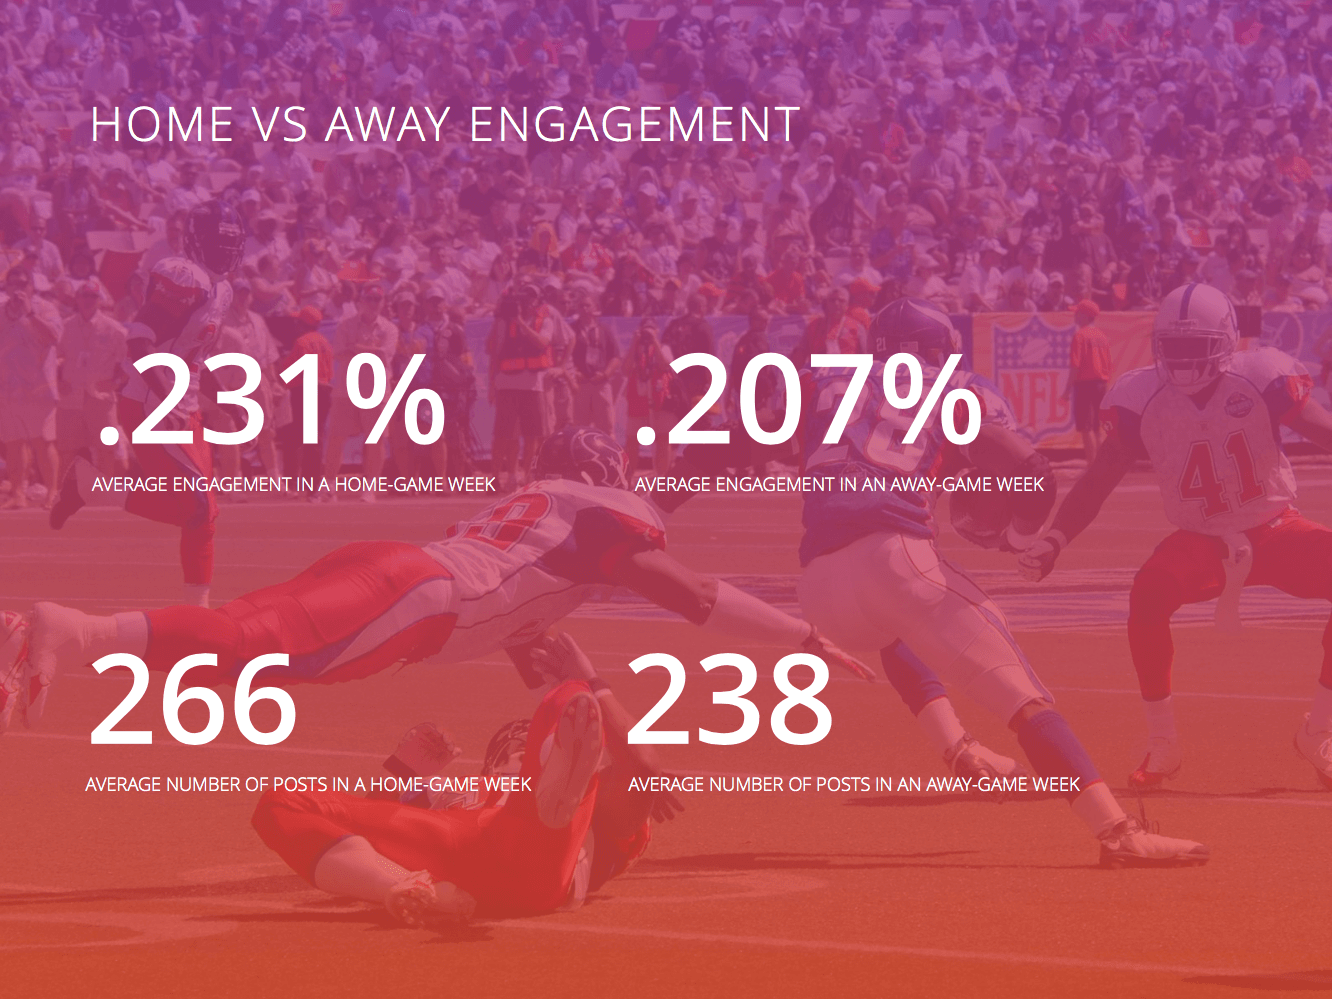
You can download the report here to see the entire Fair-Weather Fans Index. Some other impressive stats are outlined in these two pull-outs from the report.
The TL;DR is that fans engage at higher rates and teams post significantly more often when they win or play at home.


Some observations and musings
The average engagement on Instagram across the 32 teams was 2%, compared to 0.16% on Facebook and 0.046% on Twitter. Teams need to start focusing more in Instagram if they want to improve social engagement.
In every other report I’ve written, there’s a clear trend: the larger a brand’s following, the lower their engagement. This report is the only one where that trend hasn’t surfaced. The Cowboys are the best example of this: they’re ranked 1st for following and 2nd for engagement. Whatever they’re doing, they’re doing it right.
As I designed this report, I began by creating the engagement rate graphs without knowing which weeks the teams won or lost, or who they played. After the first few teams, I began to be able to accurately predict whether the team had played a rival that week or whether they’d won or lost, purely by looking at social engagement.
NFL marketing teams would do well to look at this data and find ways to capitalize on rivalries, as well as develop content that still engages fans when their team loses.

