We’re excited to announce a big expansion to Twitter analytics!
We’ve added tons of Twitter data previously available only in the native app so you can access all your social stats without leaving Rival IQ. We know this was a feature many of you were hungry for, so get out those bird emojis and Twitter GIFs and start celebrating! 🐦🎉
Here’s a tl;dr of everything you can do with these new Twitter features:
- Crush your competition with even more competitive tweet metrics: Check out your competition’s video views and gauge the impact of their tweets with reply metrics.
- Measure more with new private Twitter Analytics: Clicks and impressions are now available for an even more accurate sense of your Twitter engagement.
- See how you’re really doing with in-depth profile data: Effortlessly track follower adds and removes, analyze your follower/following ratio, and even see how many lists you’re on at a glance.
- Customize your Twitter metrics: These new Twitter metrics are available in all your Rival IQ reports and dashboards for truly custom analysis.
Want to hear more about these features? Watch this recorded webinar with Product Manager Tiffany Lin and Digital Marketing Manager Christina Everett that profiles all these new Twitter Analytics.
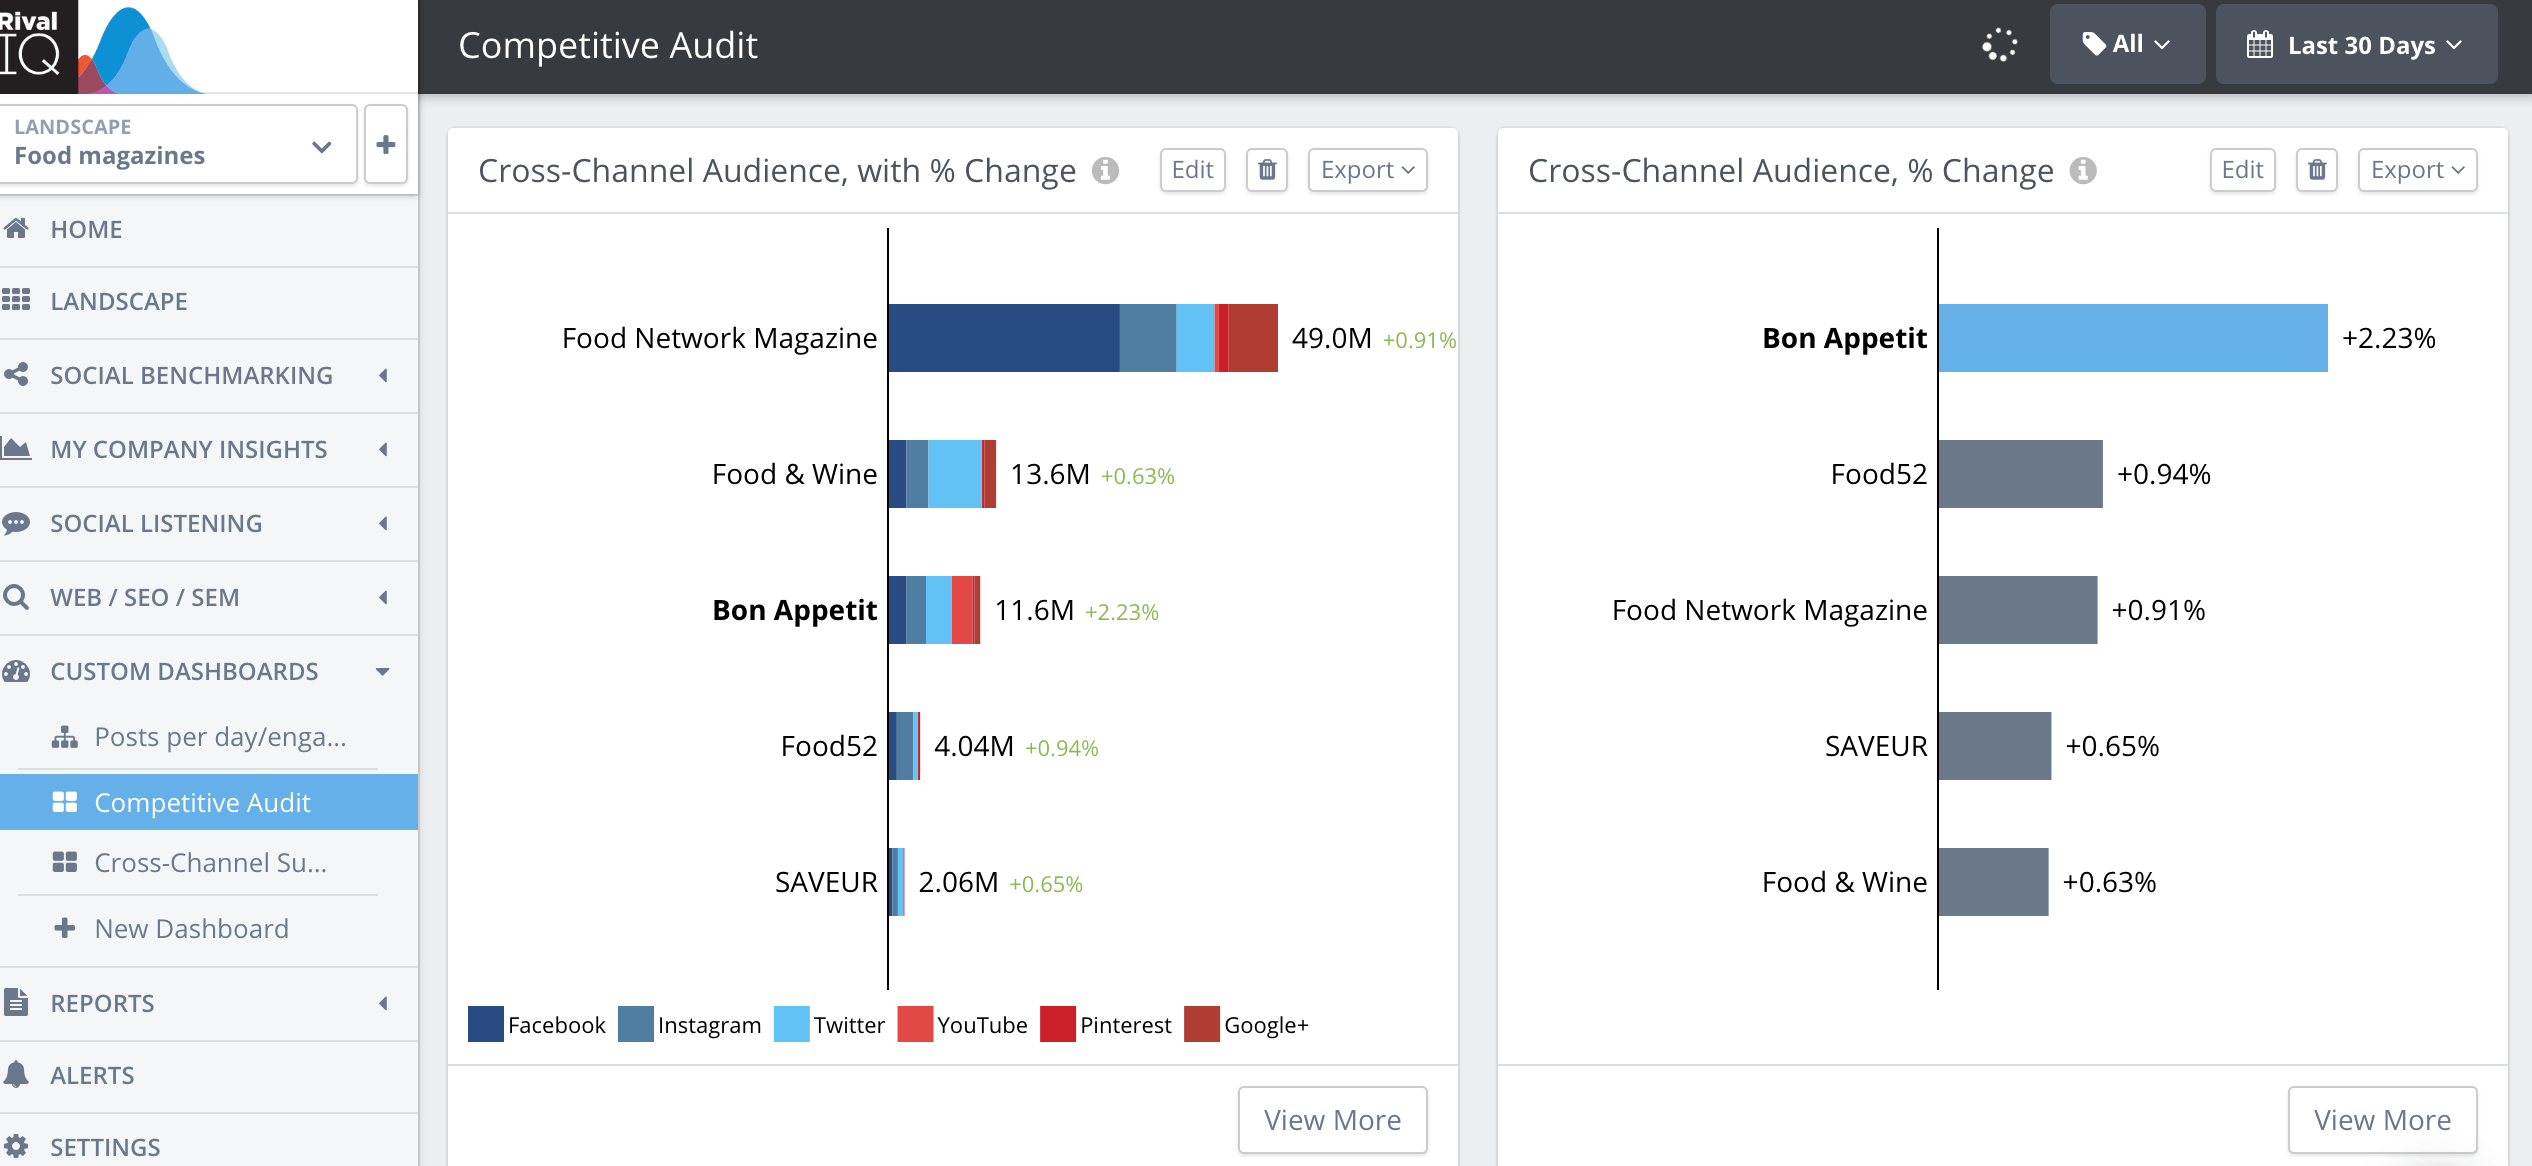
Crush your competition with even more competitive tweet metrics
We know tons of you are using Rival IQ to get a jump on your competitors, so a big part of these new Twitter analytics is all about that competitive visibility.
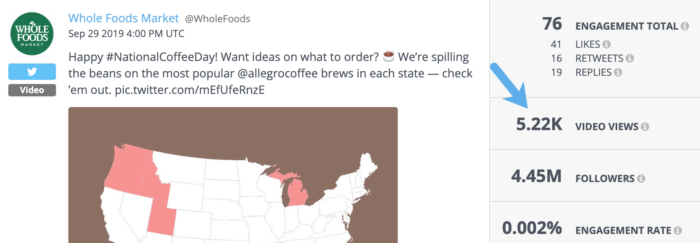
This video tweet from Whole Foods had over 5,200 views.
- Video views: Pop into any video tweet from a competitor to see how many views it had. Video views make it easier than ever to spot compelling tweets from your competitors by highlighting high-engagement videos. You’ll be able to access competitive video views and replies back through January 2018.
- Reply metrics: Your engagement totals and rates are even more accurate because they reflect every like, retweet, and now reply on your tweets. Now you can see exactly which tweets and topics are driving conversation for your competition.
Measure more with new private Twitter Analytics
Impressions and clicks are now available in our brand-new Twitter Analytics dashboard. If you’re a fan of our existing Instagram Insights panel that puts profile and post metrics at your fingertips, you’re going to love the new Twitter Analytics dashboard. Check out these metrics which will make your Twitter reporting even more accurate:
- Impressions: See exactly how many views your tweets are getting. Bonus: you can now examine your engagement rate by impression.
- Clicks: See anytime someone clicked on your tweet, from URLs to hashtags to retweets to replies, and even if the user clicked on your profile.
- Replies: Replies are now included in engagement metrics (in addition to retweets and likes) for a more complete picture of your Twitter engagement.
- Video views: See exactly how many views your videos are scoring on Twitter to fine-tune your content strategy.

One of the first things you’ll notice when you click into this dashboard is that impressions are *everywhere*. We’re excited to include this critical data point all over our app with this update to give you an accurate sense of how many pairs of eyeballs are consuming your social.
Dive deep into your Twitter impressions.
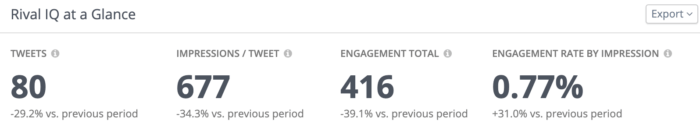
We know this information is top of mind for savvy marketers, so we’ve built impressions data right into our At A Glance panel so you can understand your reach and the true context for your engagement data. We’re also including a new Twitter metric, engagement rate by impression, for more accurate engagement rates.
Spot patterns in your activity and impressions in this brand-new panel.
The activity & impressions panel is a great new way to get a sense of how you’re doing on Twitter. Easily toggle between monthly, weekly, and daily metrics for a sense of how your activity and frequency affect your followers’ interest in your Twitter content.
We know many of you are excited to be able to dig into reply engagement metrics for your competitors, so hold onto your hats–we’ve got that data privately too! A reminder that your Twitter engagement totals and rates now include replies as well, giving you an even more accurate picture of which of your tweets are scoring the most likes, retweets, and replies.
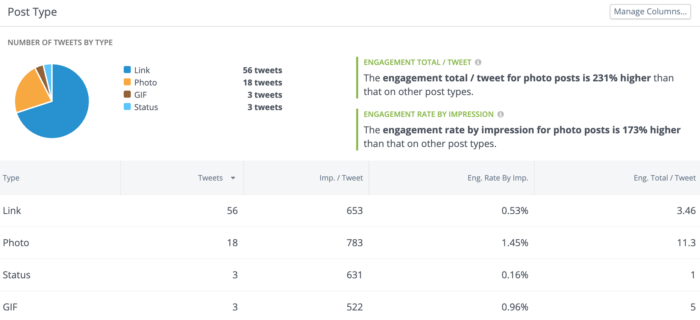
Tons of impressions data and insights in our new Post Type panel.
Speaking of getting granular with your tweet types, we’ve got a new and improved Post Types panel that breaks down the success of each of your post types. See whether your links, photos, statuses, videos, or GIFs are resonating most with your followers so you can tweak your strategy to include more of the winners. Plus, we can now distinguish between GIFs and videos to help you know exactly what’s working.
This panel also includes strategic insights to find outliers in your Twitter data and opportunities in real-time.
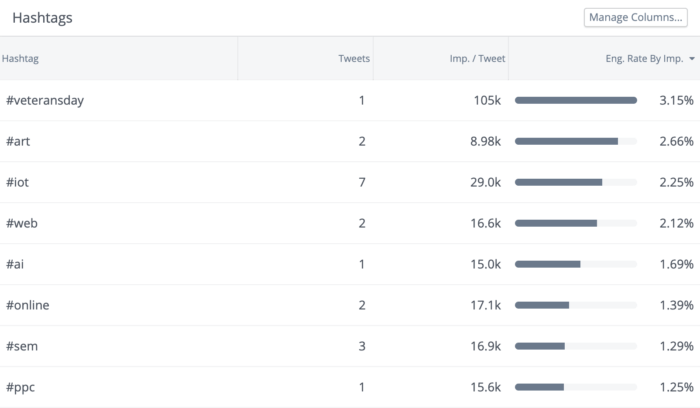
Check out new impression info in our hashtags panel.
We’d argue (and our Social Media Industry Benchmark Report definitely backs it up) that hashtags work the hardest on Twitter, which is why we’re introducing an improved hashtags panel for your private data. Quickly spot which hashtags are grabbing the most impressions and the highest engagement rate. (Pro tip: See exactly how many impressions your hashtags are getting, and then head back into competitive Twitter analytics to see which hashtags are working best for your competitors!)
Use boolean search to find anything in your (or your competitors’) tweets.
Want even more control over your metrics? Use our intuitive boolean search to find anything you need, from hashtags to mentions to emojis.
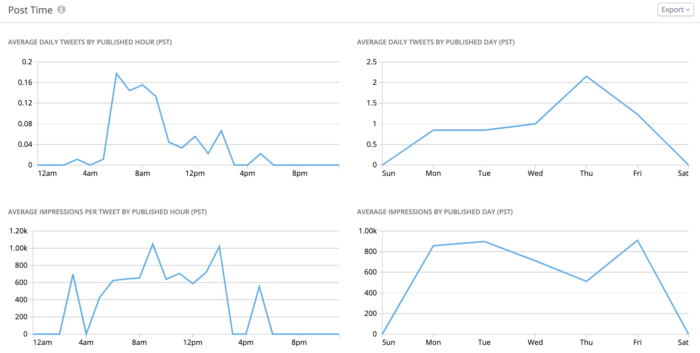
Find the best time to tweet by easily correlating the time of your tweet with its impressions.
All your favorite panels and queries from other channels are available in Twitter Analytics. Use our Post Times panel to see when your followers are engaging most with your tweets to help you know when to be online. Sort by tweet type to see whether your links, status updates, videos, or photos are performing best.
See how you’re really doing with in-depth profile data
We get it: sometimes, it’s all about you.

That’s why we’re rolling out a brand-new profile dashboard for all your private Twitter metrics at a glance.
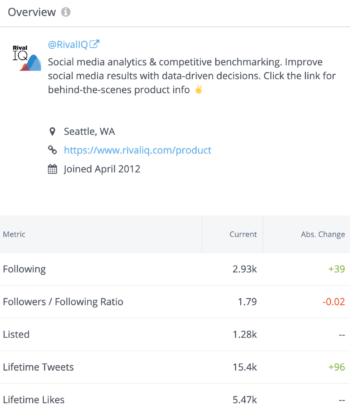
The Twitter overview panel makes it easy to check in on the current status and absolute change of your handle’s activity over time.
Use this overview panel to check on your big Twitter stats:
- Following: The number of accounts your handle is following.
- Followers/following ratio: We calculate this ratio by dividing your number of followers divided by your following count. Social channels don’t look favorably on accounts with, say, very few followers and tons of accounts you’re following, so this is a good place to check in on the health of your account. Twitter has more on why this ratio is important to them.
- Listed: This brand-new number represents the number of public lists your handle is on. Every time you’re listed represents an instance where a handle or follower wants to come back to what you’re saying on Twitter, so the higher this number, the better.
- Lifetime tweets: The number of times your handle has tweeted, ever.
- Lifetime likes: The number of tweets this account has liked, ever.
We list both the current picture and absolute change over time (when possible) of these accounts so you can see how your account is doing. That absolute change column will change as you toggle the date range, so it’s a great place to go back in time to spot big jumps or declines.
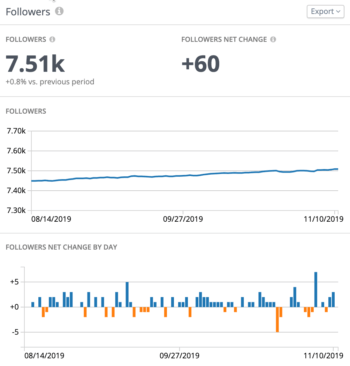
Visualize your follower changes and easily spot big fluctuations.
We heard from many of you that you love this follower panel in Instagram Insights, so we’re rolling it out for your private Twitter data as well. Seeing big changes in your follower counts is a great way to vet your content. If you see lots of adds in a day, it can indicate successful or even viral content. Lots of removes mean your content didn’t quite hit the mark.
Customize your Twitter analytics
Now that you’re up to speed on all the new built-in Twitter metrics in Rival IQ, it’s time to go off-roading.

That’s right: we’re introducing an all-new custom dashboard totally focused on private Twitter Analytics alongside new Twitter tables and graphs for use in any of your existing dashboards.
The new Twitter Analytics custom dashboard is chock-full of Twitter stats.
Whether you’re monitoring your Twitter stats daily or just checking in every once in a while, our comprehensive Twitter Analytics dashboard is for you. This dashboard is all about your private Twitter data, so these metrics are focused on your performance and not your competition’s. We’ve got all your favorite Twitter metrics plus tons of helpful graphs and even top posts, including:
- Follower metrics: From follower counts to your follower/following ratio to your counts over time, these panels have everything you need to keep track of your Twitter audience.
- Tweets, replies, and retweets: Track your tweet frequency over time to optimize your social efforts. We also have a panel that breaks down your tweets by regular tweets, replies, and retweets so you know how each type is performing.
- Impressions and engagement: Clicks, replies, impressions, engagement, retweets, and so much more so you can see exactly how your tweets are performing via a variety of metrics.
- Top tweets: Visualize your high-performing tweets right alongside your mission-critical stats so you can keep up the good work.
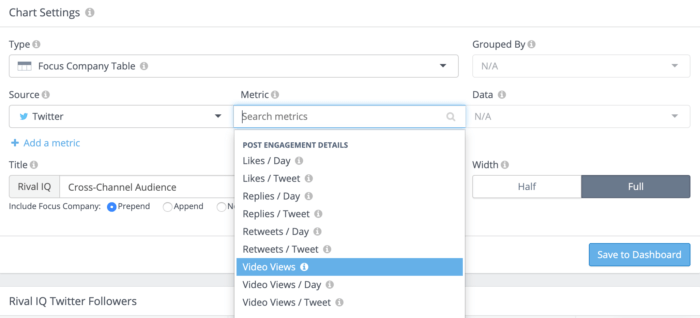
Add new Twitter metrics to any custom dashboard.
Not to worry, public data fans: we’ve got your competition needs covered in custom dashboards too. Add replies and video views to your existing Twitter dashboards for an even more complete picture of your Twitter performance. Insert these metrics on any dashboard for truly custom analysis.
How to access new Twitter metrics in Rival IQ
All this brand-new Twitter goodness is available in every existing Rival IQ account and trial. You’ll find the new competitive analytics throughout the “Competitive Public Analytics” Twitter dashboard, and there’s no need to connect anything new. To get started with private Twitter data, head over to the “Twitter Analytics” dashboard under “Your Private Data.”
Wrapping it up
We love Twitter because of how effortless it makes 1:1 connections between brands, celebrities, fans, and grumpy cats. These new Twitter metrics in Rival IQ make it easier than ever to see how you’re connecting with your fans so you can put your energy on Twitter where it really matters.

Of course, there’s nowhere we’d rather hear from you about these new metrics than on Twitter. Let us know what you think!