Social media and sports go hand-in-hand: it’s visual, encourages engagement and gives teams a way to truly interact with their most passionate students, fans, and alumni.
We wanted to find out which NCAA Tournament teams are killing it when it comes to social – but not just in terms of audience size. In fact, we found that often times, teams with the biggest follower base had lower engagement rates.
That’s why this report delves deeply into what the most engaging NCAA Tournament teams are doing across Facebook, Instagram and Twitter to give you some great ideas and hopefully inspire your next post.
The 2017 March Madness Report
At Rival IQ, we built our software to help digital marketers not only analyze, interpret and improve their organization’s social media presence, but also enable them to compare their own metrics to all the competitors in their landscape. We took this technology and applied it to the 68 NCAA basketball teams who qualified for the national championship tournament to see how they’re harnessing the power of social media and discover which university is winning engagement on social media. You can find the methodology for this report at the bottom of this blog.
This in-depth report looks at each college and university’s cross-channel metrics as well as specific platforms audience and engagement. This blog covers some of the highlights of our report, but you can download it in its entirety here.
The Full Report Covers:
- See how your favorite team fares when it comes to social
- Best practice posts examples from Twitter, Instagram and Facebook
- Learn how to get a 30% engagement rate like Bucknell
- Kill it with GIGs like the Miami Hurricanes
Your Sneak Peek at what’s inside:
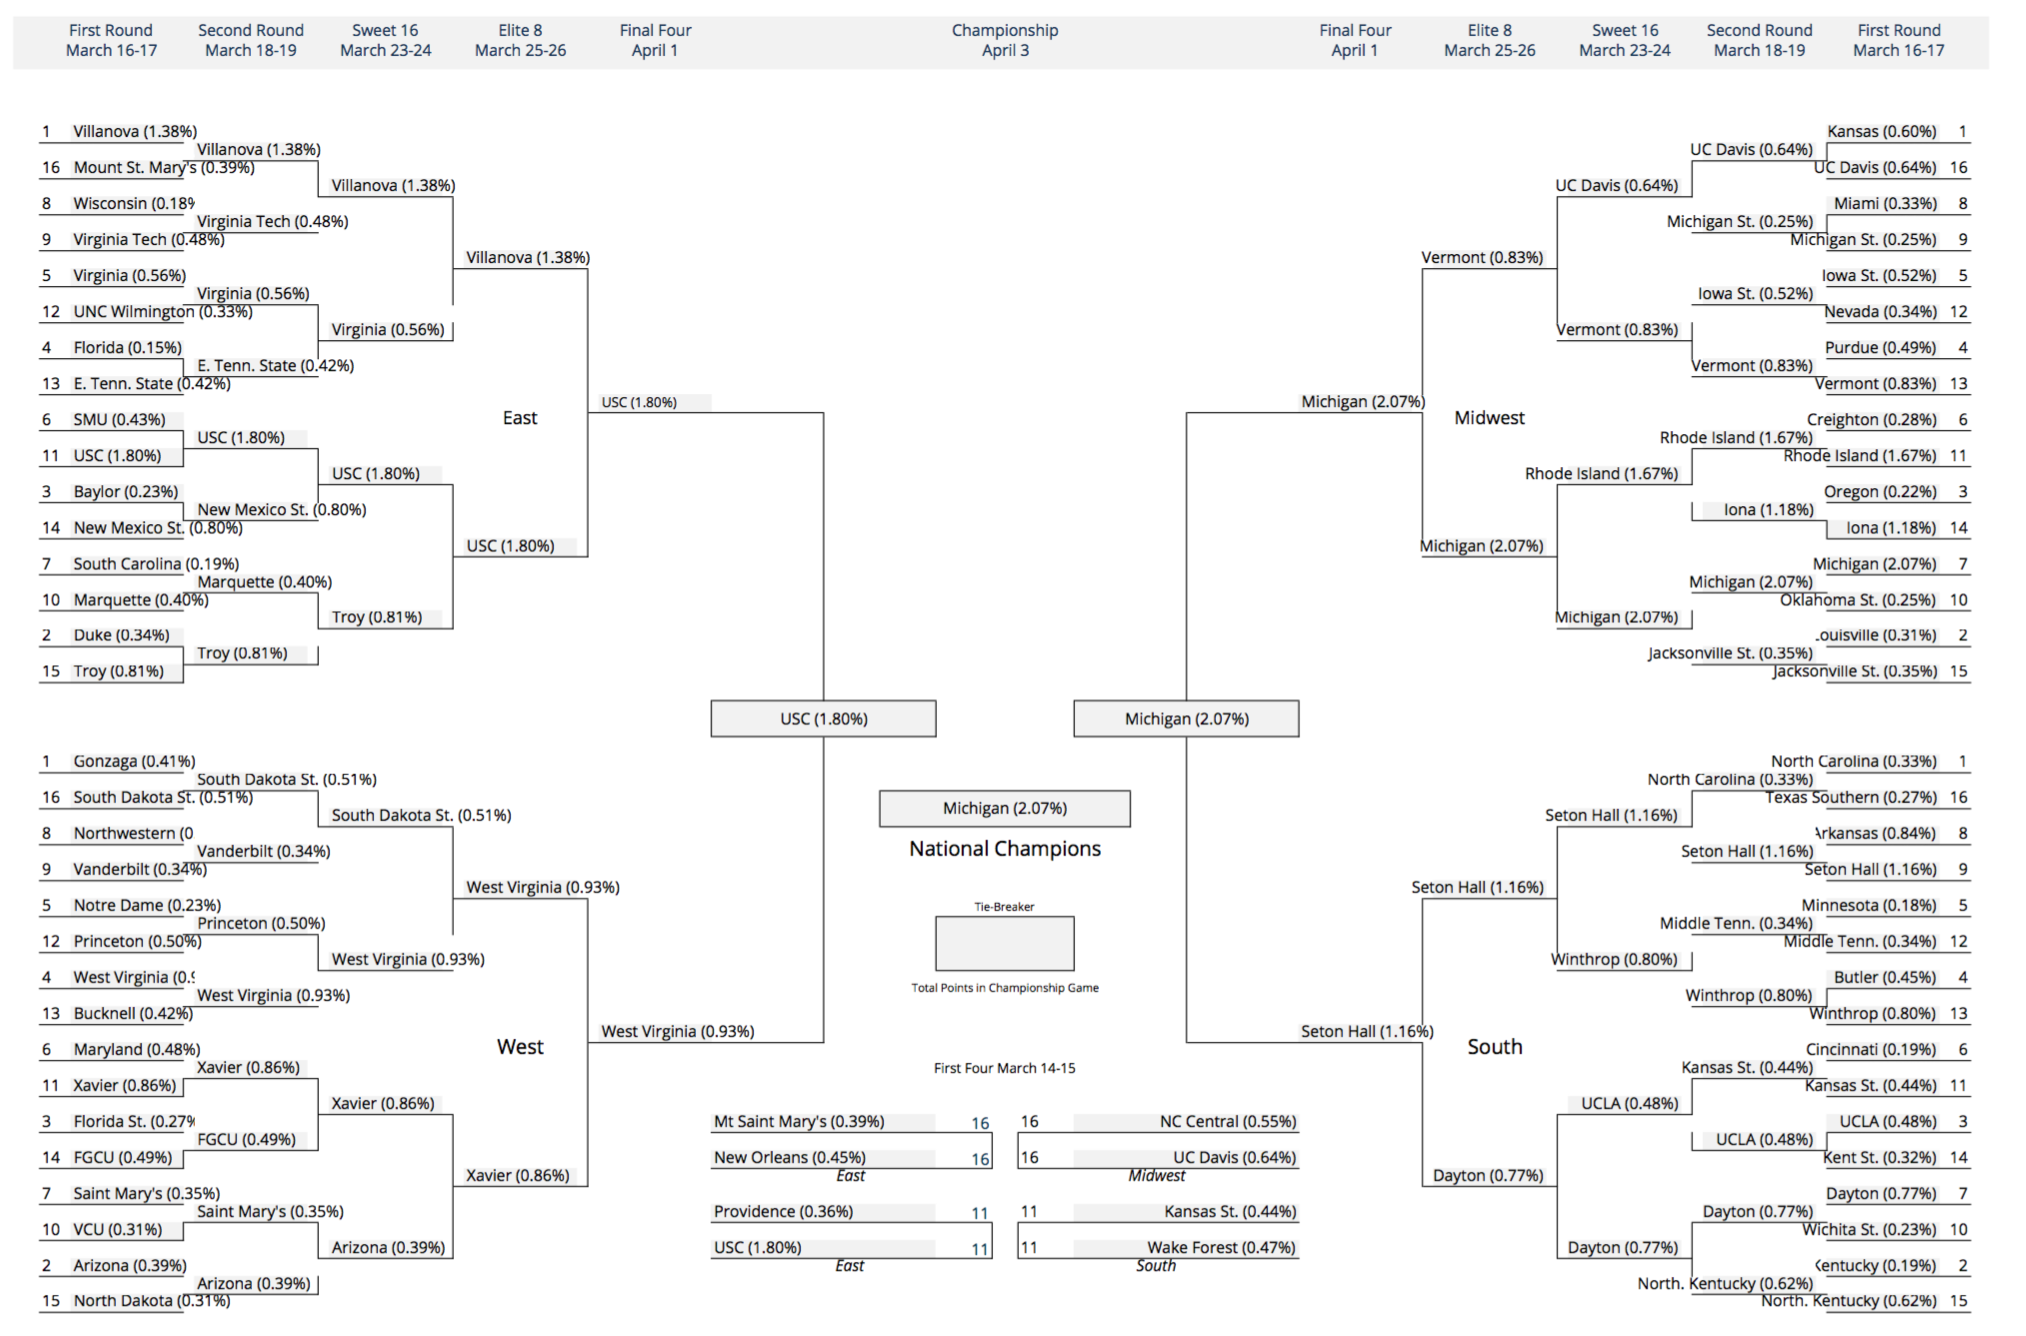
The Bracket
Here’s how the March Madness Tournament would pan out if teams went face to face based on their school’s cross-channel engagement rates on social media:
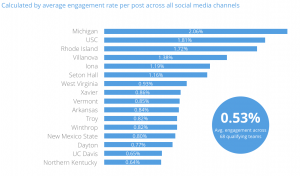
Cross-channel Metrics and Analysis
Engagement Rate
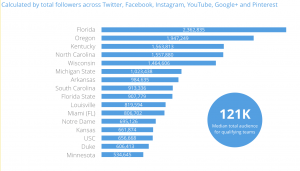
Total Audience
Social Media Best Practices on Facebook, Instagram and Twitter
Twitter Best Practices
Mood: ? pic.twitter.com/zJAnPQiYu3
— Miami Hurricanes (@MiamiHurricanes) February 21, 2017
Leverage video and .gifs like the Miami Hurricanes
While Twitter is traditionally more of a 140-characters of text medium, our data shows that posts with video and .gifs are usually better at generating engagement. Plus, you can’t express this kind of happiness in 140 characters. This is priceless.
Miami is lucky in that their coach isn’t shy in front of the camera and knows how to get down.
This post had a huge 16.3% engagement rate.
Our recommendation? Teach your coach how to dance (or don’t) and capture them on video when they’re bustin’ a move.
Methodology
We used Rival IQ to analyze social media posts across all social channels for the 68 NCAA Division 1 teams that qualified to compete for the national championship. We analyzed post data across a four-month period in beginning on November 11, 2016 through March 16, 2017, the first day of the tournament.
We gathered data using Rival IQ’s cross-channel ranking capability, as well as channel-specific rankings for Facebook, Twitter, and Instagram. The cross-channel (or overall) ranking is defined by engagement rate across all channels for each university’s athletic department (meaning not exclusive to posts related to men’s basketball, but all social posts between the indicated dates).
Engagement is defined as measurable interaction on social media posts, including likes, comments, favorites, retweets, shares and reactions. Engagement rate is calculated based on all these interactions divided by total follower count.
We’ve also provided qualitative analysis with best practice examples from some of the top-performing organizations.