Hot off the presses, it’s our newest (and biggest!) Instagram Stories Benchmark Report yet. 🥂
This year’s report has tons of updates to all your favorite Instagram Stories metrics like taps forward and back, retention, exit rate, and more. For comparison purposes, we also added more analysis of your feed posts, including reach rate by media type and engagement rates per impression to deliver the ultimate guide to Instagram Stories benchmarks.
We analyzed more Stories than ever and broke our metrics down by follower count and brand activity levels to help you understand exactly how your brand measures up when it comes to Instagram Stories.
First up? The key Instagram Stories takeaways your brand needs to be successful with Stories in 2022.
Key Instagram Stories Takeaways
Brands are posting more Stories than ever
Brands of all sizes increased their Story frequency this year, leading to more stellar content (and also more competition).
Reach Rate continues to fall
Your Stories (and posts!) are reaching a smaller percentage of your followers compared to last year. Stories are competing with Instagram posts and YouTube and TikTok for eyeballs.
Retention Rates are flat
Retention rates on Stories decreased just 1% this year. Brands saw gains in tap-back rates and reply rates but losses in tap-forward rates and reach, which kept retention rates from growing.
Posts reach more than Stories
Instagram posts continue to see a much higher reach rate. Hook viewers with posts and deepen their engagement with Stories.

Days with an Instagram Story
“How often should I publish Stories?” is a really common question from marketers. Since more isn’t always better, the best answer starts with benchmarking how often the average brand publishes a Story in a month.
A quick note on how to read these graphics: we’ve included median performance as well as metrics from the top and bottom 25% of brands so you can understand the full range for the Instagram Stories metrics that matter.
- Story frequency is up across the board, with the average brand posting an Instagram Story 11 times per month.
- The top 25% most active brands publish Stories at least 17 times a month—roughly every other day.
- The least active 25% of brands publish just over 1 Story per week.
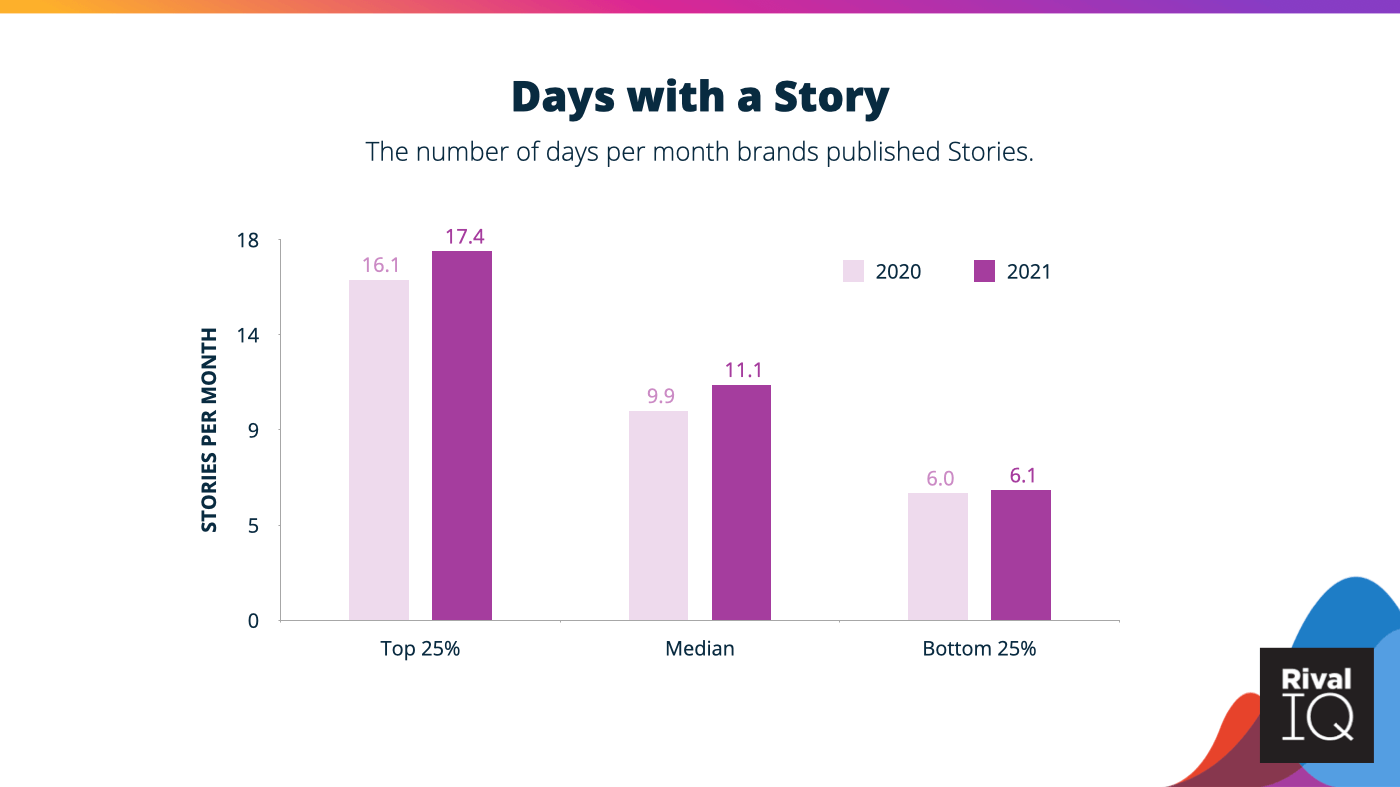
Story posting per month hasn’t changed much over the last few years: everyone is posting a little more frequently than they used to. This consistency means the majority of brands still post Stories just over twice per week.
Frames Per Day
A quick terminology check-in: in our book, Stories represent a 24-hour period, while frames per day denote the number of individual photos or videos posted within a Story. After all, you can’t have an Instagram Story without frame(s). Finding the “right” number of frames per day for your brand is just as important as figuring out how many Stories you should be posting in a given time period.
As you can see on the graph below, Stories with just a few frames are more common than Stories with more frames.
- About 35% of Story activity comprises days with only one frame.
- 1-3 frames account for about 60% of brand activity.
- Almost 20% of Stories have 7 or more frames.
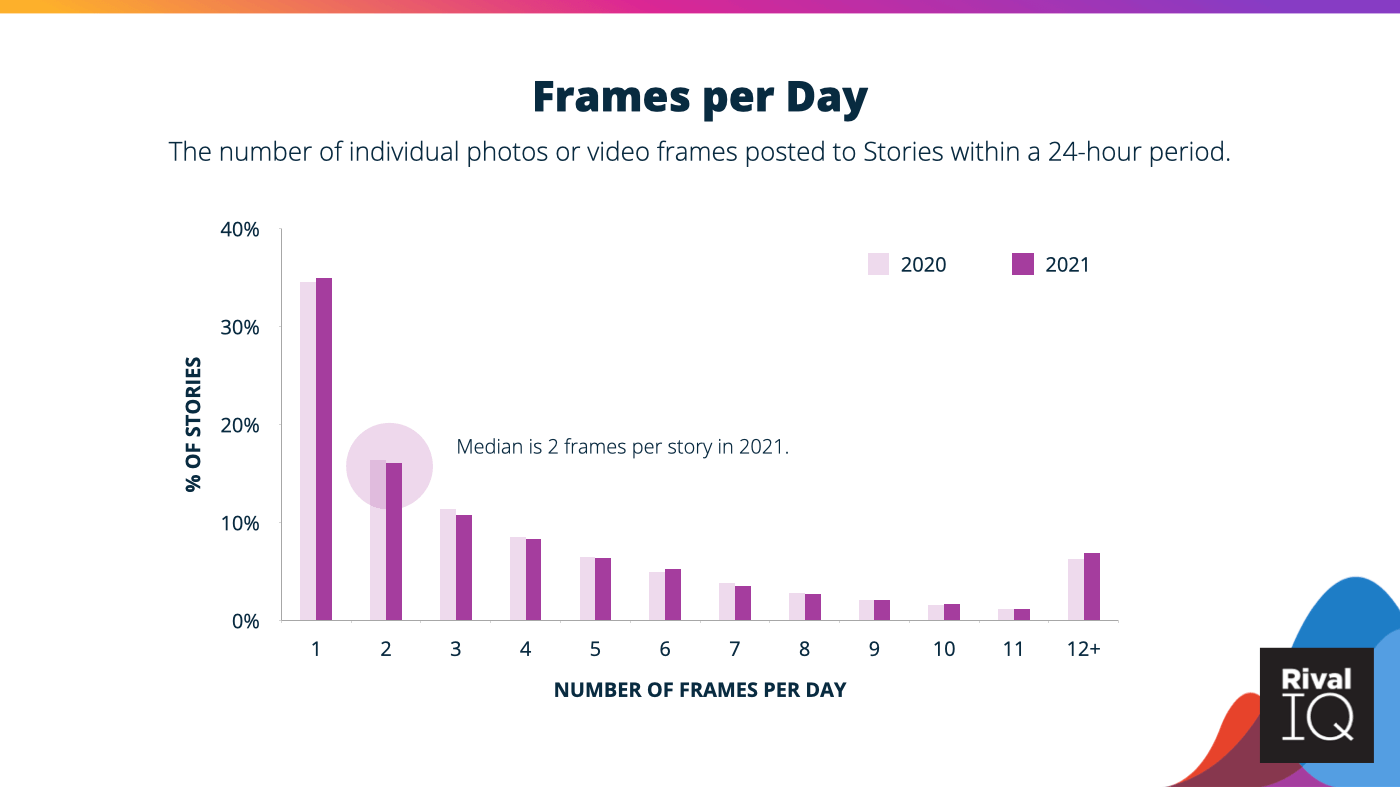
More brands are using Stories in their marketing, but they’re not posting significantly higher frame counts. Finding your own brand’s average number of frames per day and factors that increase your retention rate can help fine-tune your frame frequency strategy.
Retention Rate
Retention rate by frame is one of our favorite metrics for really understanding how your Instagram Stories are landing with your audience. This metric represents the percentage of viewers that have stuck around through any given frame of a Story.
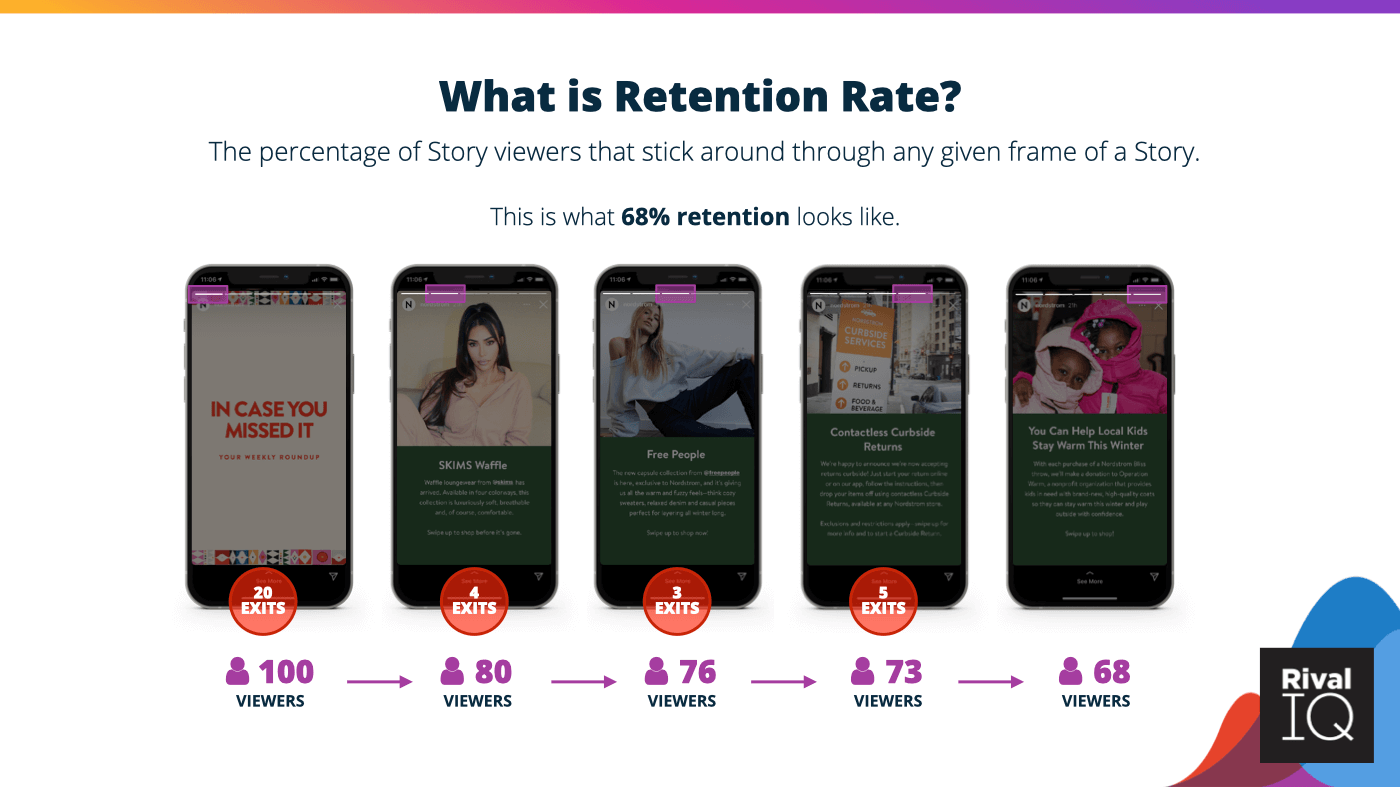
This metric is one of the truest ways to measure the strength and resonance of your content: retention isn’t influenced by Instagram’s algorithm or in competition with another brand. It’s just your content, your viewer, and whether or not you can keep them tapping forward instead of exiting and moving onto the next Story.
- The average retention rate for the 4th frame of the day was pretty flat this year, with just a 1% decrease from 2020.
- As always, the biggest dip is from 1 to 2 frames a day as users swipe past the Story.
- After that big initial drop-off, the retention decline slows down and stays above 75% through 6 Stories per day.
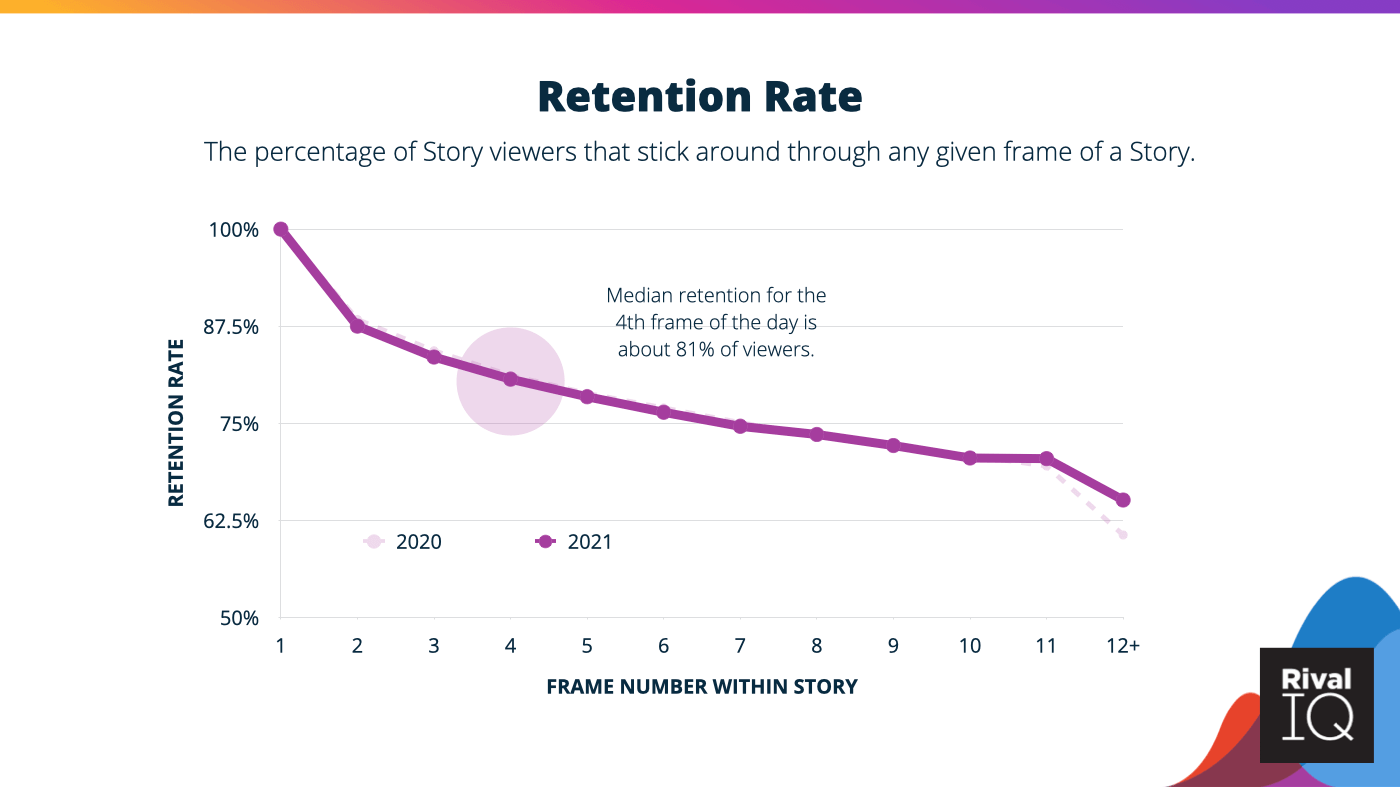
Retention rate is a great way to measure your Story viewers’ appetite for your content. Focus on a first frame that hooks viewers, and then don’t be afraid to say everything you need to say: retention drops but doesn’t flatline with more frames.
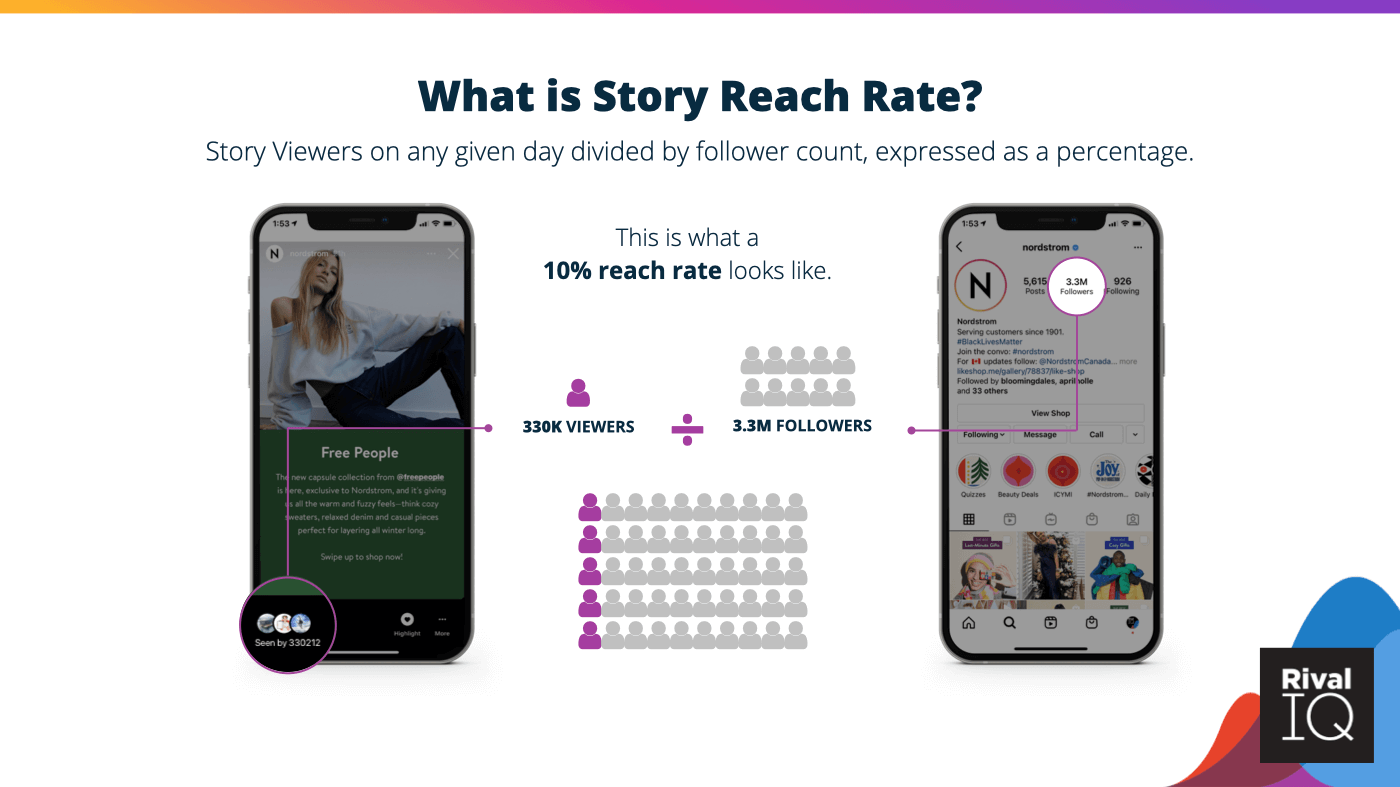
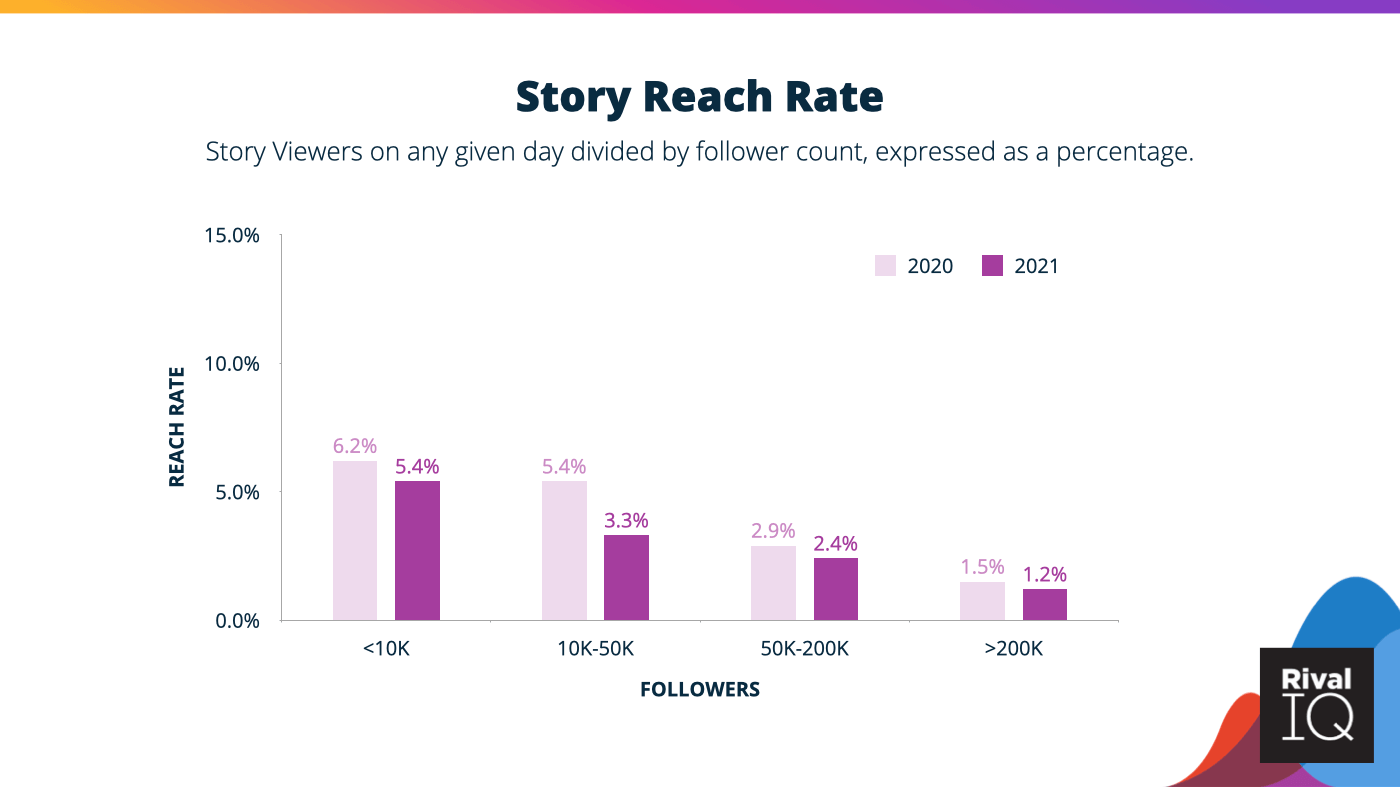
Story Reach Rate
Story reach rate represents the percentage of your followers who are actually seeing your Stories. These reach rates are small and getting smaller year over year, but don’t get discouraged–Stories are still an awesome tool for many brands.
Reach rates declined this year across every follower count range we studied.
- Brands with follower counts below 50K saw a sharper drop than larger brands.
- Mid-size brands with 10K-50K followers were hit the hardest.
With more creators making Stories and competition from channels like YouTube and TikTok, there’s more competition for every pair of eyeballs that comes across your Story. If you make one change to increase your reach rate, it’s focusing your efforts on creating eye-catching and engaging first frames.
Another tool in your reach toolkit? Story Highlights pin your favorite Stories to your profile page and help viewers discover your content long after its 24-hour expiration date in Stories.
Interactive sticker elements like links, shoppable posts, questions, and quizzes can also increase reach (and retention. And engagement. You get the idea).
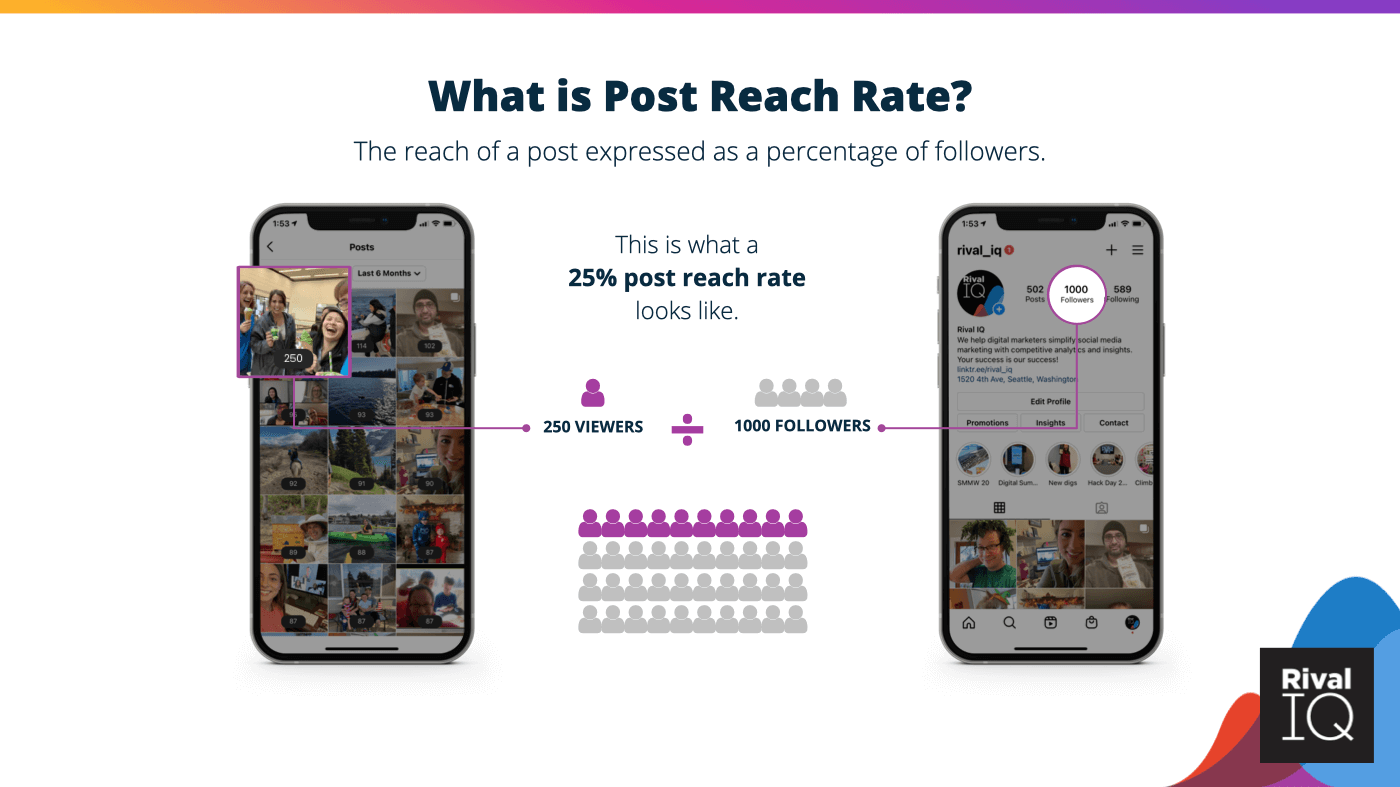
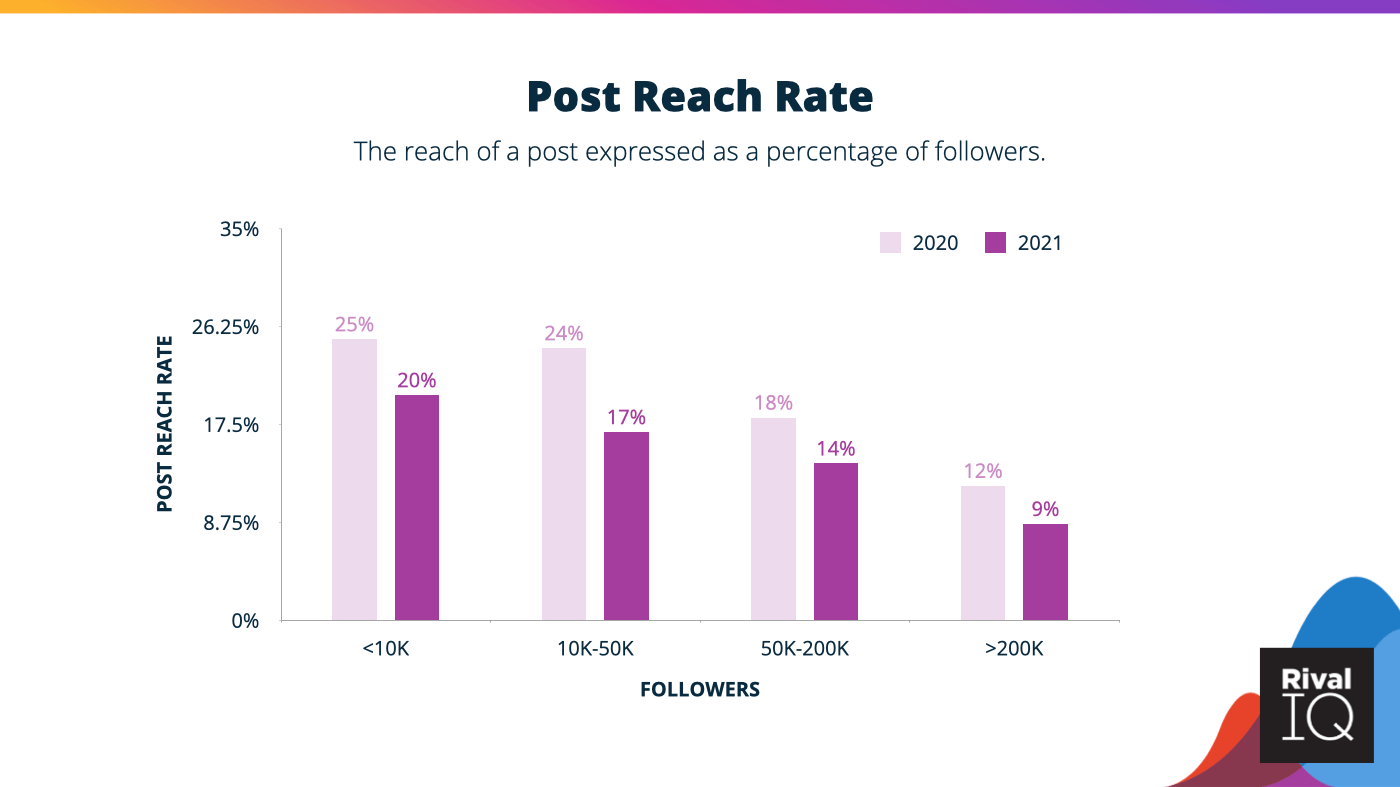
Post Reach Rate
Post reach rate, which is the percentage of your followers that saw one of your posts, declined slightly this year (again 🥲).
Handles with between 10K-50K followers saw the sharpest Post Reach Rate declines in 2021. As usual, the larger your follower count, the smaller your reach rate.
It’s not too surprising that post reach rates continue to decline as Instagram adds more ways to consume content on its platform (like IGTV and Reels), further dividing attention.
Post Reach Rate by Media Type
This metric is new this year, and helps brands understand the reach of a post (expressed as a percentage of followers) by media type.
- Brands saw their post reach rates decline for every media type in 2021.
- Images were hit especially hard with a 29% decline in reach rate.
- Video posts managed to almost hang onto their 2020 reach rate.
- IGTV stats weren’t available in 2020 through Instagram’s API, so the cheese stands alone here.
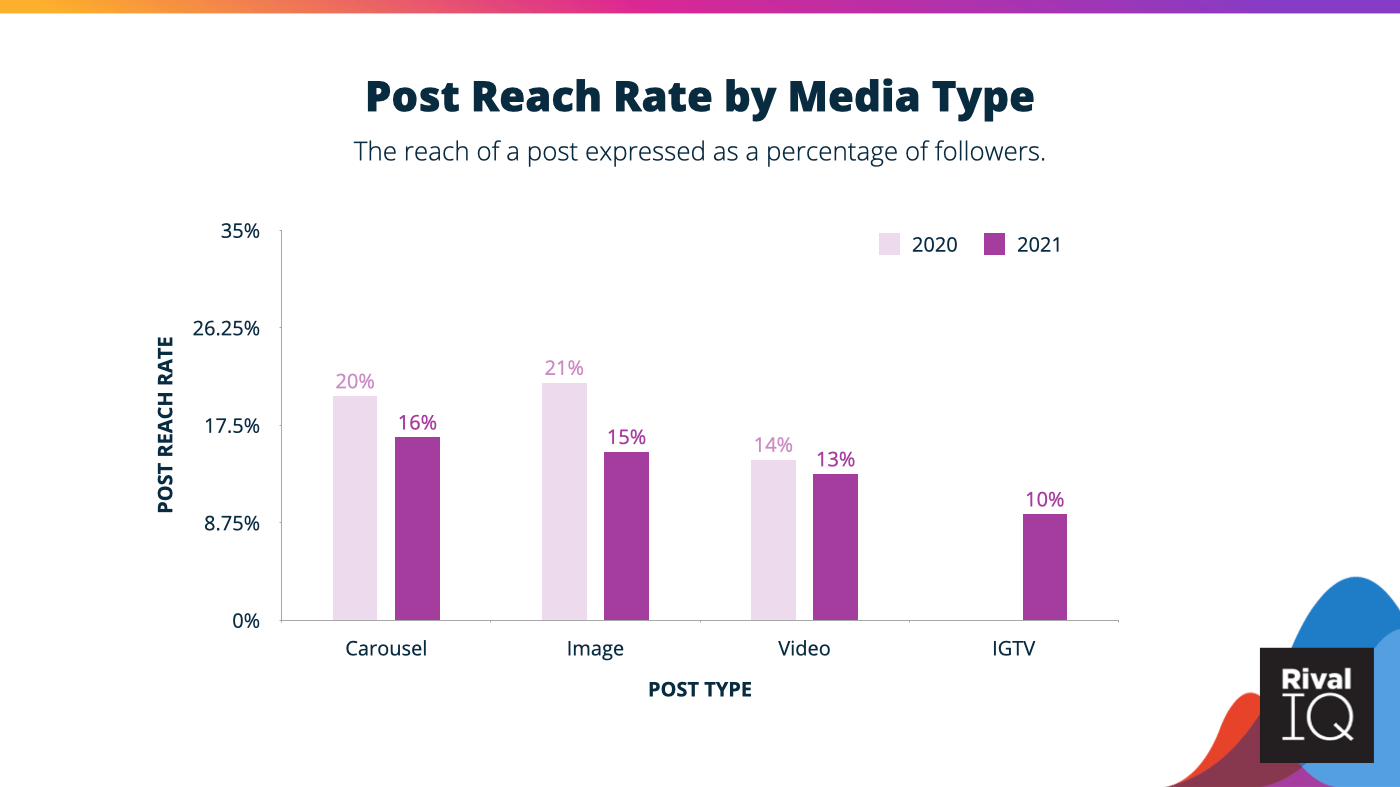
Instagram is working hard to incentivize more video content to compete with YouTube and TikTok, so this is a good area to invest in in 2022 to engage both followers and the algorithm.
Reach Rate: Instagram Stories vs. Posts
Anyone who manages an Instagram account will tell you there’s a pretty big disparity between Story and post reach rates, so let’s compare the two side by side.
Small brands with follower counts up to 10K can expect around 4x more of their followers to see their posts than their Stories, and the disparity only grows more dramatic as follower counts increase.
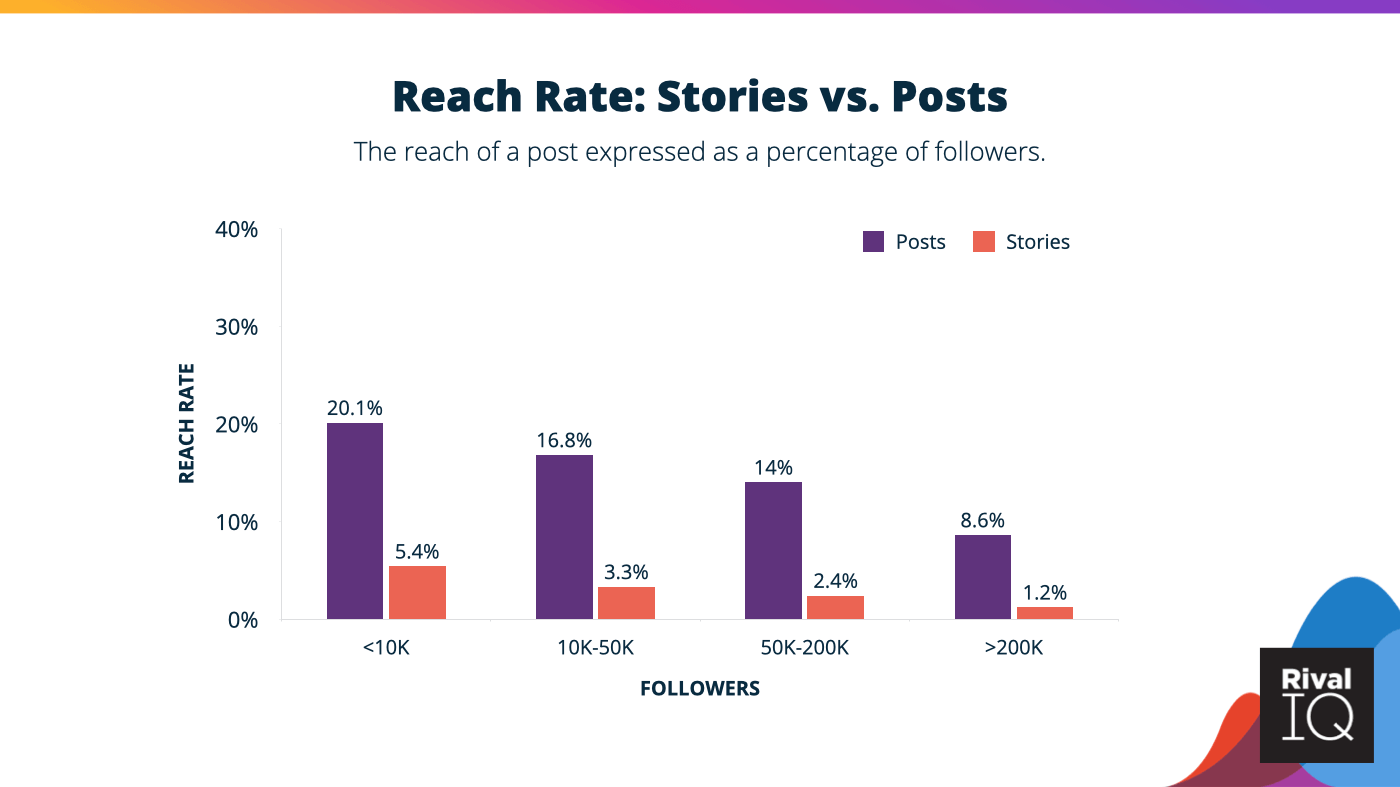
Stories continue to have a lower reach rate than posts for brands, but does that mean your brand should stop creating Stories? The short answer is no: Story impressions can be a great tool for engaging with followers and developing relationships over time.
Posts and Stories engage your followers differently and should be treated as two different tools in a marketer’s toolbox. Posts are great for a quick scroll, but if you hook viewers, Stories can really draw your audience in and keep them engaged.
By the way, if you’re wondering if there’s a right time to post on Instagram or an ideal posting frequency, we’ve got you covered.
See what thousands of brands are up to on social with our Social Media Industry Benchmark Report.
Check it outPost Engagement per Impression
This metric is also new this year and represents the number of likes, comments, and saves per impression on a post.
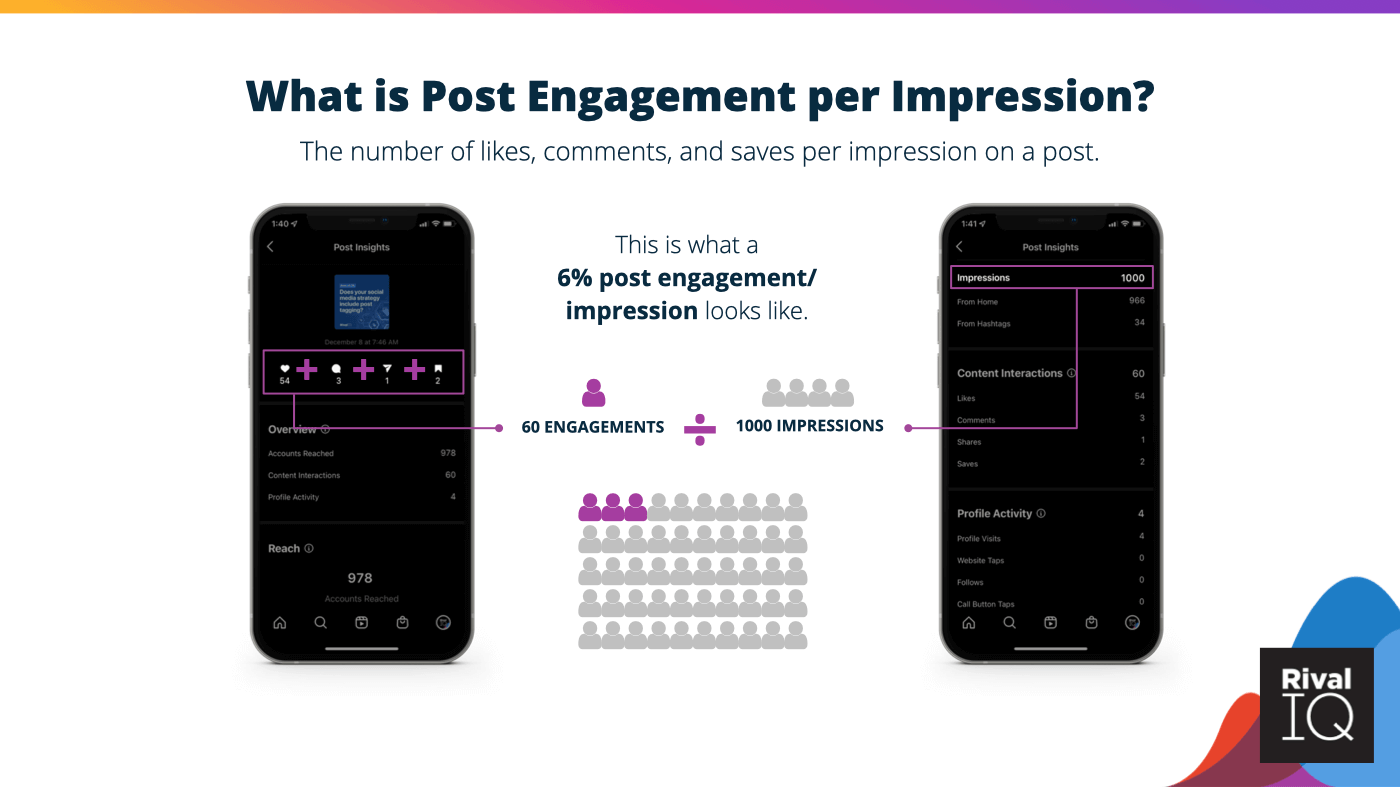
Selecting the right denominator in your social media metrics really matters: defining engagement rate as engagements divided by followers will give you a different number than engagements divided by impressions. Whatever your preference, we’ve got you covered with this new metric.
It’s worth noting that Post Engagement per Impression is available only for brands whose handles you manage–it’s hard to find this metric competitively (unless you’re reading this report 💁🏻♀️).
- Post engagements per impression were slightly up or flat for most brands in 2021.
- Handles with fewer than 50K followers retained post engagement per impression best this year.
- Larger brands fared worse, with handles with more than 200K followers seeing a 10% drop.
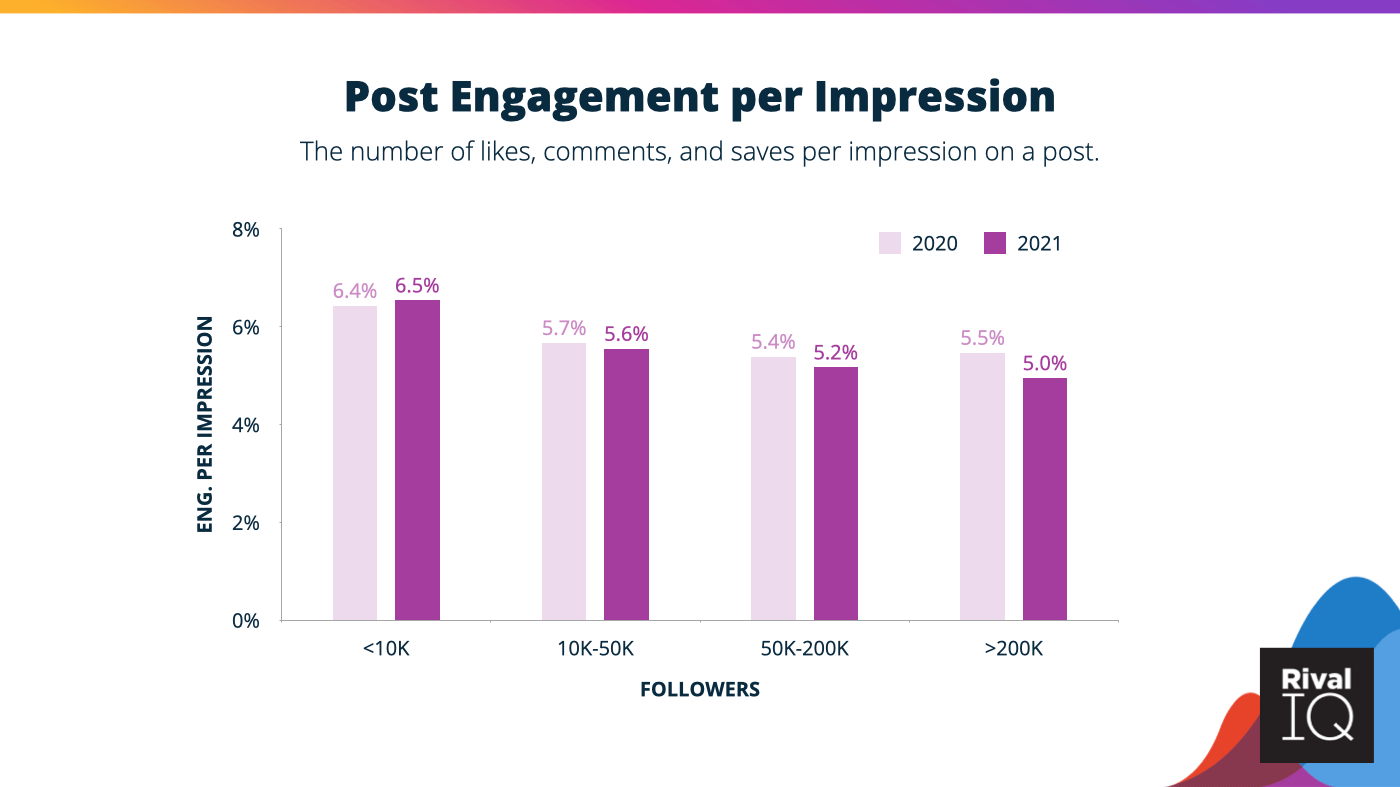
These drops in post engagement rate per impression are part of a larger trend of decreased engagement on Instagram as the platform battles for attention in the era of YouTube and TikTok.
Post Engagement per Impression by Media Type
Let’s dig further into Post Engagement per Impression by studying the engagement each media type receives on Instagram.
- Post engagement per impression decreased across every media type in 2021.
- Instagram’s favorite post type, carousels, took the strongest hit of all media types this year, but are still the most engaging post type.
- Image and video posts also saw decreased post engagement per impression.
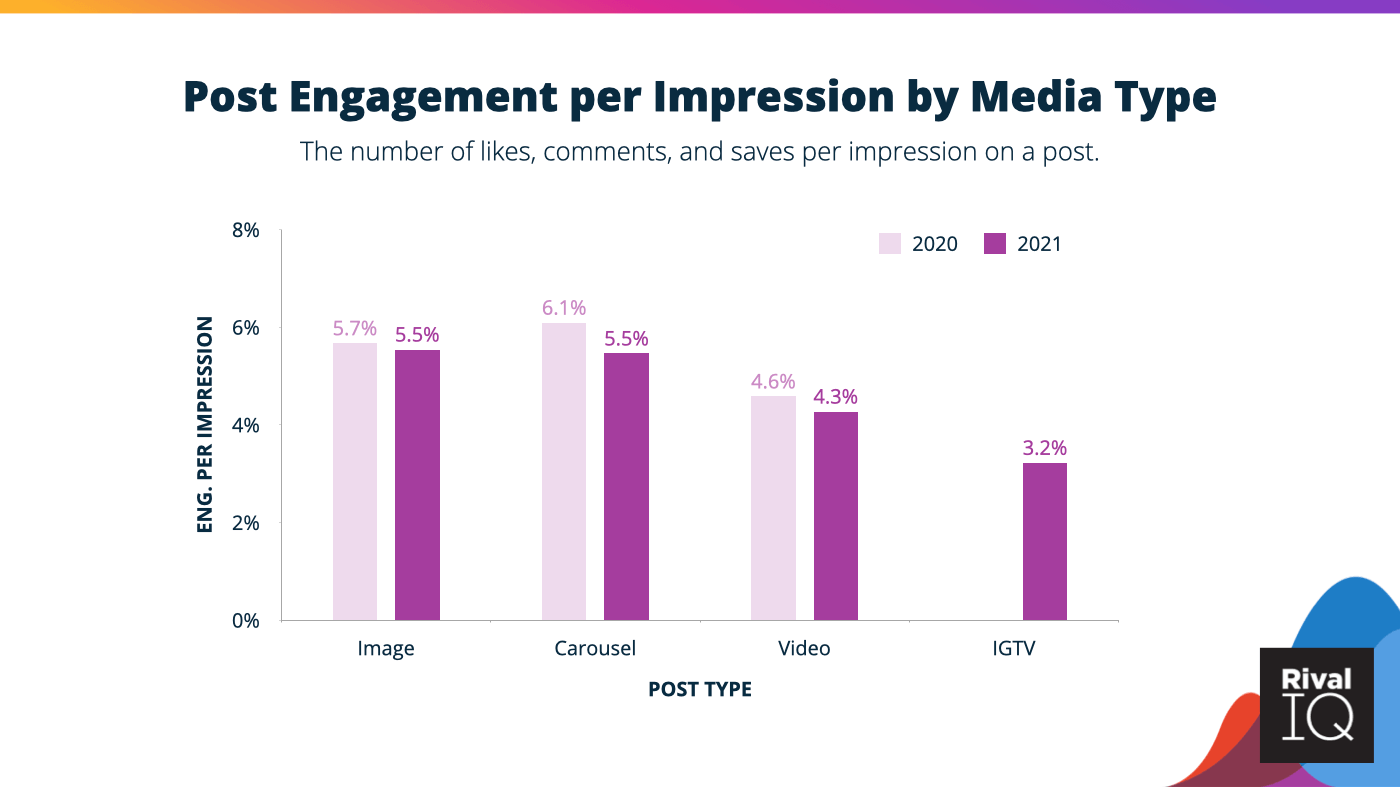
IGTV stats weren’t available in 2020 through Instagram’s API, so there’s no comparison available here.
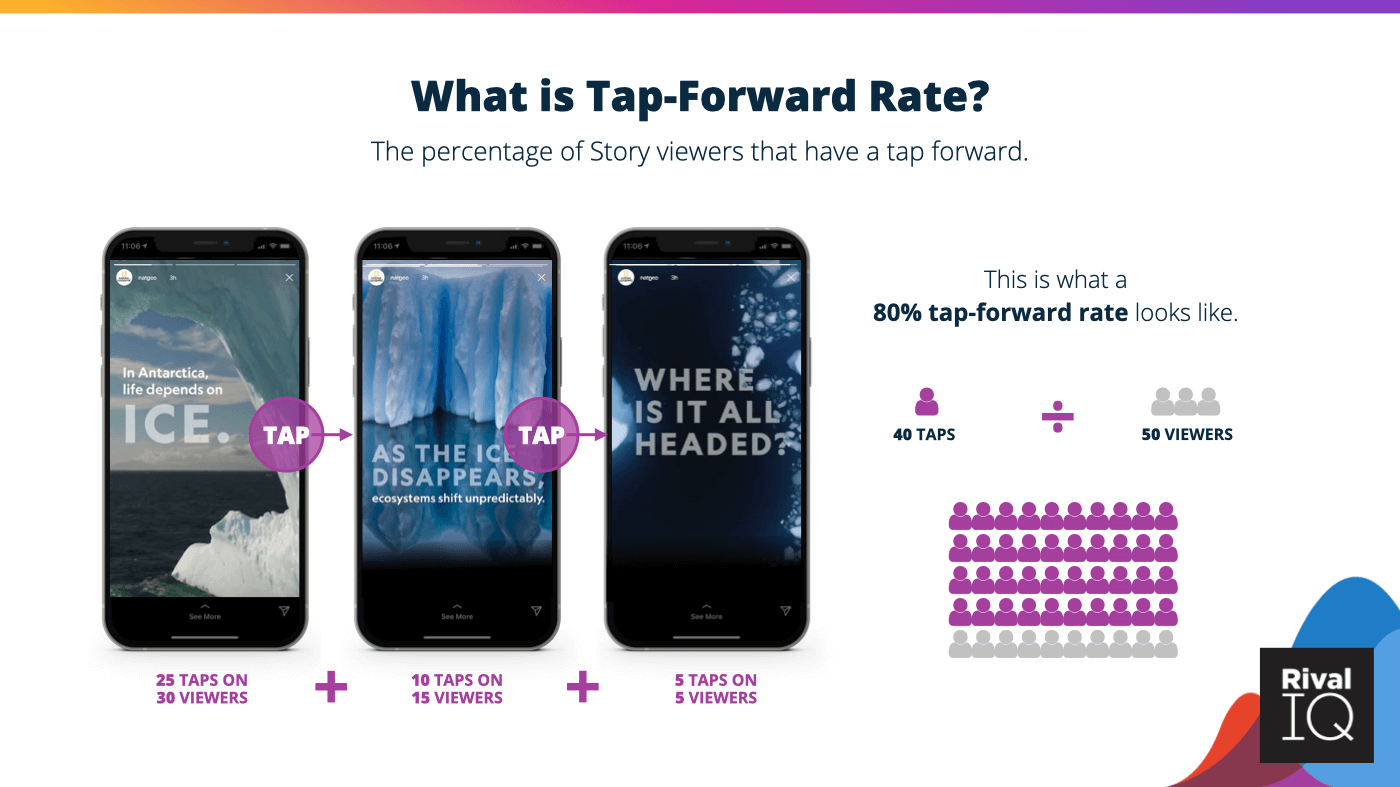
Tap-Forward Rate
Tap-Forward Rate measures the percentage of your Story impressions that have a tap forward. It’s an interesting Stories metric because it can indicate both positive and negative attention: either the viewer has had enough of your content, or can’t wait another second to hit the next frame.
Often, the more frames in your Story, the more likely it is that followers will tap forward. A few other key tap-forward stats:
- The median tap-forward rate at 5 frames per day is 89%.
- Tap-forward rates stayed flat this year, suggesting attention spans haven’t decreased too much.
- As viewers tap past frame 12 of your Story, they’re tapping forward about 90% of the time.
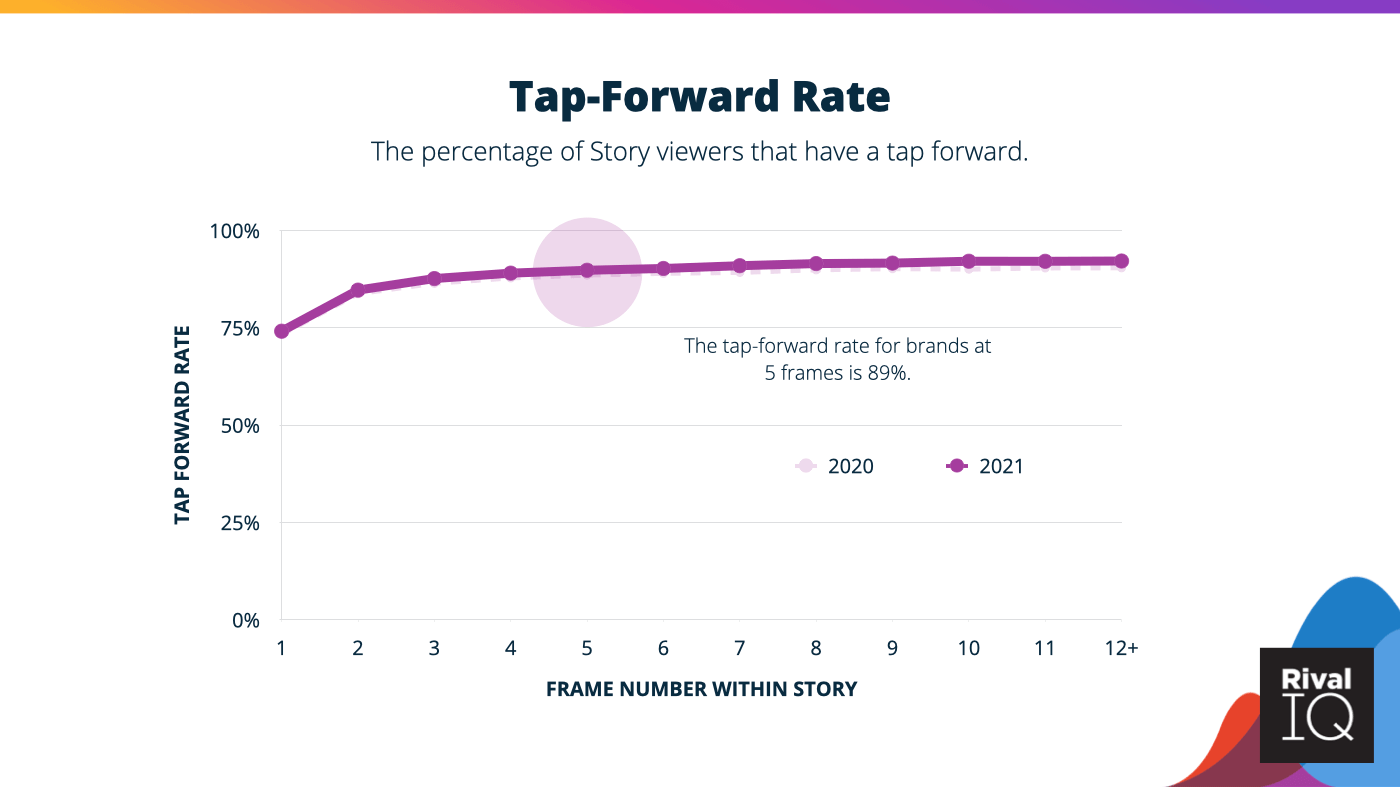
Tapping forward isn’t necessarily a bad thing, but it does indicate that the viewer has either seen enough of the content or wasn’t interested in the first place. Keep your frames engaging and experiment with video to maintain your viewers throughout the entire Story.
Tap-Back Rate
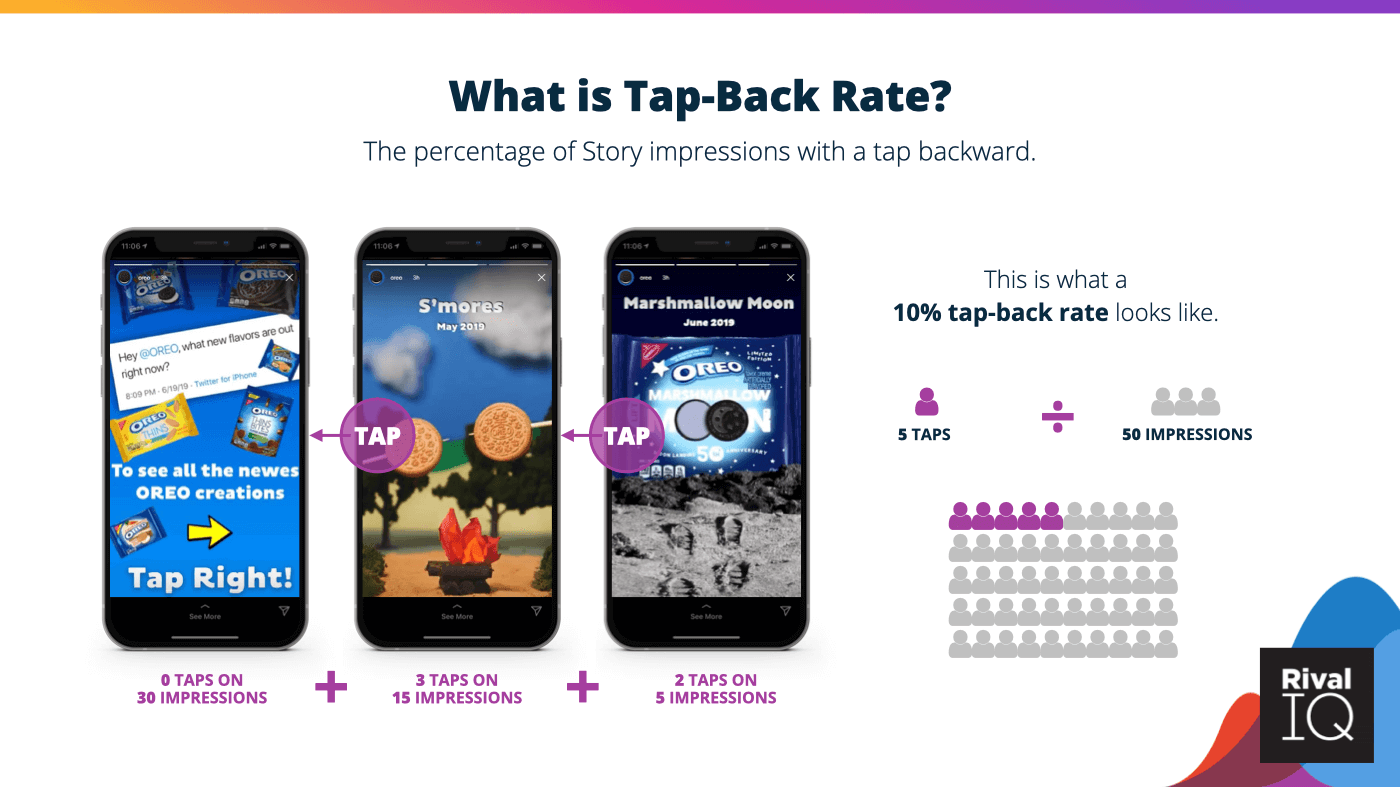
Taps back are every marketer’s dream, because they indicate that a viewer wanted a closer look or to re-engage with a brand’s content. This rate represents the percentage of Story impressions with a tap back.
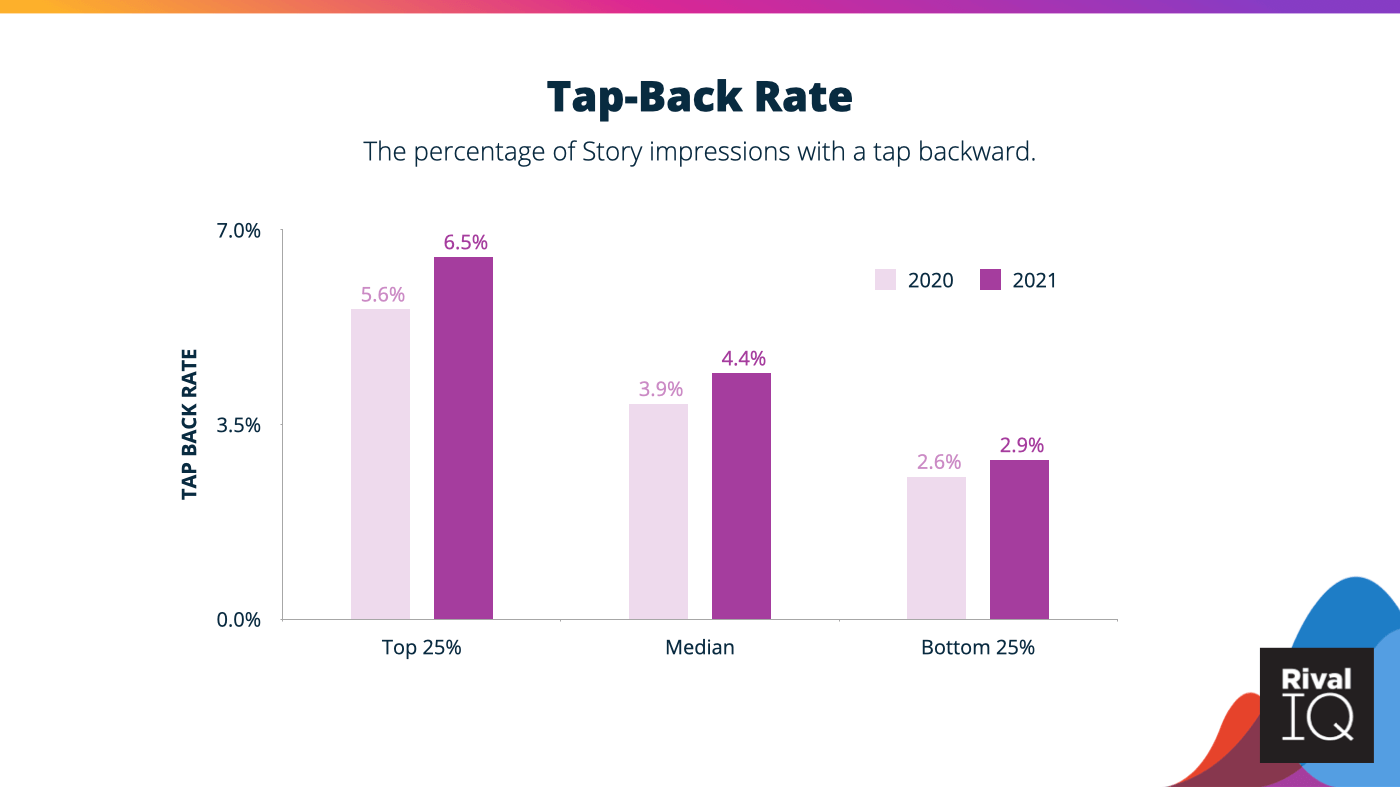
This year’s tap-back rate increased just a little, which is always good news. Stronger tap-back rates indicate that brands are creating content that’s just a little stickier and more engaging than last year.
- The median tap-back rate is 4.4%, but the top 25% of brands see tap-back rates closer to 6.5%.
- Taps back are a great indication of content that your followers want to consume more of.
When reviewing your Instagram Story performance this year, take a look at the Stories or frames that received the most taps back. Were they videos? Did they have a lot of text in them? Be sure to replicate those strategies or other Instagram Story best practices in your 2022 content planning.
Replies per 1K Impressions
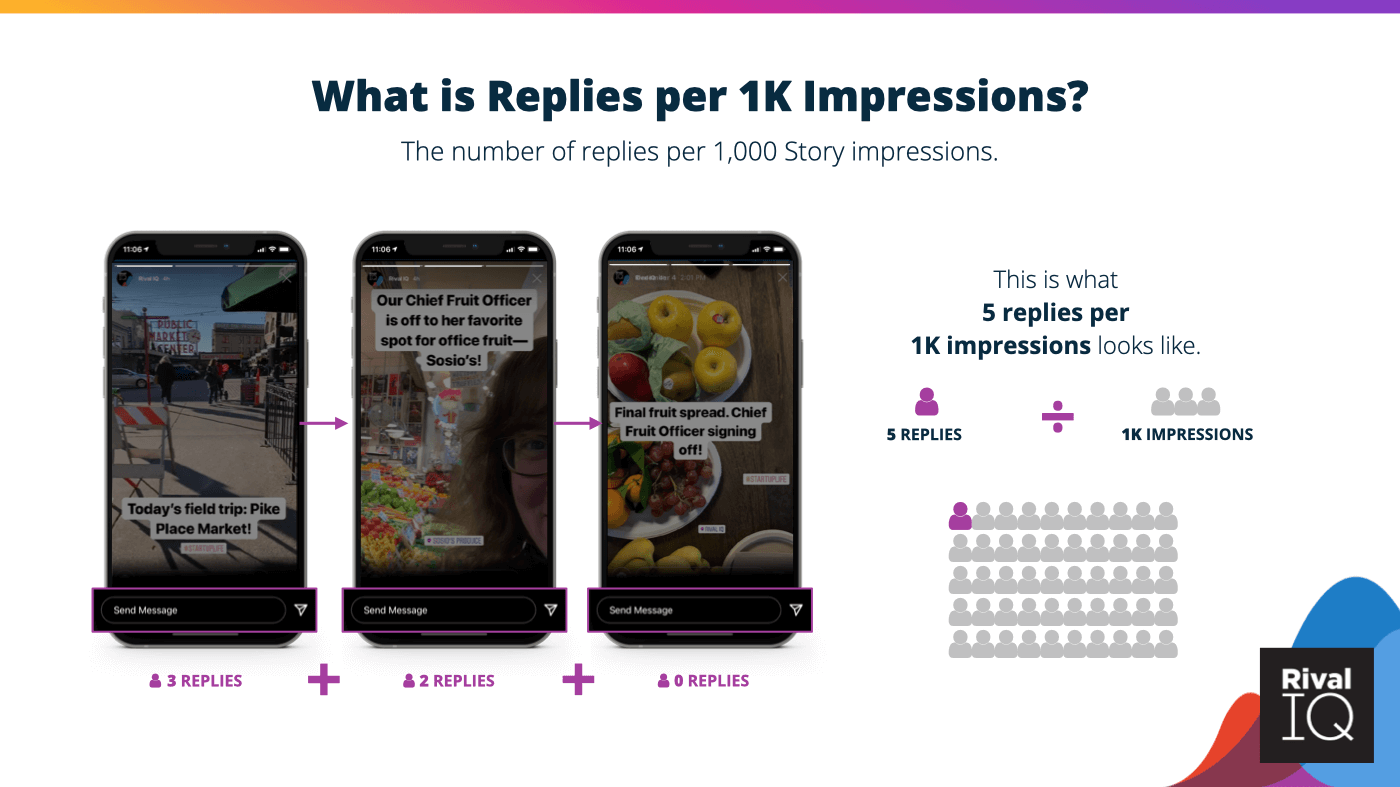
Replies are elusive but meaningful, and they’re actually on the rise (we’ll take our wins where we can get them, even if they’re small). Replies per 1K impressions expresses the number of replies per 1K impressions as a percentage.
Savvy readers of this blog will note that this metric is a slight modification of our usual reply rate. The denominator in our reply rate is per 1,000 impressions, which gives us more insight into the replies brands are receiving than previous calculations.
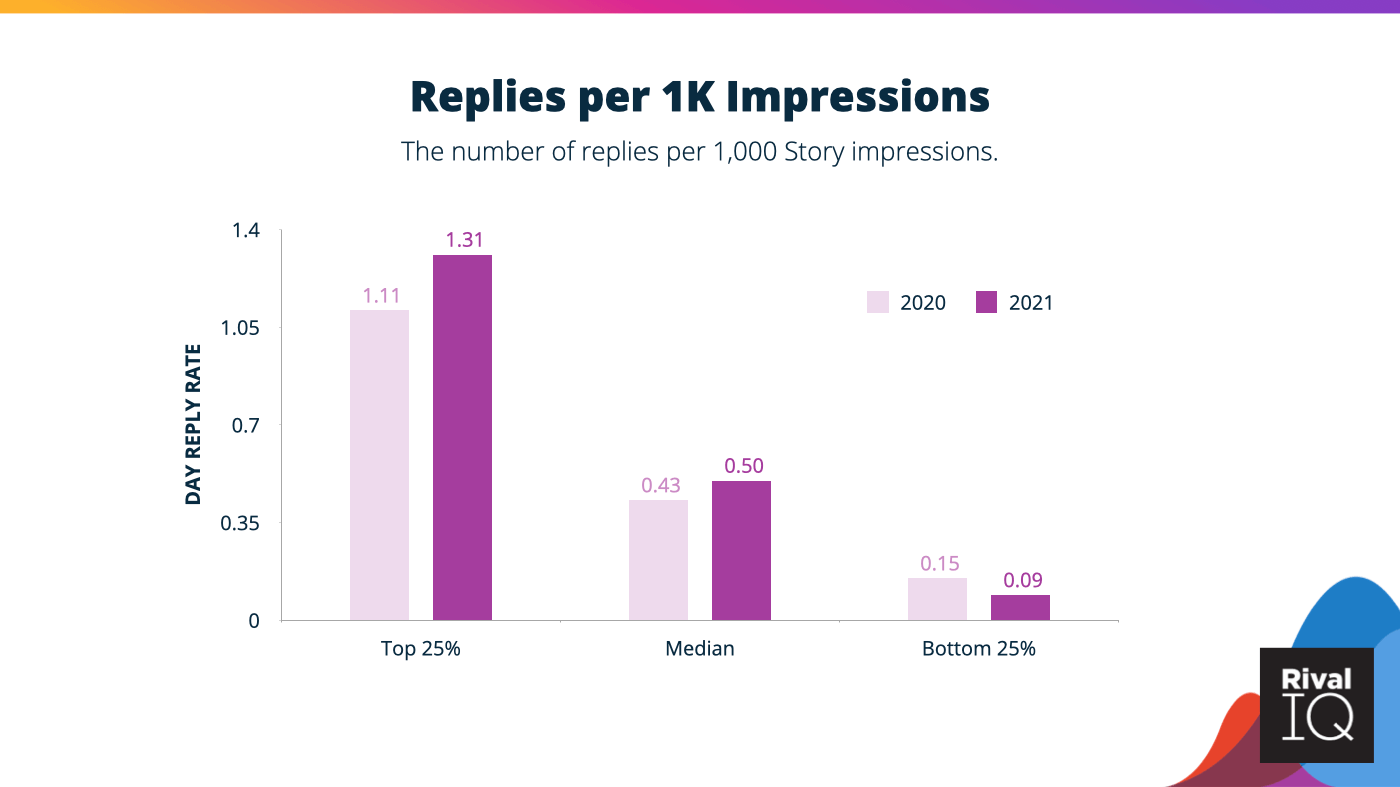
- Replies per 1K Impressions increased for most brands in 2021.
- The top 25% of brands in this study saw an 18% increase in replies/1K impressions, while median reply rates increased by about 15%.
- These reply rates are tiny because users mostly don’t reply—particularly in the bottom 25%, which sees just 0.09 replies per 1,000 Story impressions.
The best way to elicit a reply? Ask for one. Posing questions or using polls and quizzes in Stories invites viewers to engage beyond a quick scan. Sadly, Instagram’s API continues to limit data from in-frame engagement stickers like polls and quizzes.
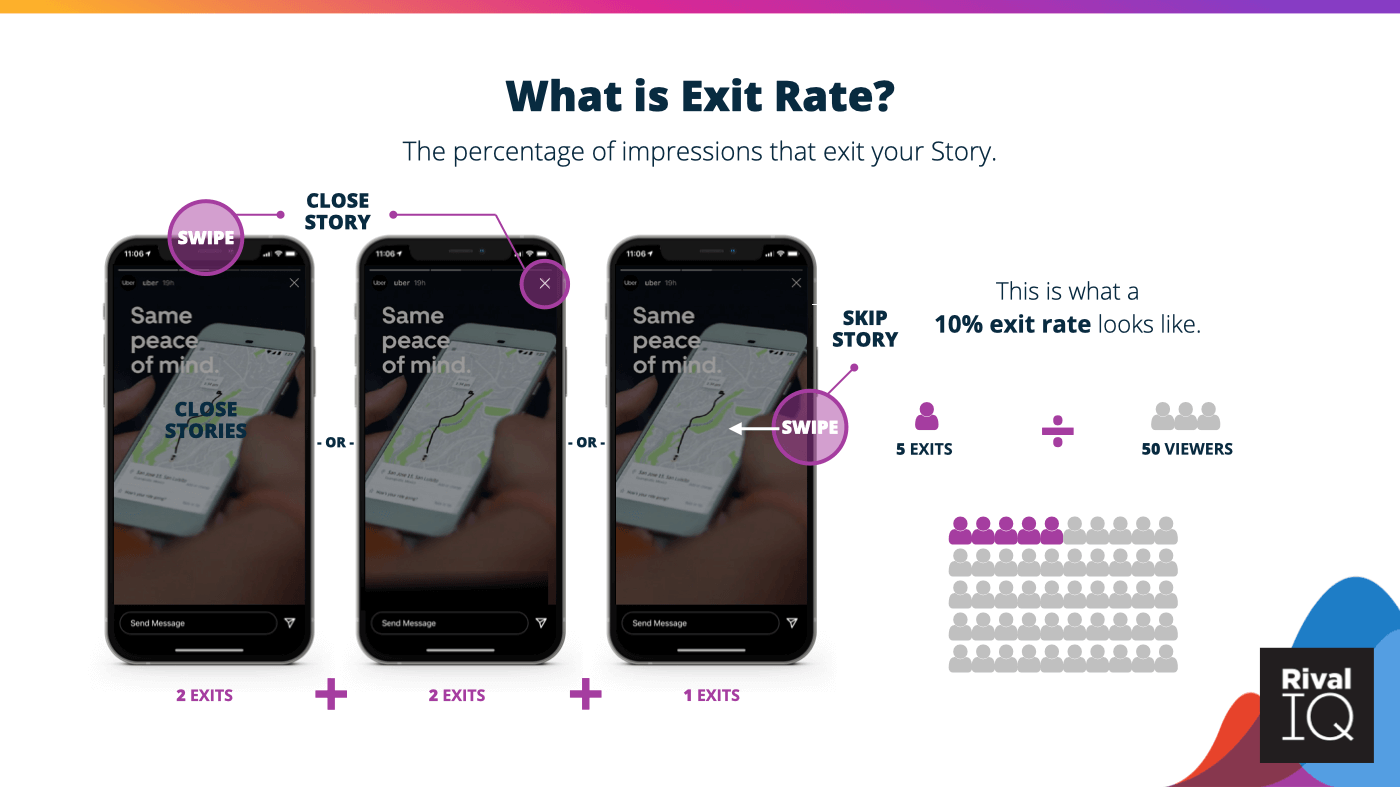
Exit Rate
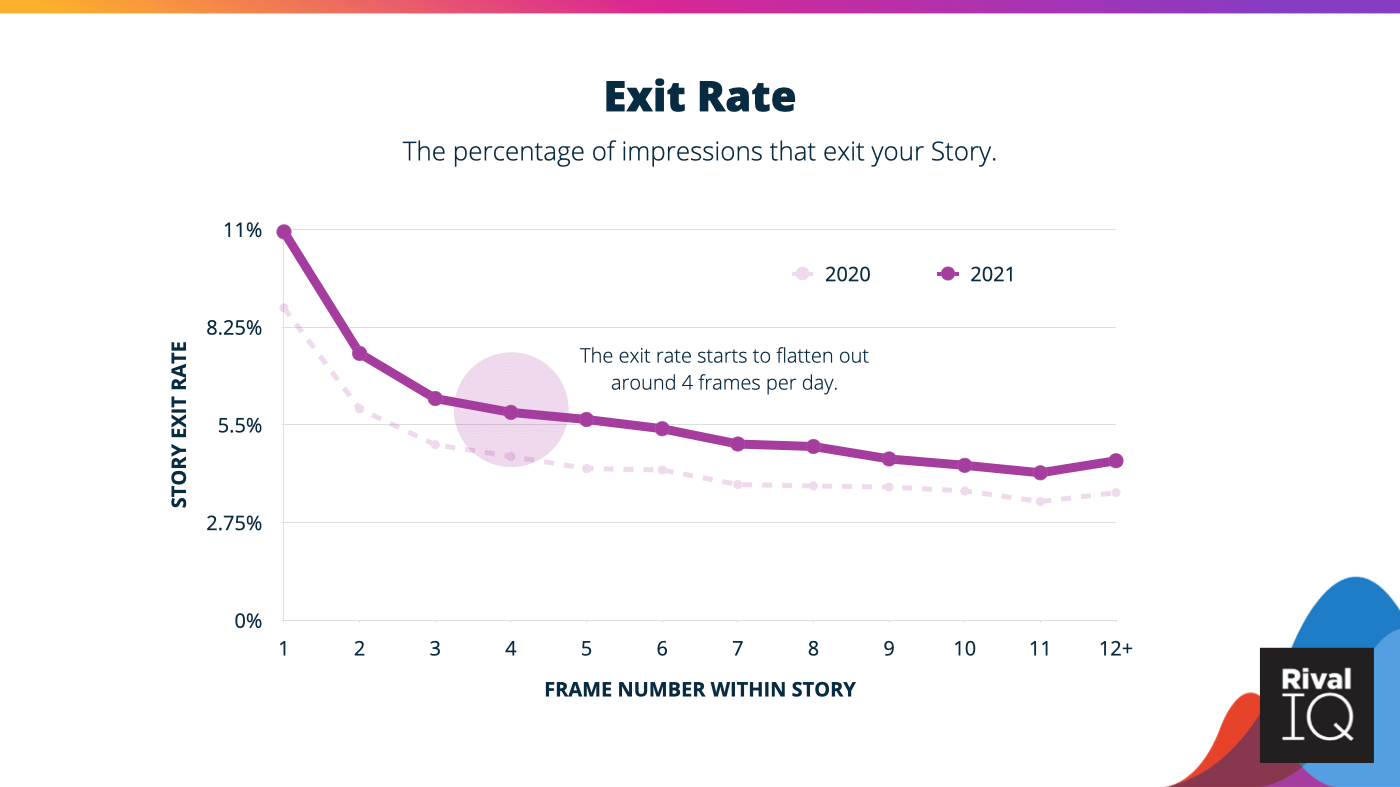
Exit rates, which measure the percentage of impressions that exit your Story before it ends, increased a little this year (again). Not every increase should be celebrated: this one indicates viewers were a little less engaged with Story content this year.
Brands saw exit rates increase by about 26% this year, which means viewers are more likely to bail on a Story than they were last year.
- Exit rates start at about 11% for Stories with a single frame.
- The rate begins to really tail off at 5 frames per day and flattens out in the 4% range.
These numbers are small, and therefore nothing to panic about. Focus on strategic and engaging content, and try to do more of what worked for you in 2021 next year.
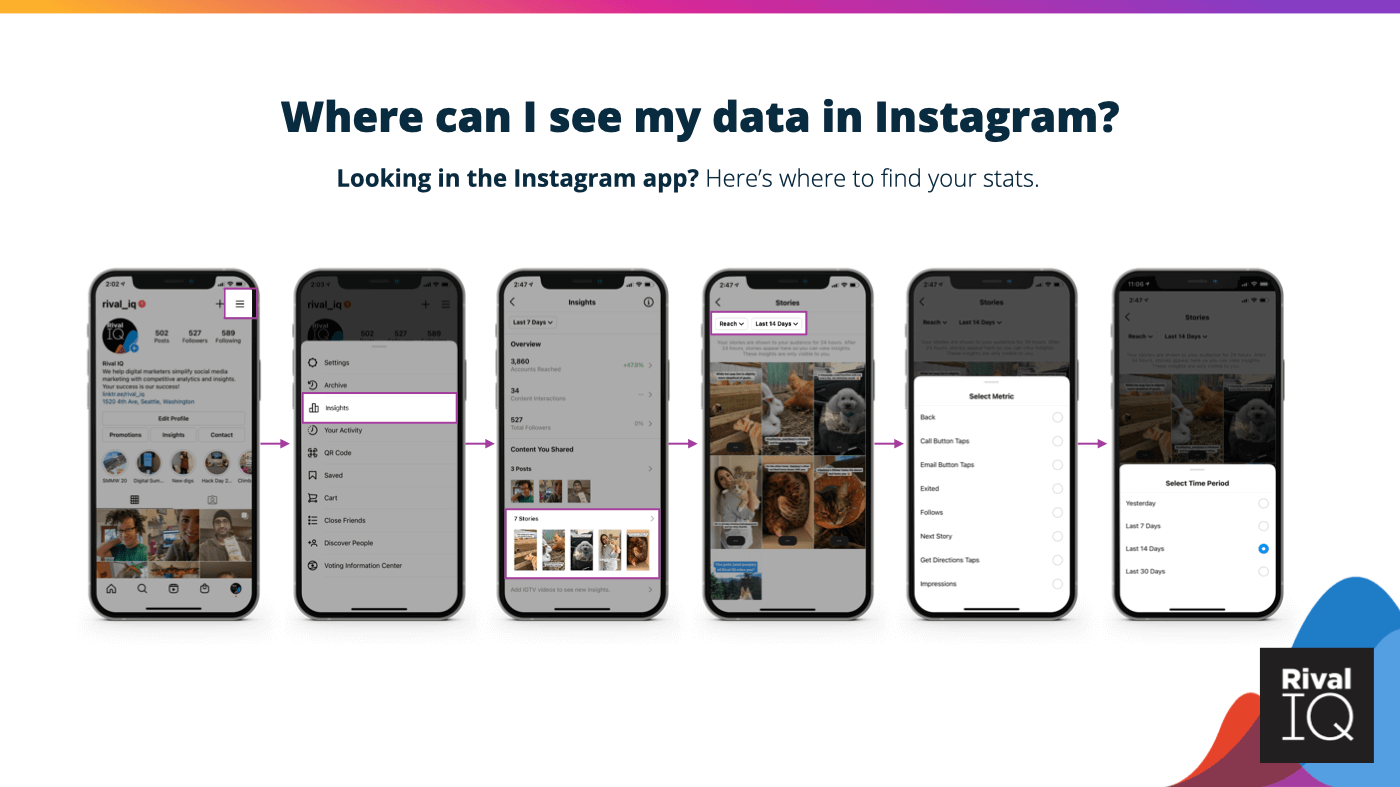
How to Find your Instagram Stories Data
Follow these simple(-ish) steps to find up to 90 days of Stories data natively in Instagram. Remember that these stats are available only for business profiles, creator accounts, or verified handles. Here’s more info from Instagram on how to access your data natively.
If you’re looking for more than 90 days of Story stats and the ability to view all your Story metrics in one place, you could always start a free trial of Rival IQ or access Instagram Insights in your existing account. Once you connect an Instagram business profile to Rival IQ, you’ll start capturing all your new Instagram Story data (alongside Facebook, Instagram, Twitter, LinkedIn, YouTube, and TikTok stats, of course).
Wrapping It Up
2021 was a weird year for lots of things, but if there’s one thing we can count on, it’s increased Story frequency with slightly lower overall engagement. There’s nothing to be discouraged about in this report despite some declines: from increased taps back and replies to Instagram making it a lot easier to measure IGTV data, there are lots of bright spots within.
Our two biggest pieces of advice? Measure, measure, measure, and focus on engaging frames at the beginning of your Story. Measuring your performance will help you capitalize on what worked well for you while tossing what didn’t. (Spoilers: we’re betting strong first frames led to some of your best Story engagement this year.)
If you’re looking for even more Instagram Stories insight, check out our upcoming Data-Driven Marketer webinar with Instagram expert Lauren Teague all about Winning Instagram Strategies for 2022.
Where does your brand stack up when it comes to Instagram Stories? Let us know on Twitter (or Instagram!).
Methodology
Rival IQ analyzed over 60K Instagram Stories (and 258K+ frames!) posted between June and November 2021 to bring you insights for your 2022 marketing strategy.
We included 780 Instagram handles that had at least one Story published during each month of the time frame, and we only included handles with a reach of at least 100 views for each frame and a 1K total follower minimum. Handles were included only if we had all of their data for the entire time period, regardless of how frequently or infrequently they published Stories. These handles reached across multiple industries, including beauty, media, influencers, outdoor/adventure, marketing, and more.
Instagram Stories Metrics: Glossary
Instagram terms don’t have to be confusing, so here’s a glossary of all the important Story metrics used in this report and their definitions.
Engagement: Measurable interaction on Instagram Stories and posts, including likes, comments, replies, and shares.
Exit Rate: The percentage of your impressions that exit your Stories by swiping right, swiping down, or closing Stories.
Frame: A single photo or video posted to your Instagram Story.
Impressions: The total number of views of a frame in your Story.
Post Engagement per Impression: The number of likes, comments, and saves per impression on a post.
Post Reach Rate: The reach of a post expressed as a percentage of your followers.
Reach: The total number of unique people that saw a frame in your Story or your post.
Reply Rate: The percentage of your Story Viewers that replied to your Story on any given day.
Replies per 1K Impressions: The number of replies per 1,000 story impressions.
Retention Rate: The percentage of viewers that have stuck around through any given frame of a Story.
Stories Reach Rate: Your Story Viewers on any given day divided by your follower count, expressed as a percentage.
Story: The set of frames posted to your Story within a single 24-hour day.
Story Viewers: The number of people who saw your Story on a given day.
Tap-Back Rate: The percentage of your impressions that have a tap backward to see the previous photo or video again.
Tap-Forward Rate: The percentage of your impressions that have a tap forward to see the next photo or video.