Behind every post, like, and share on Facebook is a treasure trove of data that can transform your approach, boost engagement, and skyrocket your brand awareness.
With the right insights, you can steer your brand through the ever-changing tides of trends, audience behaviors, and content preferences. From understanding reach and engagement to deciphering the secrets behind your top-performing posts, consider this your crash course in Facebook Analytics.
Ready to take the plunge into the world of data-driven marketing? Let’s start by diving right into the heart of Facebook’s built-in insights.
How To Navigate Native Analytics on Facebook
So, you’ve been diligently posting on your Facebook Page and interacting with your audience. But how do you know if your efforts are paying off? That’s where Facebook’s built-in analytics can help. The platform provides plenty of data that can help you gauge the effectiveness of your content and overall social strategy.
Accessing Your Insights
There are two primary dashboards that you can use to access data about your Facebook Page’s performance: Facebook Insights and Meta Business Suite Insights.
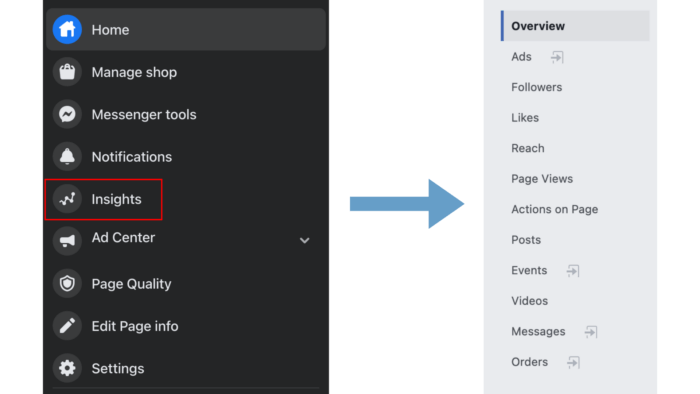
Finding your way to either dashboard is easy. Once you’re logged in, navigate to your Facebook Page. To access Facebook Insights, click the Insights button under the Home category.
You’ll then be directed to an Overview of your Page Insights. This dashboard also breaks down your data into different categories, including Followers, Likes, Reach, Page Views, and more. Access these categories by clicking the desired tabs on the left-hand side.
To access Meta Business Suite Insights, click the Insights button under the Meta Business Suites category. As shown below, Meta Business Suites organizes your insights by Results, Audience, Benchmarking, and so on.
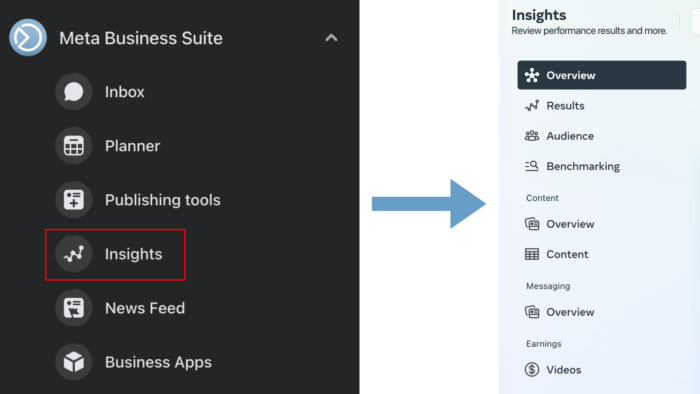
The big distinction between the two dashboards is that you can manage the results of both your Facebook and Instagram efforts with Meta Business Suite. For the most part, though, both dashboards report much of the same data, just presented in a different format.
Understanding Key Metrics
Regardless of which dashboard you decide to use, there are key metrics that you should understand and keep an eye on. Let’s break them down.
Tracking the following metrics will help you assess your Page’s overall performance.
- Total Reach. This metric counts the number of unique users who saw any content from your Page or about your Page at least once. This includes posts, stories, ads, Page visits, and so on. It also includes both organic and paid content.
- Actions on Page. Facebook reports detailed information about the actions that visitors take on your page, including “Get Directions” clicks, website clicks, action button clicks, and phone number clicks.
- Page Likes. When someone likes your page, they are publicly expressing that they are a fan of your brand. Track this metric to see how your audience grows over time.
- Page Followers. Follows tend to reflect a higher level of devotion than likes, since followers have opted in to seeing your updates in their news feed. This makes it another good metric to track to understand the growth of your Page’s audience.
To learn more about who is consuming your content, analyze the following audience metrics.
- Audience Demographics. Study the demographics of your audience — age, gender, top cities, top countries — to better understand who your audience is in order to craft content that resonates.
- When Your Fans Are Online. Familiarize yourself with when your fans are most active in order to determine the best times to post on your Page.
For insights into how effective your content strategy is, keep an eye on and analyze the following post metrics.
- Post Reach. See how far your reach extends with this metric, which counts the number of unique users that have seen your post.
- Post Engagement. Is your content effective at getting your audience to engage and show love? Track how many engagements your post gets, from post reactions to comments to shares.
Remember, each metric is like a piece of a puzzle. Analyzing them in relation to each other helps you see the bigger picture and fine-tune your strategy.
Unlocking Advanced Insights with Rival IQ’s Facebook Analytics
While Facebook’s native insights offer a window into performance, savvy marketers are increasingly turning to third-party analytics tools to unearth deeper, more actionable insights.
Rival IQ’s Facebook Analytics is a reliable alternative to the platform’s native insights, offering a comprehensive platform to access and monitor the performance of all your different social accounts in one place. Our user-friendly interface simplifies the process of tracking and interpreting your data, allowing you to swiftly extract actionable insights.
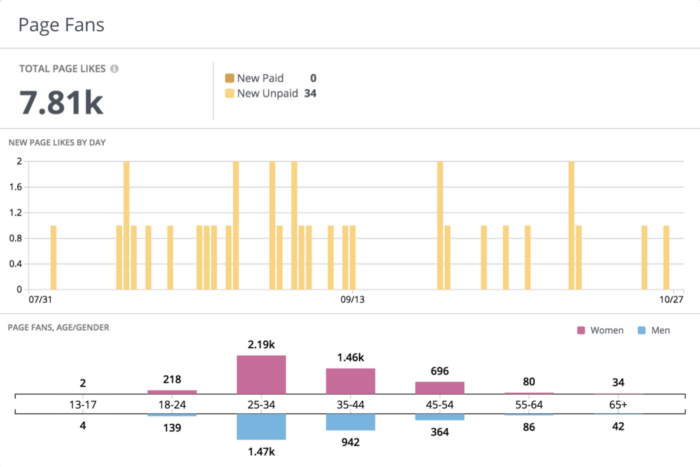
For instance, if you’re focused on growing your fanbase, you’ll want to know which of your efforts are most effective at prompting viewers to like your Page. With the data displayed visually, the Page Fans panel makes it easy for you to spot the days with the greatest spikes in new Page likes. From there, you can figure out what posts or campaigns ran those days and lean more towards that type of content.
Additionally, while native insights provide valuable information about your own metrics, the Rival IQ platform lets you easily compare these metrics with those of your competitors. By adding your top competitors to a digital landscape, you can access dashboards that show how your content measures up against theirs.
From displaying how you rank in terms of Page Fans to calculating the average engagement rate of those in your landscape, the platform makes it effortless to benchmark your brand’s performance directly with the competition. This will allow you to spot areas where you might be falling behind or where you’re excelling compared to your rivals.
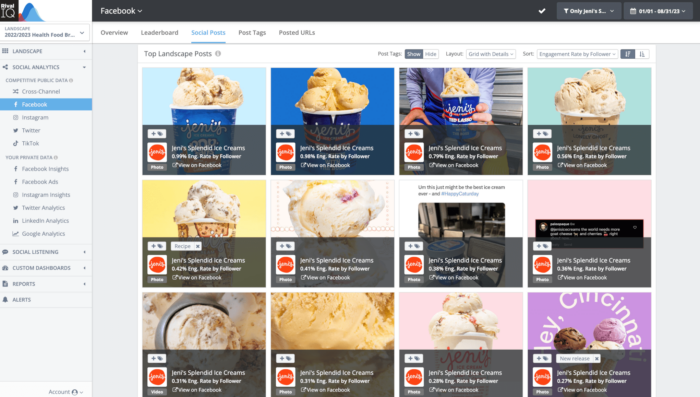
You can also evaluate the performance of individual posts, with the Top Landscape Posts panel displaying a line-by-line view of posts based on metrics like total engagement and engagement rate, as well as a prediction on whether a post was boosted.
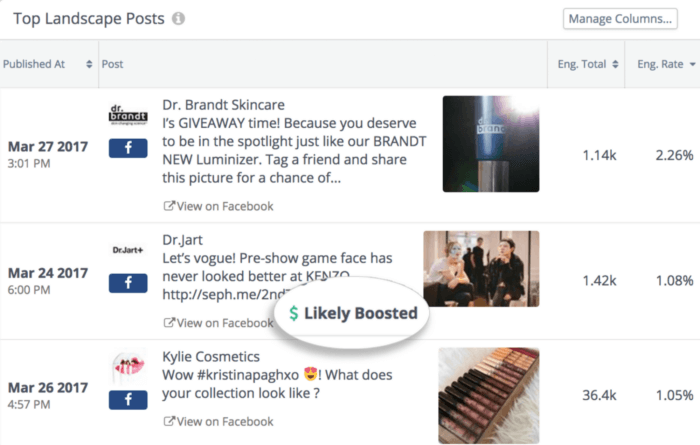
With this information, you can easily identify trends and patterns in your industry. Are their posts driving more engagement than yours? What specific content strategies are used by the posts with the top engagement rates? Through this kind of competitive benchmarking and analysis, you can better identify gaps in your strategies, uncover best practices employed by your rivals, and make adjustments to your content approach.
As brands navigate the intricacies of the digital realm, tools like Rival IQ’s Facebook Analytics emerge as essential companions. By offering a broad suite of features, an easy-to-use dashboard, and a focus on competitor benchmarking, Rival IQ empowers you to elevate your social media game.
Turning Facebook Analytics Into Action
Having access to the numbers, whether that’s through Facebook’s native analytics or a third-party platform, is one thing but putting those insights to good use is another. Here are three basic ways your analytics can help your social media strategy.
1. Appeal To Your Specific Audience
Analytics empower you to refine your content strategy and deliver what your audience craves. Study the details about your audience’s age, gender, location, and interests. Are they on the younger side or older? Are you mainly reaching local fans or is your reach extending across the globe? Armed with this data, you can craft content that speaks directly to your unique audience.
2. Optimize Your Posting Schedule
Peek into your analytics to find out when your audience is most active. Whether it’s during their morning coffee or late-night scrolling, aligning your posting schedule with peak engagement times can skyrocket your content’s visibility.
3. Fine-Tune Your Content Approach
The number of likes, reactions, comments, and shares on a post gives you direct insight into how your audience feels about your content. Notice a particular type of post that invited heaps of positive comments? Double down on that style. Spot a trend in the types of content shared the most? Time to dive deeper into that niche.
Bottom line? Dive into those analytics, decode the engagement patterns, and get to know your audience. Your content strategy shouldn’t be set in stone. Listen to what the data tells you and adjust your approach accordingly.
Getting Ahead of the Competition
Beyond optimizing your social strategy, Facebook analytics data is essential for seeing how you stack up against your competitors. Tracking your competition’s performance can also provide valuable insights into what works and what doesn’t in your industry.
Here are some ways you can use insights about your competitors to your advantage.
1. Identify Top-Performing Posts
Social analytics tools like Rival IQ help massively here. They make it easy to monitor and study your competitors’ most engaging content. When you do so, look for patterns in their top-performing posts. Do they favor videos, memes, or aesthetic images? This insight can spark inspiration for your own content and reveal the types of posts your audience responds well to.
2. Benchmark Against Industry Peers
You can also compare your numbers with those of your industry. Are you lagging behind in likes, shares, or comments or are you leaving your rivals in the dust? Identifying where you stand helps you set realistic goals and allocate resources effectively.
3. Conduct a Competitive Analysis
Delve deep into your competitors’ Facebook presence. What’s their posting frequency? How do they engage with comments? Do they prefer snappy videos or lengthy articles? This analysis equips you with fresh ideas and a clearer picture of your industry’s social landscape, letting you identify gaps and opportunities to outshine them.
The Wrap Up
When every like, comment, and share carries the potential to shape your brand’s narrative, harnessing the power of data-driven insights is no longer a luxury; it’s a necessity. Armed with the insights provided by Facebook analytics, brands can confidently steer their social presence towards success. Understand your audience, tailor your content, and fine-tune your strategies. Let your actions be guided by the numbers, and watch your brand grow!
