Norway dominated the PyeongChang Olympics with a record-breaking 39 medal count. But which team went for the gold on social media during the 2018 Winter Olympics?
We’ll break it down for you.
Between daily medal check-ins and seriously considering in-office vacuum curling competitions, Olympics Fever hit Rival IQ HQ hard. We’re sad to say goodbye to the triumphant wins like Team USA’s women’s hockey gold, heartbreaking losses like Lindsey Vonn’s missed gate in downhill skiing, and seriously memorable commentary from the Lesley Jones/Tara Lipinski/Tommy Weir dream team. We opted to keep the Olympic spirit going a little longer by holding our own mini Social Media Olympics, complete with gold, silver, and bronze medals for the forerunners.
We looked at the social media footprints for the top six teams by medal count. Then, we devised quarterfinals, semi-finals, and the medal round all in the hopes of answering one question: which country was most successful in engaging its fanbase on social while their athletes went for the gold in PyeongChang?
How’d we do it?
We built a landscape in Rival IQ so we could take a look at the social media channels from each of the top six teams in the race for the highest medal count in PyeongChang as of Friday, February 23.
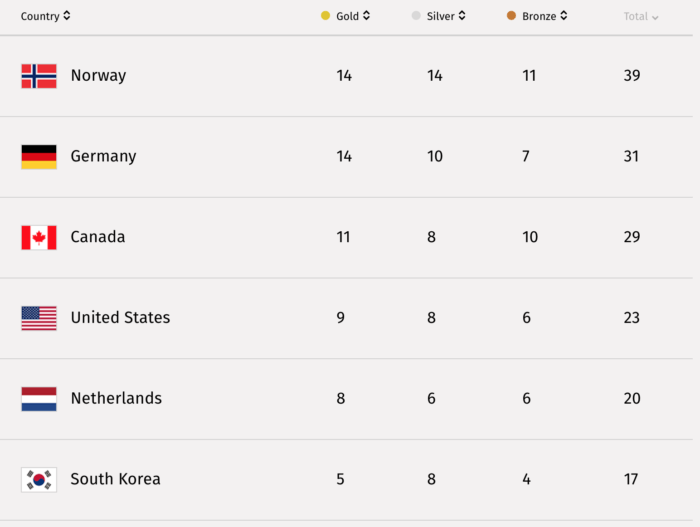
Medal counts, Source: nbcolympics.com
We started by adding all six official Olympic teams’ websites into our landscape. Then, Rival’s bots crawled the web for their social media activity. We limited our search to social activity during the actual Olympics using the date picker. We wound up with data from over 4,700 posts from Teams Norway, Canada, Germany, USA, Netherlands, and France to comb through for the 2018 Rivalympics.
Since each team’s website and social channels are obviously in their own languages, here’s a quick key to our teams:
- Deutsche Olympiche Sportbund: Germany
- France Olympique: France
- Norges idrettsforbund: Norway
- Team USA: United States
- Canadian Olympic Committee: Canada
- Netherlands Olympic Committee: Netherlands
The quarterfinals: Cross-channel posts and Facebook fans
Much like a snowboarder or a figure skater, every competing team needs a bag of social media tricks if it wants to take home the gold. The qualifying quarterfinals in the Rivalympics pitted teams against each other based on two such tricks: cross-channel posting frequency and Facebook fans.
Cross-channel posting is all about how often you post on Facebook, Twitter, Instagram, Google+, and Pinterest, and how that frequency stacks up to that of your competitors. As we’ll see later on, posting frequency isn’t a guarantor of engagement, which is the metric you truly want to hit to make sure your social media is doing the most for you and your fans. Frequency is, among other things, a good measure of the type of elbow grease each team is putting into communicating with its fans.
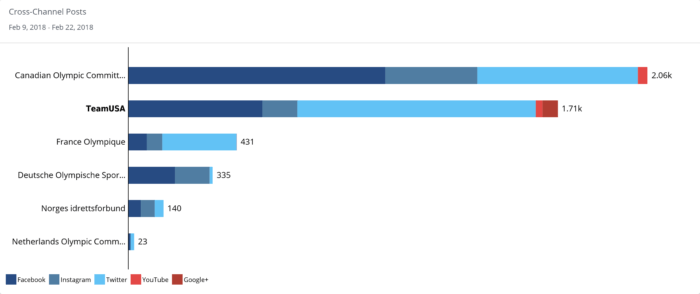
Cross-channel Posts, By Country
As you can see, Canada is blowing every other team out of the water in overall posts, Facebook posts (dark blue), and Instagram posts (blue/grey). Team USA is trailing in second place, though putting up a strong fight with the highest Twitter (light blue) posting frequency. Norway and the Netherlands don’t even look like a threat (but of course we love a good underdog story!).
In the quarterfinals, we also took a look at Facebook fans by team. Facebook fan counts provided a clue about the fanbases each country was working with on the world’s most ubiquitous social platform.
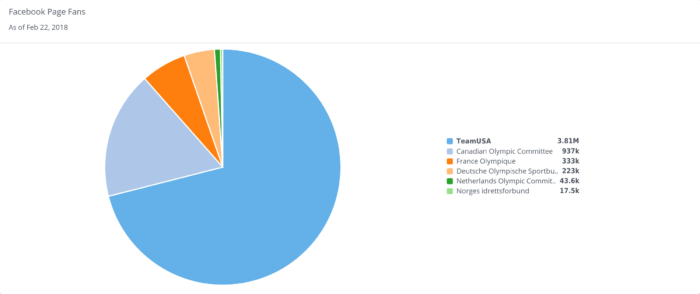
Team USA zooms by its main competition in this race, Canada, with more than four times the Facebook fans. Teams Netherlands and Norway are once again left in the dust by this North American powerhouse duo. These Facebook fan figures must bode well for Team USA…right?
Quarterfinals standings:
- Team USA
- Team Canada
- Team France
- Team Germany
- Team Netherlands
- Team Norway
Since this was just a qualifying round, everyone makes it to the semi-finals!
Semi-finals: Top posts by channel
For the semi-finals, our competitors had to dig deep and hit where it hurts: top posts by channel. By looking at top posts on Facebook and Instagram and top mentions on Twitter, we can start to see who’s in contention for the gold in fan engagement.
Using the Social Channels dropdown in Rival IQ, we looked at the top performing posts as measured by engagement (the measurable interaction on social media posts, including likes, comments, favorites, retweets, shares, and reactions) and engagement rate (calculated by dividing these interactions by total follower count).
Take a look at how our competitors fare in this best-of-three showdown.
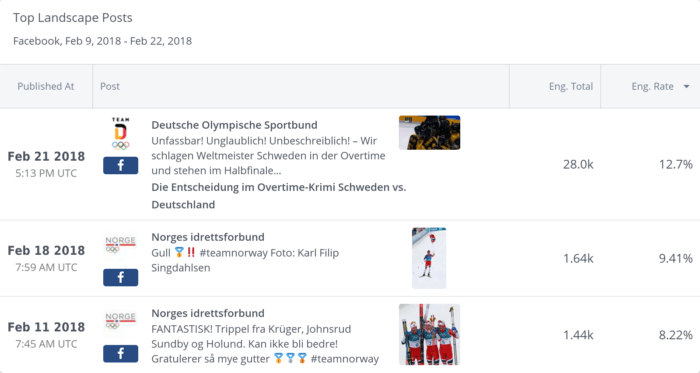
Team Germany is strong out of the gate with a 12.7% engagement rate on their top Facebook post, but Norway is in the #2 and #3 spots with 9.41% and 8.22%. These numbers are nothing to sneeze at when the average engagement rate on Facebook posts hovers around .16% (which you can read more about in our 2018 Social Media Benchmark Report).
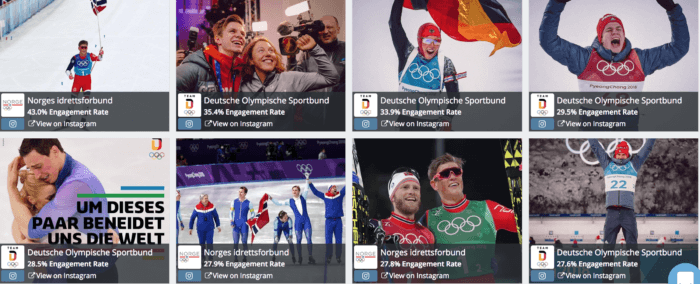
For the Instagram round, we toggled to our grid view so we could better appreciate the photos with leading engagement rates while still digging into the details we needed. Norway and Germany continue to dominate, but Norway strides ahead of the pack with that whopping 43% engagement rate post from Johannes Hoesflot Klaebo’s skiing gold. Considering that the average Instagram engagement rate hovers around 1.66%, we’re sending heartfelt congratulations to all teams.
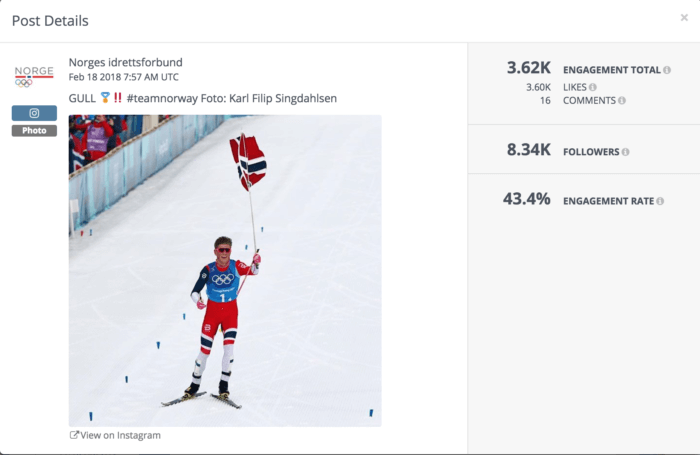
Let’s take a look at that Instagram post with the mind-boggling 43% engagement rate for a moment. Photos are the winning post type during these Olympics, and being able to claim a gold medal for a hometown hero certainly helped engagement rates too. Instagram was the channel to beat for all teams throughout the Rivalympics–though teams posted a third as often on Instagram as they did on Facebook or Twitter, they saw engagement rates 47 times higher than on any other channel. This post is a perfect storm of the right channel, the right content, and the right excited patriotic followers.
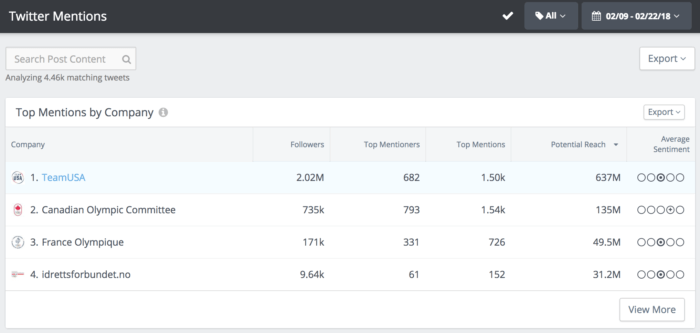
For the Twitter round, we took a look at top mentions for each team, which shook up the standings a little. To find this information, we accessed the Social Listening tab in Rival IQ to better understand who was talking about these teams on Twitter, and the sentiments (positive/neutral/negative) for the top mentions.
Team USA had the highest number of Twitter followers by far, and the highest potential reach. Despite this edge, Canada beat out Team USA for Top Mentions, which measures mentions by Twitter users with a high follower count (meaning a high potential for engagement). Canada also moved closer to the finish line by having the most positive sentiment, while all the other top teams’ sentiment remained more neutral.
Semifinal standings:
- Team Germany
- Team Norway
- Team Canada
- Team Team USA
- Team France
- Team Netherlands
Since we arbitrarily decided that only five teams can qualify for the medal round, we bid “Vaarwel” to Team Netherlands.
The Medal Round: Top activity and engagement rate
All our qualifying teams shed their previous scores to go on to compete in a race closer than the nail-biting finish to PyeongChang’s 15km men’s mass start biathlon.
For the medal round, we looked at two metrics: top posts across all channels and overall engagement and activity for each team. These metrics give us the best insight into how each team was engaging its fans (and therefore who was worthy of the gold). Looking at this metric also helps us measure the performance of each team objectively. Population sizes vary so widely between, say, Canada and Norway, and we didn’t want to have the game decided by number of likes or followers, since that would give countries with larger populations a huge advantage.
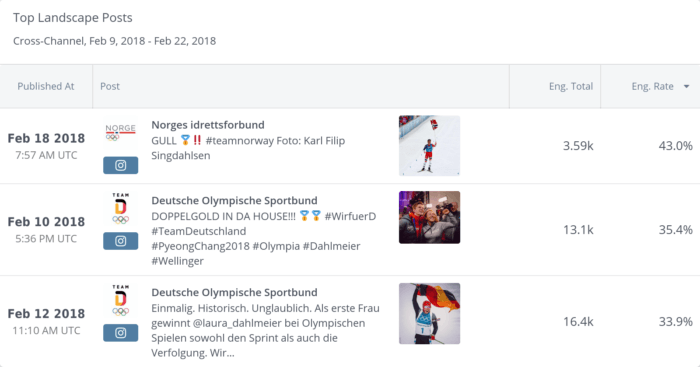
Similar to its success in the Instagram semifinals, Norway continues to dominate when we look at the highest engagement rate across all channels with its 43% rate for Johannes Hoesflot Klaebo’s skiing gold (wow!). Germany remains right behind in a good reminder for us all that Instagram is king when it comes to the highest-performing channel for Olympic teams. (Teams Norway and Germany dominated this round with the top 11 slots on Instagram, with Canada finally getting on the board with the top 12th post as measured by engagement rate.)
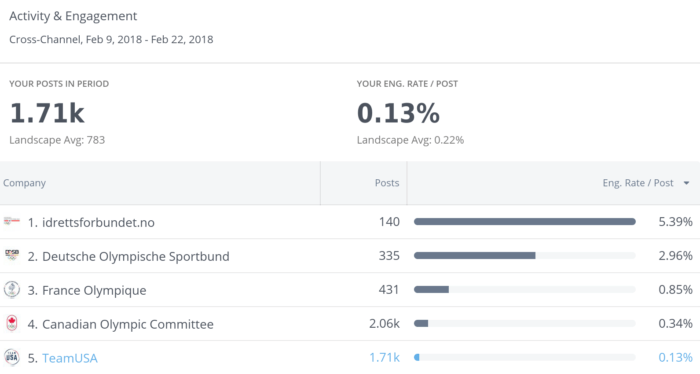
And now, the one race that rules them all: overall activity and engagement for each team during the 2018 Olympics. This view in Rival IQ reports on the number of posts in a given date range, and the average engagement rate from those posts. Team Norway absolutely runs away with it here, with more than twice as much engagement as its closest competitor, Team Germany, despite having fewer than half as many posts. The relationship between number of posts and engagement rate means Norway was really making the most of every post, and that each post was resonating strongly with its followers. Team Canada merits an honorable mention for sheer number of posts in the last two weeks. Team USA sadly didn’t even make it to the podium.
Final standings:
Gold: Team Norway
Silver: Team Germany
Bronze: Team Canada
Fourth: Team France
Fifth (and dead last): Team USA
As the Norwegians say in their most engaging post during the 2018 Winter Olympics: GULL (gold)!
Our advice for competitors in the next Rivalympics?
- Make full use of Instagram (this season’s most popular Olympics channel).
- Photos are a must, though we’ll be curious to see if video overtakes photos by the next Rivalympics.
- A few gold medals never hurt anyone (or your engagement rate).
- Frequency doesn’t necessarily correlate to engagement, so focus on post quality over quantity.
Congratulations to all teams involved in the 2018 Rivalympics, and we’ll see you in 2020 in Tokyo!