Did you know that YouTube has over two billion monthly active users worldwide, making it the second most visited website after Google? That’s a massive audience that brands can get in front of by being active on the platform.
However, creating and uploading videos is only half the battle. To truly understand how your content is performing and how to improve it, you need to delve into the world of YouTube Analytics. By providing you with data about your channel and videos, YouTube Analytics helps you make informed decisions about your content strategy and growing your audience.
Not sure how to get started? Don’t sweat it. We’re covering everything from how to access your analytics dashboard to the metrics that matter most when analyzing your channel’s performance. Let’s dive in!
How To Access YouTube Analytics
Accessing your YouTube Analytics is easy and can be done directly through the platform.
You can also navigate to it from any YouTube page by following the below steps:
- Log in to your YouTube account and click on your profile picture in the top right corner.
- Select YouTube Studio from the drop-down menu.
- Once you’re in YouTube Studio, click on the Analytics tab on the left-hand side of the screen.
- You’ll now be in your analytics dashboard, which will show you an overview of your channel’s performance over the last 28 days. (You can adjust the timeframe.)
As you can see below, YouTube’s channel analytics dashboard has four tabs which each display different types of data: Overview, Content, Audience, and Research.
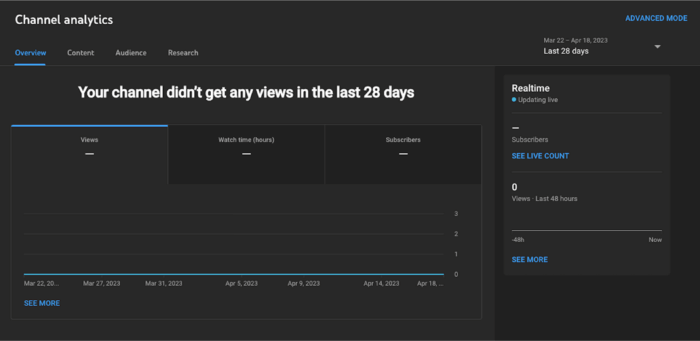
Here’s what each tab on the channel analytics dashboard focuses on:
- The Overview tab shows a summary of how your channel is performing, with key metrics including views, watch time, subscribers, and estimated revenue (if applicable).
- The Content tab shows you how your audience finds and interacts with your content and what content they watch. It includes reach and engagement reports for All Content, Videos, Shorts, Live, and Posts.
- The Audience tab summarizes the sort of viewers watching your videos, including details about your returning and new viewers, unique viewers, subscribers, and total members.
- The Research tab gives you insight into what your audience and viewers across YouTube are searching for.
YouTube also gives you insight into the performance of specific pieces of content. To view analytics on a video level:
- Once you’re in YouTube Studio, click on the Content tab on the left-hand side of the screen or search for your video in the search bar at the top that says “Search across your channel.”
- Hover your cursor over the video you wish to see data for and select the Analytics icon.
YouTube’s video analytics dashboard has slightly different tabs compared to Channel analytics. The tabs are Overview, Reach, Engagement, and Audience.
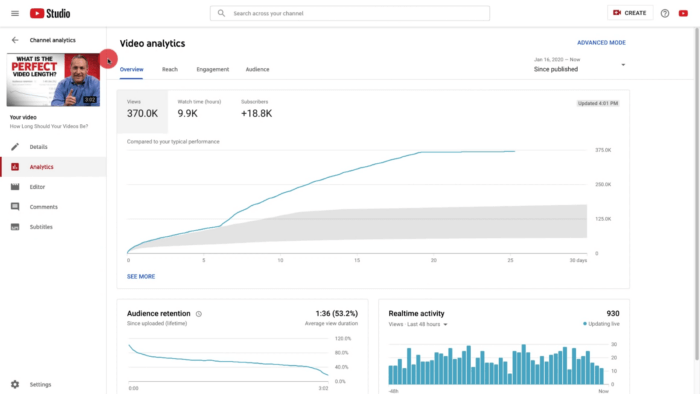
Here’s what each tab under video analytics focuses on:
- The Overview tab shows a summary of how your video is performing, with key metrics including views, watch time, subscribers, and estimated revenue (if applicable). You can also learn more about key moments for audience retention in this tab.
- The Reach tab gives you a summary of how your audience is discovering your channel and includes metrics like impressions, click-through-rate, views, and unique viewers.
- The Engagement tab reports on how long your audience is watching your videos, with metrics like watch time and average view duration.
- The Audience tab summarizes the sort of viewers watching your videos, including details about your returning and new viewers, unique viewers, subscribers, and total members.
It’s important to note that some features of YouTube Analytics may not be available to all users, depending on your account status and the content you’re creating. For example, only those in the YouTube Partner Program will see a Revenue tab. However, basic metrics like views, watch time, and engagement should be accessible to all creators.
Pro-Tip: For highly-detailed data, YouTube also offers Advanced Mode Analytics which allows users to get specific data, compare performance, and export data. You can access it by clicking “Advanced Mode” in the top right corner or “See More” beneath reports.
Understanding YouTube Analytics: Which Metrics Matter Most?
YouTube offers a wealth of data to help you track the performance of your videos. But with so many metrics available, which ones should you focus on? Well, it depends on your goals.
Whether you’re looking to increase your subscriber count, boost engagement, or drive revenue, there are different metrics to help you track your progress. To help you navigate the sea of data, we’ve put together a list of the top eight YouTube metrics to track. First up? Watch Time.
1. Watch Time
Measured in hours, watch time refers to the amount of time viewers have watched your content in a particular time period. YouTube reports on watch time for your whole channel (Channel analytics > Overview tab), as well as for individual videos (Video analytics > Overview tab).
Now, you may be wondering, what about views? Views, which YouTube defines as “the number of legitimate views for your channels or videos,” are often seen as a vanity metric. While tracking views can still give you an idea of which videos are gaining traction, the metric does little to tell you about engagement.
On the other hand, YouTube’s algorithm heavily favors videos with high watch time, which is a better indicator of how engaging a video is. The longer viewers stick around to watch your content, the more likely YouTube will recommend your videos to others.
By monitoring your watch time, you can adjust your content strategy to improve the metric and increase the likelihood of your videos being recommended. For instance, you can analyze which topics or types of videos your audience spends the most time watching and create more content around those subjects.
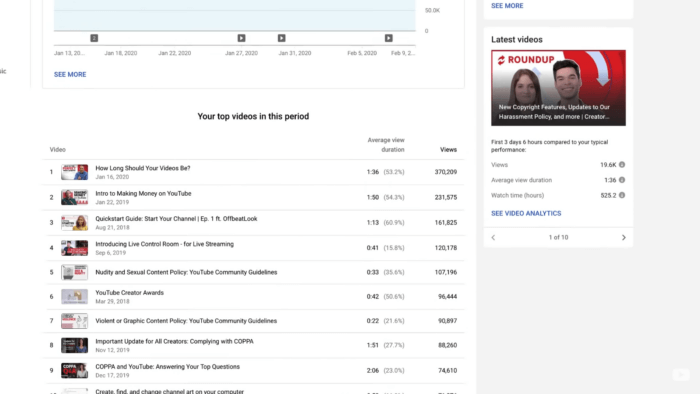
2. Average View Duration and Average Percentage Viewed
Average view duration is the estimated average minutes watched per view for a particular video and date range. Similarly, average percentage viewed is the average percentage of a video your audience watches per view. You can find both metrics in the Overview tab of your channel analytics and the Engagement tab of your video analytics.
Put simply, both metrics tell you how long, on average, your viewers are staying and watching each video.
So why are these metrics important? If your videos have a high average view duration, it means that viewers are engaged and interested in what you’re sharing. On the other hand, if your average view duration is low, it’s likely that your content is not engaging enough and viewers are clicking away quickly.
Knowing your average view duration can help you adjust your content strategy. For example, if you notice that viewers are dropping off early in your videos, you may want to focus on making your introductions more engaging.
You can also use your average view duration to compare the performance of different types of videos. Noticed that your viewers tend to drop off after three minutes? You may want to focus on creating shorter videos that get to the point quickly. Conversely, if your viewers are sticking around for 10+ minutes, you may want to experiment with longer, more in-depth content.
By tracking these metrics and using them to inform your content strategy, you can create videos that keep your audience engaged and coming back for more.
3. Impressions and Impressions Click-Through-Rate
In addition to knowing how engaging your videos are, it’s also helpful to know how effective your video thumbnails and titles are at attracting viewers. This is where impressions and impressions click-through-rate come in, which can be found in the Content tab of your channel analytics and Reach tab of your video analytics.
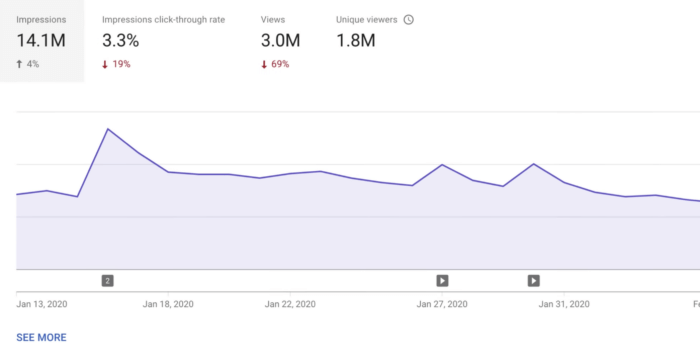
Impressions refer to the number of times your video thumbnail is shown to viewers on YouTube. Note that an impression doesn’t necessarily mean that someone has clicked on your video or even watched it. What it does mean is that your video has been displayed to a potential viewer, essentially telling you how well your video is being promoted by YouTube’s algorithm.
On the flip side, impressions click-through-rate (CTR) measures the percentage of viewers who actually clicked on your video after seeing the thumbnail. This metric gives you insight into the effectiveness of your video’s thumbnail and title, which are the first things viewers see before deciding whether to watch your video. The higher your CTR, the better.
Understanding your impressions and impression CTR can help you make informed decisions about your content strategy. Noticed that your impressions CTR is low? It may be time to experiment with different thumbnail designs or titles to see what resonates with your audience.
Additionally, tracking your impressions over time can give you an idea of how well your videos are being promoted by YouTube’s algorithm and whether you need to adjust your targeting or SEO tactics. By keeping an eye on these metrics regularly, you can gain insights into how your videos are performing and make data-driven decisions to grow your channel.
4. Traffic Sources
Do you know where your viewers are coming from? Are they finding your videos through YouTube search or are they coming from social media, such as Facebook or Twitter?
Traffic sources breaks down your viewership into different categories so you can see where your viewers are coming from. YouTube reports this information both on your channel analytics (Content tab > How viewers found your content), as well as on the analytics dashboard of individual videos (Reach tab > Traffic source).
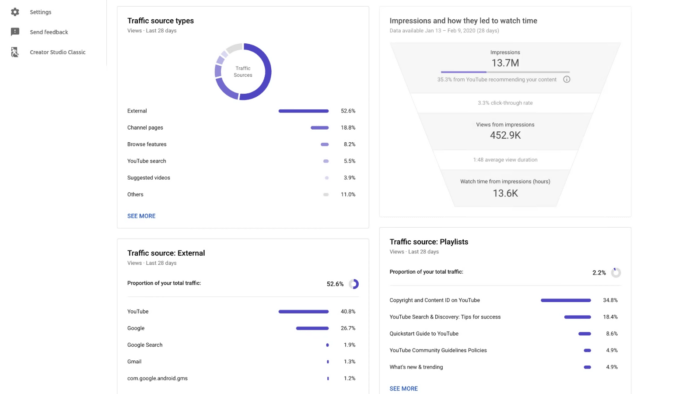
Knowing where your viewers are coming from can help you tailor your content strategy to better reach your audience. For instance, if you see that most of your traffic is coming from YouTube search, then you may want to focus on optimizing your video titles and descriptions for SEO. On the other hand, if you’re getting a lot of traffic from social media, then you’ll want to consider prioritizing promoting your videos on those platforms.
5. Unique Viewers
Unique viewers are the number of individual viewers who have watched your videos during a specific time period. This metric gives you a better understanding of your reach since it tells you how many different people are watching your content as opposed to the number of times your videos have been viewed.
YouTube reports the number of unique viewers both on the video level (Video analytics > Reach or Audience tab) and channel level (Channel analytics > Audience tab).
Tracking unique viewers can help you identify patterns in your audience’s behavior. For instance, if you notice a drop in your unique viewers, it could be an indication that your content is not as relevant or interesting to your audience as it used to be, signaling the need for a pivot in your content strategy.
This metric can also help you measure the effectiveness of your promotional efforts. If you notice a spike in unique viewers after promoting your content on social media or other platforms, it’s a sign that your promotional efforts are paying off. You can then focus more on promoting your content in these channels to drive more traffic to your channel.
6. Engagement
Beyond understanding your audience’s viewing behaviors, it’s also essential to keep an eye on your level of engagement or interactions. YouTube reports on engagement for each video through the Engagement tab in your video analytics dashboard. The different forms of engagement that the platform reports include:
- Likes vs. Dislikes. This refers to how many viewers liked and disliked your video. To see Likes for your entire channel, visit the Content tab on your channel analytics dashboard.
- End screen element click rate. End screen elements are the pop-ups that you see at the end of a video. They typically feature videos, playlists, channels, links, merchandise, or a subscribe button. The click rate metric tells you how often viewers clicked each end screen element in your video.
- Top remixes. This report shows your content that has been remixed to make Shorts, as well as the number of times your content has been remixed and the number of remix views.
Comments are another form of engagement, which you can find by going to the Content tab in the sidebar of YouTube Studio.
Engagements are important to track because they can help you understand how your viewers are responding to your content and whether they are finding it valuable and engaging. Likes and dislikes are a good indication of how viewers feel about your video content, while comments give you direct feedback from your audience.
By paying attention to your engagement levels, you can get a better understanding of your audience’s preferences and adjust your content strategy accordingly. This can lead to more engagement, more subscribers, and ultimately more success on the platform.
7. Subscriber Count and Growth
When someone subscribes to your channel, it’s a sign that your content resonates with them enough for them to want to see more and follow you. Typically, the higher your subscriber count, the larger your audience and potential reach.
In a similar vein, subscriber growth is the rate at which your subscriber count is increasing (or decreasing). Tracking this metric can tell you whether your content is attracting new viewers and whether your audience is growing over time. If your subscriber growth is positive, it means that your content strategy is effective in bringing in new viewers and retaining existing ones.
You can easily find your subscriber count and growth on the Overview tab of your channel analytics dashboard on YouTube Studio. The video platform also provides other interesting insights into your subscribers.
On the Content tab of your channel analytics, the Subscribers report shows you the number of subscribers that you gained from each content type: videos, Shorts, live streams, posts, and others. (“Others” include subscriptions from YouTube search and your channel page.) This information can help you better understand which type of content is best at turning your viewers into subscribers.
On the Audience tab of your channel analytics, you’ll also see reports on Watch time from subscribers, which reveals what percentage of your watch time comes from subscribers versus viewers who aren’t subscribed, and subscriber bell notifications, which tell you what percentage of your subscribers get bell notifications from your channel.
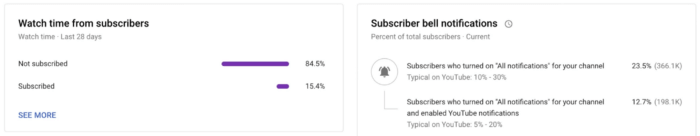
Both metrics give you more insight into how invested and engaged your audience is with your channel and can help you shape your goals and strategy moving forward. Notice that it’s mostly non-subscribers that are watching your videos? Convert more viewers into subscribers by reminding them why it’s a good idea to subscribe in your next video or offering some kind of incentive through a giveaway or contest for subscribers.
8. Audience Demographics & Behavior
Understanding your audience demographics and behavior can help you create more targeted, effective content and ultimately increase your views and subscribers.
The Audience tab has lots of great insights into this, both on the channel level and video level. Here’s some of the information you can learn about your audience:
- Geography shows you which locations have the most watch time for your channel.
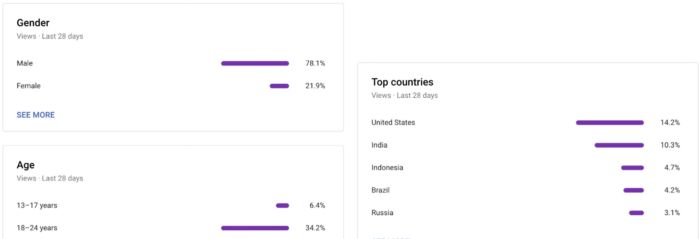
- Age and gender report the age ranges that are adding to your watch time the most and the gender distribution of your audience.
- When your viewers are on YouTube lets you know when your viewers are online across YouTube in the last 28 days
- Content your audience watches shows you what other Videos, Shorts, and Live streams your viewers watched outside your channel over the past seven days.
- Channels your audience watches shows you what other channels your viewers consistently watched outside your channel over the past 28 days.
Knowing where your audience resides, as well as their age range and gender, can help you create content that resonates with them. For example, if you have a large audience in a particular country, you could create content that is tailored to that country’s culture or language. This could help you build a stronger connection with your viewers and increase engagement.
On the other hand, having insights into how your viewers watch and engage with content outside of your own channel can be a huge asset as you craft your content strategy.
For one, you can use your knowledge of when your viewers are on YouTube to guide you when you schedule a Premiere or plan your next live stream. Additionally, knowing what other content your audience watches can be a great source of inspiration for new videos and titles. You can also use the info for thumbnail ideas and collaboration opportunities.
Leveraging Third-Party YouTube Analytics Tools
Now that you’ve gotten a sense of the top metrics to track on your YouTube channel, let’s explore some third-party tools that can help you get even more out of your analytics.
While YouTube Studio is great for seeing how your channel is performing within the video platform itself, the following tools and platforms have additional features that can be used to optimize your approach and strategy.
Rival IQ
From YouTube to Instagram to TikTok, you can have all of your social channels’ analytics in one place with Rival IQ.
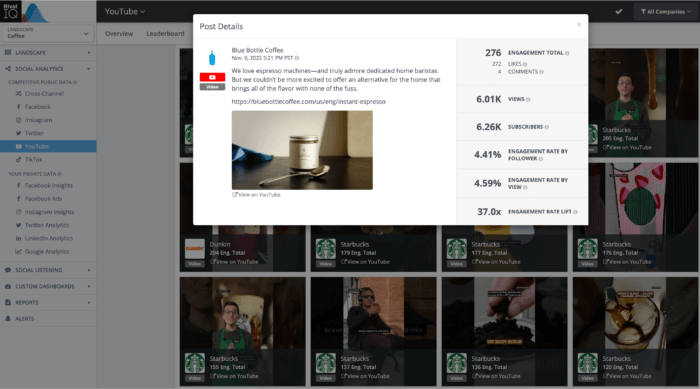
Our platform provides insights into your own accounts, as well as information on your competitors’ content, engagement metrics, and overall performance, allowing you to benchmark against them and identify areas for improvement. Plus, customizable dashboards and reports make it easy to visualize and understand all you need to know about your performance.

Google Analytics
You can link your YouTube channel to Google Analytics for access to more detailed and granular data about your audience, their behavior, and their interests.
The advantage of Google Analytics is that it allows you to track user behavior beyond the YouTube platform, such as how they navigate your website or engage with your social media accounts. This is helpful for understanding how your YouTube content fits into your overall digital strategy and identifying opportunities for growth and optimization.
TubeBuddy
TubeBuddy is a browser extension designed specifically to help YouTube creators manage and grow their channels. In addition to providing detailed analytics about your channel’s performance, TubeBuddy has tools for productivity, bulk processing, video SEO, promotion, and competitive research.
Tubular
Tubular is an analytics platform that focuses on providing insights about social video on YouTube, as well as other social media sites such as Instagram, Twitch, Facebook, and more. Beyond allowing you to track video performance, the platform also offers solutions for social video listening, influencer identification, and audience research.
Wrapping It Up
YouTube is a massive platform that offers so much for businesses and creators alike. And when used effectively, it can be a powerful tool for growing your brand.
Whether you’re new to YouTube or have been using it for a while, tracking your analytics is the best way to take control of your channel. Doing so gives you an understanding of what works and what doesn’t, equipping you with the key insights you need to keep improving your strategies over time.
While gathering data on your channel may seem overwhelming, with a little bit of time, practice, and the right tools, you’ll be able to navigate the world of YouTube analytics like a pro.