This December launch is all about helping you consume your data in a way that works best for you. It comprises three different features, each of which expands the ability to do your job better and faster.
This new feature release empowers you to:
- Deliver tailored reports – New customization options transform your data into a compelling social story.
- Integrate your data – Share social reporting across your entire organization with a robust API.
- Access results swiftly – Pinpoint answers and take action quickly with usability upgrades based on customer feedback.
New Feature Lineup:
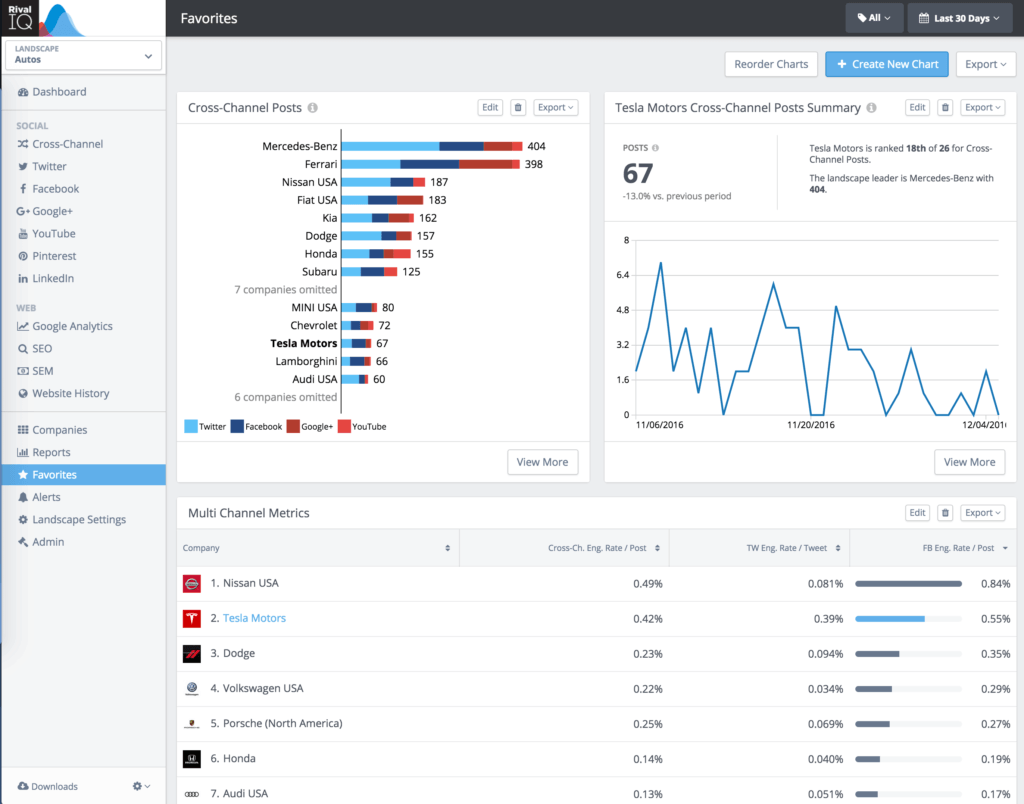
All-New Favorites and Custom Charts
‘My Charts’ is now ‘Favorites’ which gives you all new custom charts and reporting. Telling your story with data has never been this easy. You’ve set social goals, and now you need to report against progress and these new features give you the control to create customized charts that will delight and show the value of social. Customize your charts and then schedule the reporting; this automation will save significant time – giving you back precious time to focus on investing in your social strategy.
- New competitive charts. Create custom tables with up to 8 different metrics. Additionally, the time-series chart can now display change-over-time data to help reveal when your competitors (or you) make big moves.
- New, focus-company-centric visualizations. You can now create a focus company table that displays details on the current, previous, and percentage change values for up to 8 metrics. Using the new visualizations is an excellent way to consolidate a broad set of information into a single display. You can also create a new panel that analyzes a single metric for the focus company, including growth and competitive ranking information.
- New Chart Creator Interface. A completely rebuilt custom chart creator gives you more flexibility in report generation. Set the panel display width to full width or half width. Customize your panel titles to tell your story. And, edit previously created charts to get your reporting just right.
- High-density PDF export. Create a concise, shareable report with your team or clients with the new high-density PDF report. With up to six visualizations per page, you can tell a complete story without generating an entire PPT deck.
API
Connect your data in a whole new way with Rival IQ’s API. For those on a Champion plan or above, you’ll now be able to couple your social data with internal data and systems creating a comprehensive picture.
Customize your data in infinite ways. There are over 80,000 different ways to order a latte. So why can’t you order your data, your way? These endless possibilities mean you can take your data into your internal dashboard, coupled with other marketing metrics, or even get notified when a competitors post is tagged as likely boosted. All of which means you’re working more efficiently and effectively.
- Aggregate cross-channel and single-channel analytics. All of the social media analytics you can access in Rival IQ are available through the API.
- Searchable top posts. Access the posts driving the analytics, using post type filters, keyword search, and channel limits to get the data you need.
- Flexible output format. Whether you’re connecting to a custom system or importing your data into an off-the-shelf tool like Tableau, our JSON, and CSV data formats have you covered.
Brand New Date Picker
We’ve been listening, and now we’ve improved a critical part of the UI. The redesigned Date Picker tells a clear story about what you’re choosing and explains the comparison. The ease of the new Date Picker means you’re pinpointing answers faster than ever.
![]()
![]()
These newest features bring you your data, your way by using customization, and automation while simultaneously improving the ease of use. Use your data to answer the critical questions you have to answer to refine your strategy and prove the value of your social.
Take control of your data in a whole new way. Snag a trial now and see the possibilities for your brand.