With over 800 million active users worldwide, LinkedIn is the go-to social platform for professional networking. The channel has a plethora of marketing tools for businesses to leverage, as well as boundless content marketing opportunities to show off all your company has to offer.
But, how do you know if your LinkedIn marketing efforts are working?
To determine whether you’re meeting your objectives, it’s essential to monitor your LinkedIn performance. This means looking at the data and tracking key metrics in order to quantify your LinkedIn efforts and discover insights that can help you boost your ROI and reach your goals.
While there are plenty of ways to track and measure your LinkedIn Page analytics, here are the top 11 key metrics all marketers should know inside and out.
Types of LinkedIn Page Analytics
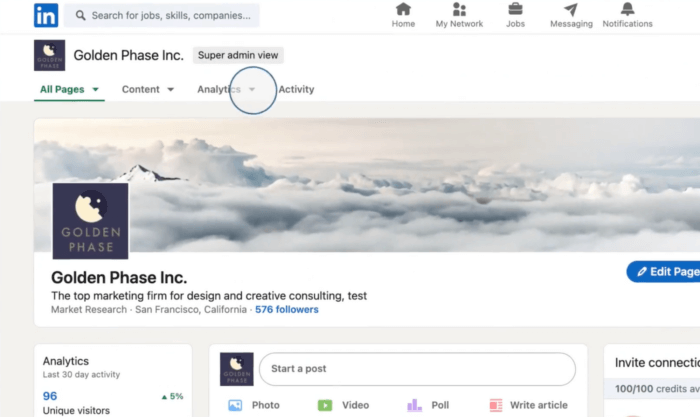
Before we jump into the good stuff/most important metrics/whatever, it’s important to know that there are four main types of analytics that you can access as an admin of your LinkedIn Page. These can be seen by entering the Analytics tab at the top of your Page in admin view.
Visitors
The Visitors analytics tab presents information about the LinkedIn members that visit your Page but aren’t following you. This includes how frequently those members are visiting your Page and the demographics of the visitors.
Check out these analytics when you want to understand who your visitors are and whether you’re reaching your ideal audience.
Followers
Followers are those who have expressed explicit interest in your Page by going the extra step to follow your content.
As you build a dedicated following on LinkedIn, you’ll want to keep track of that growth, as well as understand who your followers are so that you can better engage with them. The Followers analytics page will give you those insights.
Updates
Your Updates analytics focus on the performance of the content that you share with your followers and visitors.
This is where you’ll go to observe whether your status updates, articles, videos, and more are resonating with your audience. Stats like impressions, views, and engagements will be found here.
Competitor
The Competitor analytics page lets you compare your performance against companies on LinkedIn that you identify as competitors.
You can easily see how your own brand stacks up in terms of followers or engagements with the organized rankings presented to you by LinkedIn.
Top 11 LinkedIn Metrics To Know
1. Visitor Metric: Page Views
Visitor Page views refer to the total number of times your Page has been viewed by non-followers. You can filter this metric by a particular time range, as well as by specific Page sections.
This metric is essential for understanding what kind of LinkedIn activity drives interested members to view your Company Page.
Observed a spike in visitors on the same day that you shared a new blog post? That could be a good sign that your audience enjoys that kind of content. Not noticing any growth in Page views after the launch of an ad? Time to take a look at the campaign to figure out what’s going on.
You can also check out the trends in views over a longer period of time, like the data shown below. Identifying the time periods that enjoyed a high amount of views and understanding the corresponding campaigns at the time can help you optimize your strategy for the future.
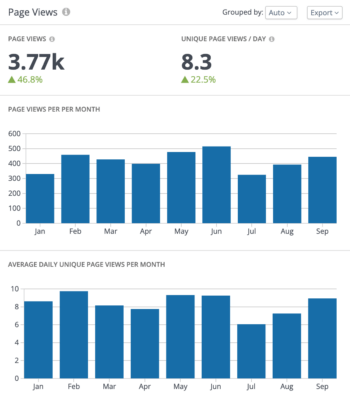
By keeping an eye on Page views, you’ll have your finger on the pulse of when and why your Page is gaining or losing attention.
Ready to start analyzing your LinkedIn metrics?
2. Visitor Metric: Unique Visitors
Unlike Page views which count all views by visitors, unique visitors only reports on the individual members that have visited your Page. In other words, if one non-follower visited your Company Page 20 times, that activity would be reported as one unique visitor and 20 Page views.
This metric gives you an idea of how many members are interested in your company. With the number of unique visitors presented along particular time frames, you can also observe patterns in the level of interest and note the strategies that tend to draw more unique visitors.
For instance, in the case below, you’d want to dig deeper into what caused the spike in unique visitors on October 12th and consider whether it’s something you can reincorporate into your future efforts.
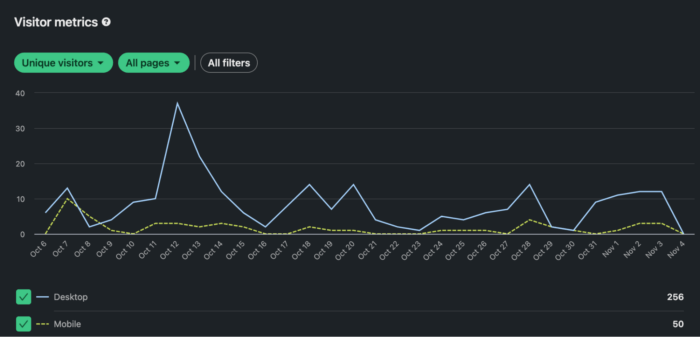
Additionally, unique visitors is an important metric to track if you want to know how to convert a visitor into a follower. Compare your unique visitors to follower growth to better understand when and why a casual visitor would take the leap to follow your Page.
3. Visitor Metric: Demographics
Your visitor demographics paint a colorful picture of who your audience is. The metric breaks down who has visited your profile based on the following characteristics:
- Job function
- Location
- Seniority
- Industry
- Company size
You can also filter the results by time ranges.
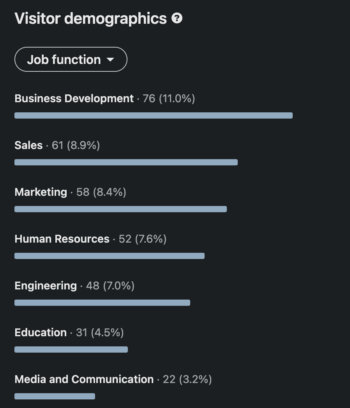
Looking at the demographics of your visitors is an essential part of developing an effective social strategy. Do the demographics align with your target audience? Do you need to adjust your strategy to better connect with your ideal visitors? Is there a surprising opportunity to reach a demographic that you hadn’t thought of before?
Remember: understanding your audience is imperative to developing content that resonates with them.
4. Follower Metric: Growth
Another metric you’ll want to keep an eye on is follower growth, which refers to the number of followers you gained or lost during a specified time frame.
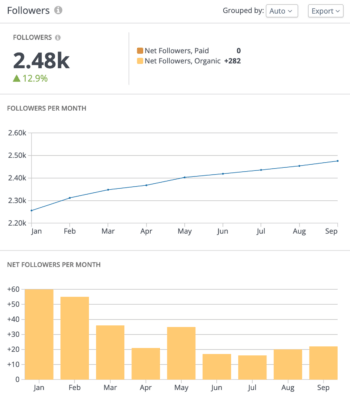
While monitoring your total number of followers lets you know the size of your audience, keeping an eye on moments of growth (or decline) can give you clues as to why people may follow or unfollow you.
Understanding how your follower count grows allows you to pick out abnormal spikes or dips in new followers. Notice a sudden increase in new followers last Tuesday? What happened to cause that jump in interest? Is it something you can do again to boost growth in the future? These are the kinds of questions that tracking follower growth can help you ask and answer.
5. Follower Metric: Demographics
Want people to engage with your content? It’s all about knowing your unique audience and creating posts that resonate with them.
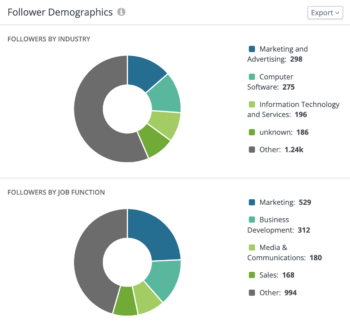
LinkedIn breaks down your follower demographics by location, job function, seniority, industry, and company size. Regularly monitoring this data over time will help you better understand who your followers are. You can then use those insights to guide your content strategy.
6. Updates Metric: Impressions and Unique Impressions (Reach)
For every Update that you post, LinkedIn reports the impressions, as well as the unique impressions (AKA reach), of the post.
The platform defines a single impression as when an “Update is visible for at least 300 milliseconds with at least 50% in view on a (signed-in) member’s device screen or browser window.” Put simply, this metric tells you how often your content appears on users’ feeds. So, if one LinkedIn member happens to come across your content 20 times on their feed, that would be an impression of 20.
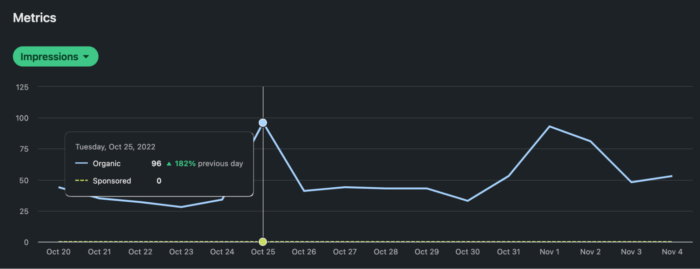
Unique impressions, on the other hand, shows the number of times your Updates were shown to individual members regardless of how many times they saw the content. This is also called reach, referring to the number of unique people you’ve reached with a single post.
While impressions aren’t always a great indicator of the quality of your Updates, tracking this metric can help you optimize your posting strategy in a way that gets your Updates in front of more eyes.
7. Updates Metric: Video Performance
If you’ve leveraged videos in your content strategy, LinkedIn has additional data on video performance that you’ll want to keep an eye on.
The video performance tab presents three kinds of metrics:
- Lifetime watch minutes refers to the total minutes the video has been watched, including views less than three seconds.
- Total lifetime views is the number of times the video was watched for more than three seconds.
- Unique lifetime views reports the number of unique users who watched the video for more than three seconds.
While views on their own aren’t always a reliable indicator of engaging content, being able to establish a baseline and benchmark your views based on past performance is one way to understand how effective your strategy is.
8. Updates Metric: Clicks and Click-Through Rate (CTR)
Clicks, which refers to the number of clicks on your posts, company name, or logo by a member, is a meaningful metric that signals your audience’s interest in your content and company. If someone is actively clicking on your post or company to learn more, there’s a good chance that your Update piqued their interest.
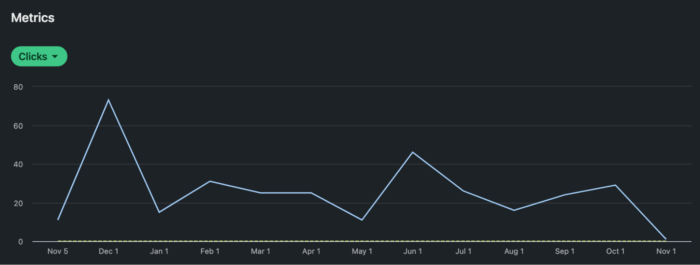
You can then divide the number of clicks by the number of impressions an Update received, which results in the click-through rate or CTR and is usually expressed as a percentage. For example, a post that was shown to users 100 times and clicked on 20 times would have a CTR of 20%.
Generally, you want your posts to have a high CTR since it indicates that your content is highly engaging and relevant to your audience. At the same time, make sure to confirm the sentiment behind a high CTR by monitoring other interactions like reactions, comments, and shares.
9. Updates Metric: Engagement Rate
Similar to the CTR, the engagement rate is calculated by taking the total number of engagements on an Update and dividing it by the number of impressions.
On LinkedIn, the total number of engagements includes the reactions, comments, shares, clicks, and followers acquired from a single Update.
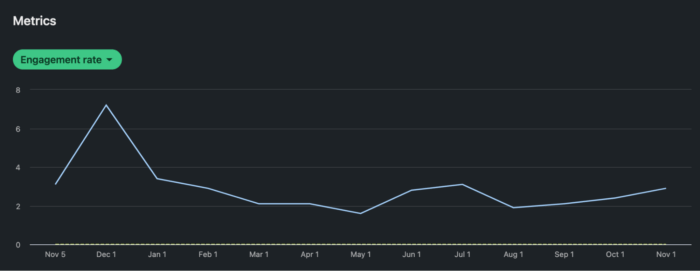
Engagement rate is one of the most — if not the most — important metrics to monitor. Why? Because it indicates that your content resonates with your audience and that it’s interesting enough for people to slow down and interact with. After all, a large following or lots of views means little if no one cares enough about your company and content to engage.
10. Competitor Metrics: Followers
The competitor analytics page lets you compare your performance to up to nine other companies of your choosing.
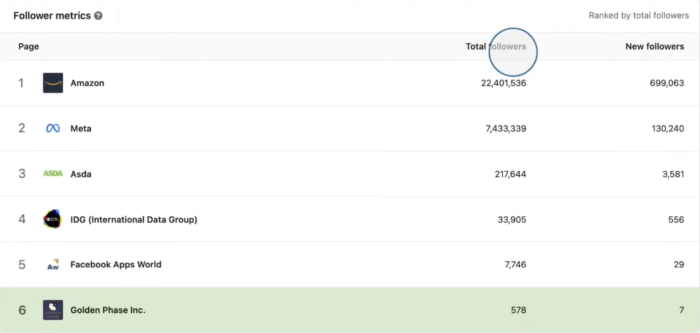
The number of followers each company has is one metric you can track to see how your Page stacks up compared to the competition.
LinkedIn presents both the number of total followers and new followers for each company (within a particular time range) and ranks the Pages from most followers to least. Noting where your company ranks and keeping track of whether that position changes could be one way to judge your LinkedIn performance over time.
11. Competitor Metrics: Total Engagements
Similarly, you can also see how you compare to your competition in terms of total engagements.
Under the organic content metrics module, LinkedIn ranks each Company Page based on total engagements within a specified time range of your choosing. It also displays the total number of posts from each company, giving you an idea of how active the Page is.
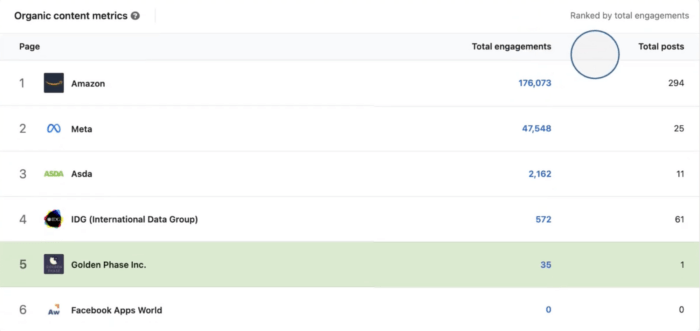
Consider benchmarking your own engagements and activity against the competition in order to identify opportunities for improvement or validate your current success.
The Wrap-Up
Success on LinkedIn may look different for everyone, but regularly tracking and analyzing your top LinkedIn metrics will always be a tried and true way to ensure that your strategy is backed by meaningful data and stats.
Now that you understand these top 11 LinkedIn metrics, review your goals and objectives to figure out which metrics emerge as most important for your company. Identify the information you need to strengthen your efforts and pin down the metrics that can provide that clarity.
Want to make tracking social media metrics even easier? Check out how Rival IQ streamlines your social reporting with a free 14-day trial. Enjoy access to performance data from all your socials in one place, as well as competitive insights you can leverage to boost your LinkedIn performance now and into the future.
