Can’t get enough of the 2018 Social Media Industry Benchmark Report? Neither could we, which is why we took a deeper dive into the numbers, exploring the month-over-month trends, and finding examples you can learn from.
Clearly, we’re fans of social media benchmarks. They’re incredibly helpful, giving you a way to measure and compare your own social media performance — it’s core to what we do here at Rival IQ. It’s why we publish our Social Media Industry Benchmark Report annually AND why we’re returning to the 2018 report to give you even further insight.
Our founder, Seth Bridges, first shared this work via a webinar in June 2018. The feedback from the audience was so positive that we decided to produce this written version. You can watch here, or head to the original for the full transcript of that presentation.

The work we’re discussing in this report isn’t a rehashing of the 2018 study, so if you’re not familiar with 2018 Social Media Industry Benchmark Report, I recommend reading it first. Before we dive into the new numbers, let’s cover the basics of our methodology and recap the overall performance.
Methodology
For this breakdown, we expanded our analysis of the 2018 Social Media Industry Benchmark Report. Using Rival IQ, we analyzed the data from the report going month by month — in total, 5 million social posts from 10 industries across the top three social channels, Facebook, Instagram & Twitter. Our goal was finding trends and shifts, so we looked at changes in engagement and posting frequencies throughout the year.
As a reminder, we define engagement as measurable interaction on social media posts, including likes, comments, favorites, retweets, shares, and reactions. Engagement rate is calculated based on all these interactions divided by total follower count.
Get the full details of the methodology from the original report including brand inclusion criteria, industries, and more in the original 2018 Social Media Industry Benchmark Report.
How does that data break down by channel?
Before we get to the month-over-month trends for each channel and examples of top performers, let’s recap the overall performance.
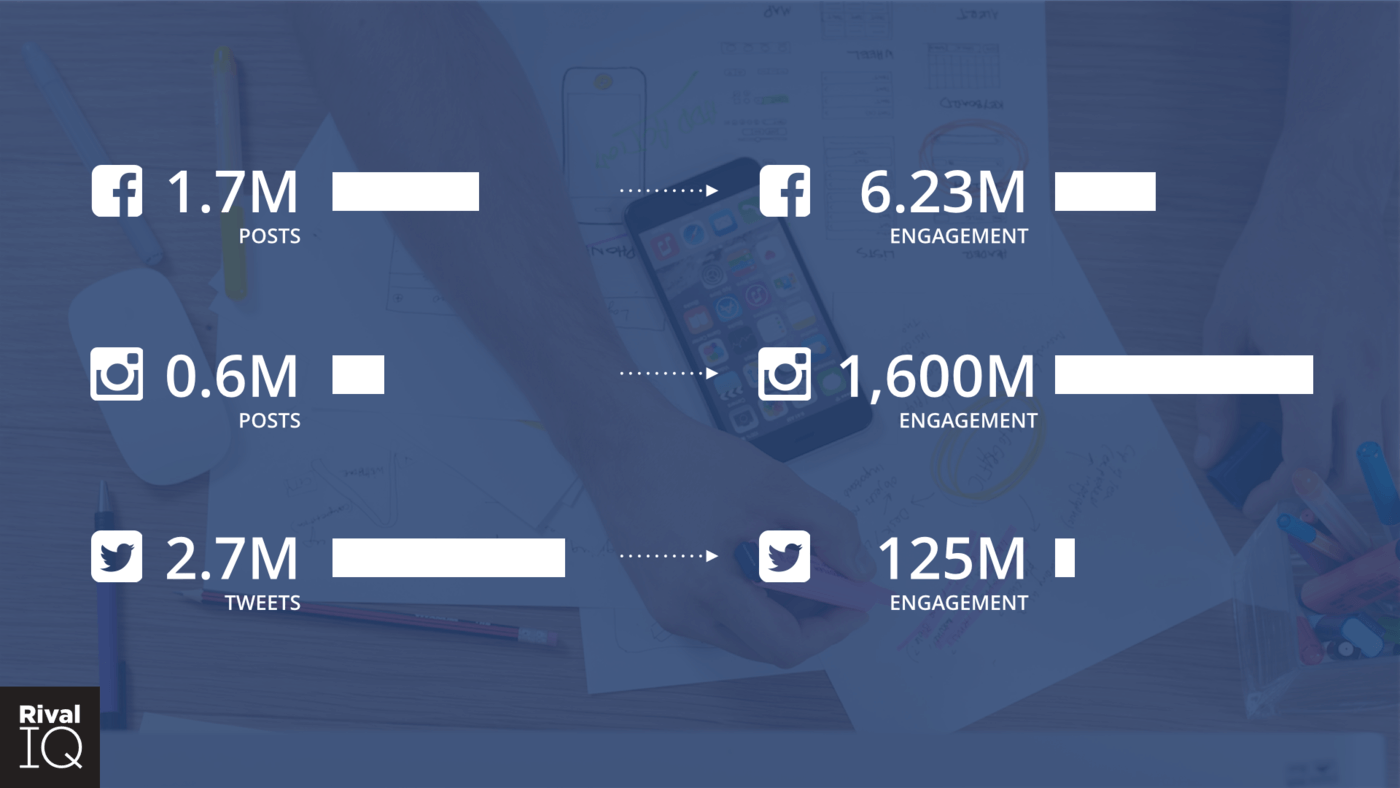
5 million social posts broken out by channel including activity and engagement
Across the three channels and the 5 million social posts we analyzed, just over half were tweets. Interestingly, Instagram posts represented only about 12% of all the social posts but blew the engagement totals through the roof.
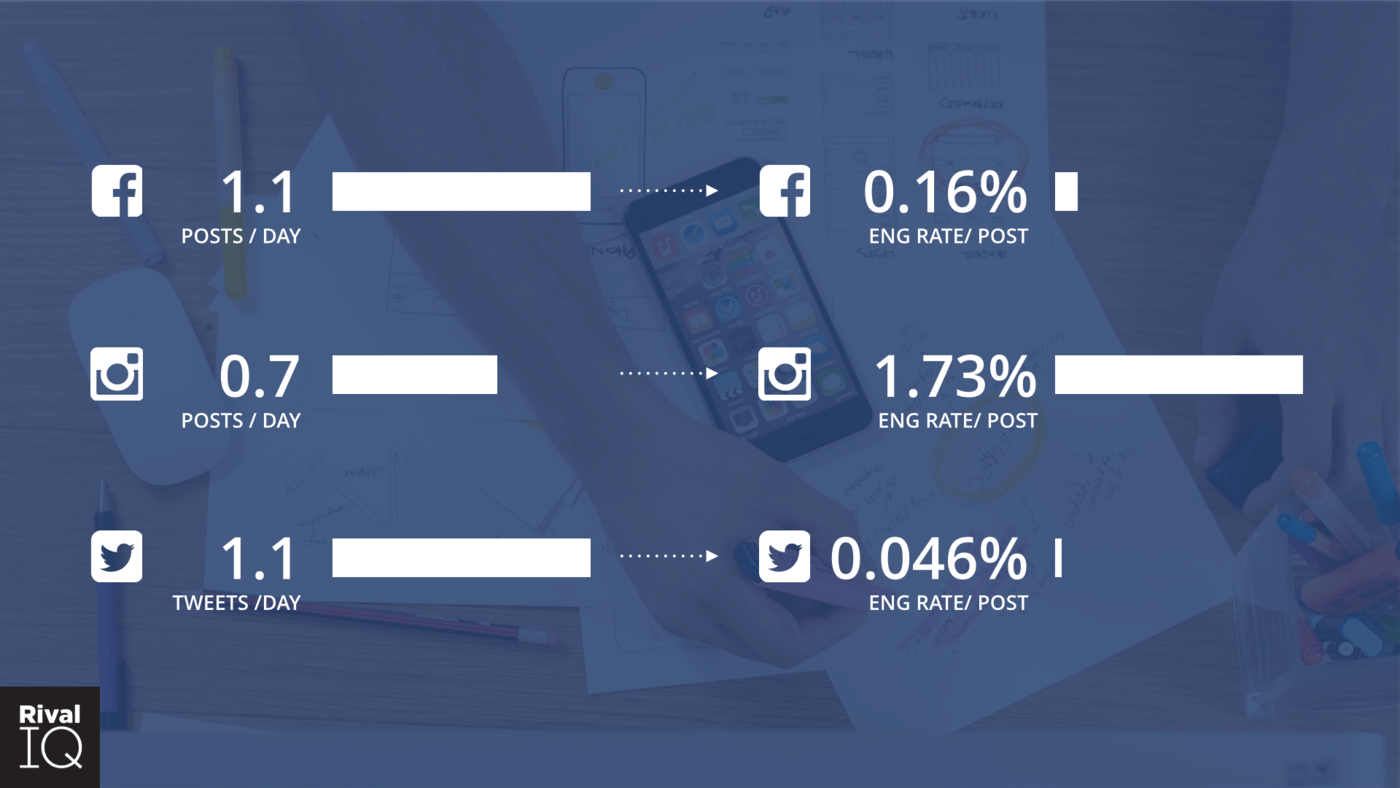
On a per company basis, the average posts per day and the engagement rates for each social channel.
You’ll see in the chart above that the average company posts on Instagram about 5 times per week while posting just a hair more than once a day on both Facebook and Twitter. Despite having the same the average posting levels, the per-post engagement rates for Facebook and Twitter are miles apart. But that distance compares little to the engagement rates we see on Instagram.
I’m sure you experience, like most industries, seasonality which in turn reflects not only in social media engagement but also your content pipeline. And of course, with many industries feeling the pain of decreasing average engagement rates, we wondered “how did engagement and posting frequency change throughout the year?” Using Rival IQ, we took a look at the month-over-month trends for each industry in our study on Facebook, Instagram, and Twitter.
Of course, we didn’t stop there. Using Rival IQ, we went down another layer to find compelling examples of good performance to help you improve your brand’s social engagement. For each social channel, we analyzed a top performer—their content, tactics, and overall strategy. With these case studies, you’ll get insight into what helped them excel at social media. Let’s dive in.
Facebook engagement trends down
Organic reach is declining—it feels practically gone. Does declining organic reach for business pages also mean declining engagement? The short answer is yes. When we examine the average per-post Facebook engagement of across all companies in our study, it shows that the average per-post engagement rate on trended down month-over-month throughout 2017.
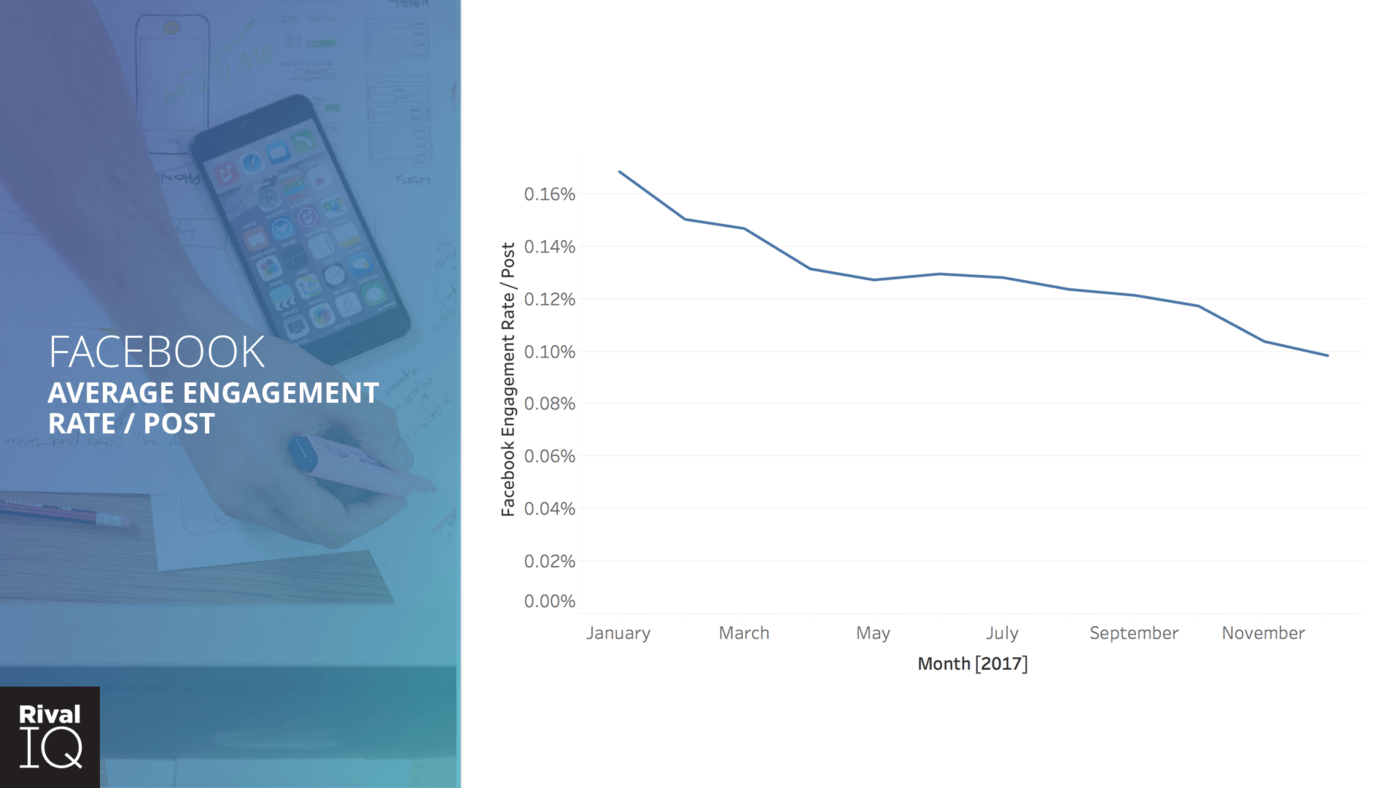
Average engagement rate per post on Facebook trended down almost every month in 2017.
In this month-over-month chart above, we see a very slight lift in July before heading down even further to below 0.1%. It dropped off about a third from the beginning of the year to the end of the year. If you saw your Facebook performance declining throughout the year, you were not alone.
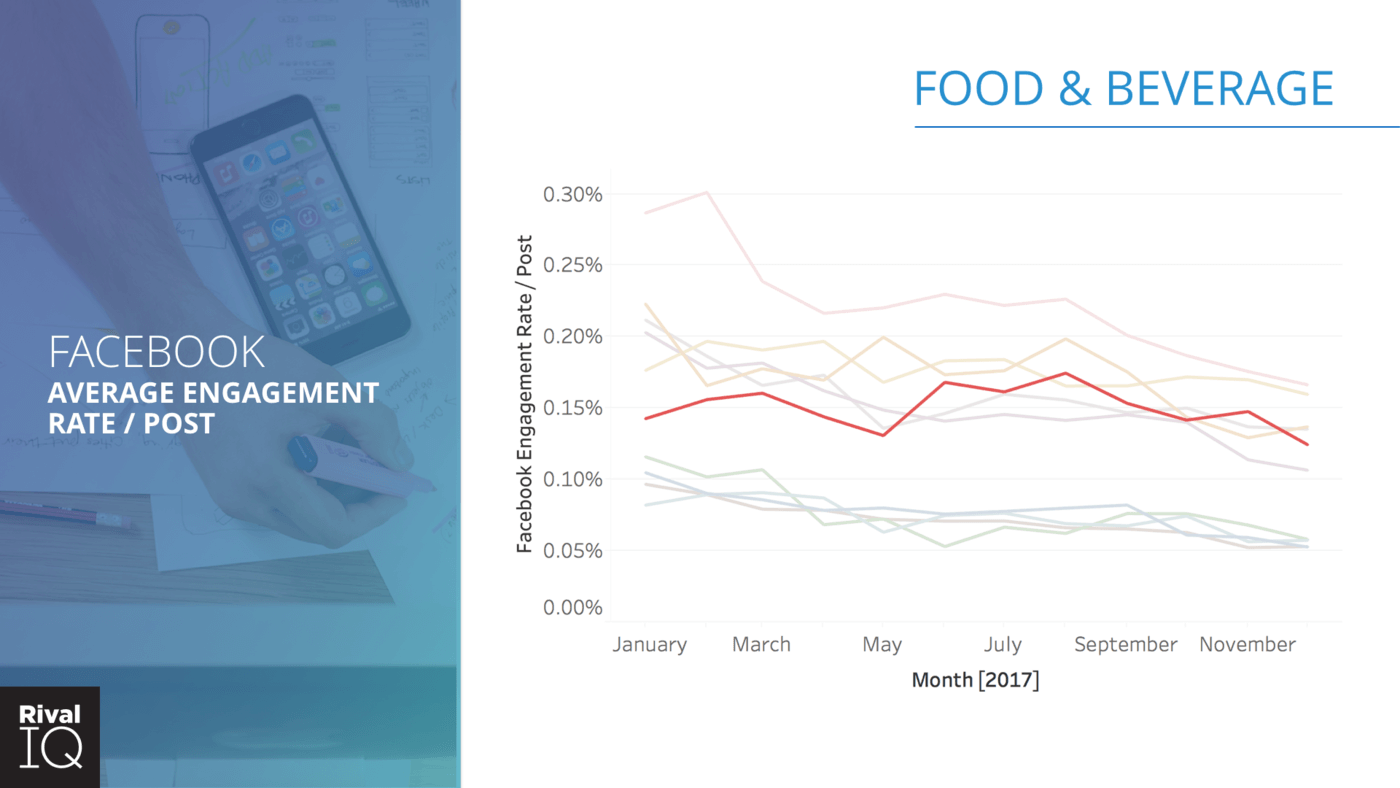
Average engagement rate per post for 10 industries on Facebook for every month in 2017. Red line: Food & Beverage
In the graph above, we’ve broken out the month-by-month engagement data by industry. For each, you’ll note a general downward trend throughout the year. Looking at Food & Beverage, we see the performance was generally flat for the year, with a slight dip in May and a downward trend after peaking in August.
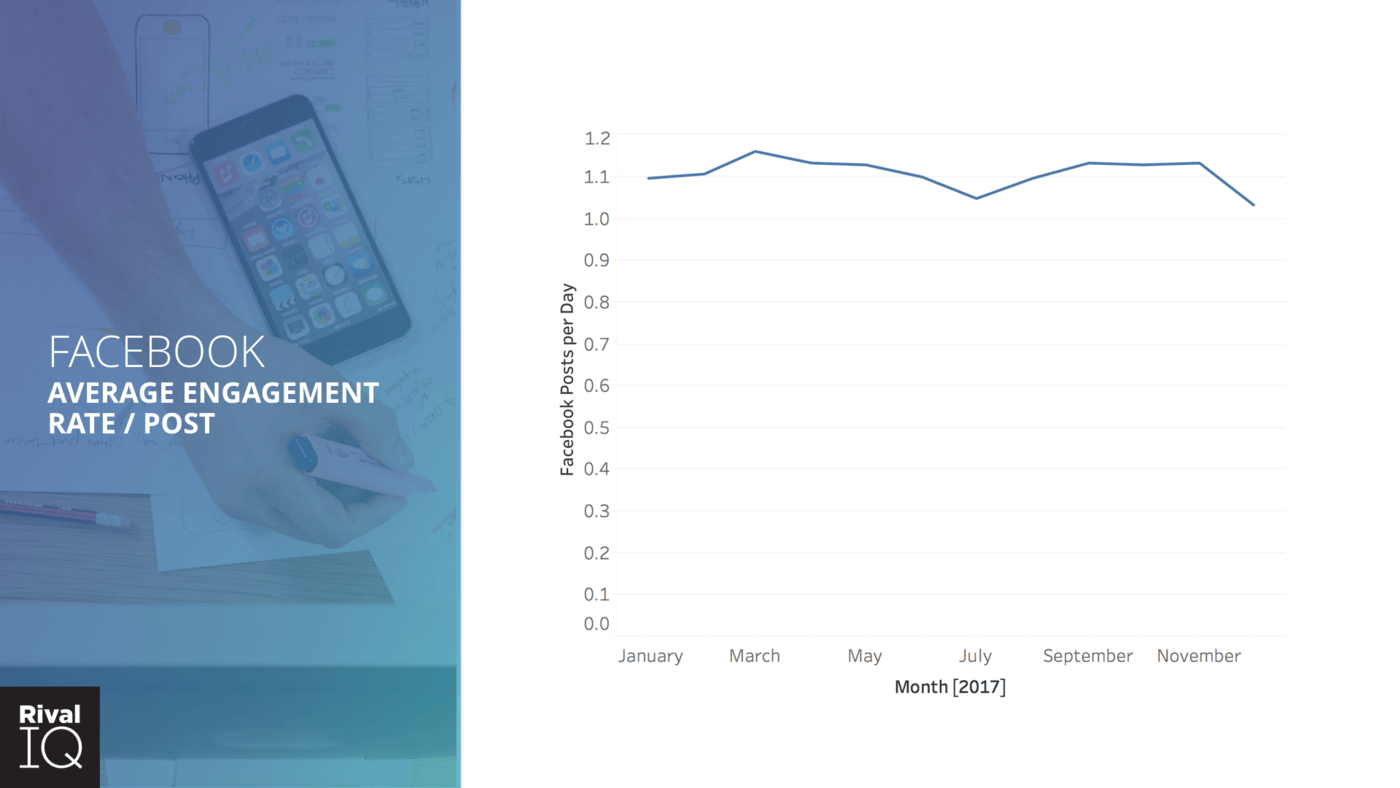
Average company post per day on Facebook, by month
One question we always have when examining engagement data is: how did posting volumes change throughout the year.
In the graph above showing the average Facebook posts per day across all companies in our study, we see that the numbers didn’t shift much, remaining at 1.1 for the majority of the year. In December, we see a slight decrease in posting as well as a small dip in the middle of the year.
So, is everyone experiencing declining engagement? No.
Are most brands experiencing declining engagement? Yes, absolutely.
Hi-Chew masters Facebook engagement
Let’s look at an example of a brand that grew their Facebook engagement last year, Hi-Chew. (If you’re not familiar, this is an addictively, delicious, chewy candy that comes in a variety of flavors.)
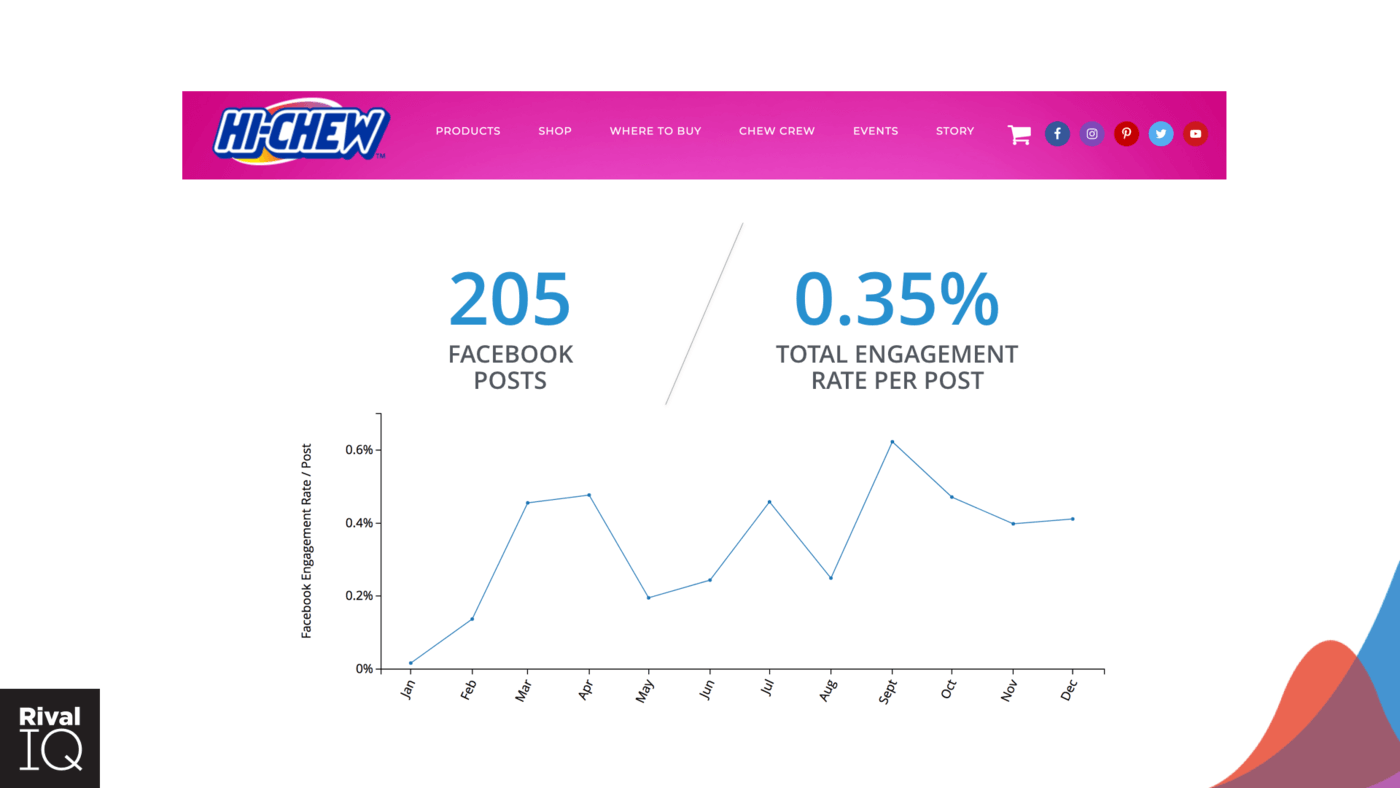
Hi-Chew averaged 0.35% engagement rate over their 205 Facebook posts in 2017
In 2017, Hi-Chew posted 205 times on Facebook (less than once per day) with an average of 0.35% engagement rate per post. As a reminder, the Food & Beverage industry averaged 0.24% engagement rate per post, and the overall average was 0.16%.
As the year progressed we can see their engagement improved. So, how did Hi-Chew get such high engagement rates?
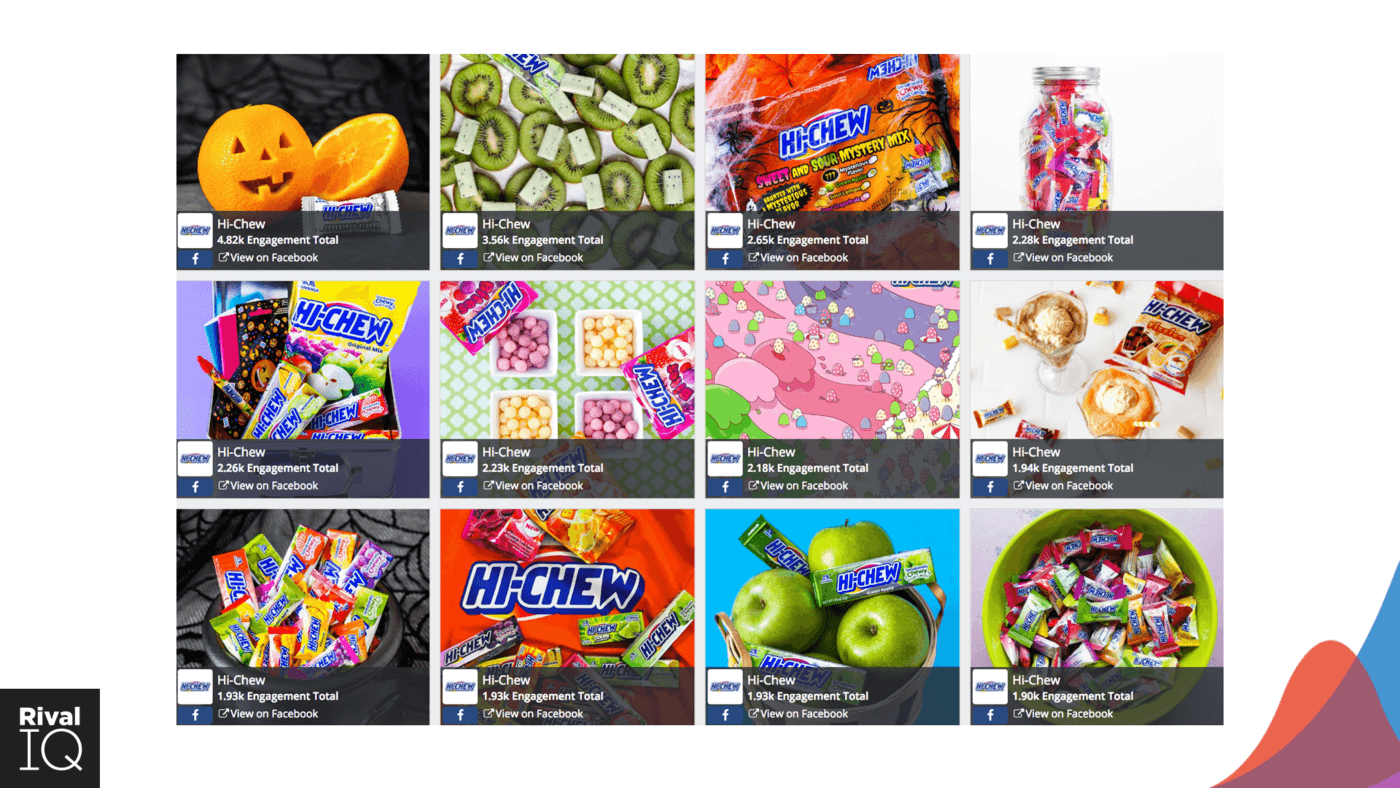
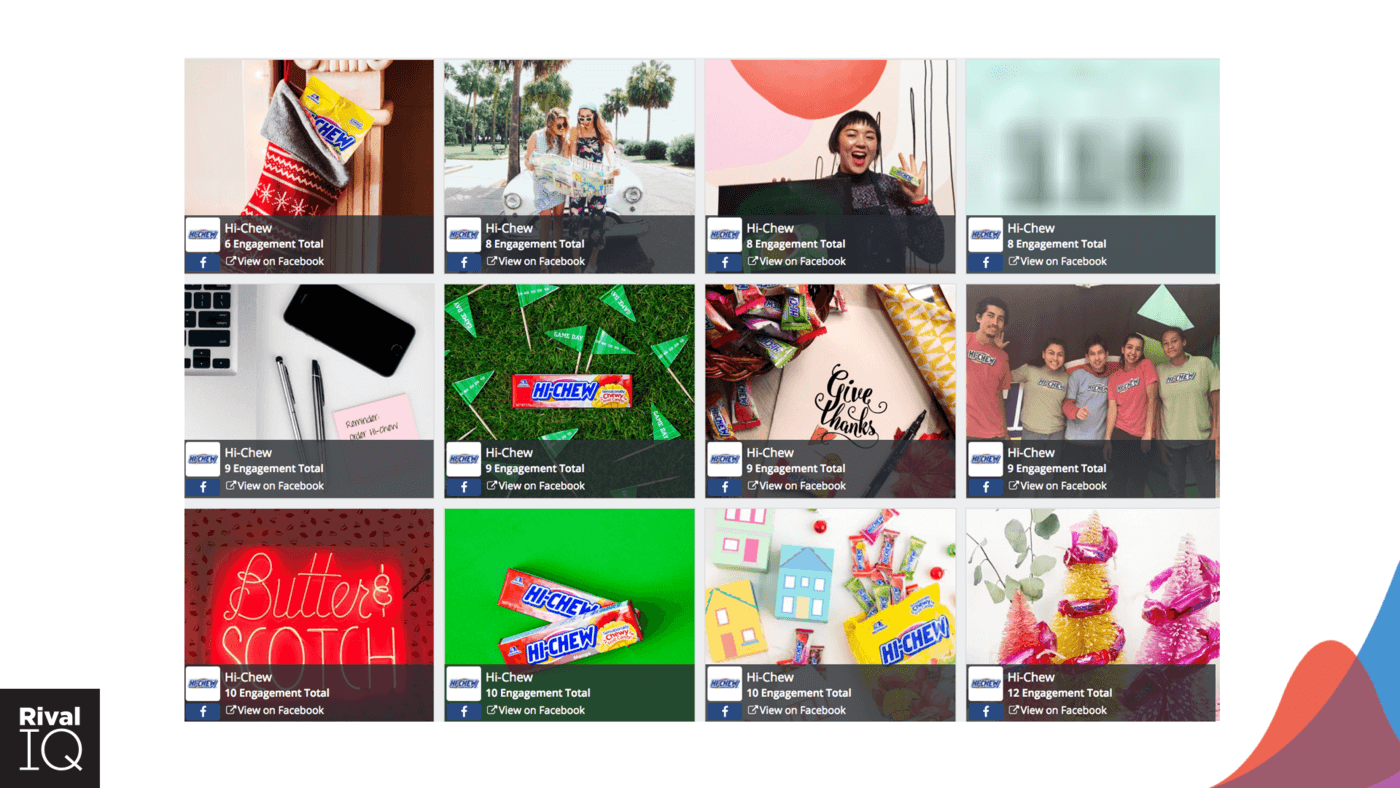
These 12 Facebook posts received the highest engagement for Hi-Chew in 2017
Reviewing their top Facebook posts by engagement, it’s easy to see a consistent coloring and visual presentation. And, it’s consistent with their packaging and the actual candy. Aside from the first two posts, which are out of place comparatively and likely boosted, the remaining posts feature tightly-cropped shots of their product.
These 12 Facebook posts received the lowest engagement for Hi-Chew in 2017
To give us some perspective, let’s flip our analysis around to look at Hi-Chew’s least-engaging content, and the difference is stark. It’s almost as if these are two different brands (or different social media managers ??). This collection of posts include people, have minimal product placement, and even include a few lower quality images.
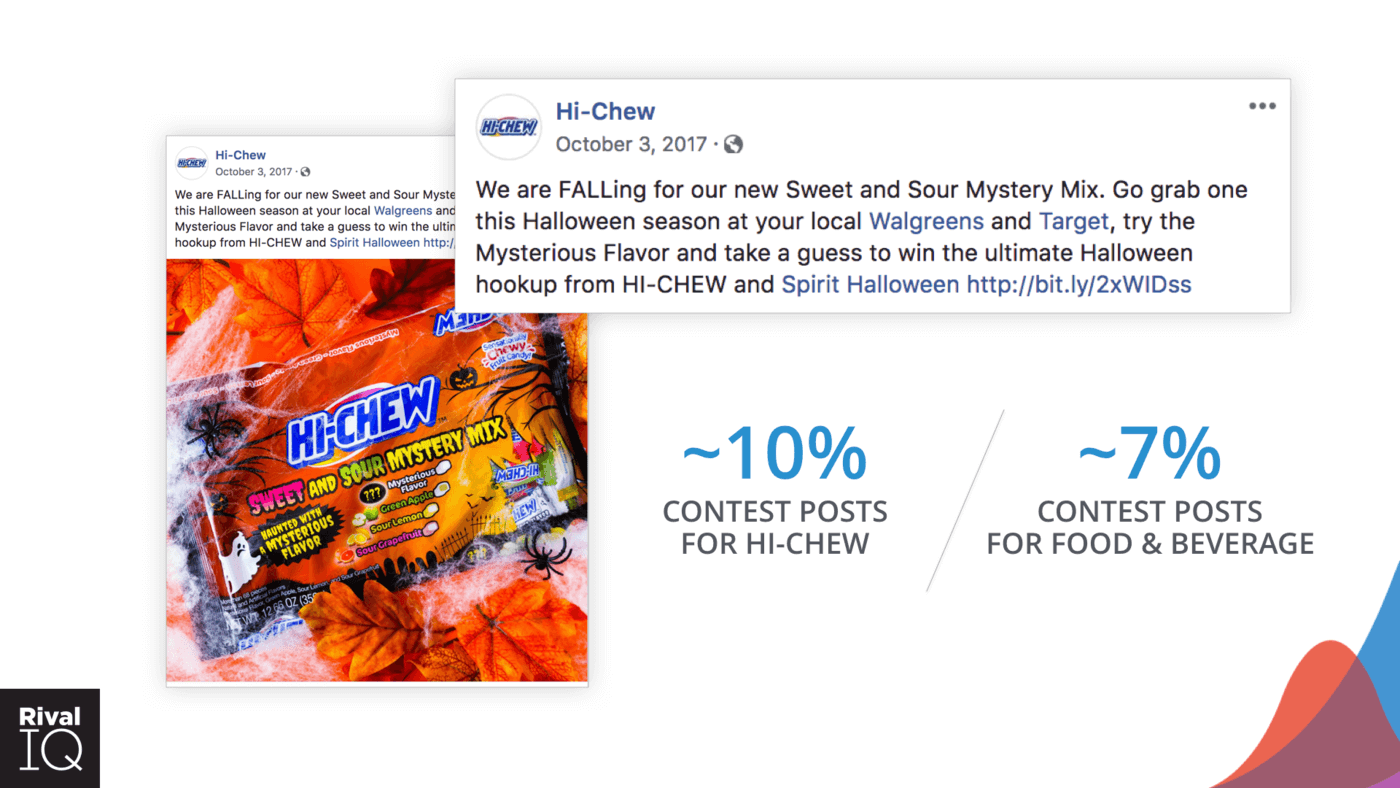
This example Facebook post received the 3rd highest engagement rate for Hi-Chew with over 2.65k engagements.
In the top performing post shown above, Hi-Chew highlights a new product, their Sweet and Sour Mystery Mix. And, it’s also promoting a contest, which we all know can dramatically improve engagement (though not necessarily other important metrics ?).
But, Hi-Chew isn’t simply relying on contest posts to drive their Facebook engagement. In fact, only 10% of Hi-Chew’s 205 Facebook posts were contests (compared with 7% of posts, on average, for Food & Beverage companies). For Hi-Chew, of their top dozen posts, only 3 were contests. The rest of their posts are fun and light-hearted with a product focus.
Many of these light-hearted product-focused posts are user-generated content (UGC), including many that Hi-Chew sourced from Instagram. Their UGC is consistent with their original content, focusing on brightly colored tight product shots like the example below.
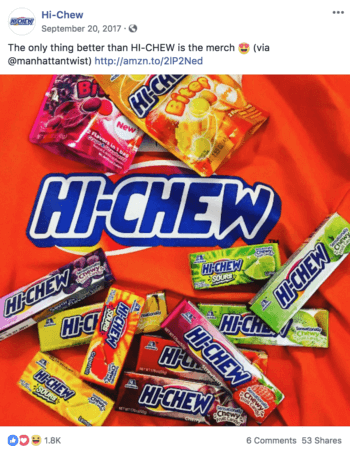
UGC drives some top-performing content for Hi-Chew
Ultimately, we see that Hi-Chew is successful on Facebook for several reasons. They drive engagement with consistently bright product-focused content—sharing photos from users and occasionally running contests.
Learning from Hi-Chew, keep these points in mind:
- Consistent brand look and feel matters
- Your audience follows you for a reason
- Give your audience a reason to engage
Instagram engagement trended down with end-of-year lift
Navigating and finding success on Instagram isn’t as easy as some would like. While Instagram boasts higher engagement than Facebook or Twitter, there’s stiff competition to get eyeballs and engage your audience. The competitive vibe felt amplified last year as engagement rates trended down throughout the year.
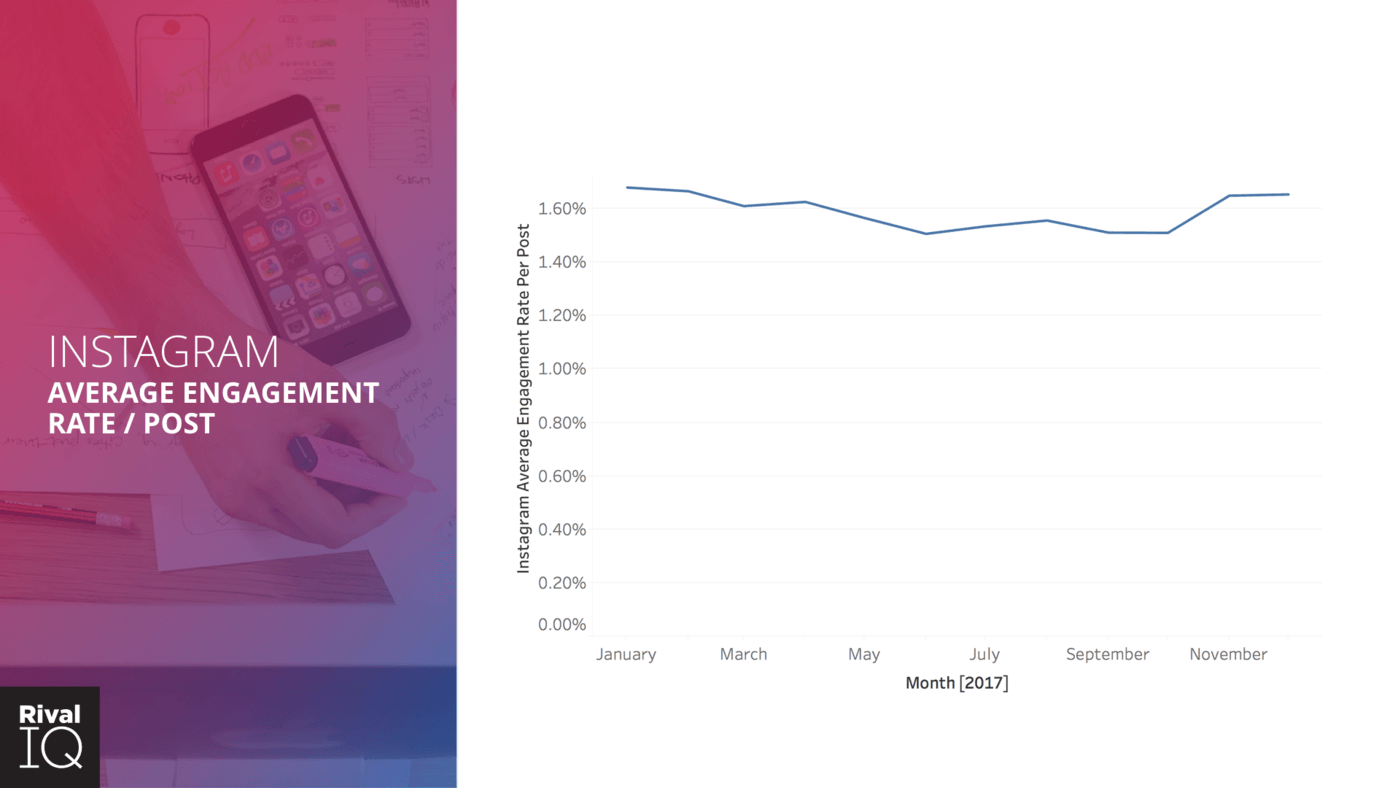
The average engagement rate on Instagram trended down for the majority of 2017.
As you can see in the graph above, most brands experienced this decline during the year and didn’t see any recovery until November.
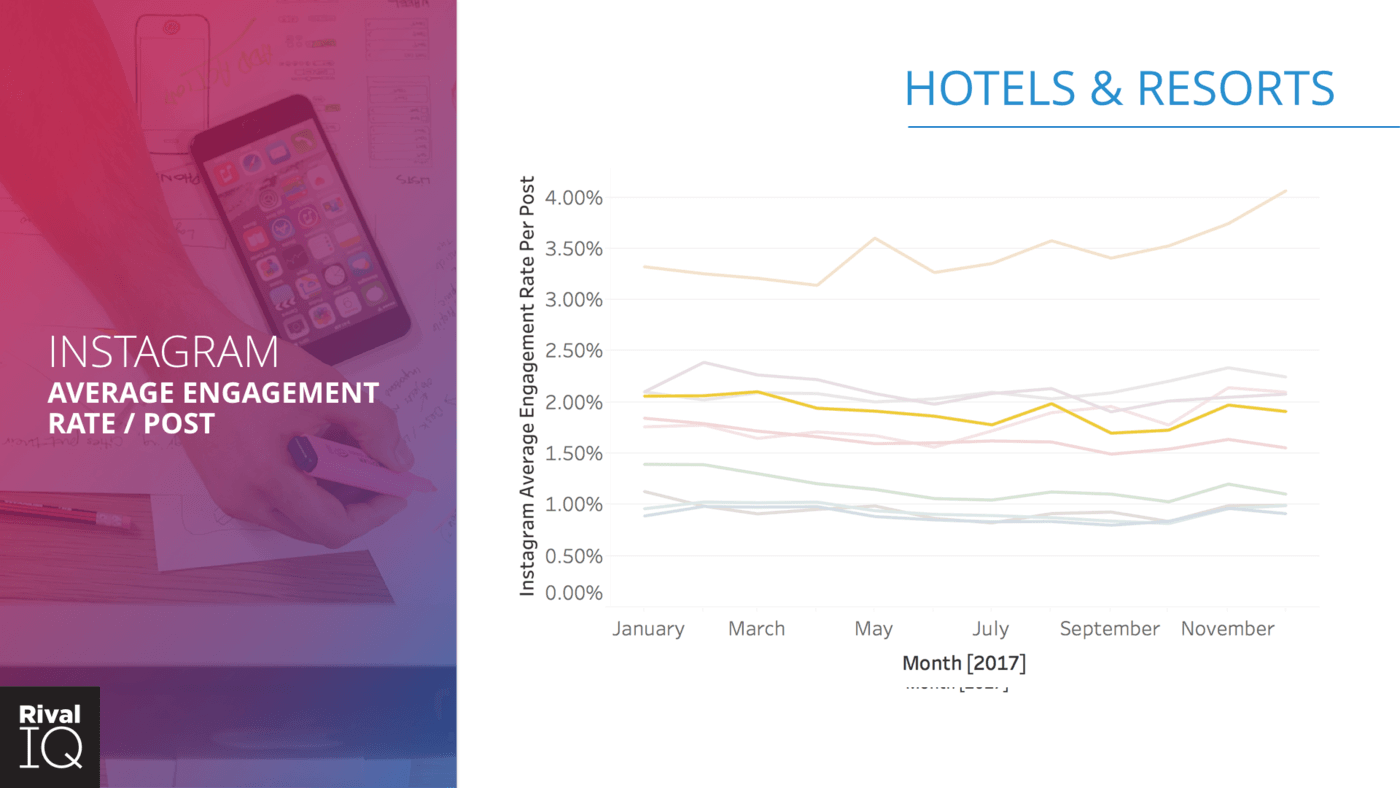
Most industries experienced the Instagram-wide downward trend during 2017.
When we broke down the the month-over-month number by industry, we still see the general downward trend with few exceptions. But, we also found that almost every industry here saw an engagement bump up in November and then flat through December. Of course, Higher Ed stands at the top, trending upward and ending the year at over 4% average engagement rate. You can read more about Higher Ed dominating social media in our 2018 Higher Ed Engagement Report.
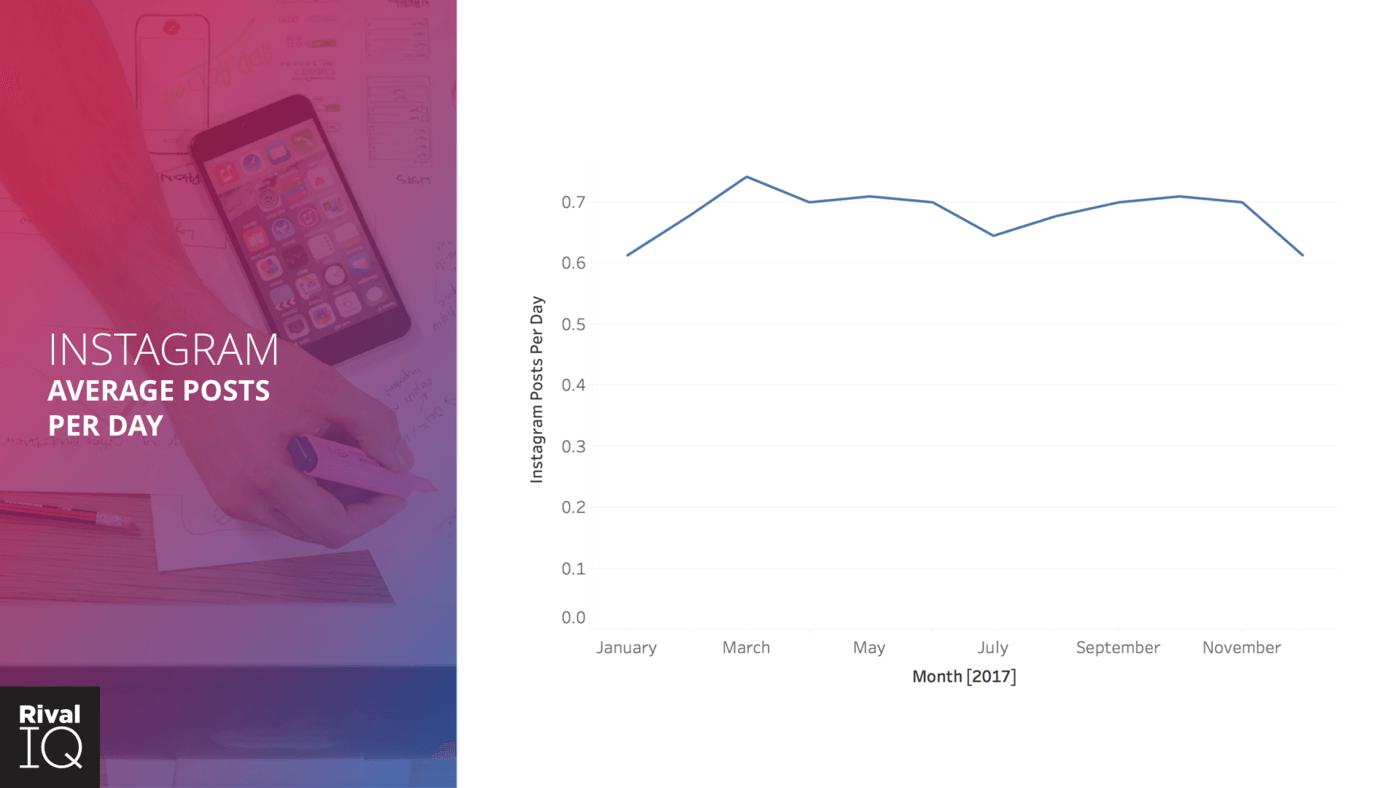
The average posts per day on Instagram only shifted slightly throughout 2017.
From a posting frequency perspective, the average posts per day bounces about the 0.7 per day mark, which translates to 5 times a week. Digging in, it turns out most companies only posted during the week. with many fewer posts on Saturdays and Sundays. That makes makes sense, since scheduling capabilities for Instagram only released January 2018.
Fairmont Chateau Lake Louise dominates Instagram
To understand more about Instagram performance, let’s dive into a strong example from the Hotels & Resorts Industry, Fairmont Chateau Lake Louise. This boutique hotel in the Fairmont family is located in Canada’s Banff National Park. Fairmont Chateau Lake Louise, over 100 years old, is open year-round and boasts over 500 rooms. It’s estimated that up to 15,000 visitors grace its lawn each day in the summer.
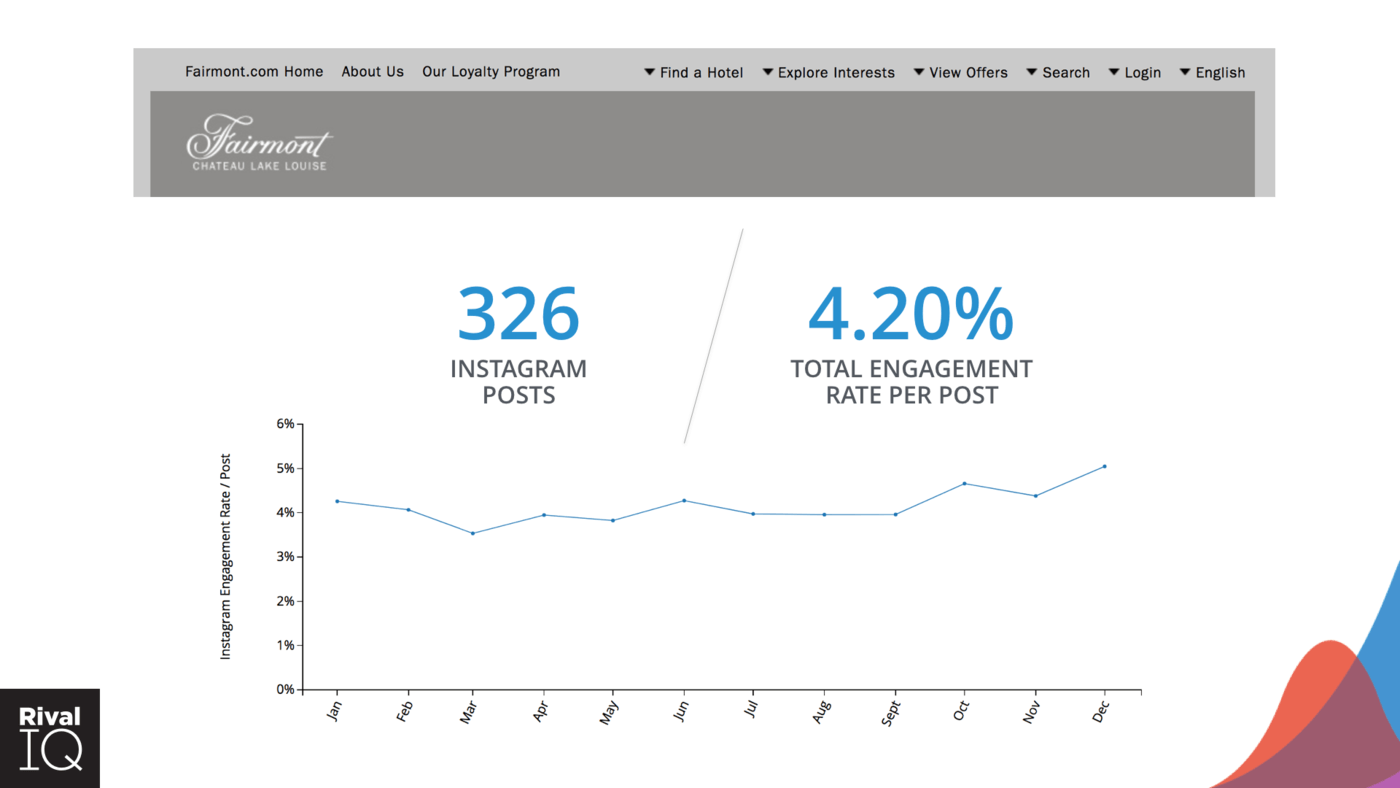
Fairmont Lake Louise had great performance on Instagram in 2017.
Fairmont posted 326 times on Instagram last year—almost once a day. This is slightly more than the overall average, but not excessively so. Their average engagement rate was 4.2%, better than the average College or University, the industry that receives the highest engagement rates on Instagram. Reviewing the engagement throughout the year shows it was mostly flat, with a dip in March, and the October bump. So, how did Fairmont Chateau Lake Louise get such high engagement rates?
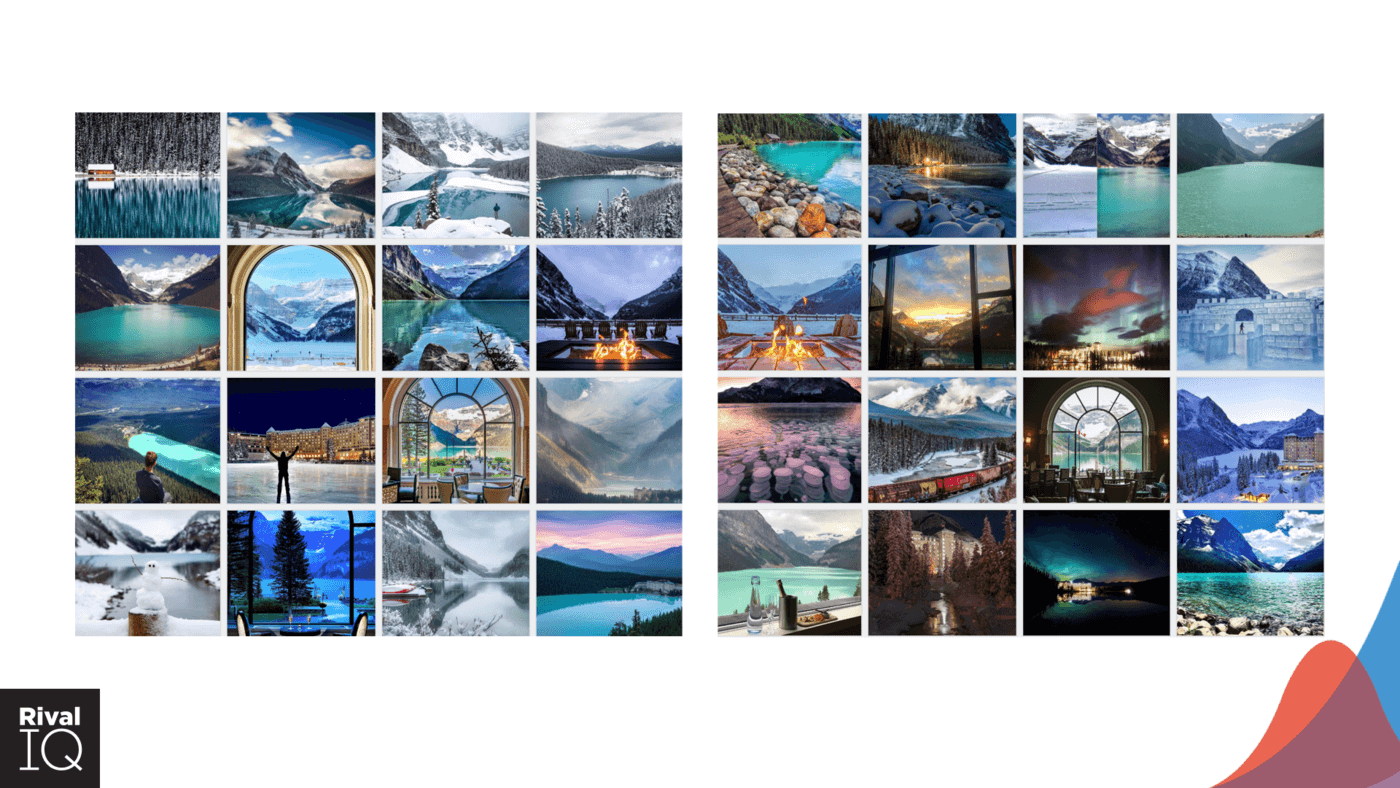
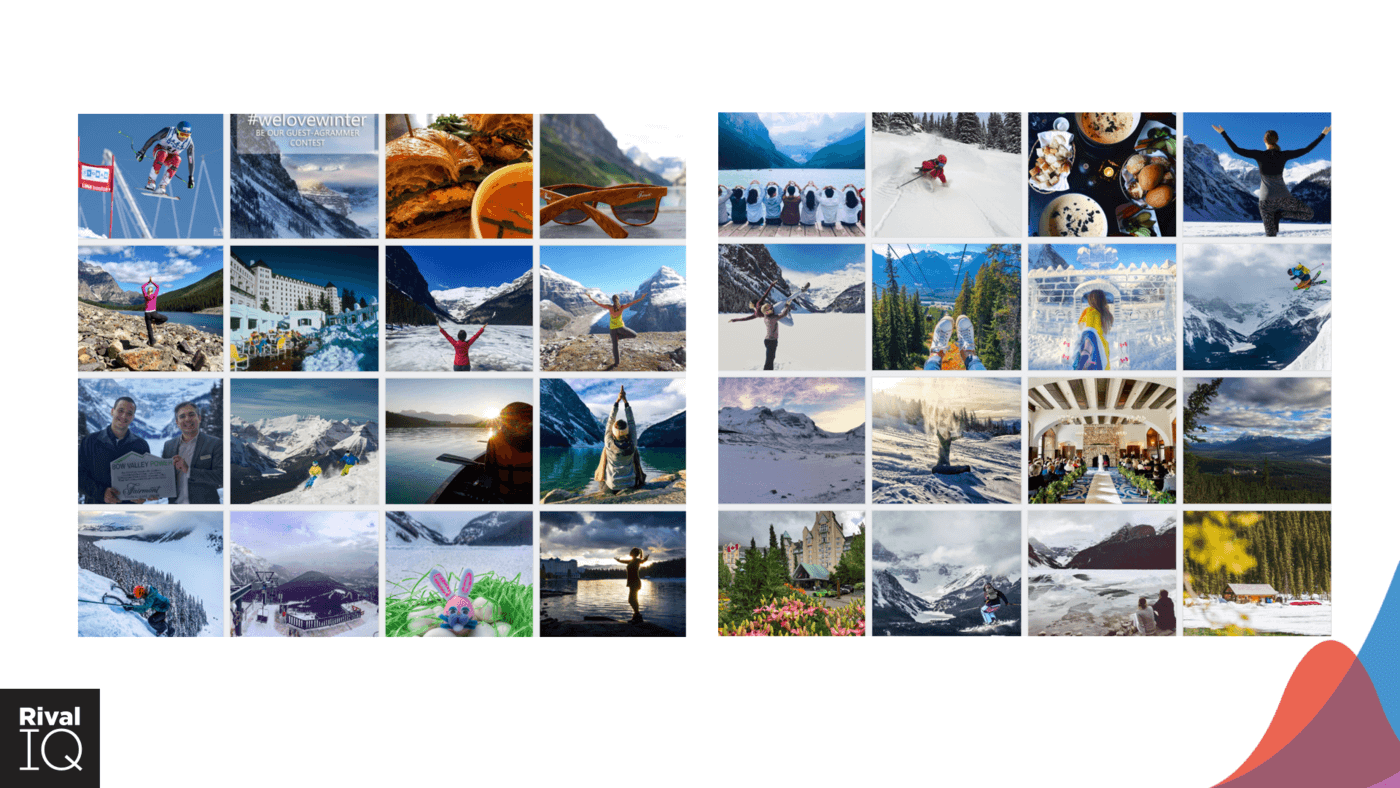
These 32 Instagram posts received the highest engagement for Fairmont Chateau Lake Louise in 2017.
From reviewing their top Instagram posts shown above, they’re certainly taking advantage of the beauty surrounding the chateau. The images are stunning, high-quality shots with consistent colors. Most don’t include people, and there’s a repeated viewpoint looking across the infamous Lake Louise toward the Plain of Six Glaciers. A few are even from within the chateau from “the window” or “that famous window.”
These 32 Instagram posts received the lowest engagement for Fairmont Chateau Lake Louise in 2017.
Contrast those posts with the least engaging posts shown above—it’s a bit of a jumble, right? The first noticeable difference is the number of people and how they are the focal point over the landscape. Even with these posts, the engagement rate is still 1.5%, below the industry average but not abysmal.
This example post below is actually user-generated content (UGC) from DelJay Photography. On the original post, the Fairmont Chateau Lake Louise commented “Incredible! ? We’d love to repost with credit!,” and the author responded with “I’d be delighted for you to repost.” Turns out this is a composed shot, the author explains in the original post, “I must admit that this is a sky replacement as it wasn’t dark enough to capture the stars.” But it still looks amazing. When Fairmont reposted it, you’ll notice they included the camera emoji ? giving photo credit to DelJay Photography.
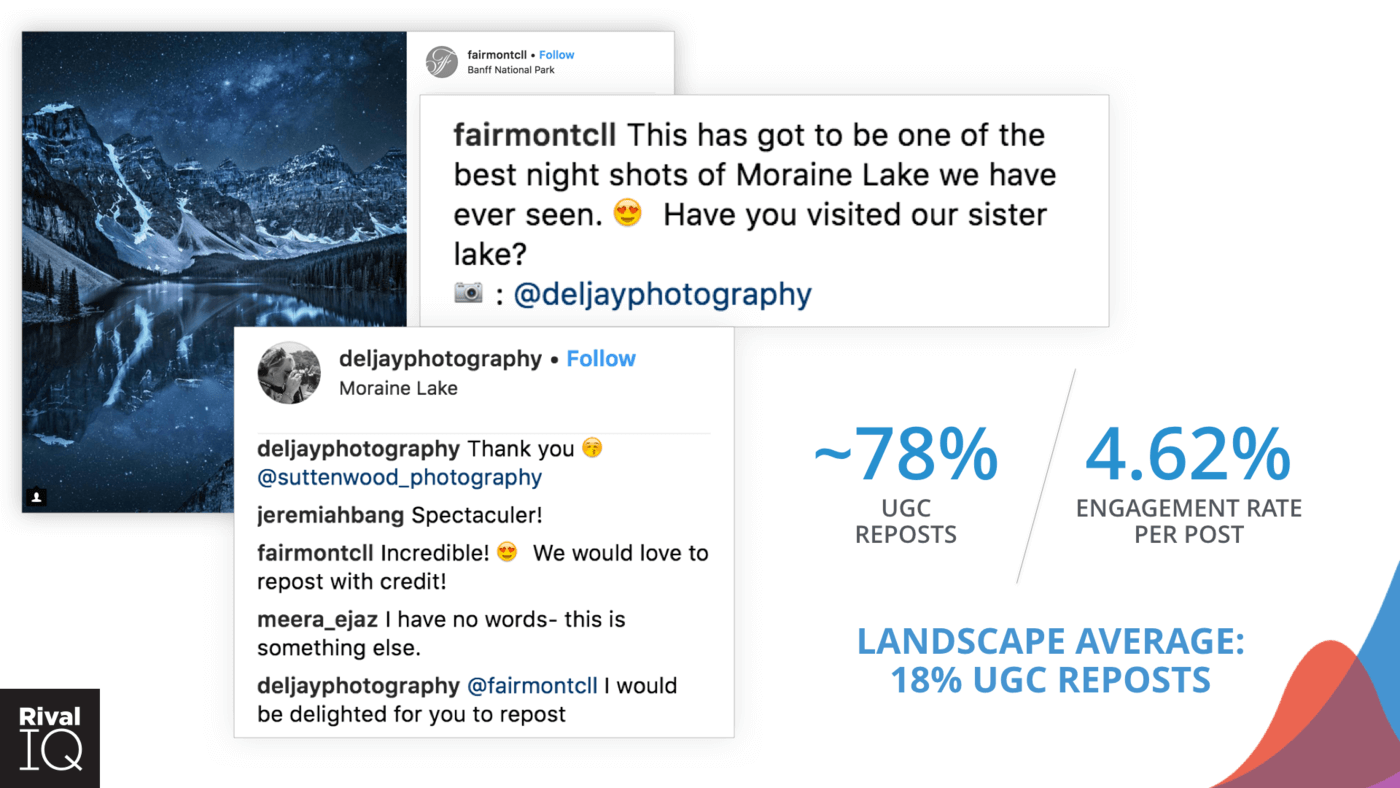
This example Instagram post received over 5k engagements for Fairmont Chateau Lake Louise.
It turns out reposting is common for the Fairmont Chateau Lake Louise as 78% of their posts last year were UGC . This is drastically different from the industry, which had an overall average of only 18% UGC. Fairmont Chateau Lake Louise’s UGC posts averaged a 4.6% engagement rate, just slightly higher than their overall engagement rate of 4.2%. They benefit from the strong travel vibe in Alberta with hashtags like #ExploreAlberta and #TravelAlberta that help drive not only engagement but provide a steady stream of potential UGC for Fairmont.
Ultimately, we see that Fairmont Chateau Lake Louise is successful on Instagram for several reasons. They drive engagement with user-generated content—sharing photos with stunning landscapes, dramatic views, and iconic experiences.
Learning from the Fairmont Chateau Lake Louise, keep these points in mind:
- Post regularly and frequently
- Capitalize on iconic images
- User-generated content (UGC) works
Twitter Engagement Constantly Shifting
Twitter gets credit for breaking news, harnessing the power of revolutions, and connecting people on a global scale. But, with over 300 million monthly active users, it can be hard for brands to stand out — which may explain why brands like Wendy’s, Netflix, and Merriam-Webster have chosen to sprinkle the snark (or shade if you prefer) throughout their tweets. When the overall average engagement rate for Twitter is 0.046%, who can blame them?
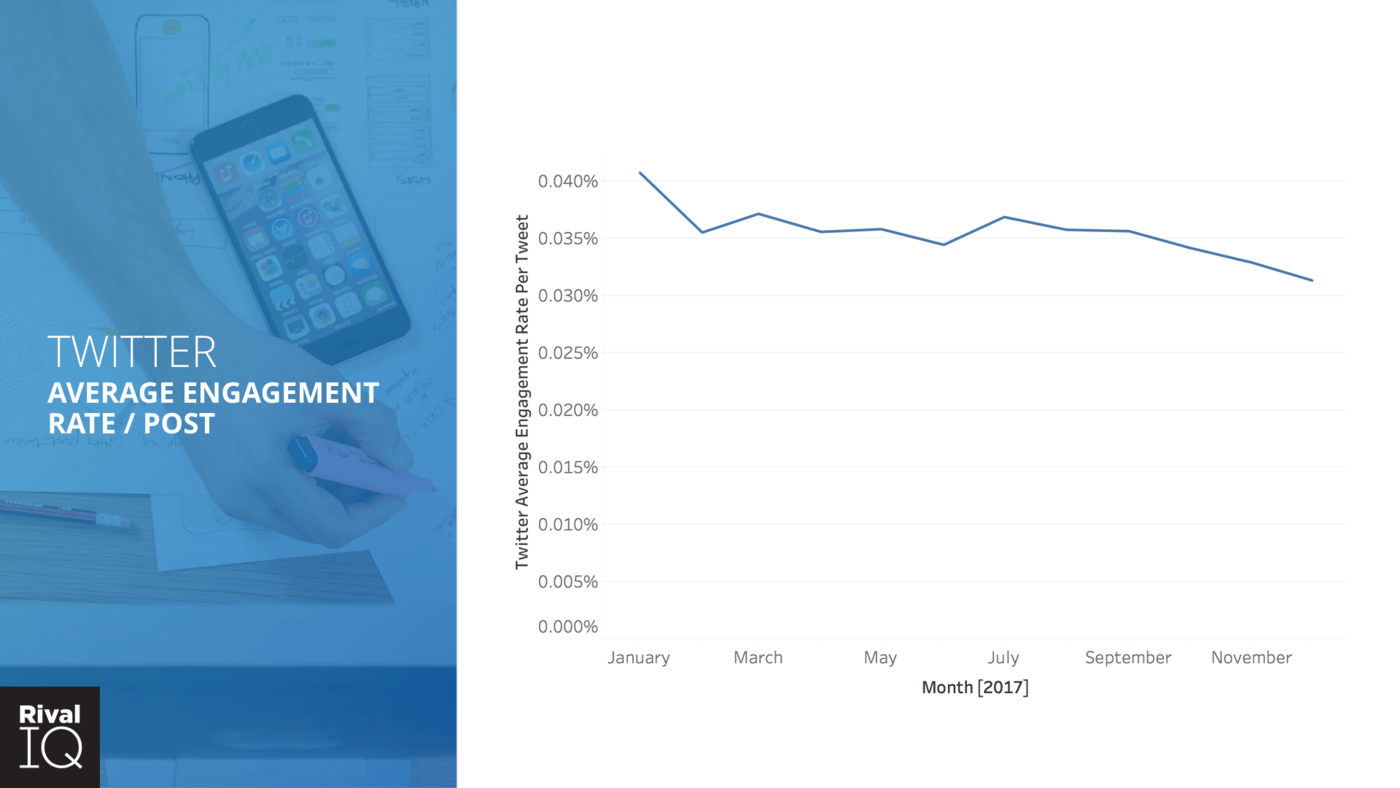
In 2017 the average engagement rate on Twitter trended downward for most months.
As we can see in the above chart, engagement on Twitter appears to trend downward for most of last year.
But when the engagement rates are broken out by industry, the numbers are all over the place (see image below). Not every industry trended down and, unlike Instagram and Facebook, there’s no clear trend at all. The spikes for industries can be attributed to a variety of reasons like current events and trending topics, industry seasonality, and even the weather. Knowing how your industry and your own brand’s engagement shifts throughout the year is helpful in explaining the constant fluctuation. Ups and downs are some of the few certainties on Twitter.
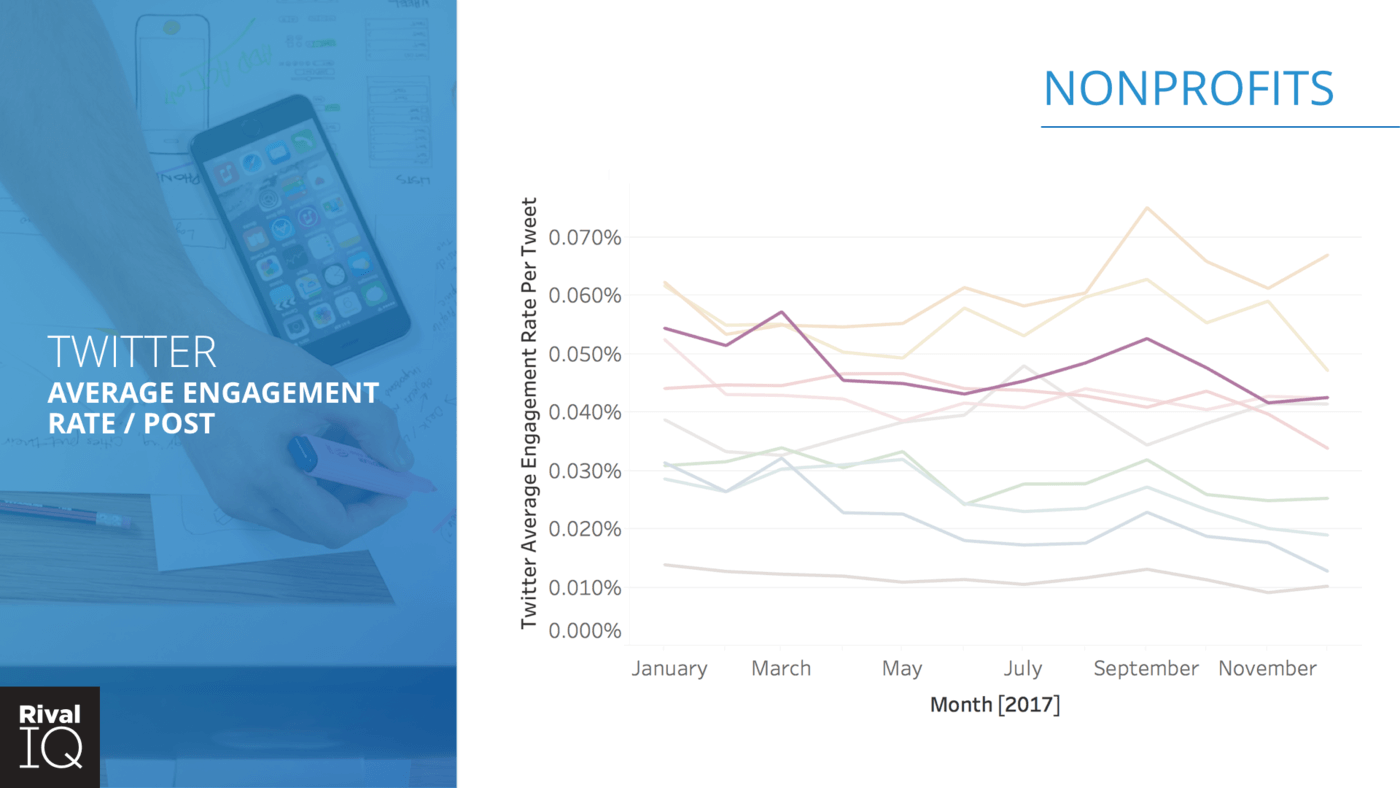
The industry engagement rates constantly shifted on Twitter in 2017.
Looking a bit closer at how nonprofits were performing on Twitter in the chart above, we see the average engagement rates slightly mimic the overall averages with a dip in part of the first quarter, running flat into mid-year. Nonprofits deviate from the average with a slight lift in September, but then back to a downward trend as the year ends.

Average posts per day on Twitter slowly declined as 2017 progressed.
We can see in the chart above that from the first half of the year into the second half, there’s a downward trend in the overall average posts per day. At one point the average posts per a day exceeded 1.3 but fell down to .9 by December. With a bit more sleuthing, we discovered that a clear dip in post volume that happens around Christmas. Considering Twitter is primarily about conversations, there are plenty of potential reasons why this happens. But, my assertion is that even social media managers take time to spend the holidays with their families.
If you’re asking yourself the question, “Is Twitter even worth it anymore?” — you’re not alone. Here’s what I like to remind brands: if you’re able to have a real conversation with the customers that matter to you, the engagement rates aren’t the ONLY metric you need to watch. Twitter is provides an opportunity for one-to-one conversations and personal interactions. Likes and retweets (which help increase engagement) are certainly nice to have, especially if you want to drive awareness with Twitter. But if you want to impact your customer, building trust and a relationship, a low engagement number is to be expected. Is this time-consuming? Yes. Is it nice to go viral? Yes. But unlike your call center, support email, or any private messaging, Twitter conversations are public. A positive interaction with a customer on Twitter has the potential to reach thousands of people. And of course, the best part is you’ve strengthened your customer’s loyalty.
Children’s Healthcare of Atlanta drives 4 times the engagement on Twitter
A great example of how to do Twitter well is Children’s Healthcare of Atlanta, the children’s hospital in the Atlanta metro area. Their Twitter engagement rates don’t look anything like the industry averages — they’re much higher.
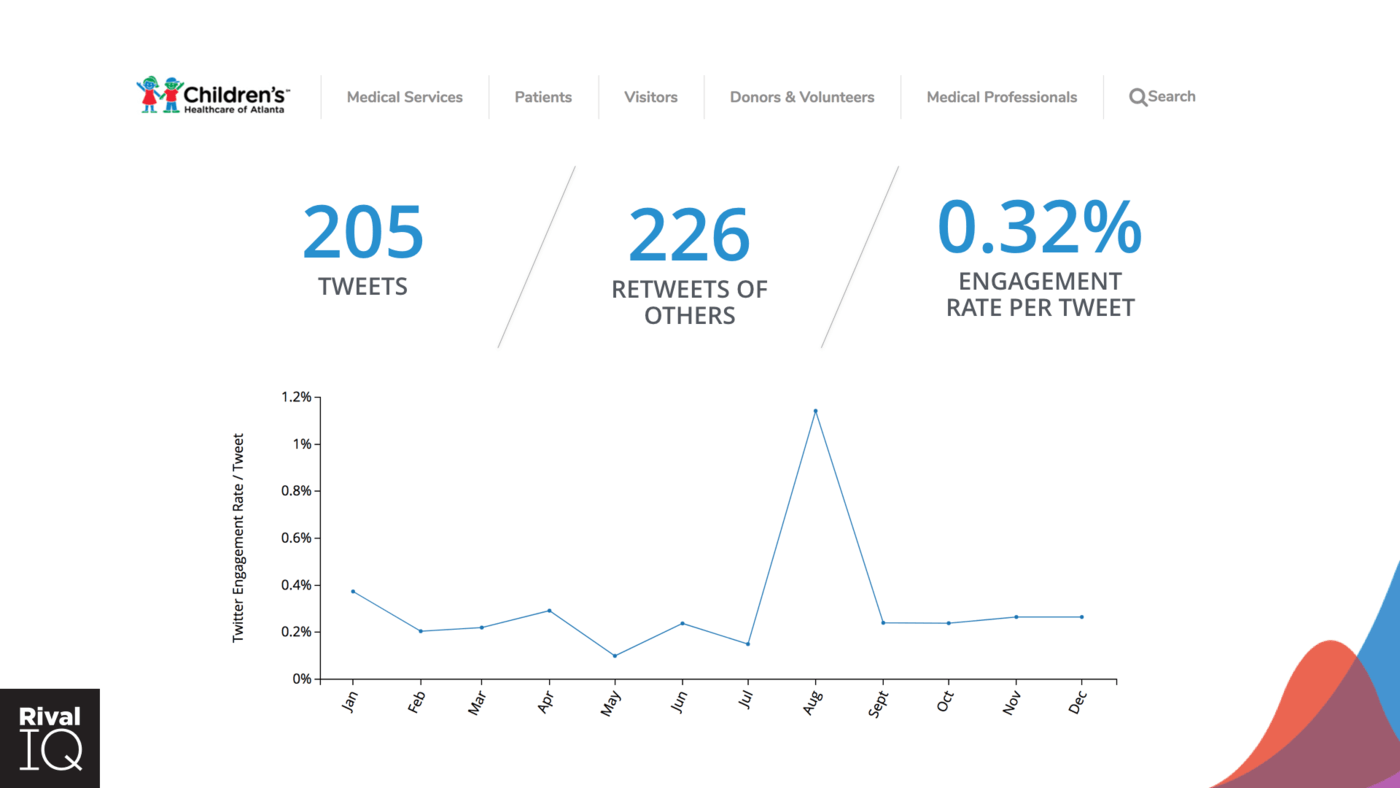
The monthly Children’s Healthcare of Atlanta Twitter engagement rates for 2017 were mostly consistent with a big bump in August. Their 205 tweets averaged a 0.32% engagement rate.
Children’s tweeted 205 times throughout the entire year (fewer than one per day), retweeted 226 tweets, and sent 94 replies. Overall, that’s 525 tweets, retweets, and replies. As the graph above shows, their engagement pattern doesn’t mimic the nonprofits trends throughout the year. Their average engagement rate is 0.32% (astronomically higher than the average of 0.055% for nonprofits) but as the graph shows, Children’s hovered around 0.2% for most of the year with a pop in August. So, how did Children’s get such high engagement rates?
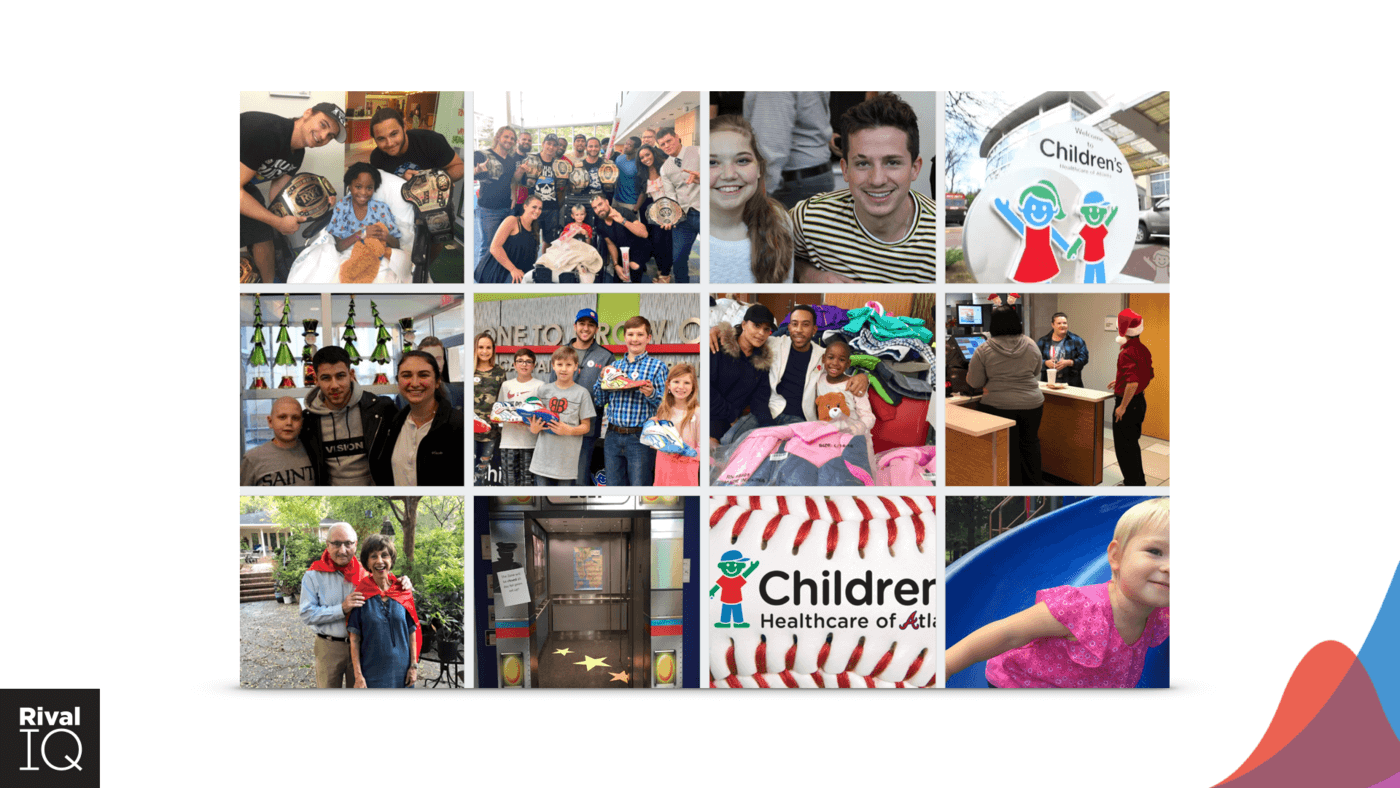
These 12 tweets received the highest engagement for Children’s Healthcare of Atlanta in 2017.
As you can see in Children’s top tweets shown above, most of their top-performing content has a visual element centered around people (many of them famous). These tweets are also not linking out to any off-platform content. Rather, they’re thanking members of the community who give their time and voice to the hospital and its patients.
For the year, their top two tweets included professional wrestlers from Ring of Honor. These tweets caused that August spike (see the graph above), reaching engagement rates of 4%!
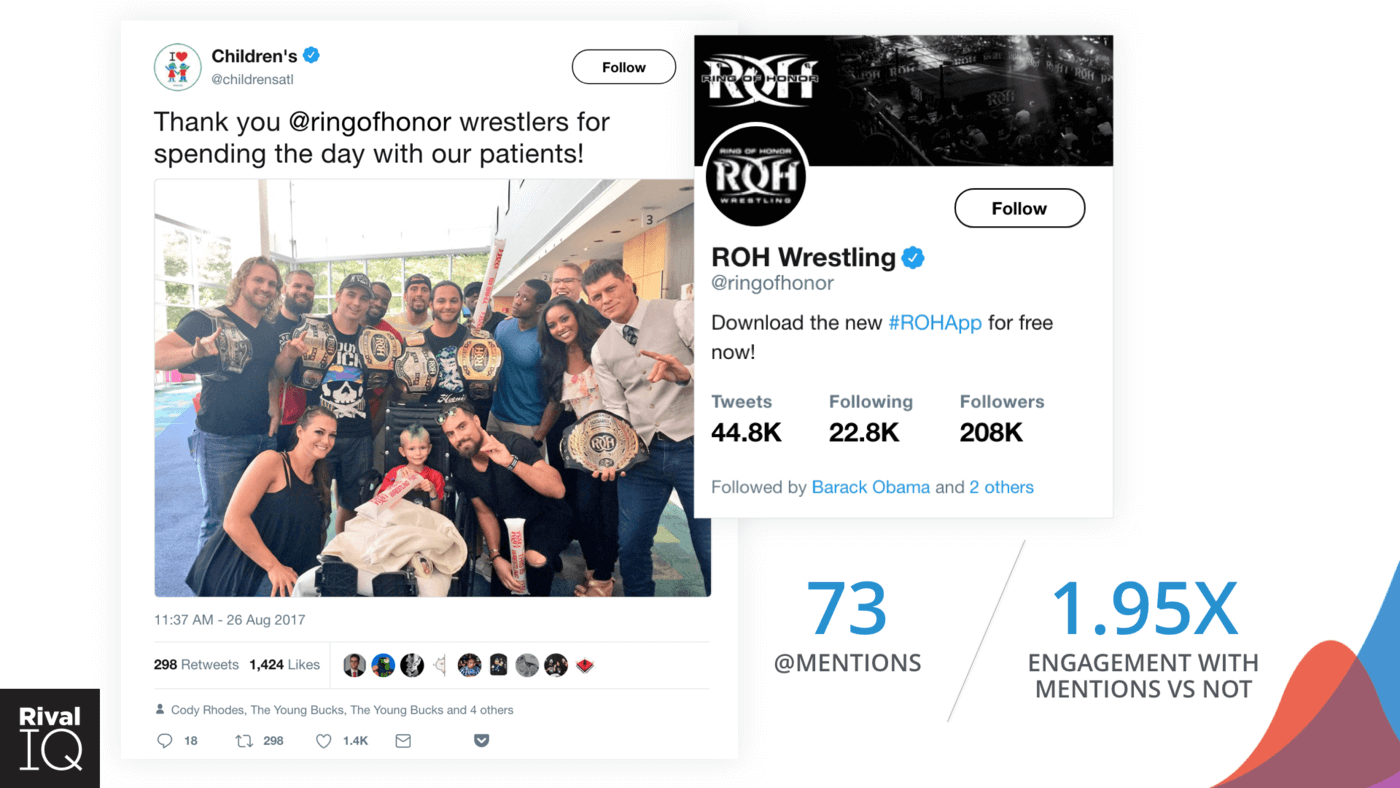
This example tweet received the 2nd highest engagement rate for Children’s with over 1.7k engagements.
The first tweet, shown above, includes a photo of nearly a dozen wrestlers visiting a patient. The tweet mentions Ring of Honor which is followed by over two hundred thousand accounts, apparently including former President Barack Obama ?.
Beyond those top two posts, there’s a recurring theme with Children’s tweets: over 50% of their top performing content included a mention. In fact, out of their 205 tweets throughout the year, 73 include a mention, or 22% of their tweets. This percentage is slightly lower than other nonprofits, which include a mention in 30% of their tweets. Children’s mentioned local and national celebrities, sports teams, and other nonprofit organizations, which helped them double the engagement compared to their tweets without a mention.
Ultimately, we see that Children’s Healthcare of Atlanta is successful on Twitter for several reasons. They drive engagement with relevant, engaging content—mixing photos with mentions of celebrities, using mentions to create conversation and awareness, and only tweeting when they have something to share.
Learning from the Children’s Healthcare of Atlanta, keep these points in mind:
- Conversations matter
- Less can be more
- Mentions widen your audience and drive engagement
To improve social, keep these tips in mind
Know your platforms
Each platform draws a different type of audience, not only in demographics but also in how they engage with content and why they follow a brand. I often repeat, “know your audience,” and it’s for good reason. But, this should be the baseline for marketers. We should already know our customers and what they want. To maximize our audience’s experience, we need to know why they’re on each social platform and what they want from our brand.
Leverage each platform’s unique strength
Each social channel uses different algorithms, prioritizes different post types, and allows you to use unique tactics to engage your audience. Take the time and effort to understand how you can utilize these unique strengths to serve you better.
Always be testing
Every post is an opportunity to test a new idea, hashtag, post type, and more. Keep testing, measuring, and identifying what works (or doesn’t), and improve with each social post.
Each of the brands highlighted here clearly approach their social content with a strategic focus. The best brands on social are intentional, prioritizing high-quality content that speaks to (and therefore engages) their audience. To accomplish this, they’re investing resources into planning and executing their social media strategy. This isn’t a new concept, and I’d hazard to guess you already know this. But, if you’ve found yourself questioning (or being questioned on) the value of social media, these examples can help you. They stand as proof that engaging your audience on each social channel is possible with time, content, data, and above all, strategy.