How do you spot success if you don’t know what success looks like?
There isn’t a week that goes by when we don’t have a brand ask how they compare to their industry. This report gives you the answer. You now have the data you need to benchmark your social performance relative to your industry. We created the Benchmark Industry Report with the intention of giving you the information you need to distinguish social media success for your business.
You’ll find the following inside this 2017 report:
- Cross-industry benchmarks. The most important metrics across the 6 industries we serve most: Media, Higher Education, Non-profits, Food & Beverage, Fashion, and Health & Beauty.
- Industry-specific breakdowns. Each section dives into the specifics that matter across channels and are unique to your industry. From hashtags to post media types, it’s all here.
The Benchmarks
Competitive vs. Industry Benchmarking
What is it and why do it?
Key performance indicators like engagement rate, the number of clicks on a social post, or hashtag engagement rates tells a lot about what is happening as a result of activities. But it says nothing regarding whether the efforts are successful, failing, or where to focus on closing those gaps. Why? Because benchmarks are relative.
Incorporating benchmarks into your social reporting is crucial to outperforming your competitors on social media. You need to look at your competitors and organizations targeting the same audience to establish context. Watching and learning allow you to build a baseline understanding of how they’re performing on social media and what they’re doing to achieve that success.
Sometimes, these benchmarking reports don’t put activities in the best light. Many companies treat competitive reporting as aspirational – comparing against the best in the industry.
In addition to comparing against the biggest players in your industry, understanding how you stack up against the industry as a whole is insightful. Industry benchmarking provides a clear picture across the competitive landscape.
In this report, we focus on the industry benchmarks that give you an accurate representation. Companies included a range of audience size – including some of the best, but also those just gaining traction.
Use this industry report to compare your own brand’s performance. Even if you’re not beating the best on social, how do you compare to your industry as a whole? What are they doing that’s driving their success and can you adopt it?
There are several surprises in the numbers, and many assumptions proven to be incorrect.
The Metrics That Matter
Let’s skip the vanity metrics and get straight to the point.
Chasing followers and page likes won’t even get you to the first date. If you want to turn your social media followers into customers, you need to engage them.
But how do you know if you’re doing a good job? How do you know how you compare? It’s easy to compare against the best, we all know those brands. That comparison often proves worthless. Comparing yourself to only the best and biggest brands is a disservice to the work your team has invested in social media. Let’s look at your industry as a whole.
We compare the following industries:
- Media
- Colleges & Universities
- Non-profits
- Food & Beverage
- Fashion brands
- Health & Beauty
You’ll see how each stacks against each other when it comes to these metrics:
- Engagement Rate
- Posts per day
- Posts per day, combined with engagement
Broken out by social media channels, Facebook, Twitter and Instagram, you can get a true comparison.
In each industry section, we dive in deeper to those stats along with industry-specific metrics like hashtag usage and post type.
Methodology
We used Rival IQ to analyze social media posts across the top three social channels for brands, Facebook, Instagram & Twitter. We gathered data using Rival IQ’s channel-specific rankings, focusing on engagement, social post type, and hashtags.
Engagement is defined as measurable interaction on social media posts, including likes, comments, favorites, retweets, shares, and reactions. Engagement rate is calculated based on all these interactions divided by total follower count.
For this study, we provide a representative sample of companies in each industry. Companies included had active presences on Facebook, Instagram, and Twitter. Companies were selected from our database of over 100K companies, and filtered based on industry. Each company included had to meet the following criteria:
- Facebook Fans between 25K and 1M as of December 2016
- Active on Facebook, Twitter, and Instagram as of January 2016
From those lists, 120 companies were selected at random for each industry. We then used median performance from the set of companies for each industry to compile the data for this report.
Social Media Channel Benchmarks
Instagram Benchmarks
In this section, you’ll find cross-industry Instagram benchmarks for engagement rate per post and posts per day.
Instagram Engagement
Calculated by the average rate per post on Instagram posts per day across industries.
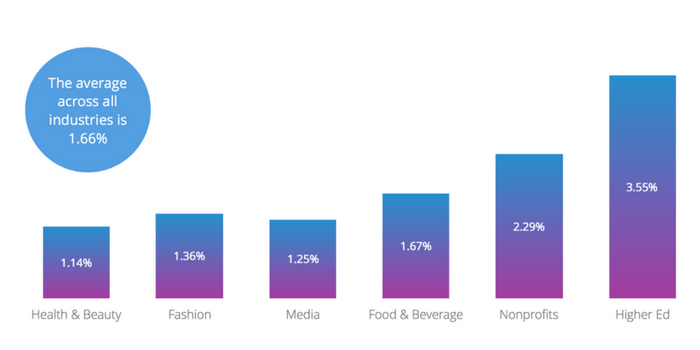
The average engagement rate on Instagram across all industries is 1.66%. Despite popular belief, health and beauty brands aren’t the best at generating a high engagement rate on Instagram. Rather, non-profits and higher ed outperform are the leading industries in this study.
Instagram Posts Per Day
Calculated by the average posts per day on Instagram.
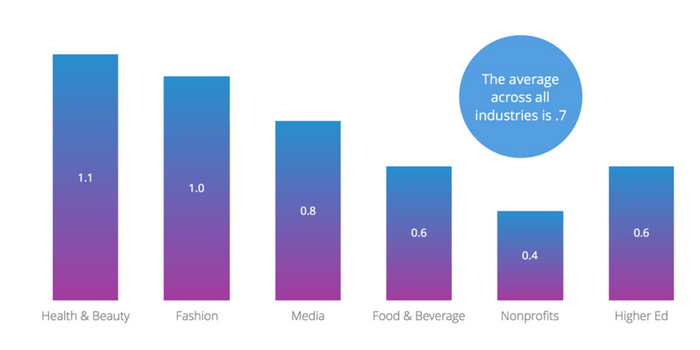
The average number of posts per day on Instagram across all industries is 0.7 posts per day. In other words, about 5 posts per week. These industries post as frequently as once a day to once every three days. Focus on quality photos rather than frequency to dial into your audience.
Instagram Posts vs. Engagement
Instagram posts per day vs. engagement.
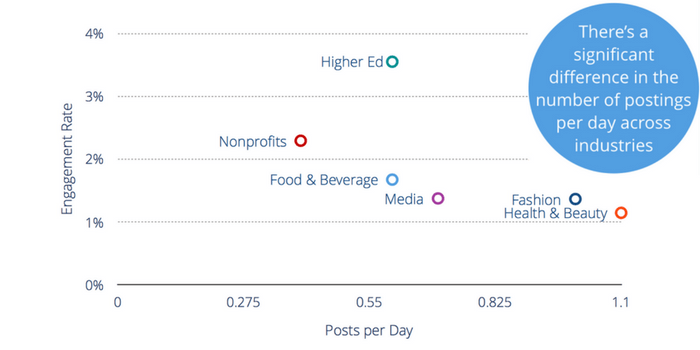
Engagement rate does not correlate with posts per day, meaning increasing your post frequency won’t likely translate into higher engagement for your organization. Increasing the relevancy and quality of your content can help increase engagement rates.
Non-profit organizations and higher education experiencing higher engagement rates may reflect their audience profiles and communication preferences. Because of the nature of non-profit and higher ed businesses, their audiences are typically more passionate and engaged compared to industries like food and beverage.
Measure your Instagram performance against the competition.
Facebook Benchmarks
In this section, you’ll find cross-industry Facebook benchmarks for engagement rate per post and posts per day.
Facebook Engagement
Calculated by the average engagement rate per post on Facebook.
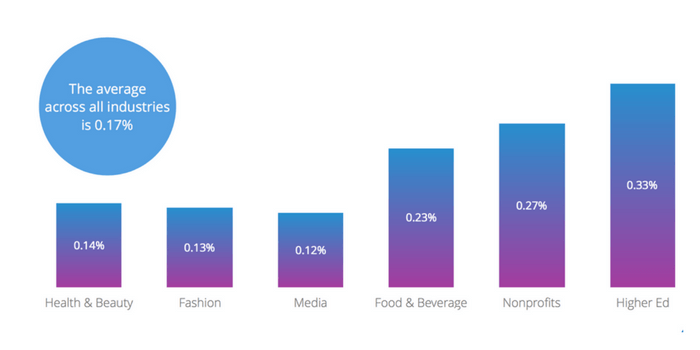
The average engagement rate on Facebook across all industries is 0.17%. While a fraction of the percentage in comparison to Instagram engagement, Facebook remains the top social media channel for brands with a wider audience reach.
Facebook Posts Per Day
Calculated by the average posts per day on Facebook.
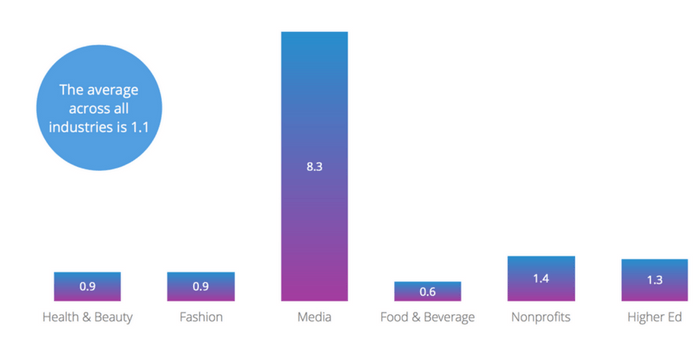
The average number of posts per day on Facebook across all industries is 1.1 posts per day (excluding the media industry outlier). In other words, businesses in these industries post about 8 times per week. The media industry skews this graph significantly. Without the media industry, the average of about one Facebook post a day may reflect the reliance on Facebook algorithms.
Facebook Posts vs. Engagement
Facebook posts per day vs. engagement rate.
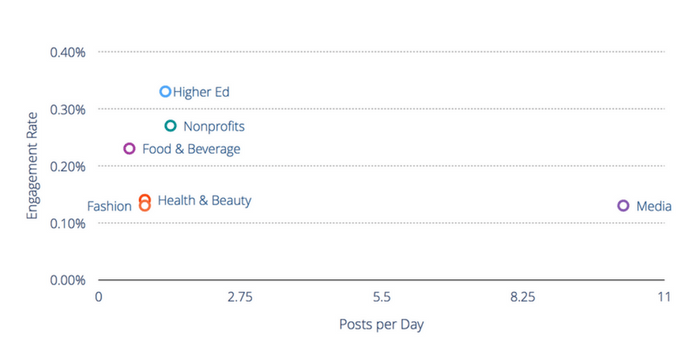
Despite similar investments across most of the industries studied, the engagement varies widely. Higher ed and non-profits may excel here based on the audience’s relationship with the content. Across studies, we’ve found that the more frequently an organization or person posts on social media, the lower their engagement rates tend to be. This correlation seems to be present when observing the media industry.
Twitter Benchmarks
In this section, you’ll find cross-industry Twitter benchmarks for engagement rate per Tweet and Tweets per day.
Twitter Engagement
Calculated by the average engagement rate per post on Twitter.

The average engagement rate on Twitter across all industries is 0.05%. While we don’t agree with the claim, “Twitter is dead”, the engagement is minuscule. Most brands don’t appear to try, treating it as a broadcast channel.
Twitter Posts Per Day
Calculated by the average posts per day on Twitter.
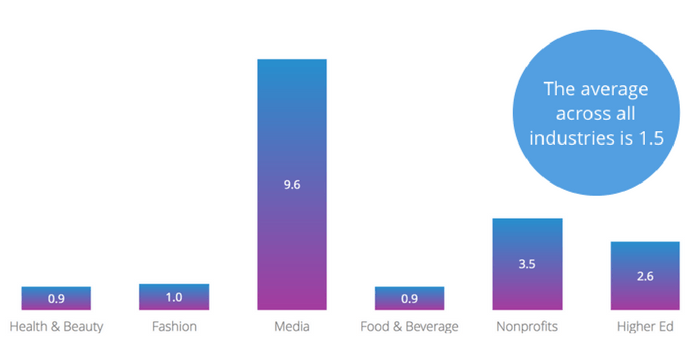
The average number of posts per day on Twitter across all industries is 1.5 posts per day. Brands posting infrequently on Twitter may benefit from the algorithm pushing popular content to the top of user’s feeds.
Twitter Posts vs. Engagement
Twitter posts per day vs. engagement rate.
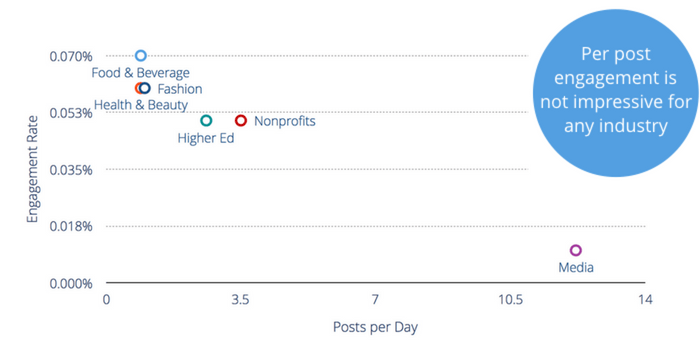
Food and Beverage brand sneak ahead of other industries, focusing on quality and engaging content over frequency (noticing a theme here?).
Industry Snapshot: Media
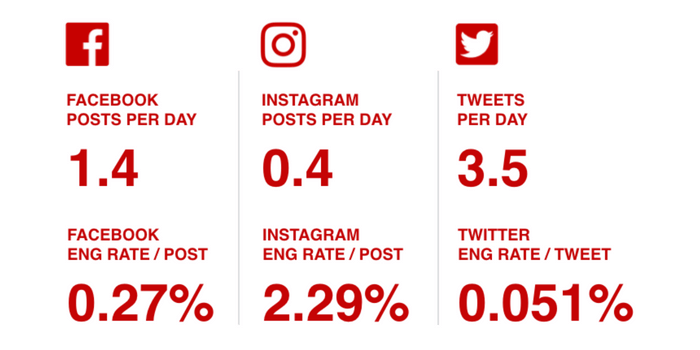
Media companies are missing the mark.
It’s no surprise that media companies have the highest posts per day on Facebook and Twitter. This may explain why media companies have the lowest engagement on those channels as well.
Best Practices for the Media Industry
Based on this study, there are two opportunities that could improve engagement rates for media companies:
- Use more video in posts on both Facebook and Twitter
- Invest in Instagram
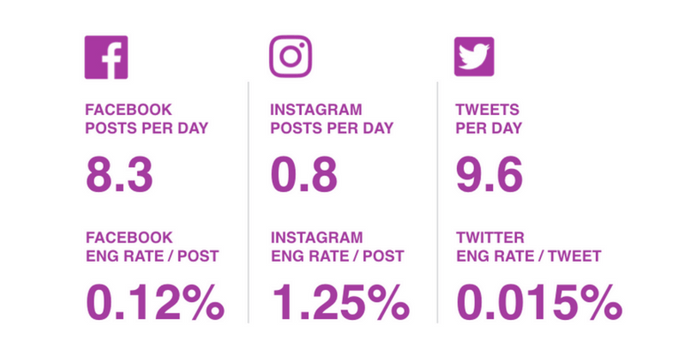
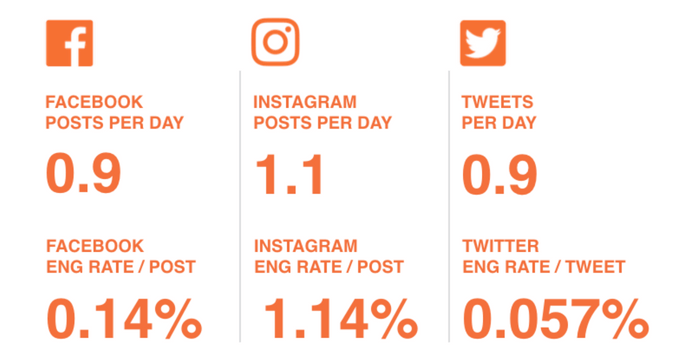
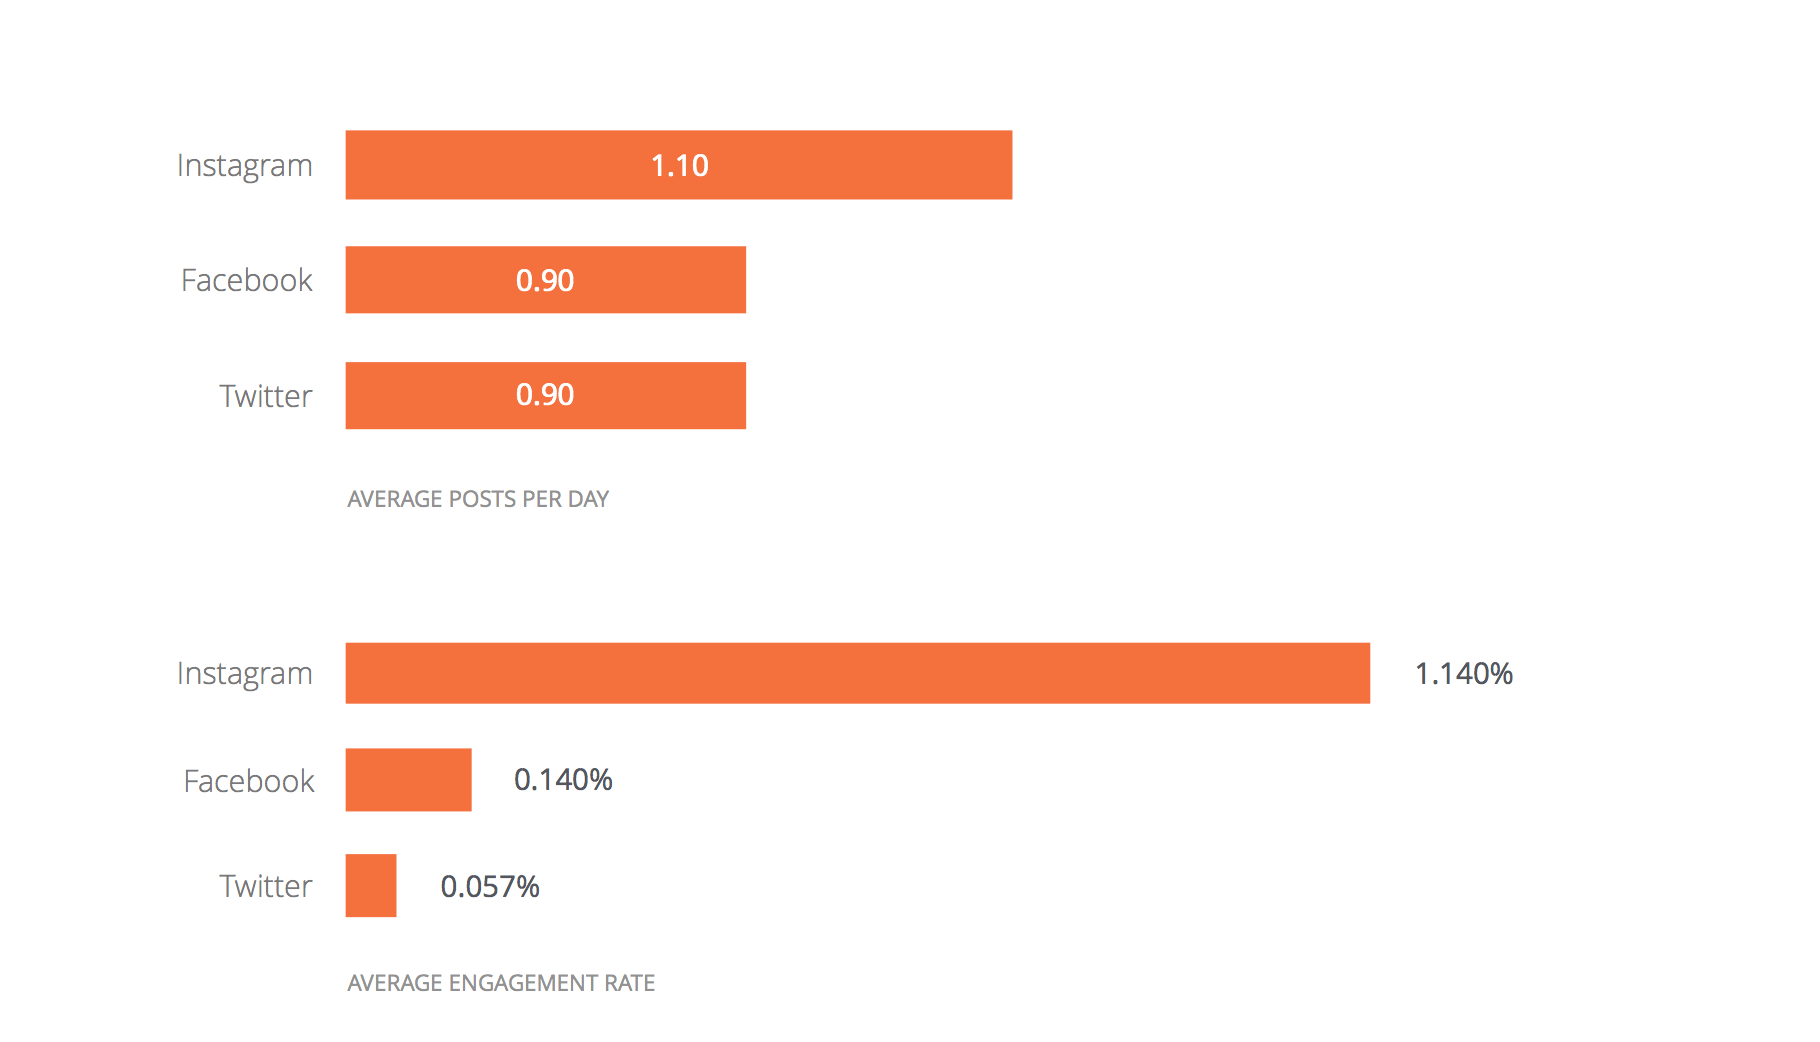
Media Average Engagement Rate & Posts Per Day
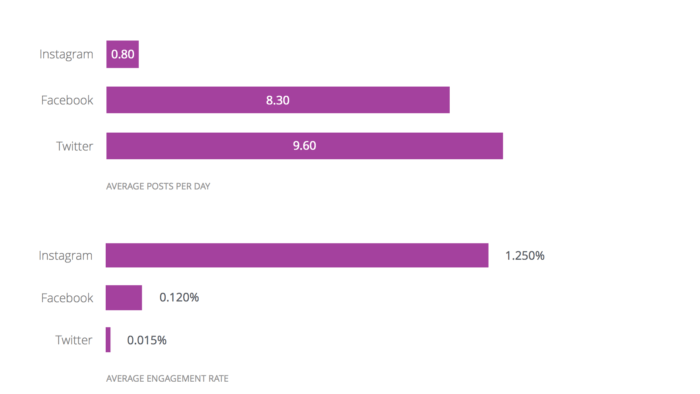
Notice the inverse correlation between average posts per day and average engagement rate. The more frequently media companies post on a channel, the lower engagement rate they experience. The media industry performs best on Facebook considering how frequently they post per day relative to other industries.
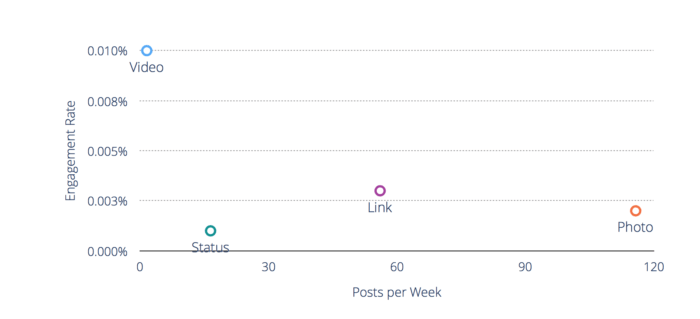
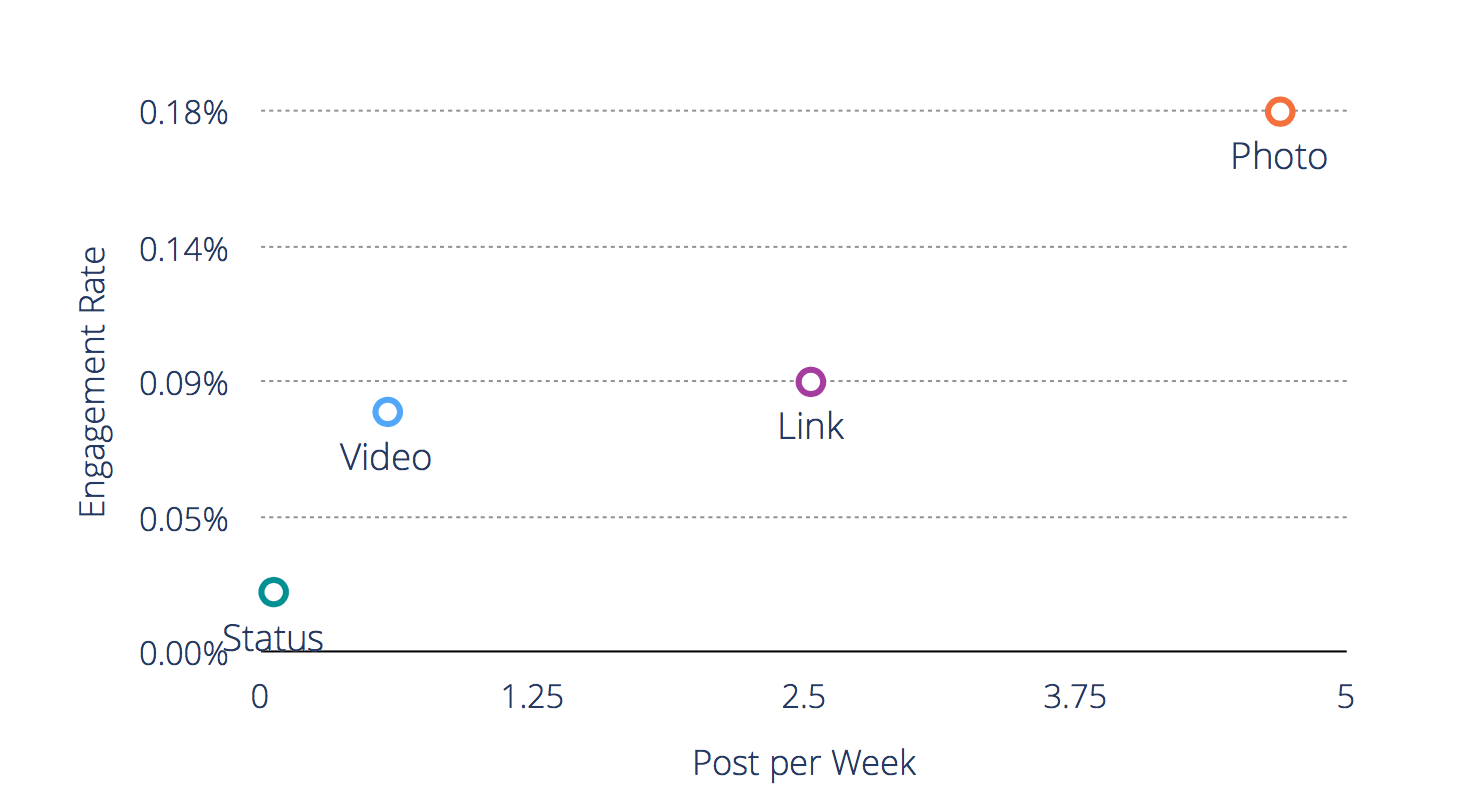
Media: Facebook Engagement
Posts per week, engagement rate, by post type.
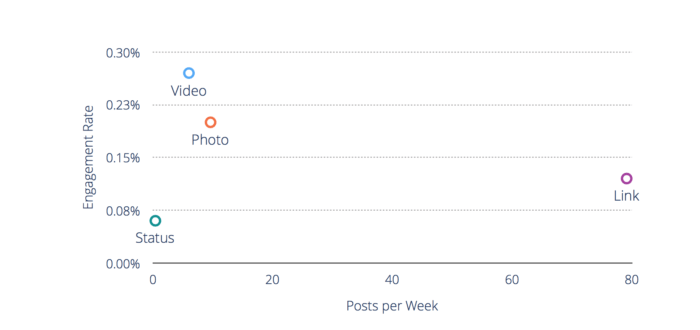
The media industry performs best on Facebook considering how frequently they post per day relative to other industries.
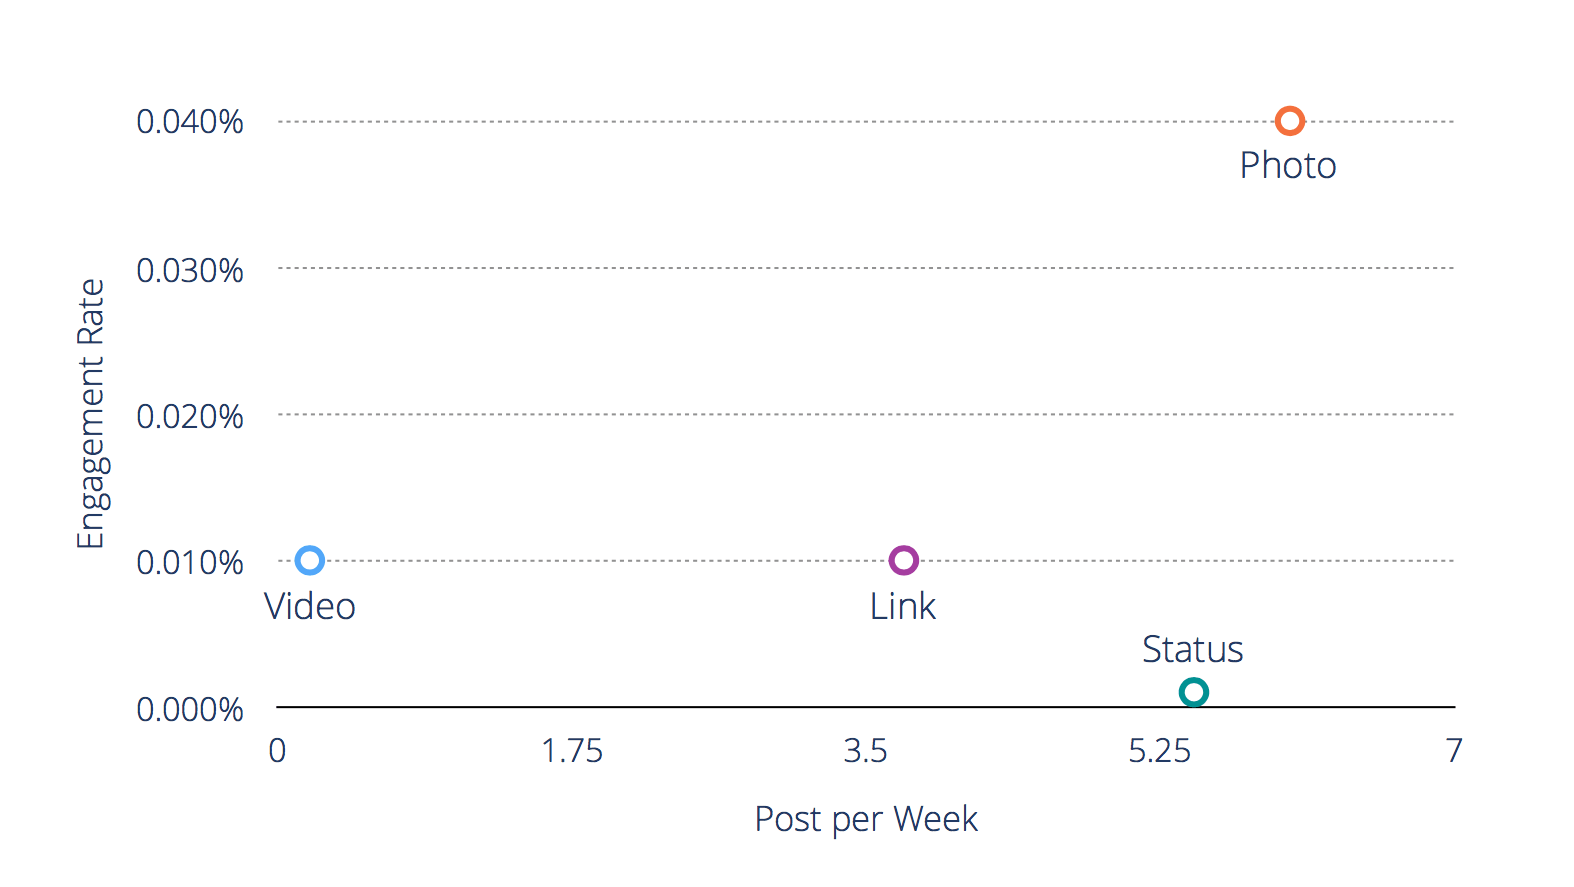
Media: Twitter Engagement
Posts per week, engagement rate, by post type.
With such small engagement rates on Twitter, Media companies should repurpose more of the videos used on Facebook to include Tweets.
Media: Instagram Hashtags
Top Hashtags by engagement rate (used by more than 10 companies in study)
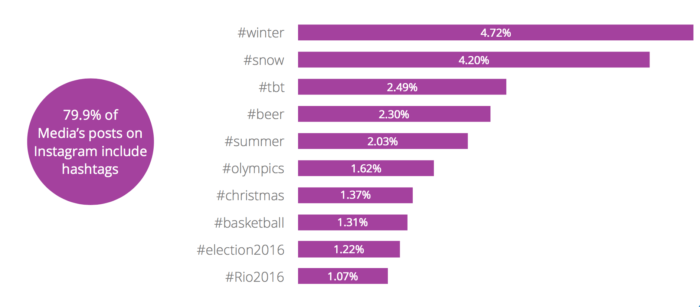
Weather wins on Instagram for media companies. Capitalizing on natural phenomenon may open up possible Instagram audiences (there’s a reason why the Weather Channel is such a hit!).
Industry Snapshot: Non-profits
Non-profits are owning native video.
For non-profits, video content isn’t the only thing that does well – photos do too.
With Instagram’s high engagement rate and the low frequency of posts, it appears non-profits are missing an opportunity to engage an audience that enjoys that content.

Best Practices for the Non-profit Industry
Based on this study, there are two opportunities that could improve that engagement rate:
- Repurpose Facebook videos for Twitter
- Utilize high performing hashtags
Non-profits Average Engagement Rate & Posts Per Day
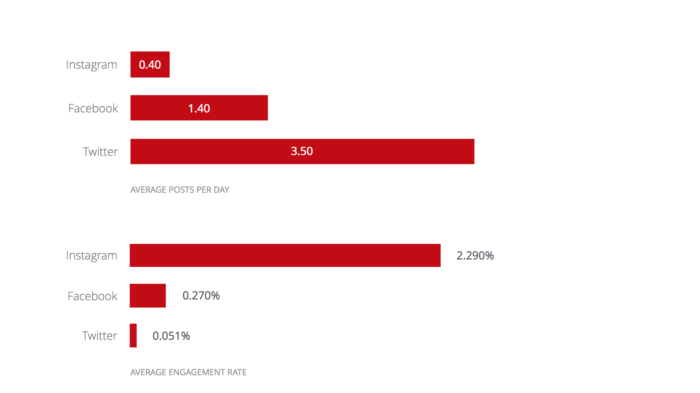
With audiences similar to higher ed, non-profits could see an increase in Instagram engagement by increasing posts per day by 0.2 (one more post every 5 days).
Non-profits: Facebook Engagement
Posts per week, engagement rate, by post type.
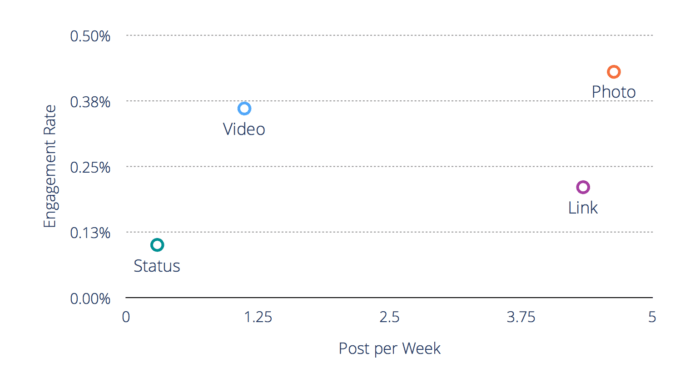
Increasing video content is an opportunity for non-profits to increase audience engagement.
Non-profits: Twitter Engagement
Posts per week, engagement rate, by post type.
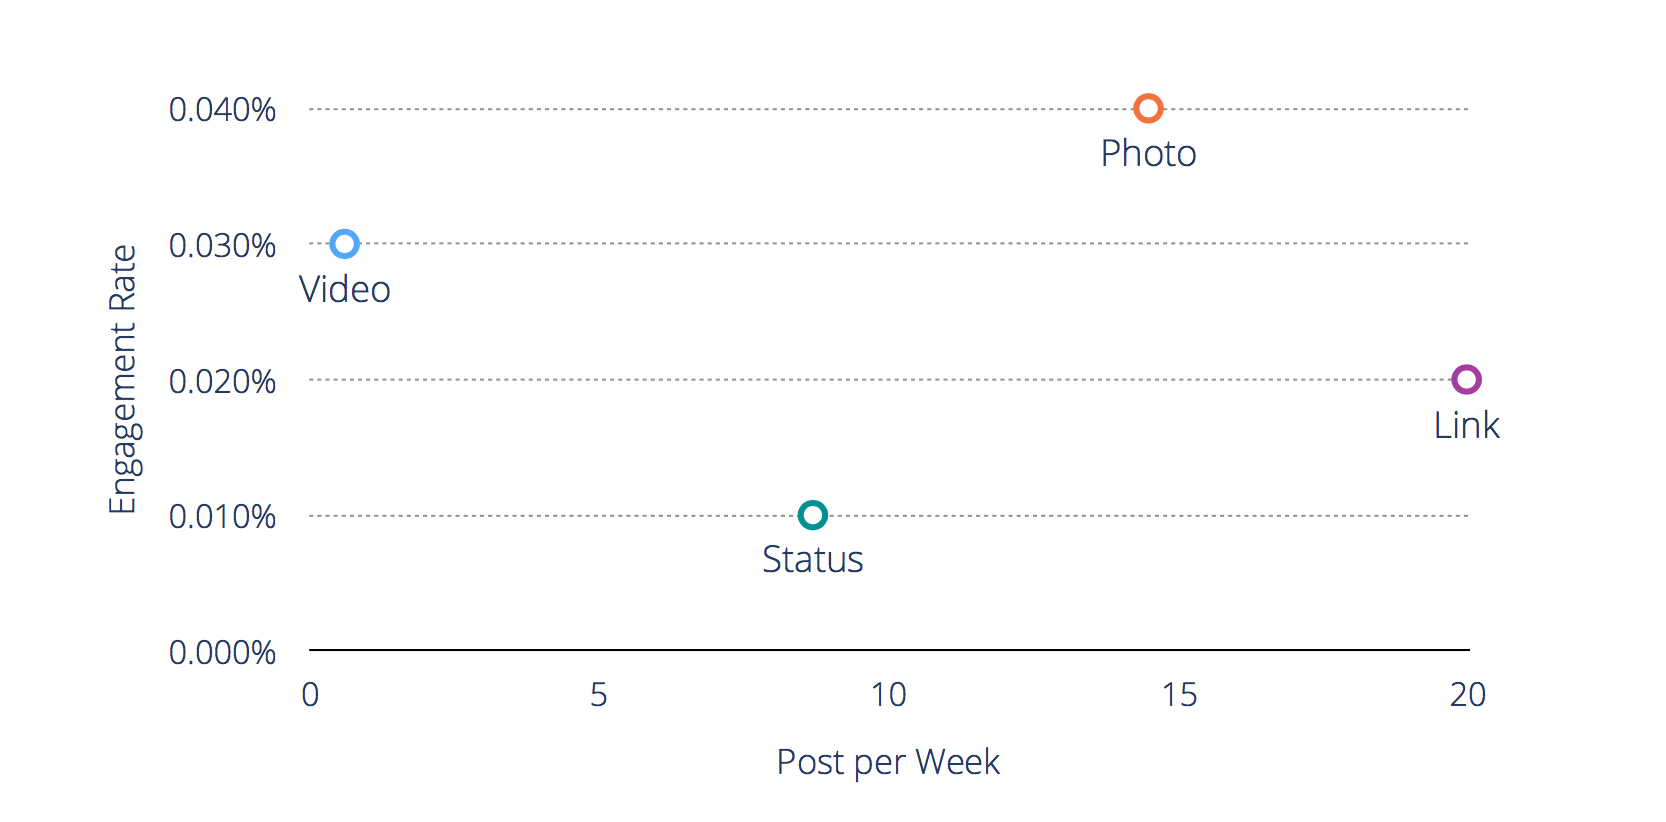
Non-profits post more videos on Facebook and could repurpose those videos on Twitter to help increase engagement on the social platform.
Non-profits: Instagram Hashtags
Top Hashtags by engagement rate (used by more than 10 companies in study)
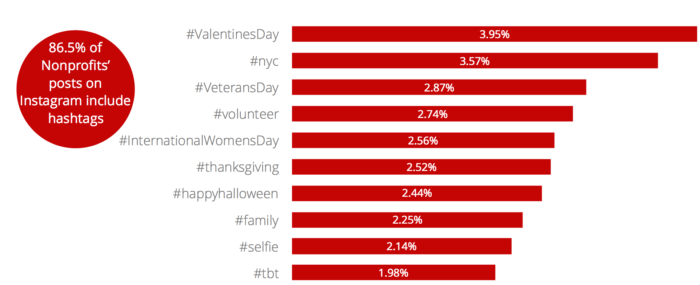
Holidays and positive topics top the list of hashtags, making sense for non-profits to engage audiences on altruistic subjects.
Industry Snapshot: Higher Ed
Higher ed blows others out of the social waters.
It’s no surprise that colleges and universities have the highest engagement rate on Facebook and Instagram.
What is surprising is that on Facebook, posts that are simply status updates do almost as well as video and photo. This is unique to colleges and universities.
Best Practices for the Higher Ed Industry
Based on this study, one opportunity that could improve that engagement rate is:
- Use more status updates on Facebook
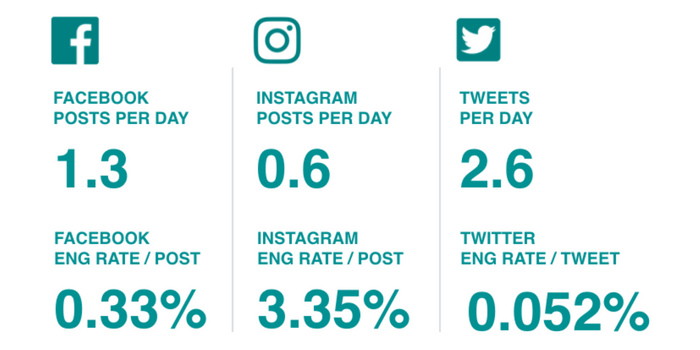
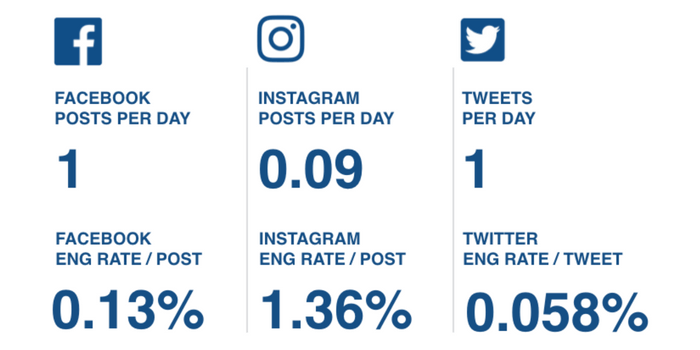
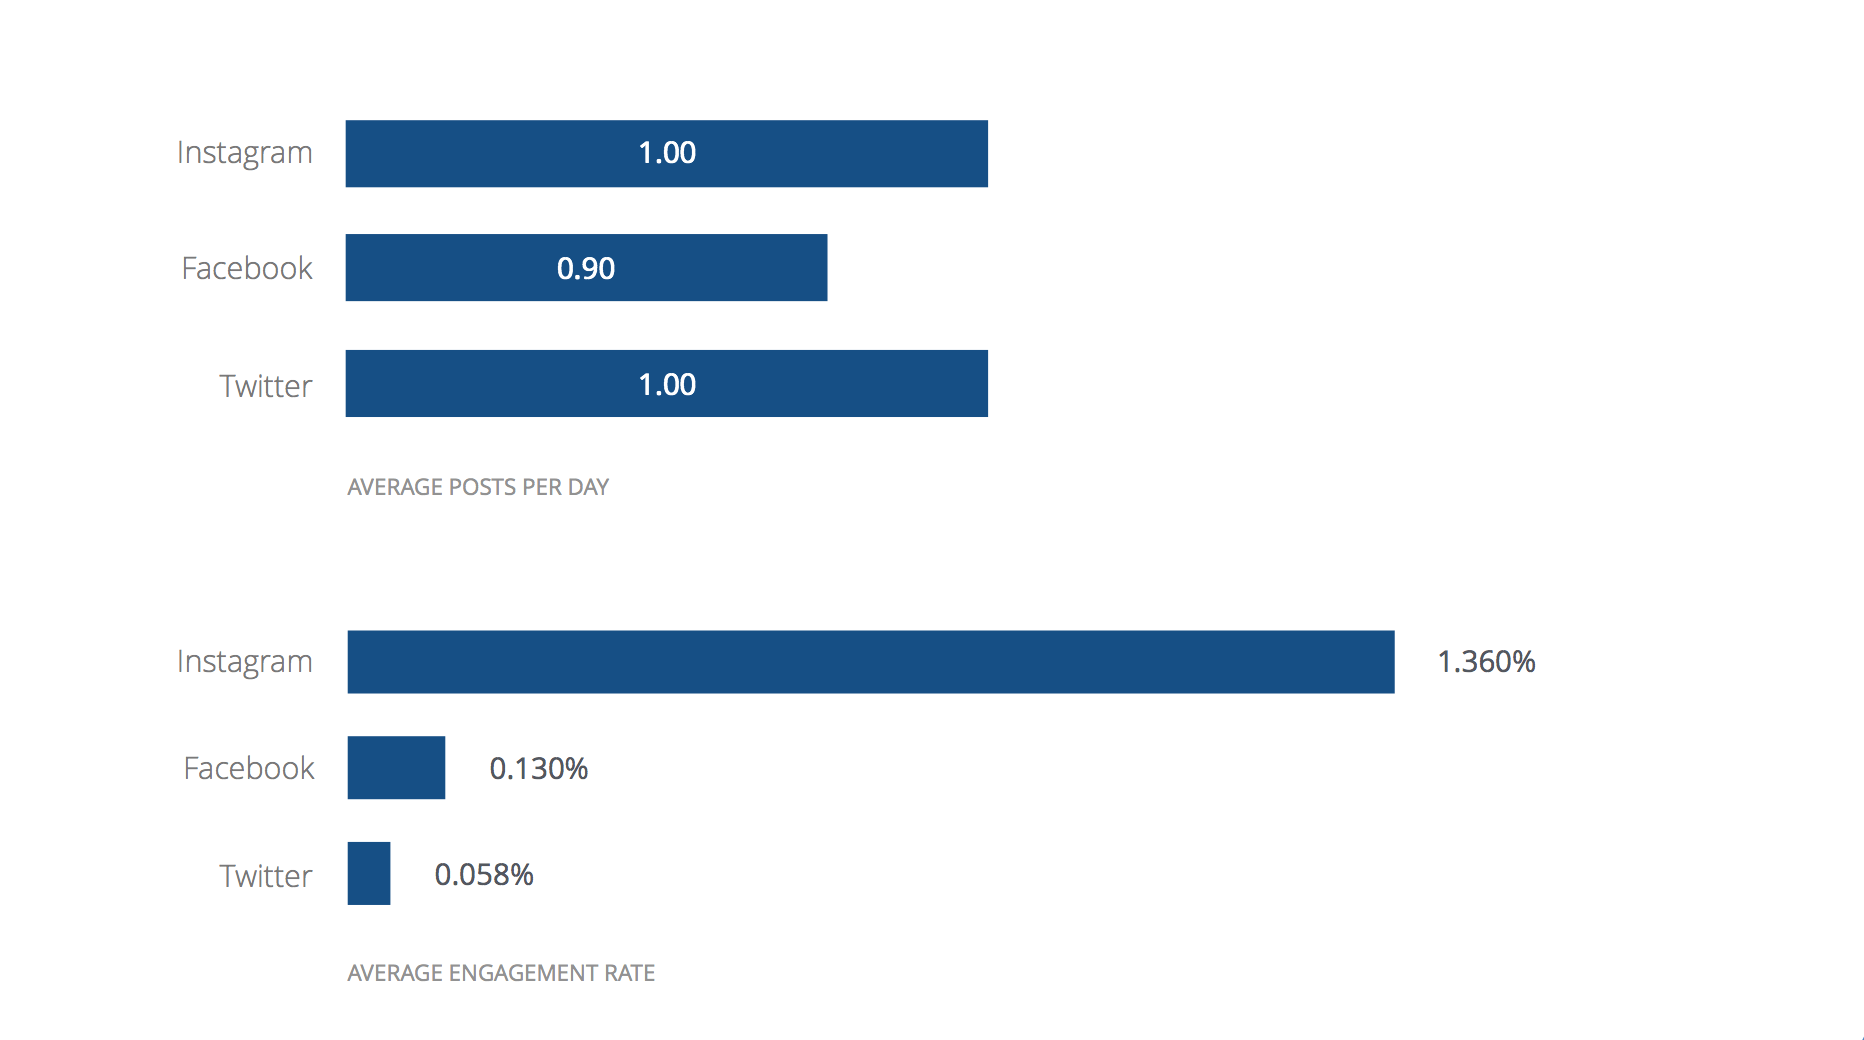
Higher Ed Average Engagement Rate & Posts Per Day
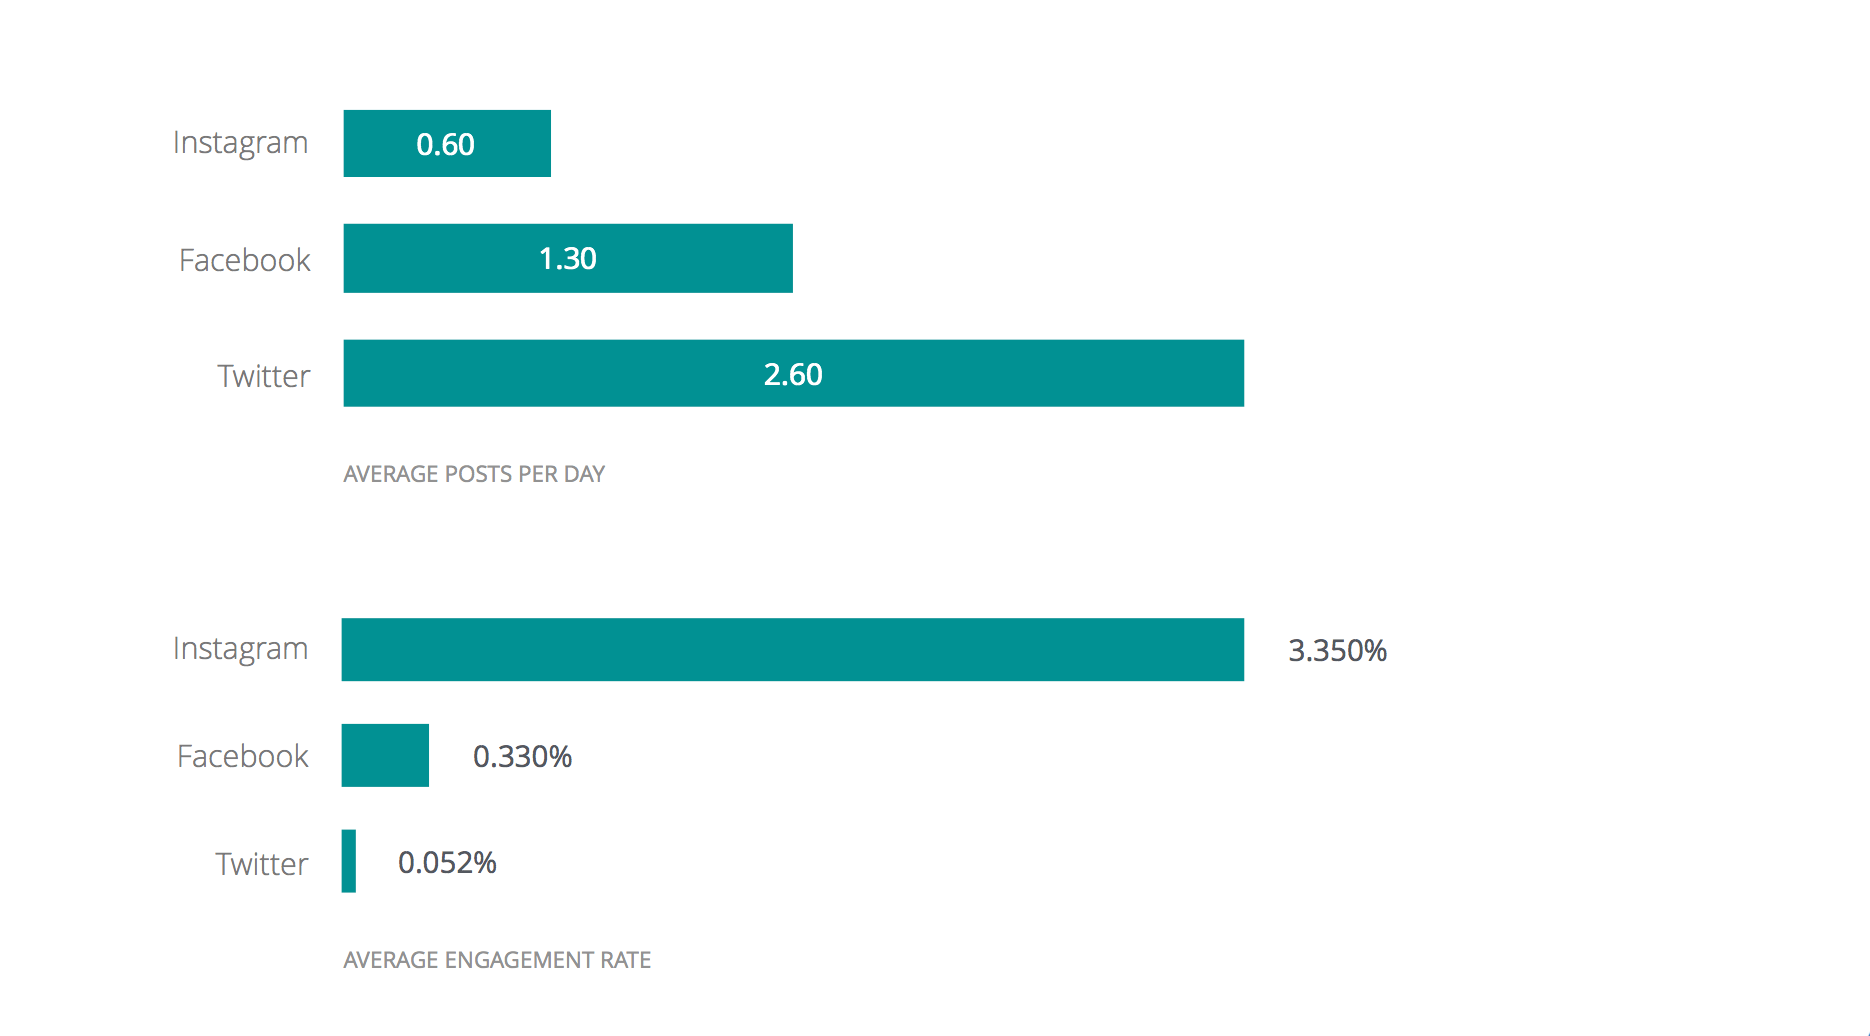
Colleges and universities are second only to the media industry for the worst performance on Twitter.
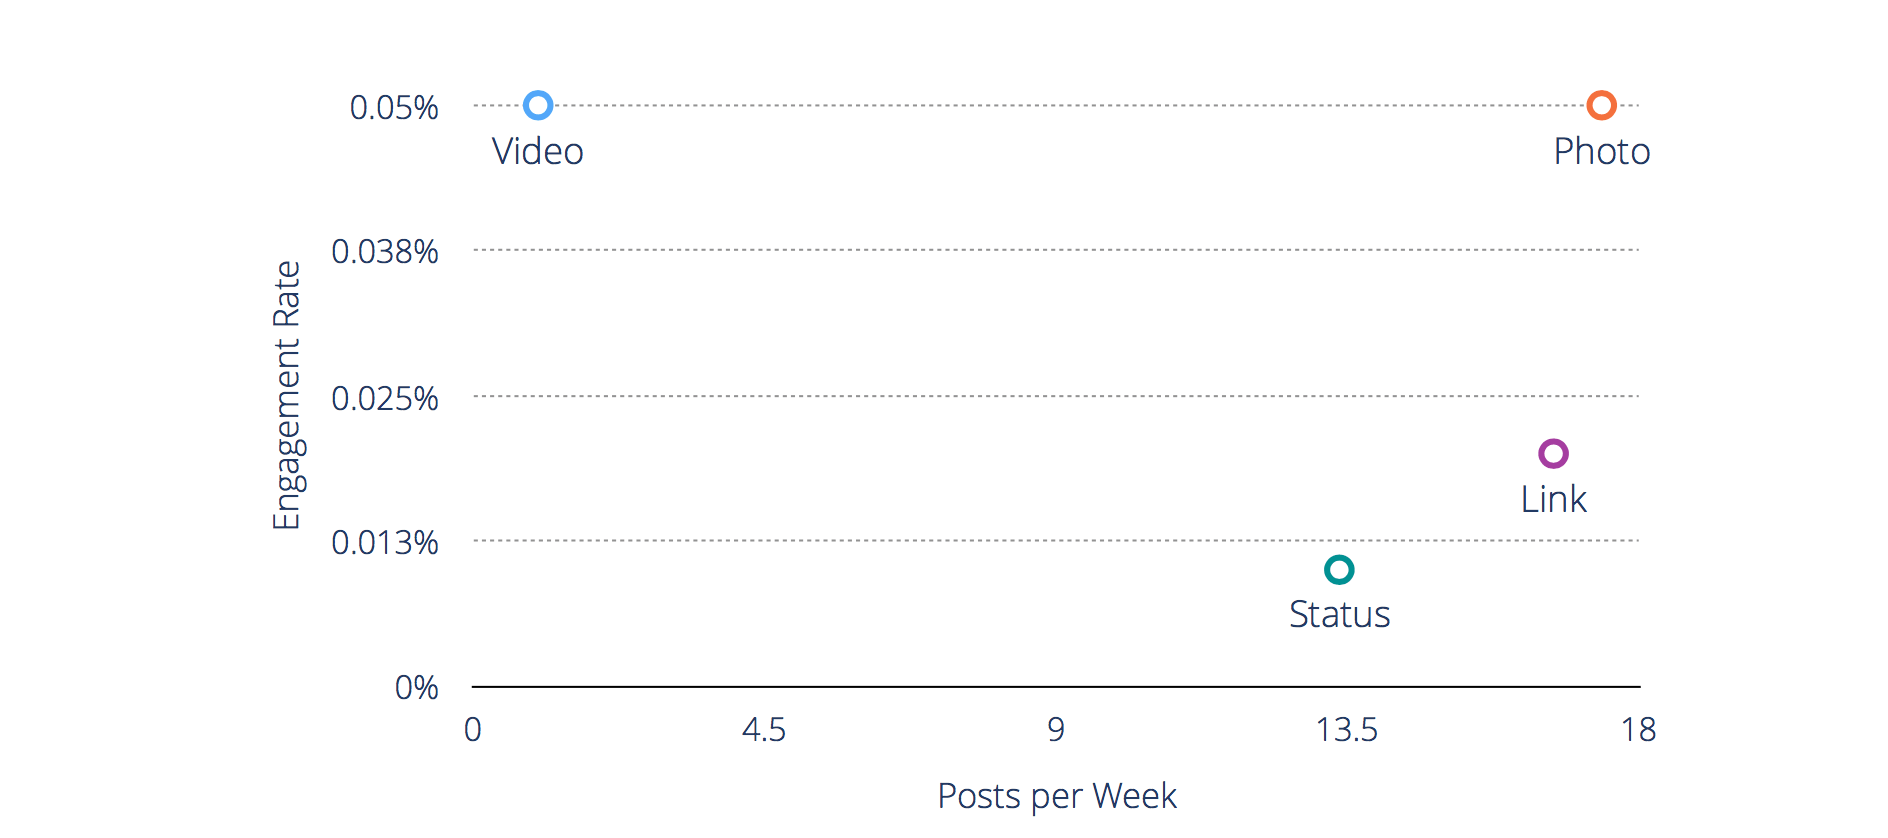
Higher Ed: Facebook Engagement
Posts per week, engagement rate, by post type.
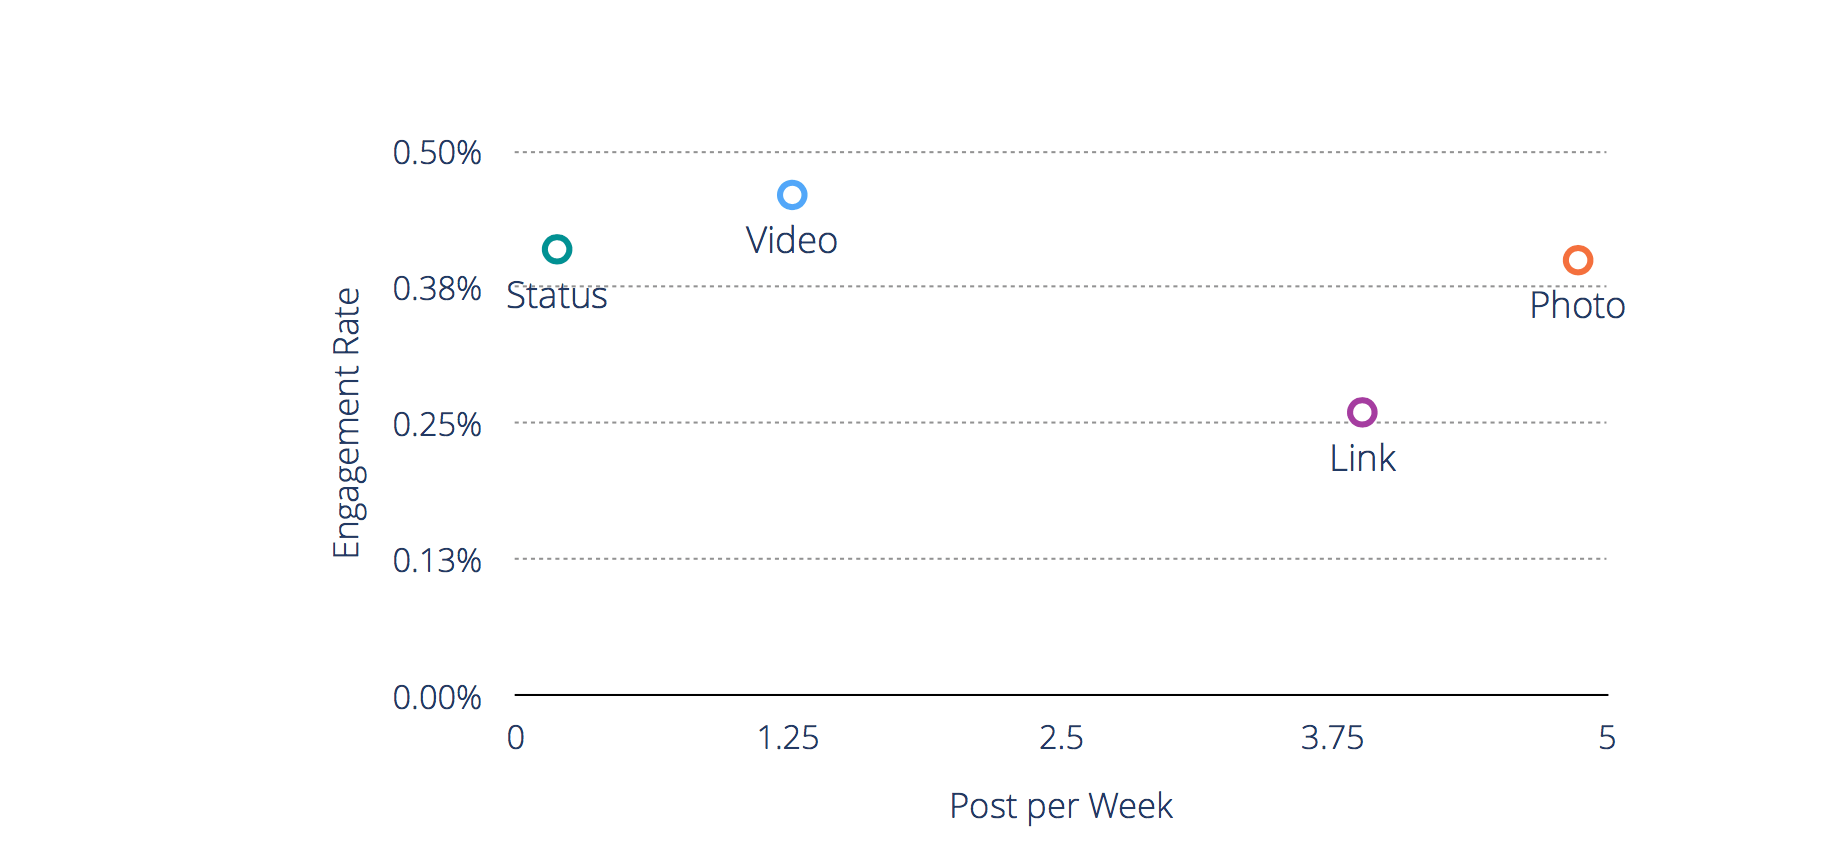
Status updates gain engagement without investing in photos or video.
Higher Ed: Twitter Engagement
Posts per week, engagement rate, by post type.
Video and photos are the biggest opportunities for Twitter engagement.
Higher Ed: Instagram Hashtags
Top Hashtags by engagement rate (used by more than 10 colleges and universities in study)
87% of posts on Instagram from colleges and universities included hashtags.
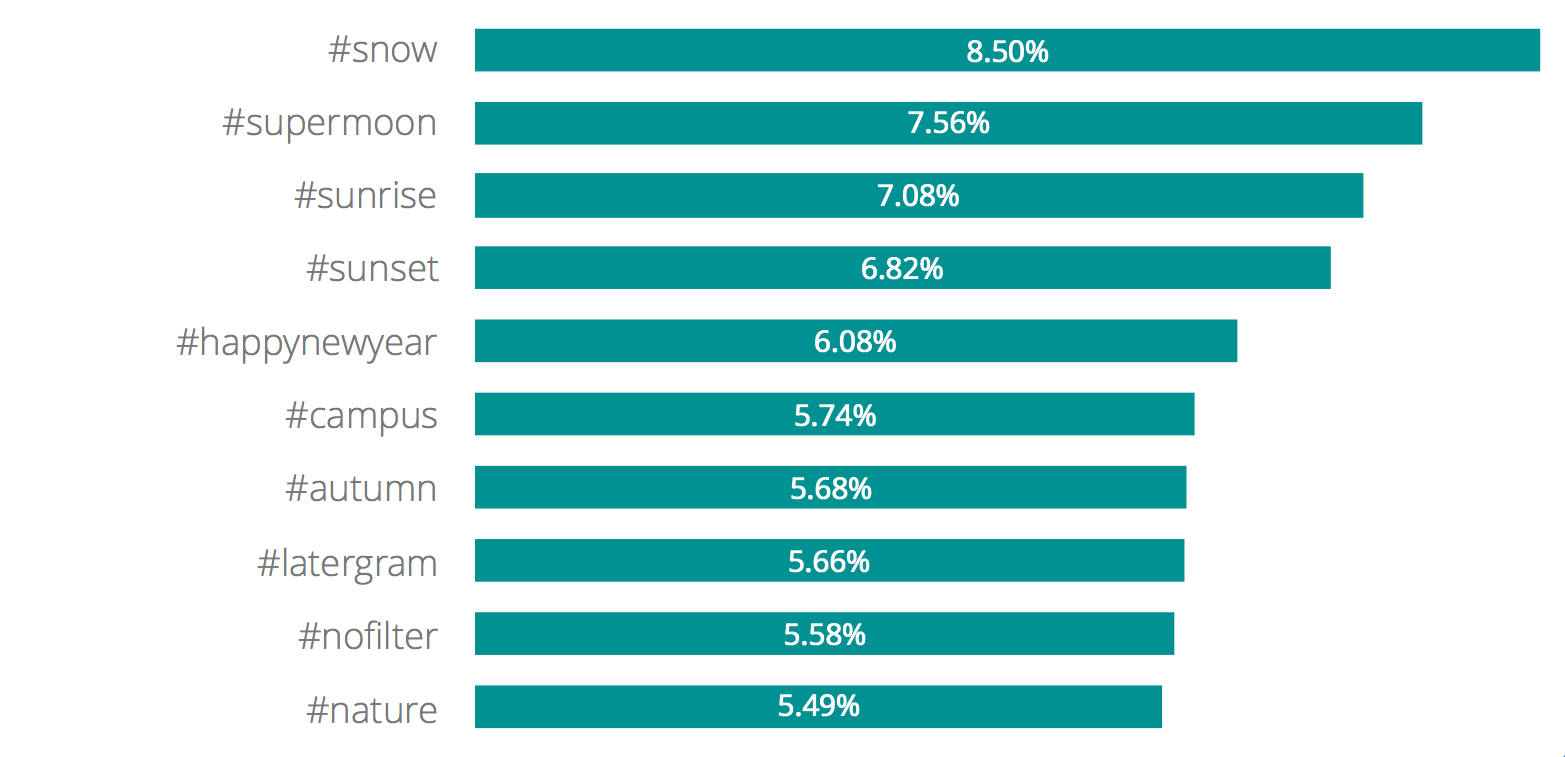
Seasonal and nature photos from around campus are easy wins, driving higher engagement on Instagram.
Discover the hashtags that work for your industry.
Industry Snapshot: Fashion Brands
Fashion brands don’t dominate.
Fashion Brands, along with Health & Beauty brands have a reputation for having high engagement rates, especially on Instagram. While there are many successful brands on social, it’s important to note that they don’t represent the industry as a whole.

Best Practices for the Fashion Industry
Based on this study, there are two opportunities that could improve that engagement rate:
- Use more video in posts
- Use more relevant hashtags
Fashion Brands: Average Engagement Rate & Posts Per Day
Fashion brands are clearly social – posting almost equally across channels.
Fashion Brands: Facebook Engagement
Posts per week, engagement rate, by post type.
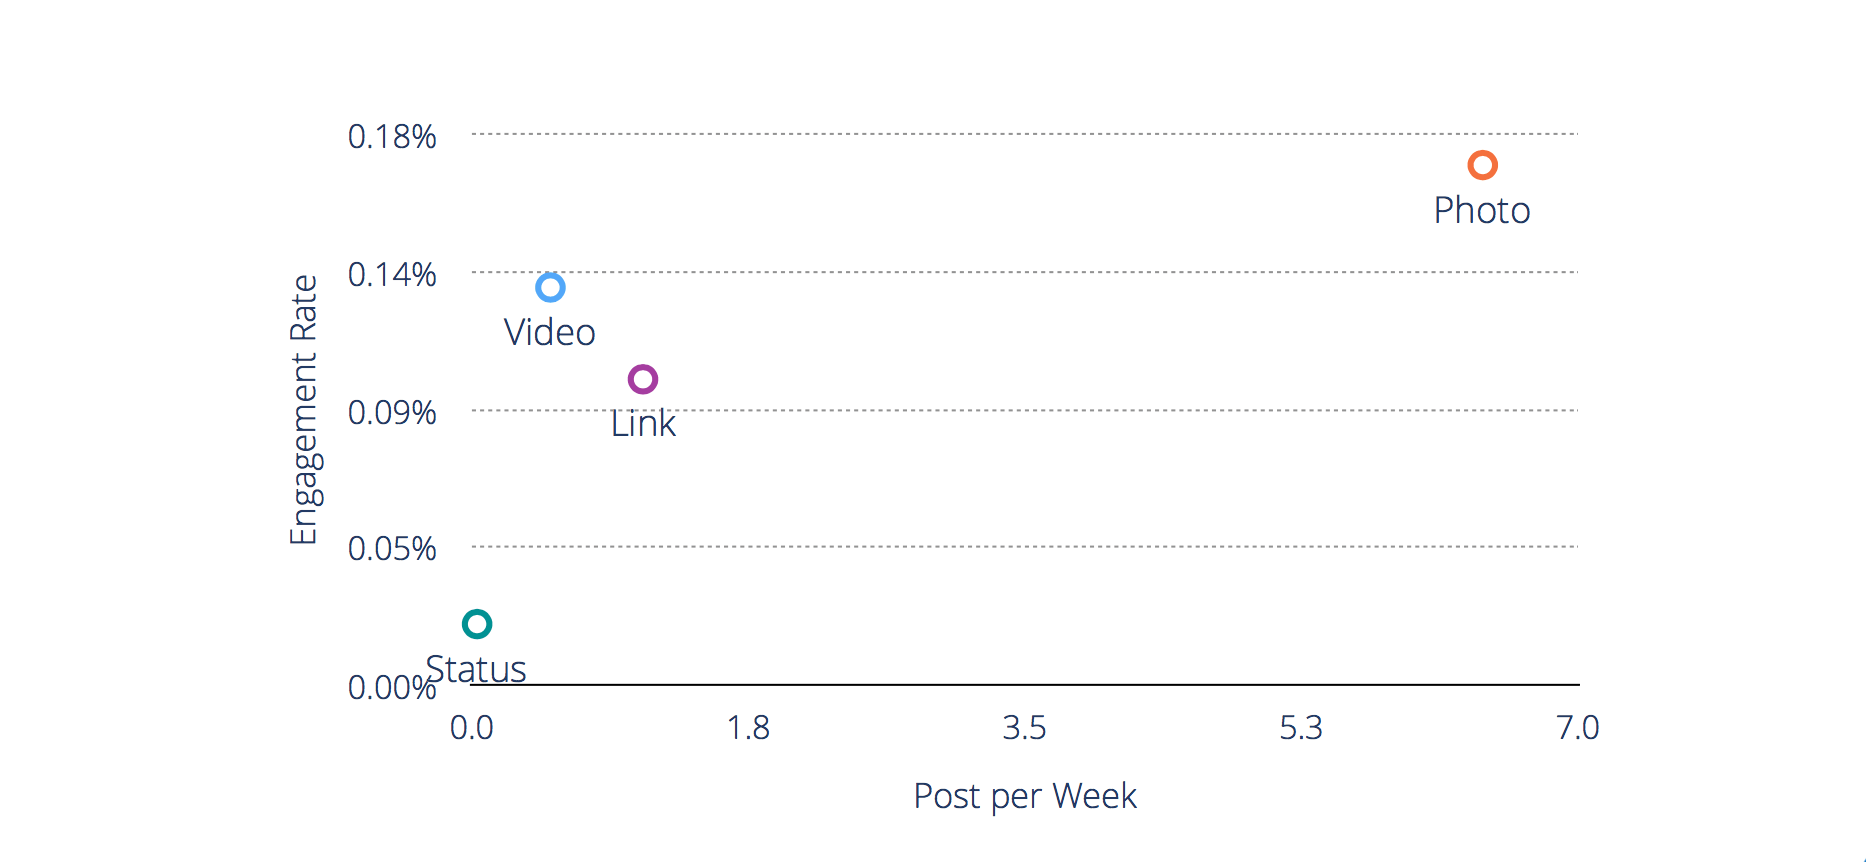
It’s rare to see the most common post type receive the most engagement. Fashion brands are on point posting photos on their social channels.
Fashion Brands: Twitter Engagement
Posts per week, engagement rate, by post type.
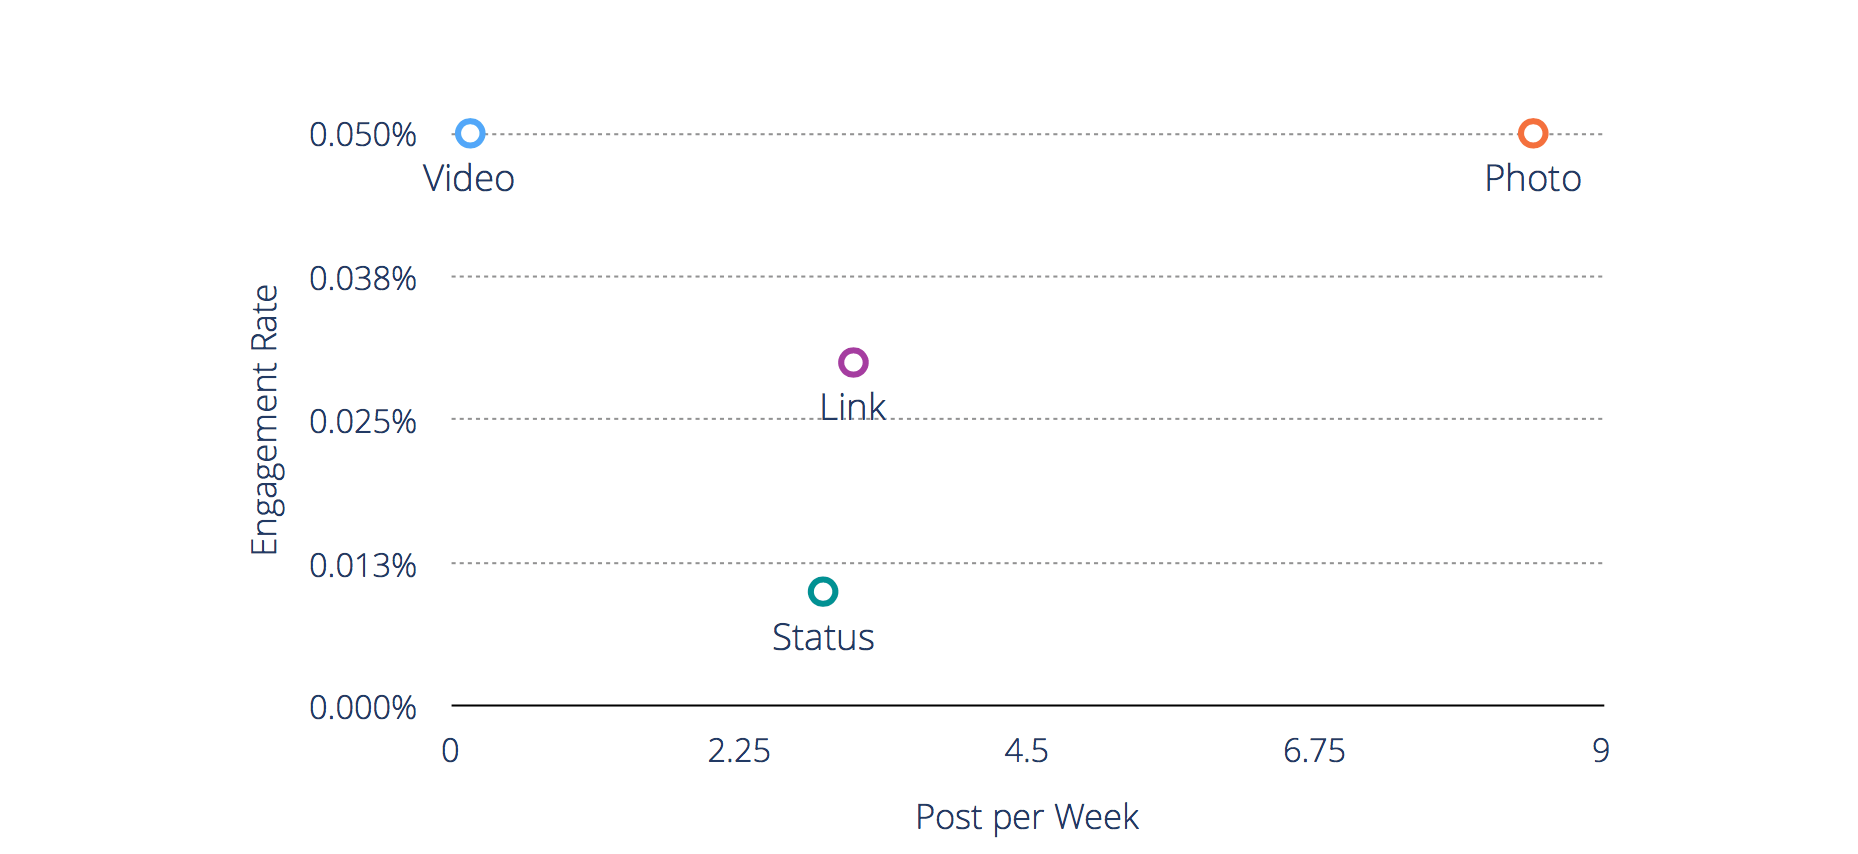
Few posts include video, yet it does as well as photos. Try adding video to tweets to increase total engagement.
Fashion Brands: Instagram Hashtags
Top Hashtags by engagement rate (used by more than 10 colleges and universities in study)
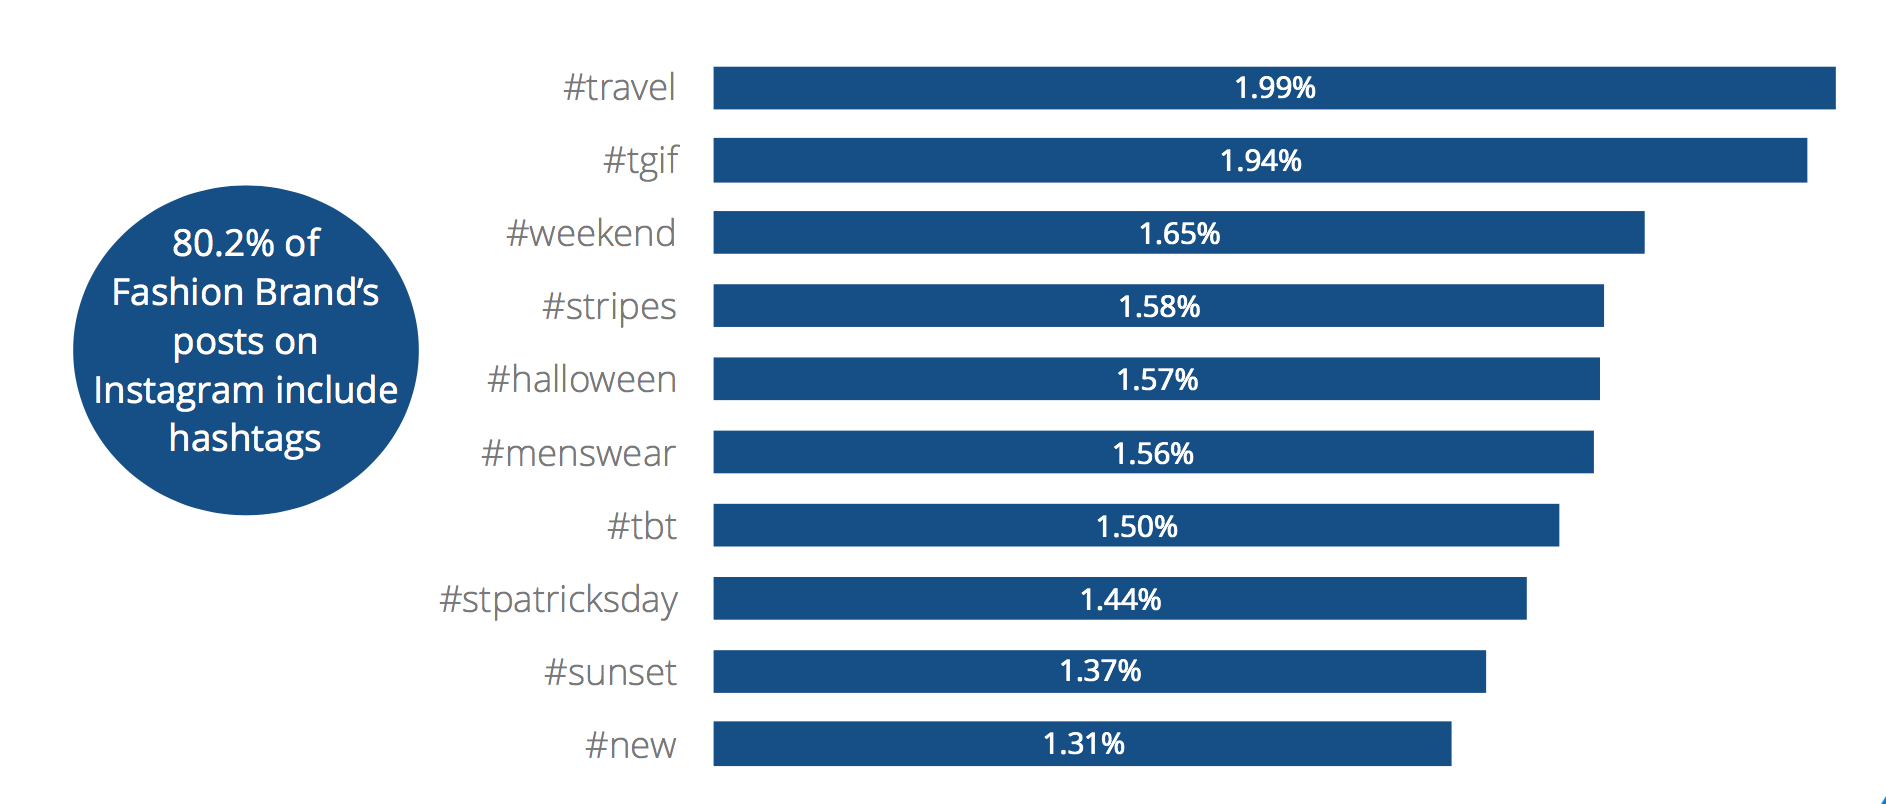
The top hashtags for fashion brands are only slightly higher than the average engagement unique to this industry. We recommend you test out fashion related hashtags to achieve higher engagement.
Industry Snapshot: Health & Beauty
Health & Beauty surprises with low performance.
Health & Beauty brands, along with fashion brands, have a reputation for having high engagement rates, especially on Instagram. While there are many successful brands on social, don’t let those fool you into believing they represent the industry as a whole.
What surprised us in this study is that health and beauty’s photos significantly trumped video both on Twitter and Facebook. This is unique from the other industries studied.
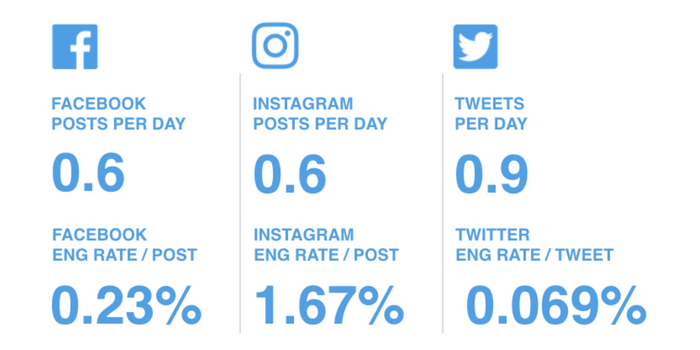
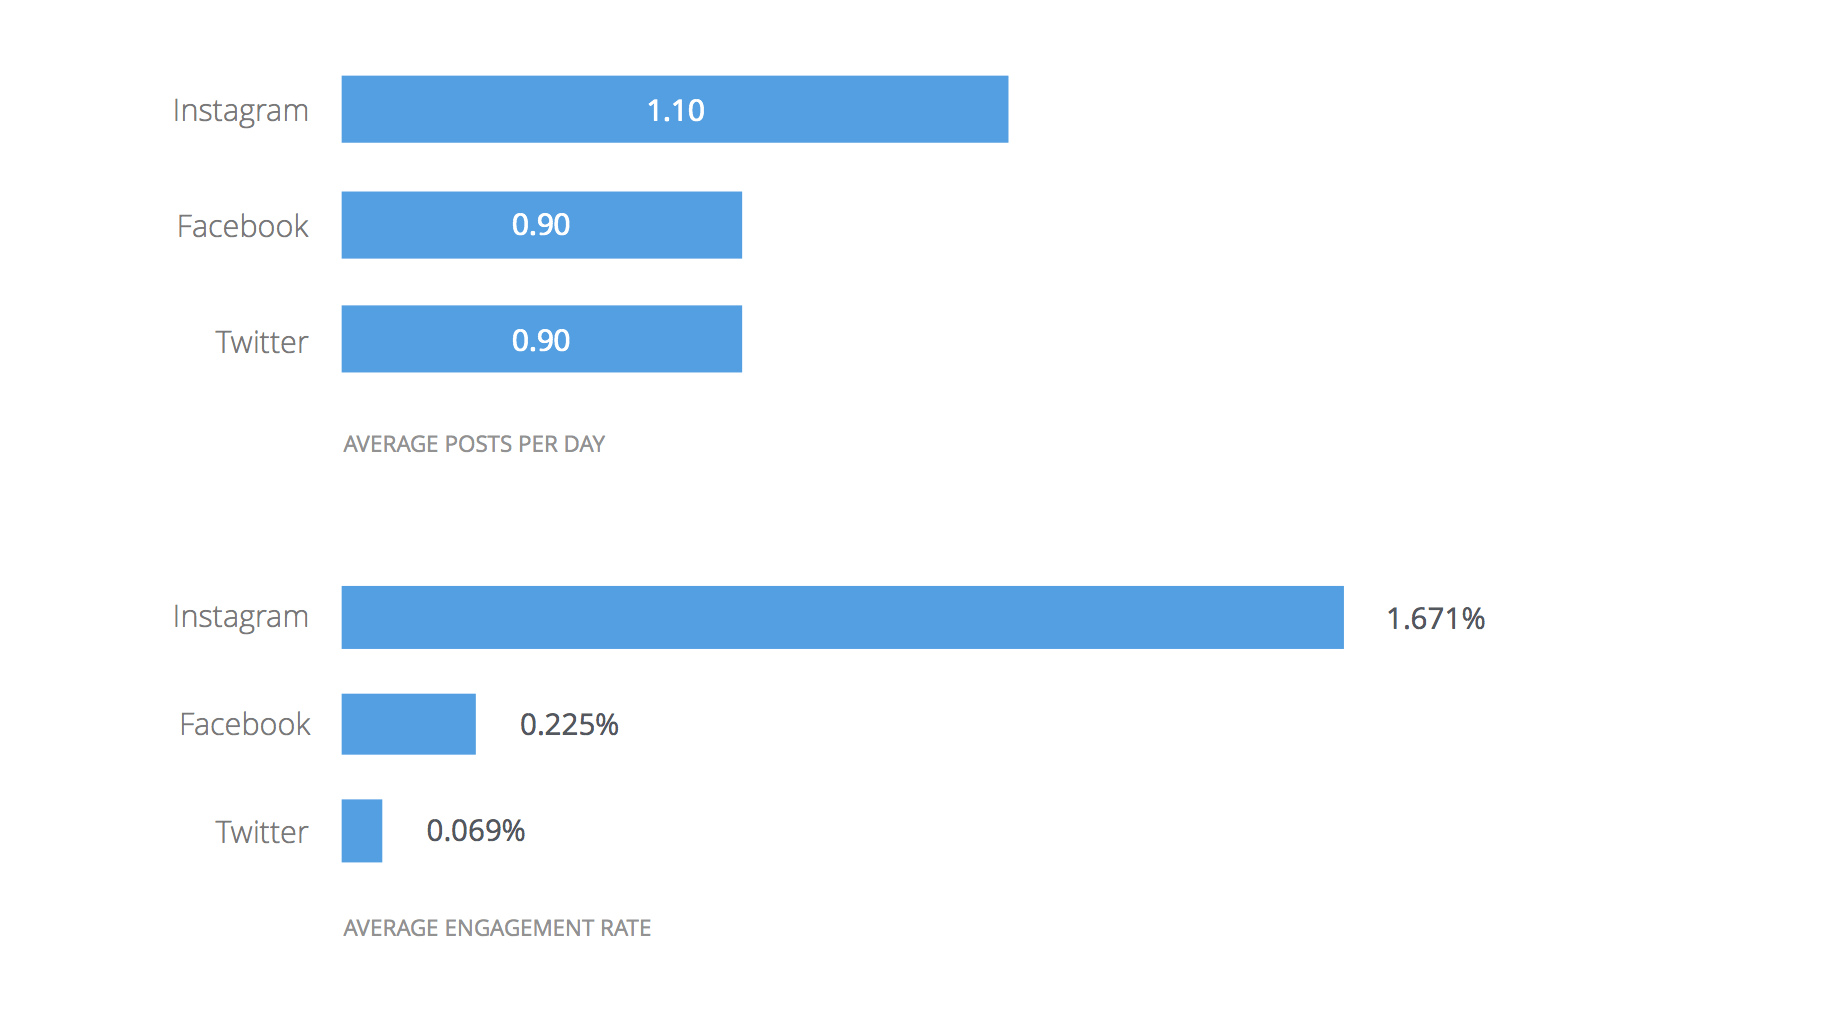
Health & Beauty: Average Engagement Rate & Posts Per Day
Health and beauty stand just behind the fashion industry in social posting frequency.
Health & Beauty: Facebook Engagement
Posts per week, engagement rate, by post type.
It’s rare to see the most common post type receive the most engagement.
Health & Beauty: Twitter Engagement
Posts per week, engagement rate, by post type.
Health and beauty is the only industry in this study where video content is not equal or better performing than other social media types (photo, .gif, status update, etc.) on Twitter.
Health & Beauty: Instagram Hashtags
Top Hashtags by engagement rate (used by more than 10 companies in study)
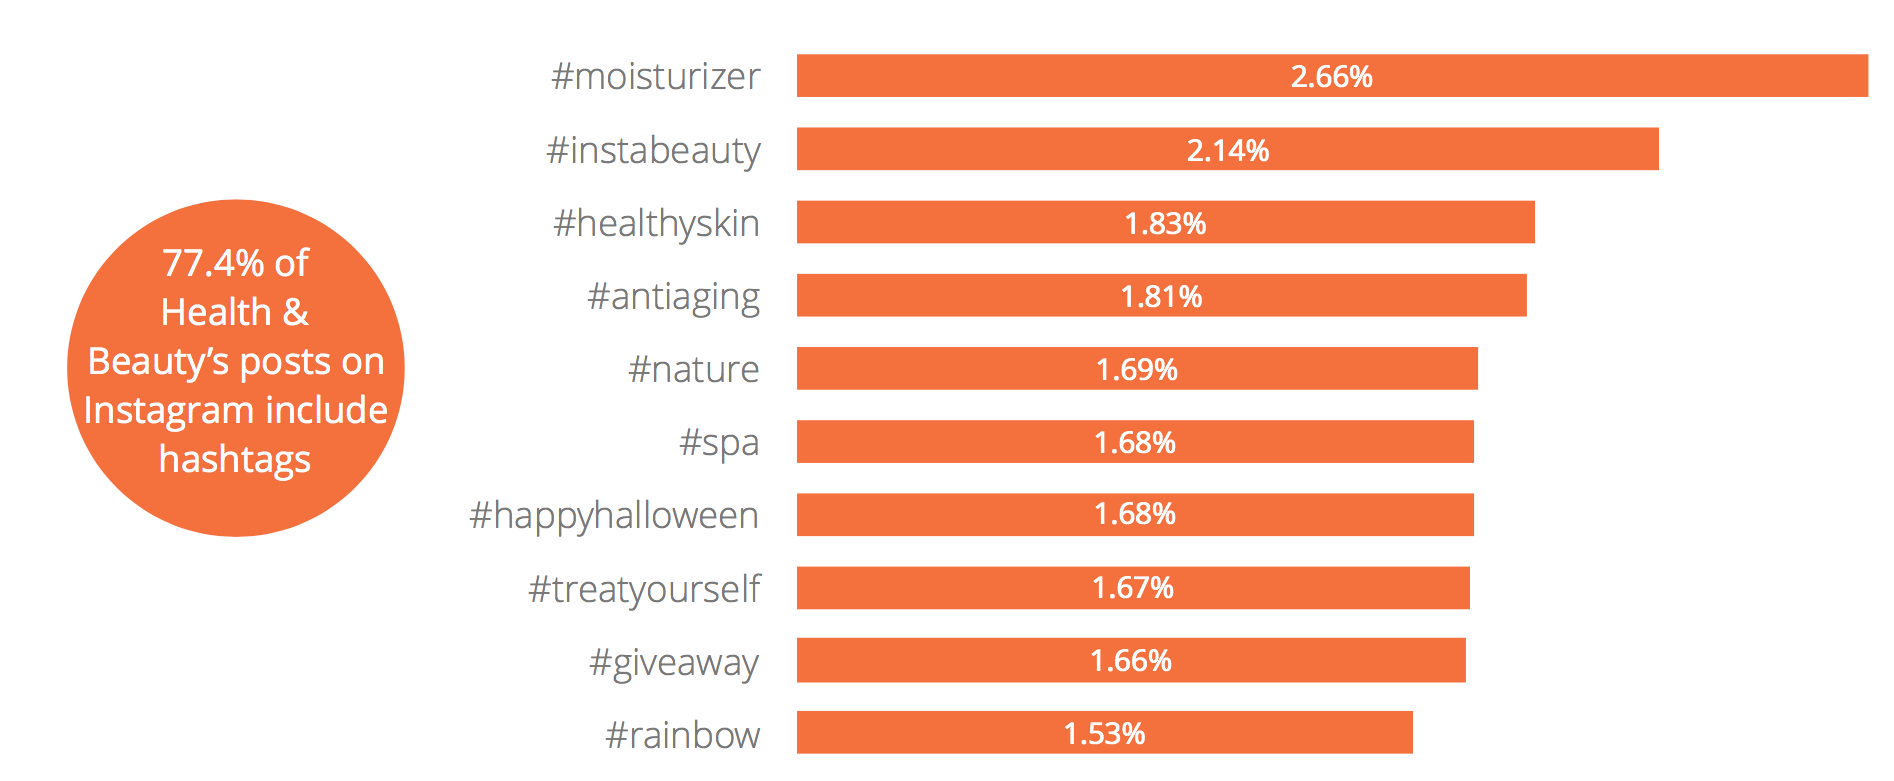
Health and beauty brands were one of only two industries in the study that experienced high engagement with industry-related hashtags.
Benchmark your social media against the competition.
Industry Snapshot: Food & Beverage
Food & Beverage brands rock on Twitter.
Food & Beverage brands significantly outperform other industries on Twitter. The most common post type for Food & Beverage brands is photo posts, and it’s also the most engaging on Facebook, which means it’s important to invest in the imagery that resonates and engages the audience.
For these brands, timeliness is what helps a post stand out.
Food & Beverage: Average Engagement Rate & Posts Per Day
Surprisingly food & beverage brands post the least on Facebook out of all the industries studied.
Food & Beverage: Facebook Engagement
Posts per week, engagement rate, by post type.
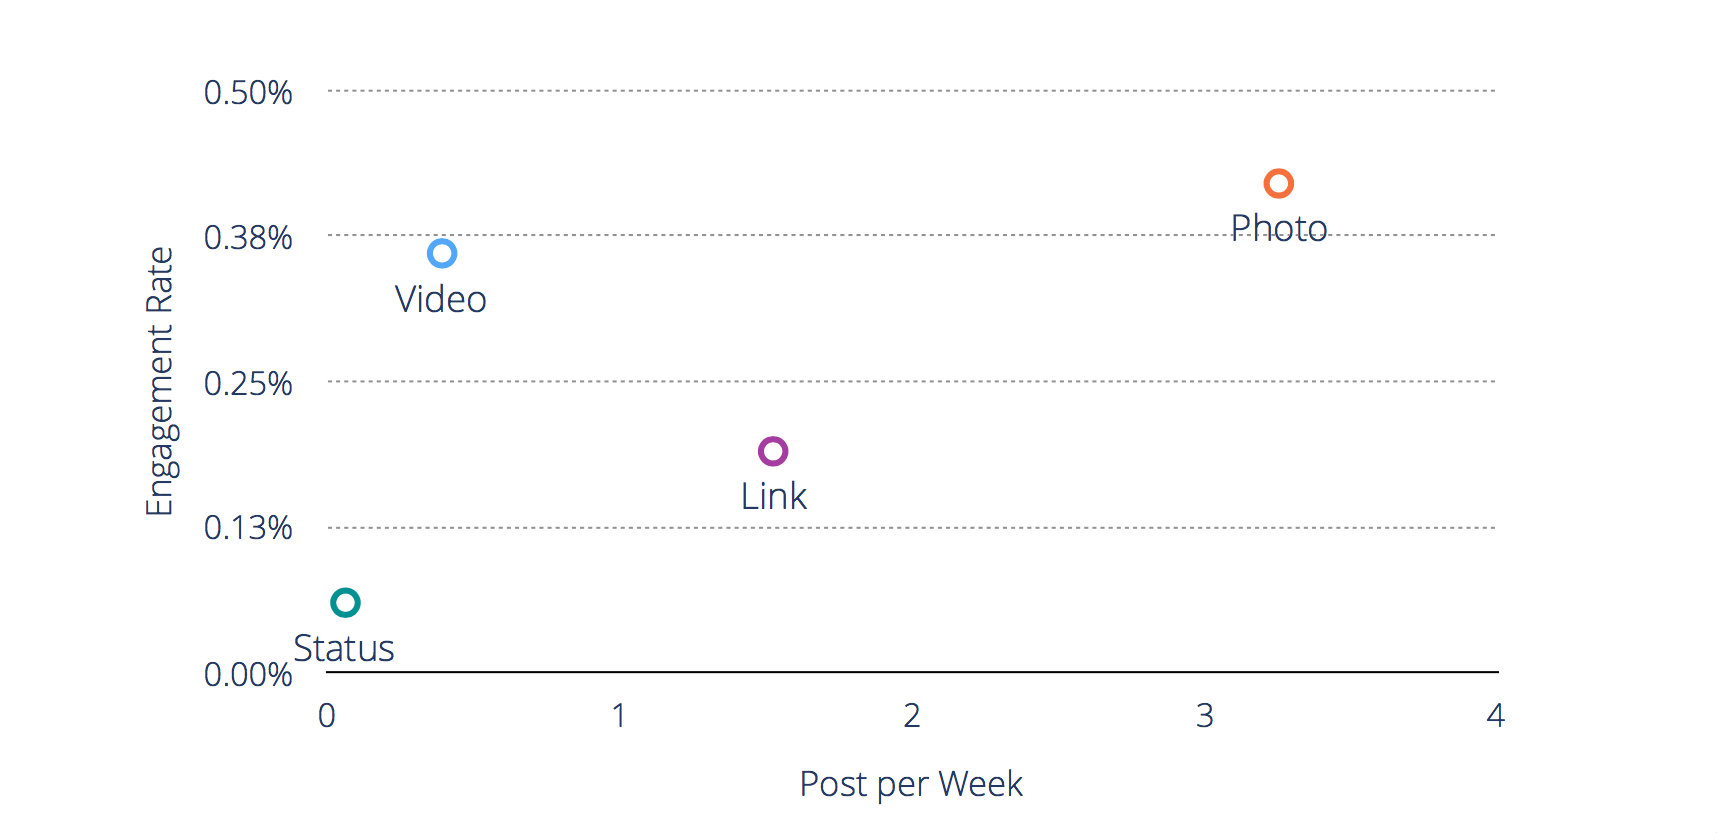
Video content is underutilized on Facebook for food and beverage brands – brands using video on Facebook have an upper hand in engagement.
Food & Beverage: Twitter Engagement
Posts per week, engagement rate, by post type.
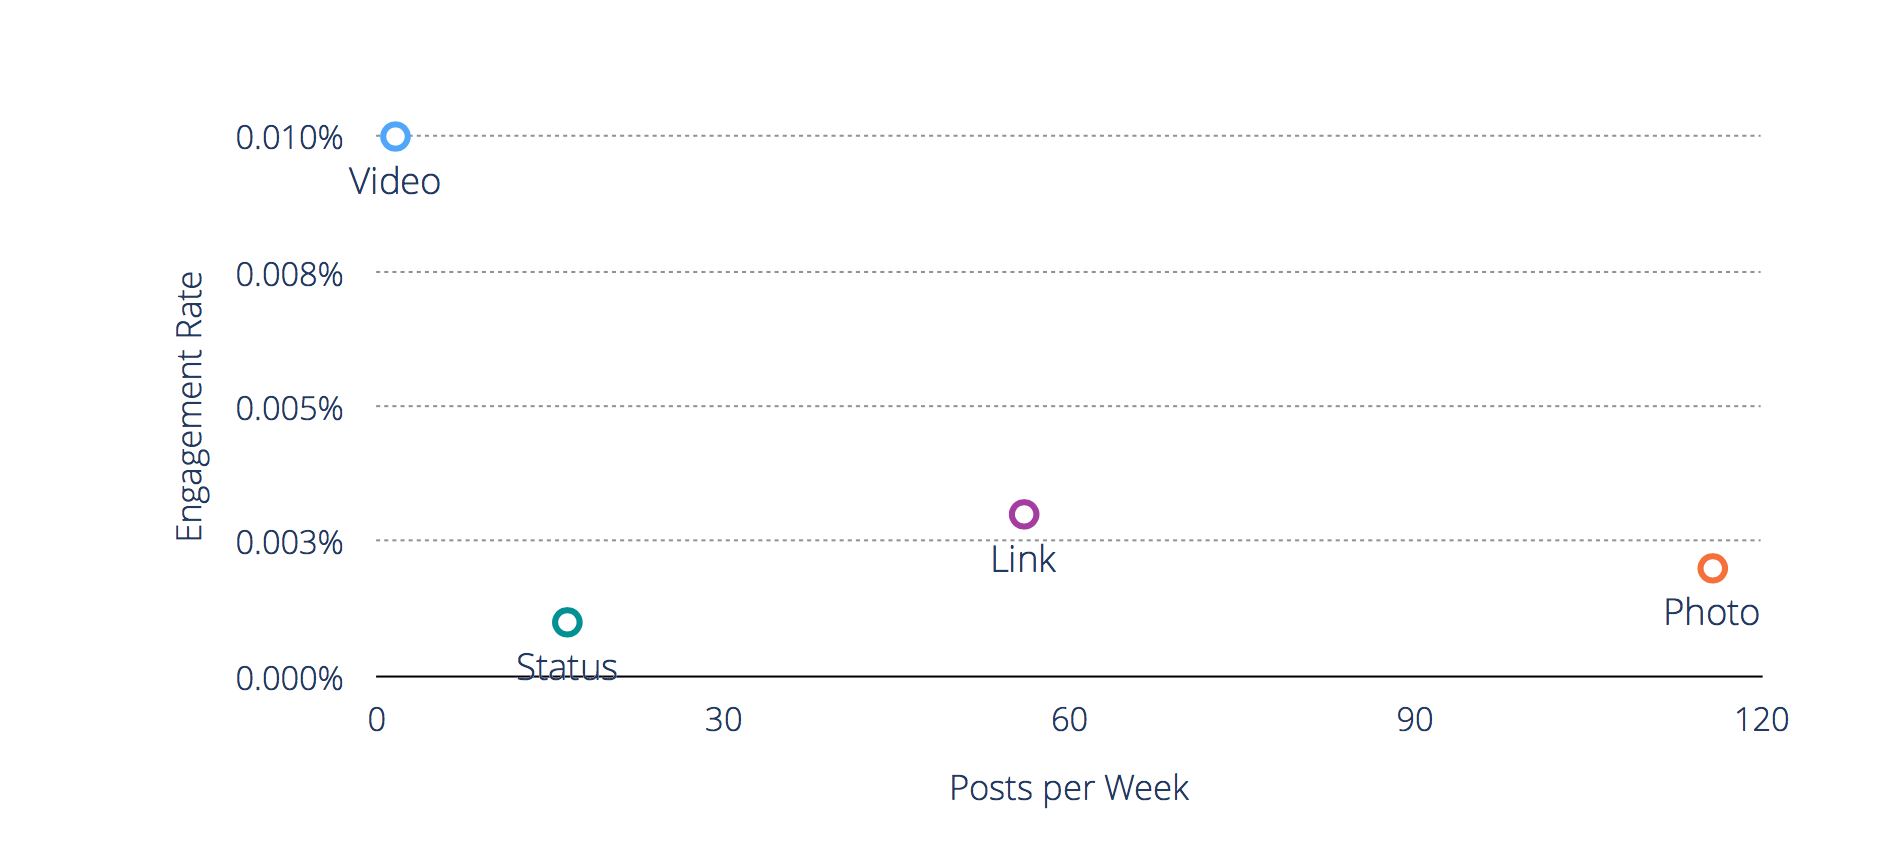
Video outshines all the rest for engagement on Twitter; by adding video into the strategy for food and beverage brands, they can significantly increase their social media engagement.
Food & Beverage: Instagram Hashtags
Top Hashtags by engagement rate (used by more than 10 companies in study)
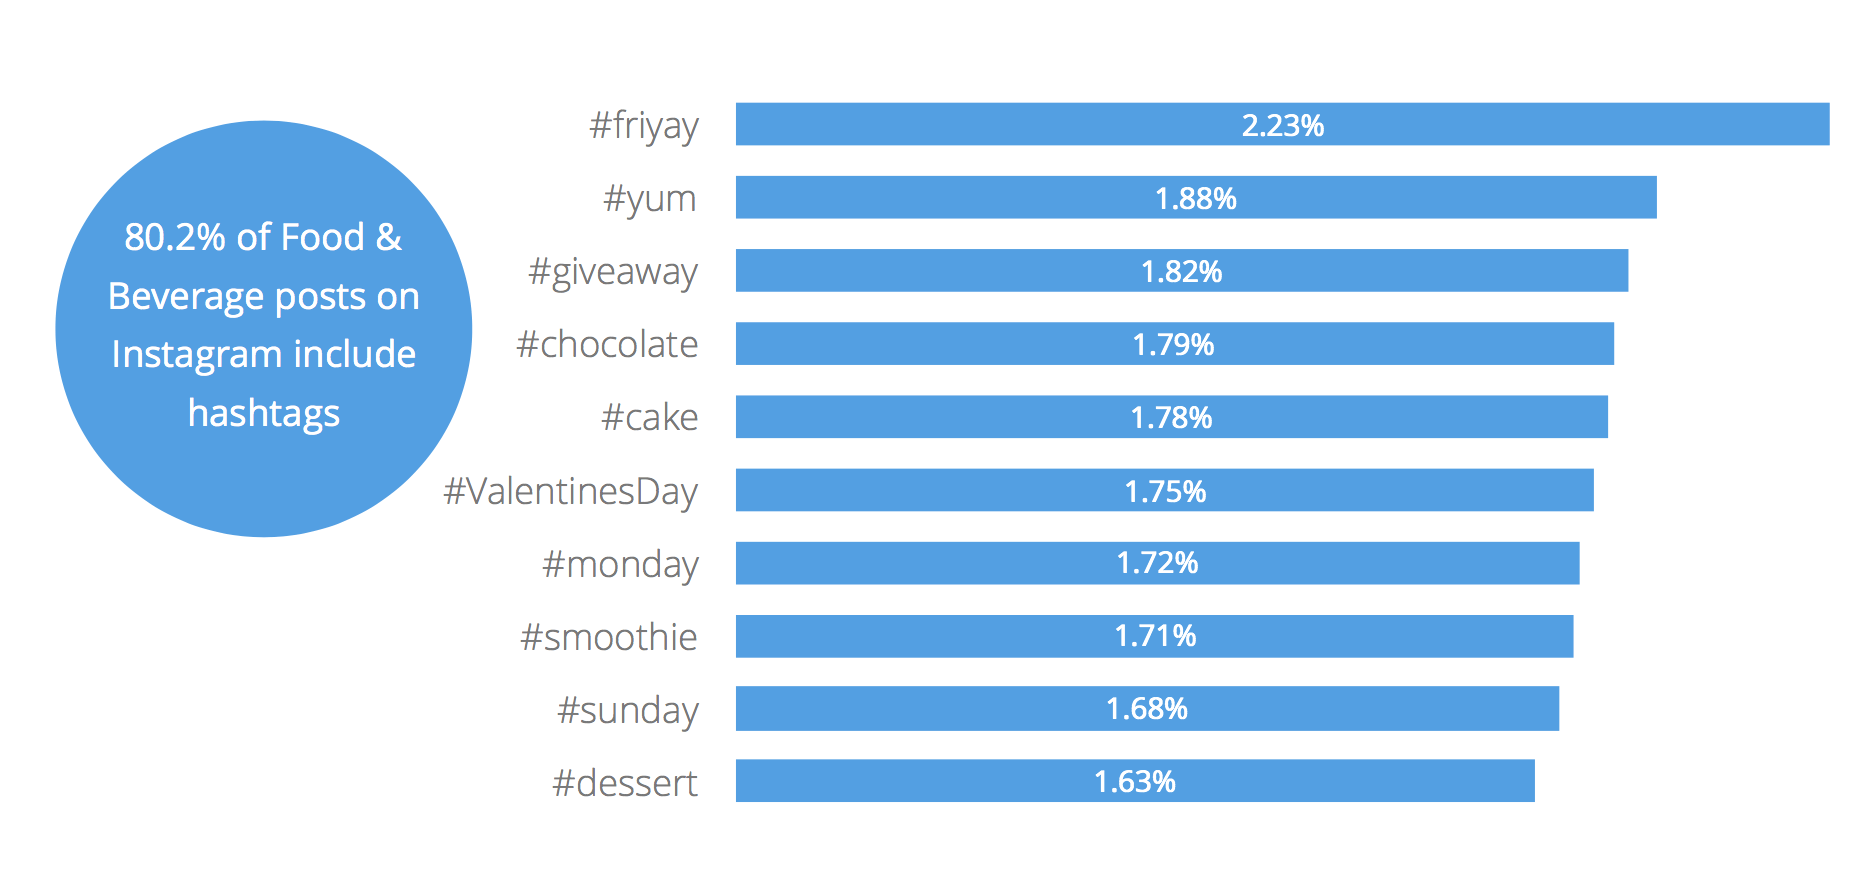
It’s not a surprise here that the top hashtags are around food, but include days of the week in their strategies too. Giveaways also help with post engagement.
Curious about your benchmarks yet?
Download the PDF version of this 2017 Social Media Industry Benchmark Report here!