Sharing links to content on social media is one of the ways you provide value to your audience. You share links to your own content and curate meaningful content from others into your feed to give your followers valuable insights, news updates, and recent learnings.
When you’re constantly sharing new content from a variety of sites, it’s hard to know which pieces of content you’re promoting really engage your audience and which don’t. The problem gets harder particularly when you’re sharing the same link multiple times on multiple channels.
For example, you’re promoting a live event on social media. You’ve built a landing page for signups, and you post links to this landing page on social for weeks leading up to the event. Your staff might also be posting links, along with other participants in the event. You’re posting on Twitter, Facebook, and G+ (ok, maybe not that last one). How can you possibly measure the impact of this social promotion across all of these handles and channels? How can you know what copy, post types, and publish times work the best?
It turns out getting an answer has been no simple feat.
Fortunately, that all changes today with the launch of Posted URLs Analysis within Rival IQ. With these powerful new features, you can answer all of your questions about content promotion on social media. And like with so many other Rival IQ features, you’ll gain great awareness about which pieces of content your competitors are heavily promoting and whether or not it works.
With Posted URLs Analysis you’ll:
- Improve content promotion across social — Pinpoint the best tactics for sharing content.
- Nail content curation — Unearth and test new content sources, and identify the ideal content mix.
- Reveal competitor priorities — Detect what content matters to competitors, what works for them, and analyze engagement across their campaigns.
- Streamline shared content reporting — Simplify campaign reporting and illustrate the power of curation.
Three easy ways to answer your social promotion questions
In the next few sections, I’ll show how you can answer all your questions about measuring content promotion on social. Of course, if you prefer to listen and watch as we walk you through the powerful features in our Posted URL Analysis tools, check out one of these two webinars with our amazing product team!
Analyzing Your Content Promotion on Social
Follow That Link: Insights for Better Content Curation
Let’s dig into what you can learn!
Get Key Insights without lifting a finger
We know you’re busy, so we’ve included a Key Insights panel right at the top of the page. Here, you’ll see notable insights gleaned from your landscape. Do you have any competitors that are sharing a particular piece of content a lot? How’s your curation mix of content? Are you sharing your own content enough? Too much?
The Key Insights panel will provide you with a quick set of answers to these questions and give you an easy way to dive into the data used to find this insight.
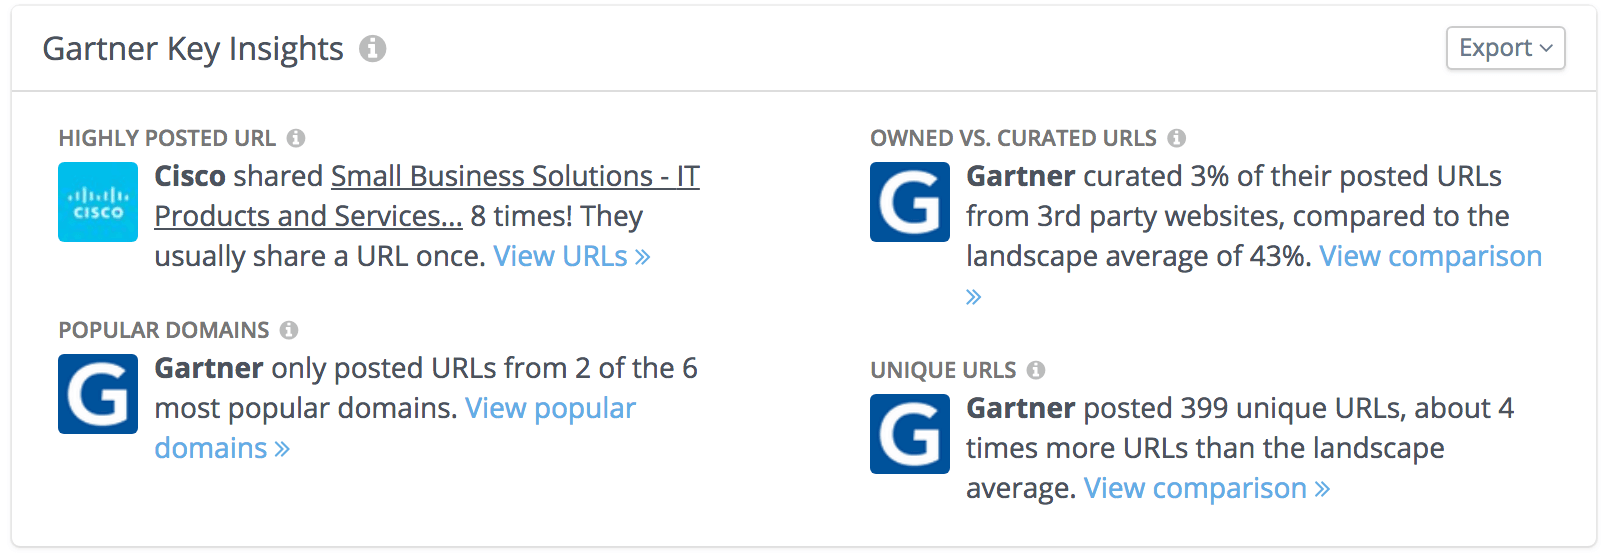
Specifically, you’ll find four types of insights here, each with a link to the source data that powers it:
- Highly Posted URL: This highlights when companies in your landscape post a link many more times than usual. This will often expose a campaign around an event, hiring, a whitepaper, a new product, etc.
- Popular Domains: This highlights sites whose content is being posted multiple companies in your landscape are sharing.
- Owned vs Curated URLs: This compares your ratio of links to content on your site (“owned” ) with links to the content of others (curated).
- Unique URLs: This compares the number of URLs you and your competitors post on social during any given time period.
Analyzing promotion by company
In this first section of Posted URLs Analysis, the focus is on each company in your landscape and some key metrics about the links they’re posting on social. With it, you’ll answer questions like:
- How many pieces of content did I share?
- How many social posts did I use to promote each piece of content?
- How was my engagement on each piece of content I posted?
- Which pieces of content did I promote the most?
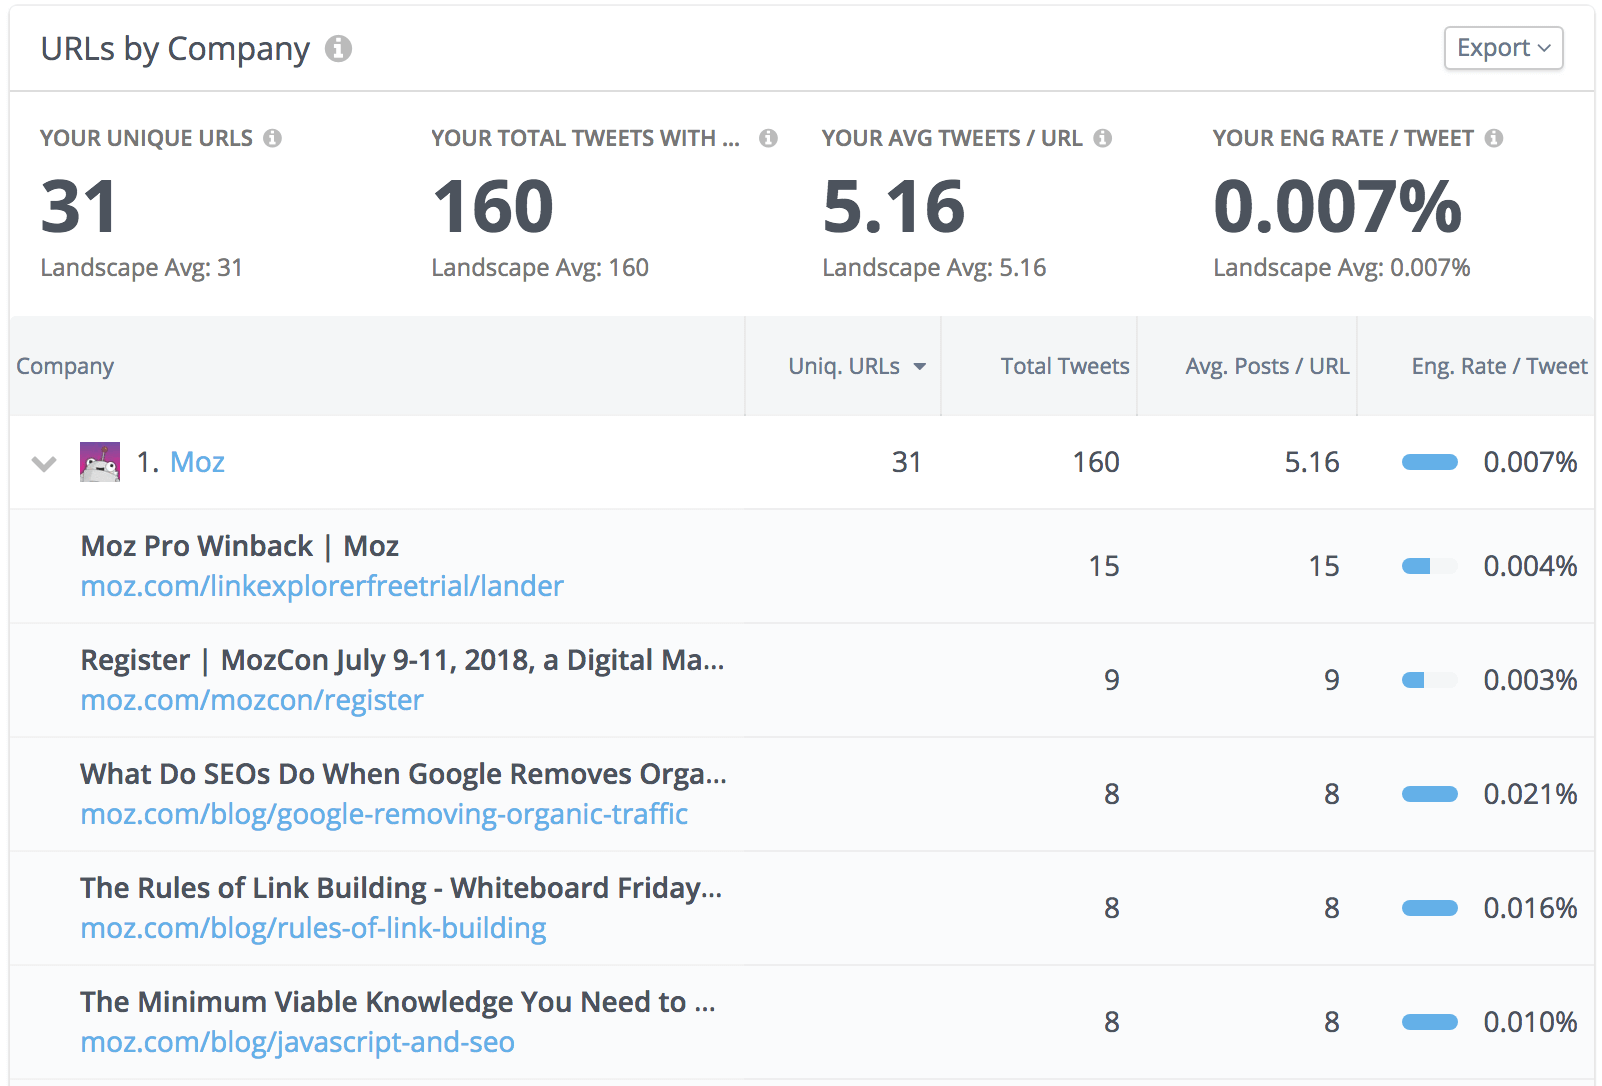
In the analysis above, Moz posted 31 different links in their Twitter feed in the last 30 days, and they shared those links across 160 total tweets. That means that on average, they shared each link about 5 times.
I’ll note that from a competitive analysis perspective, this part of the tool is very powerful at helping you find your competitors’ content focus areas. As you expand the data for each competitor, you’ll reveal their most important content priorities.
By expanding the Moz row in the tool, the links they shared most are revealed. Here, you’ll see that they shared a free trial landing page for Link Explorer 15 times in the last 30 days. Also, you can see that there were a number of other links Moz shared 8+ times, including a registration for the (always wonderful) MozCon.
Breaking down whose content you’re posting
Another part of the new Posted URL Analysis is helping you pinpoint your curation strategy on social. It’s tough to figure out which of the sites you’re curating are resonating most and if you’ve got a good mix of curated content. This Owned vs. Curated URLs analysis panel breaks down activity and engagement metrics to help you in your curation efforts.
In this section of the tool, you’ll be able to answer:
- What percentage of my posts featured links from third-party sites (i.e., curated, not mine)?
- How does engagement compare when I share links to my own site versus third-party sites (curated)?
- What pieces of owned/curated content perform the best?
- How does my curation mix compare with other companies in my landscape?
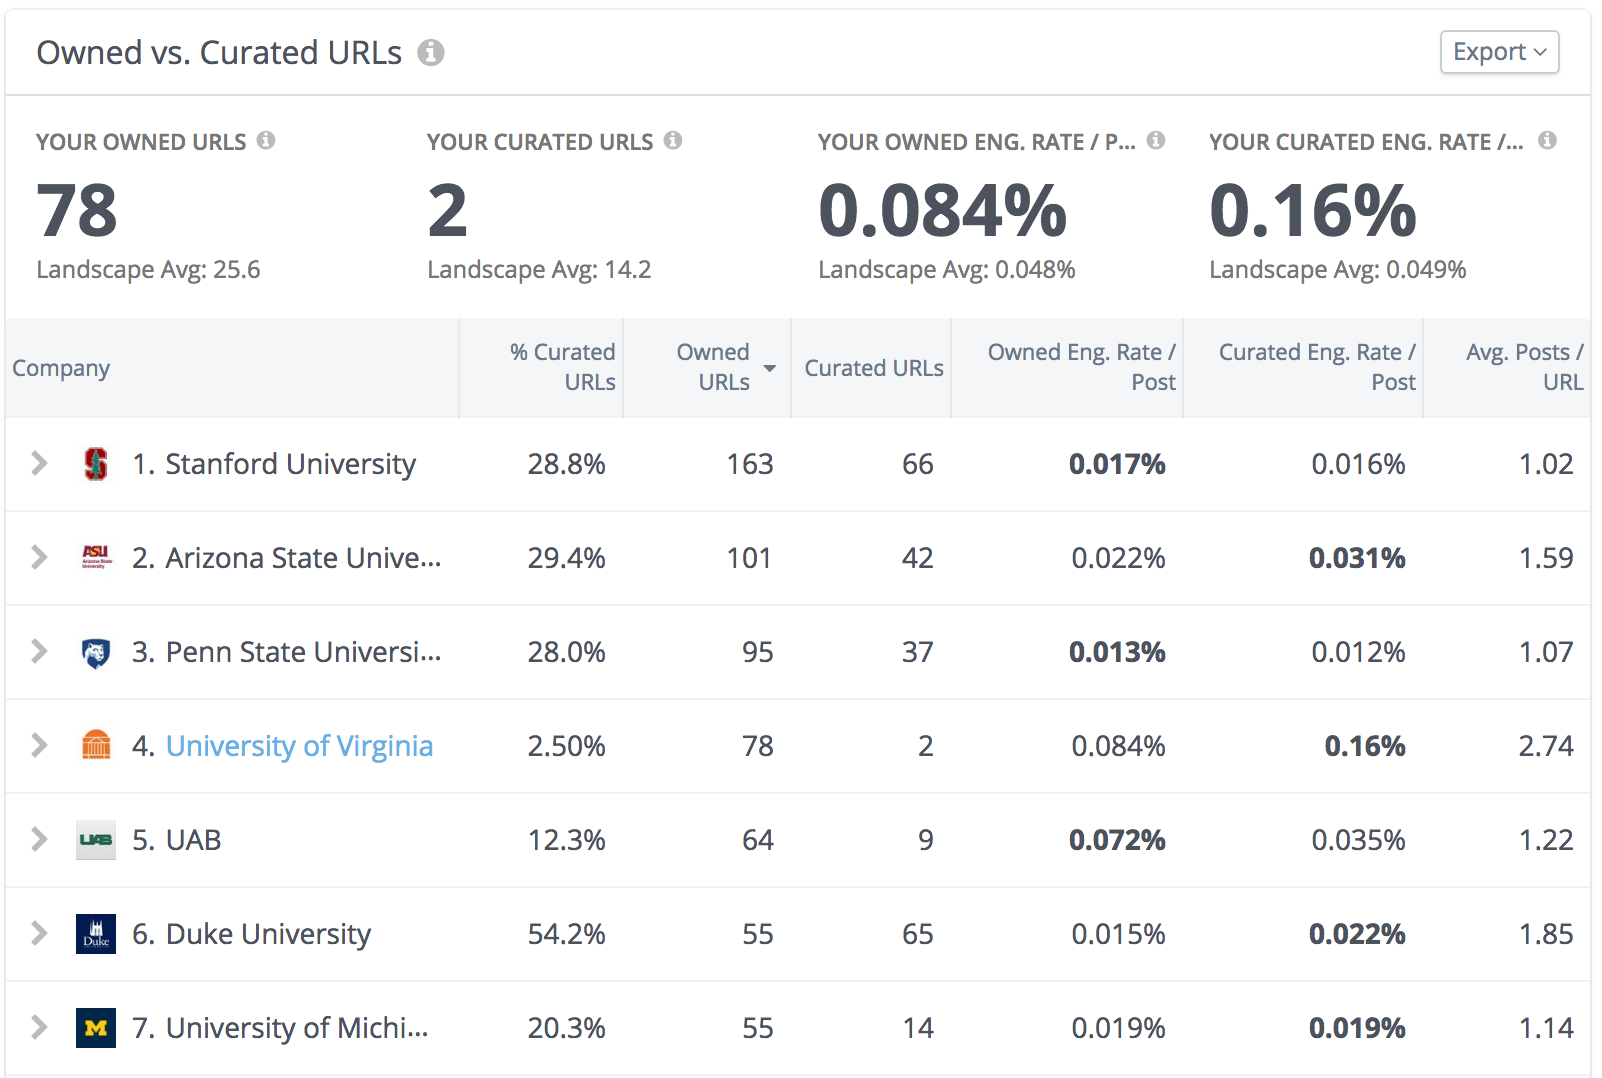
In this example, Stanford shared 163 links to their site on social in the last 30 days, and they shared another 66 links to other sites. Overall, that means 28.8% of the links they shared were curated from third-party sites. The next two schools in the list, ASU and Penn State, both had similar curation percentages.
Looking at engagement rates, ASU was one of three schools on this list that got more engagement on posts that shared curated links. Looking at the top of the panel, for this landscape overall, posts with links to curated content vs. owned content performed similarly, each with an average engagement rate/post of about 0.047%.
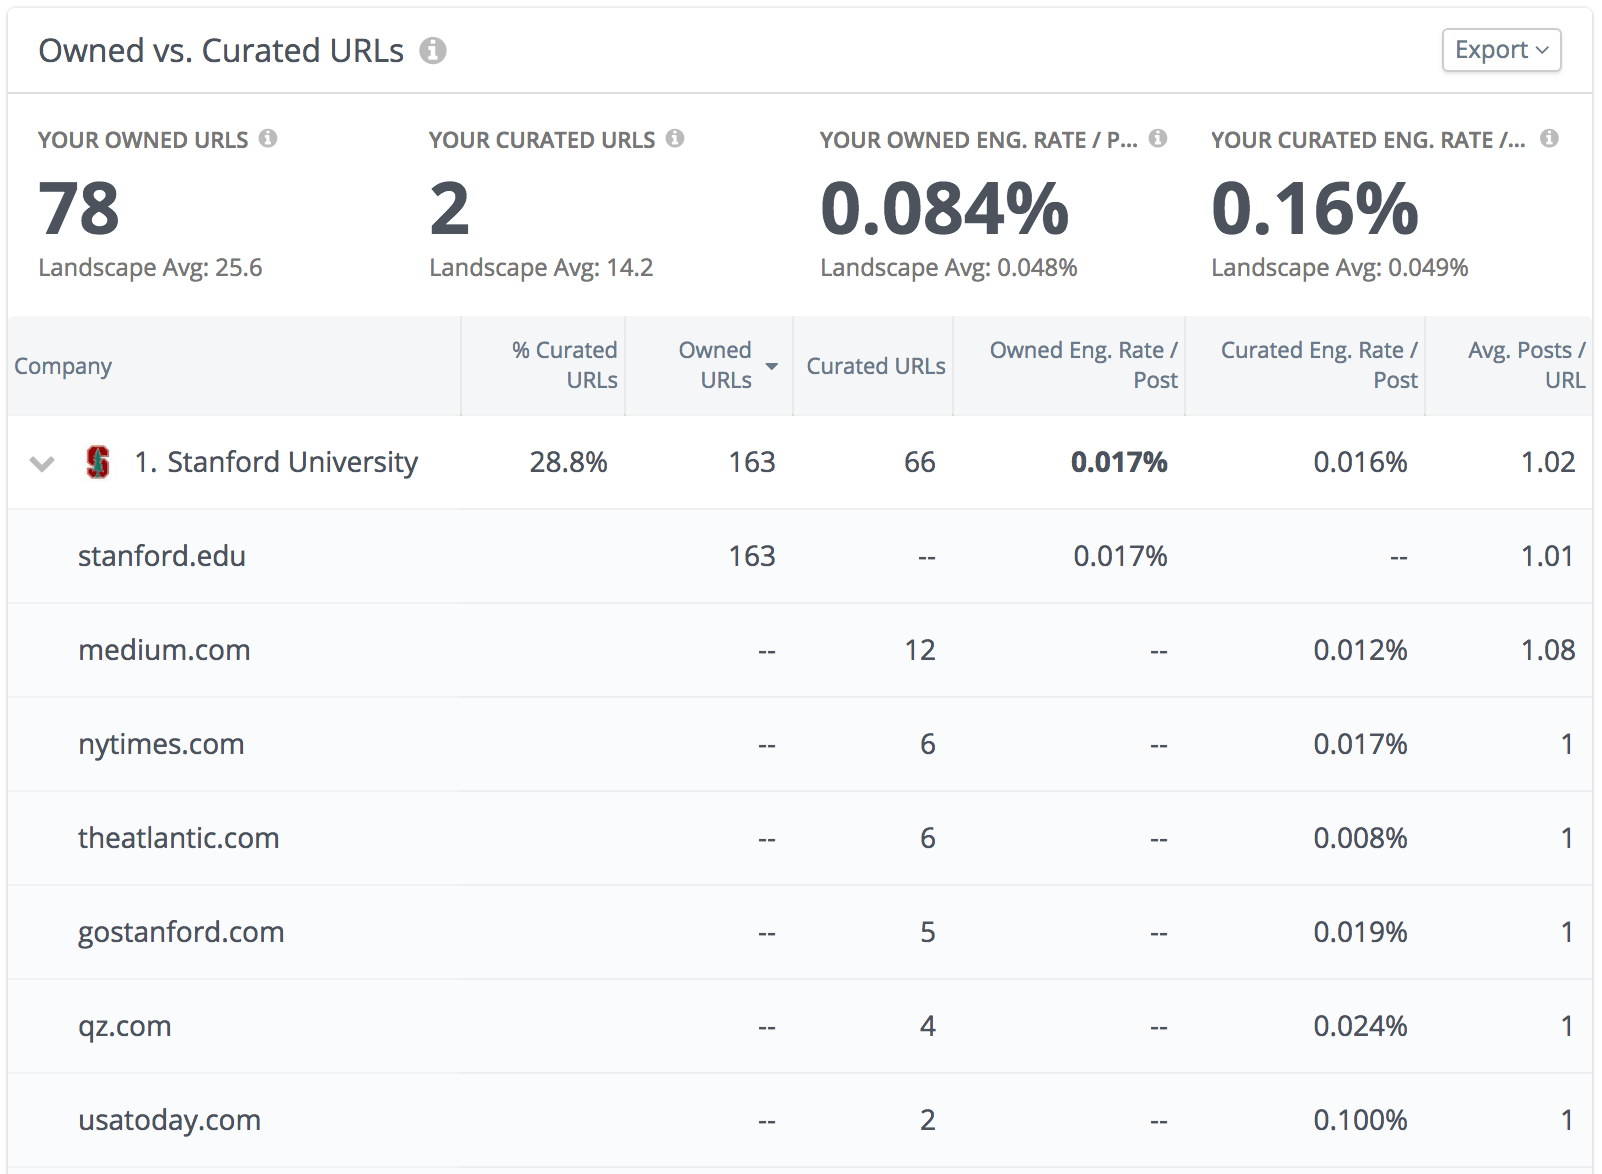
Expanding the row for Stanford reveals they like to share content from Medium, The New York Times, and The Atlantic. Each site had 6 or more links shared on a Stanford handle. Here, content shares from The Atlantic earned much less engagement than those from Quartz and The New York Times. A curious social media manager would dig into the topics and copy within each of these posts to understand further what is driving these numbers.
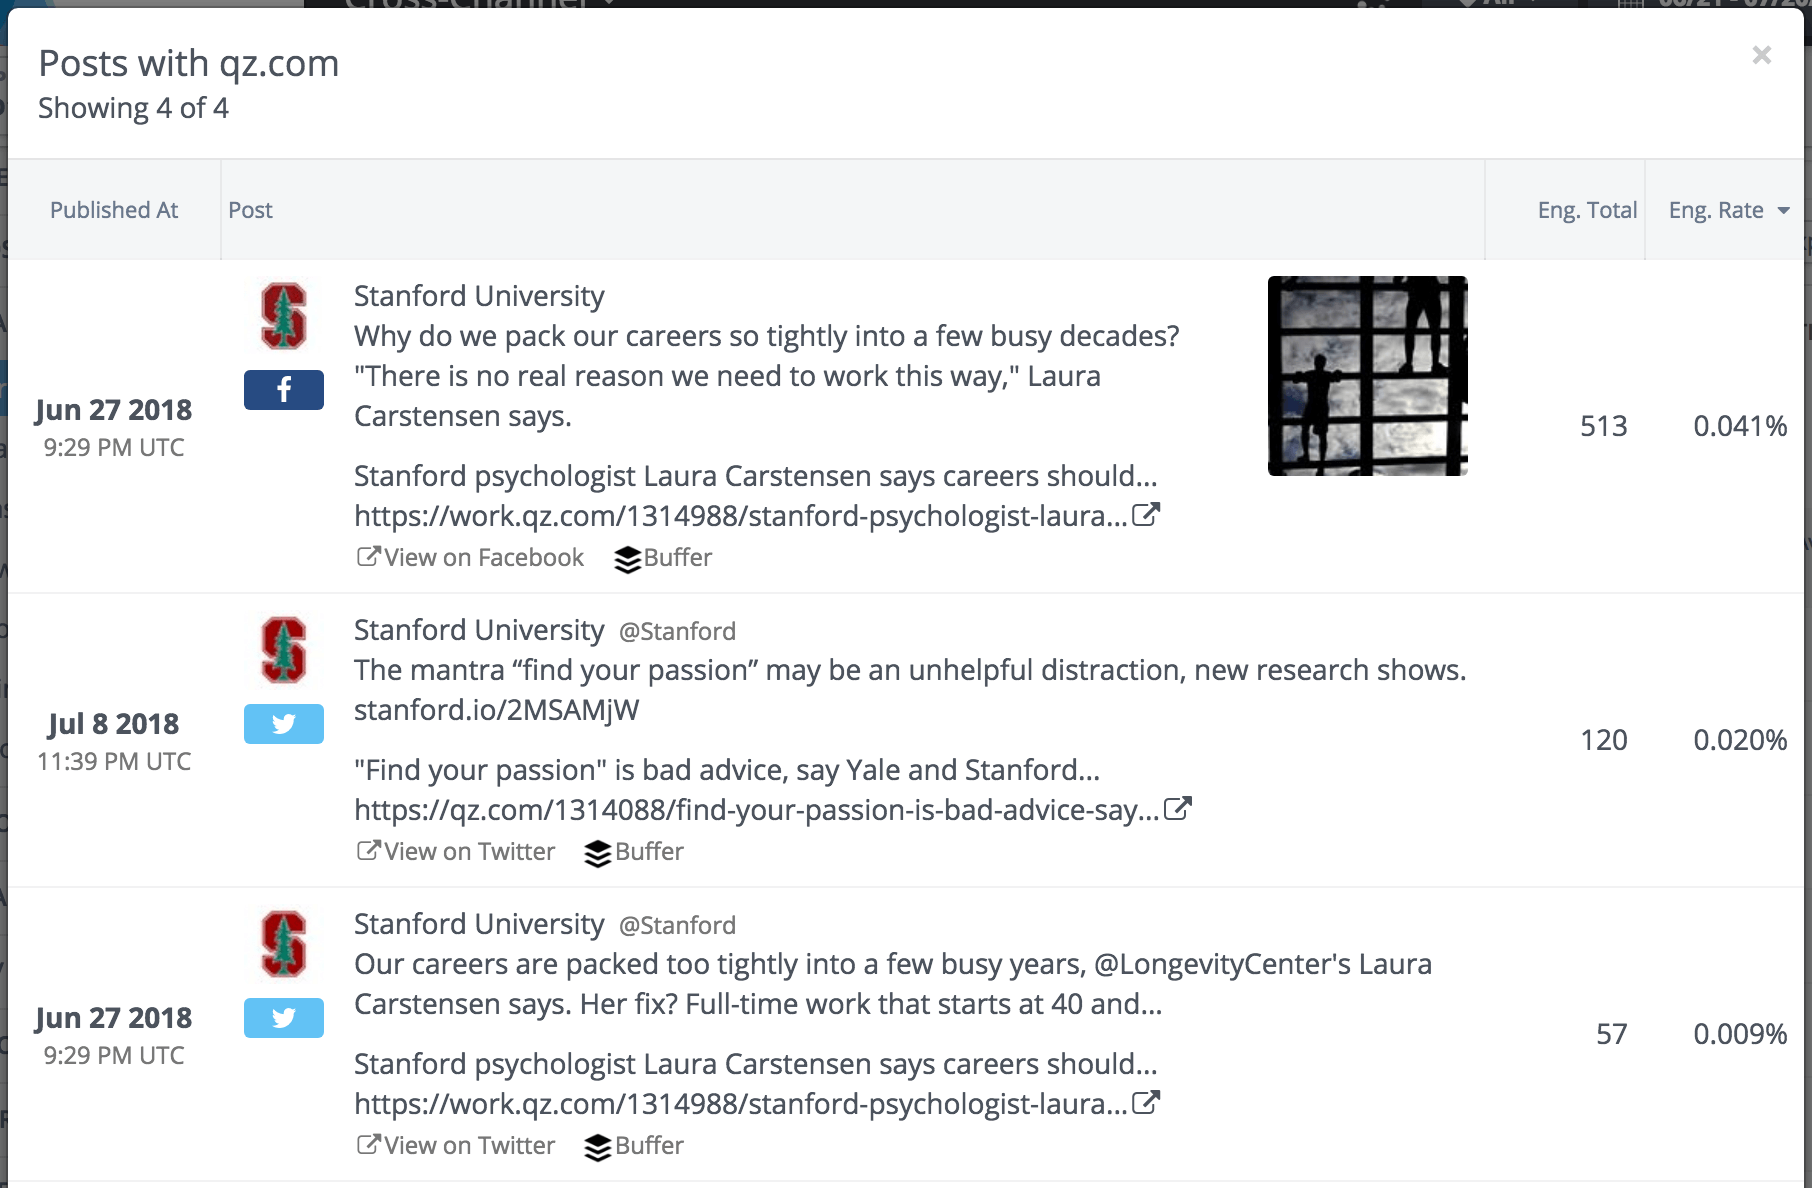
Clicking on any row in the analysis reveals the posts behind the numbers. By examining the topic, tone, and copy of the posts, you can uncover the why of your social performance. In this example, the Facebook post features the work of a Stanford psychologist on why we shouldn’t squeeze our careers into a few busy decades (editor’s note: it’s an interesting read).
Scouting new curation opportunities
Finding new content to curate into your social feeds can be challenging. You put a lot of time into finding quality, relevant content to share with your audience. The Posted URLs Analysis gives you an easier way to find the right content for you needs without constantly trawling the Twitter feeds of influencers in your space.
In the URLs by Domain panel, you’ll answer the following questions:
- What sites are most shared by companies or influencers in my landscape?
- What relevant sites are being shared in my landscape that I am not sharing?
- Which sites’ content earns the most engagement when shared in my landscape?
- Who in my landscape is sharing content from these most-shared sites?
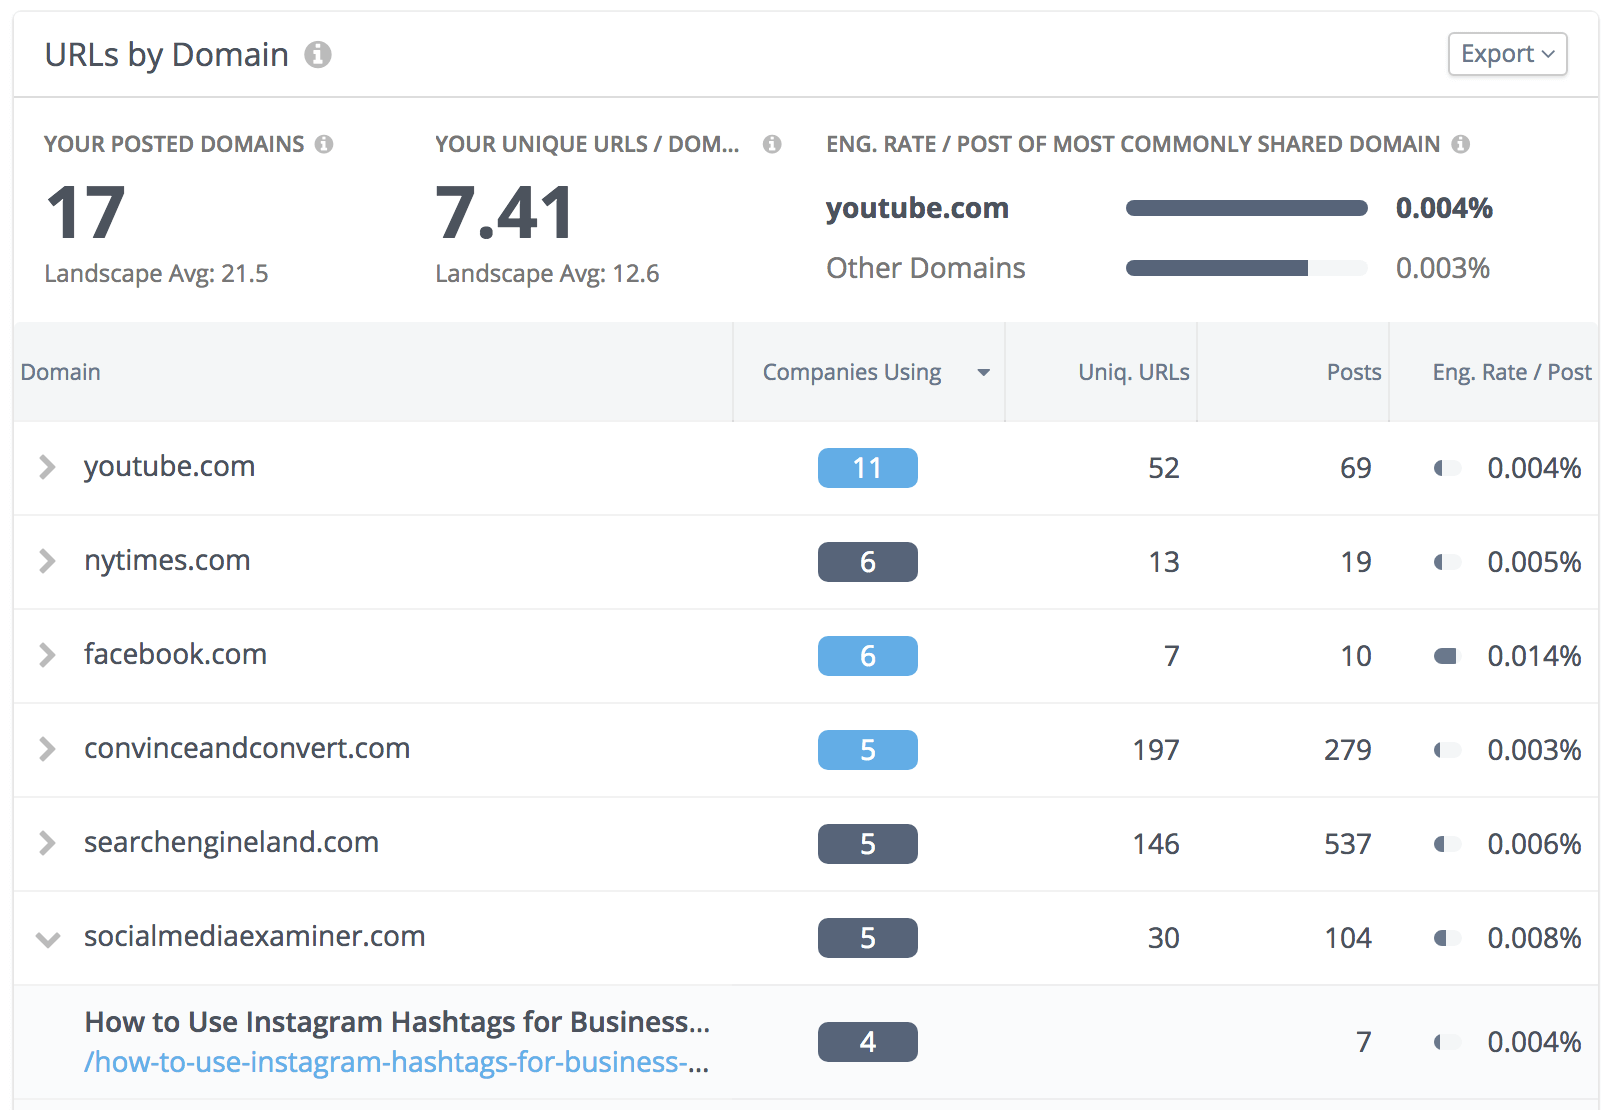
Here’s an example from a digital marketing influencer landscape, including folks you know and love like Ann Handley, Dana DiTomaso, and Aleyda Solis.
In this tool, you can see that the most shared sites on Twitter in the last 30 days from these influencers include YouTube and The New York Times. The bright blue pills show us which sites we’ve shared from ourselves (in this example, “we” are Jay Baer. Hi Jay!).
Expanding any row uncovers which links from each of these sites were shared, how many times, and most importantly, how much engagement we see on any posts that shared the link.
By using this tool, you’ll be able to find highly engaging sites and content to share with your audience.
Filter your search using keywords, a single URL, or a domain
In the Social Posts tool, you’ve always been able to filter your analysis using keywords and hashtags. With this release, you can now filter your search to a single URL, a URL pattern, or a domain. Making it easier to measure the success of a single campaign by focusing your analysis.
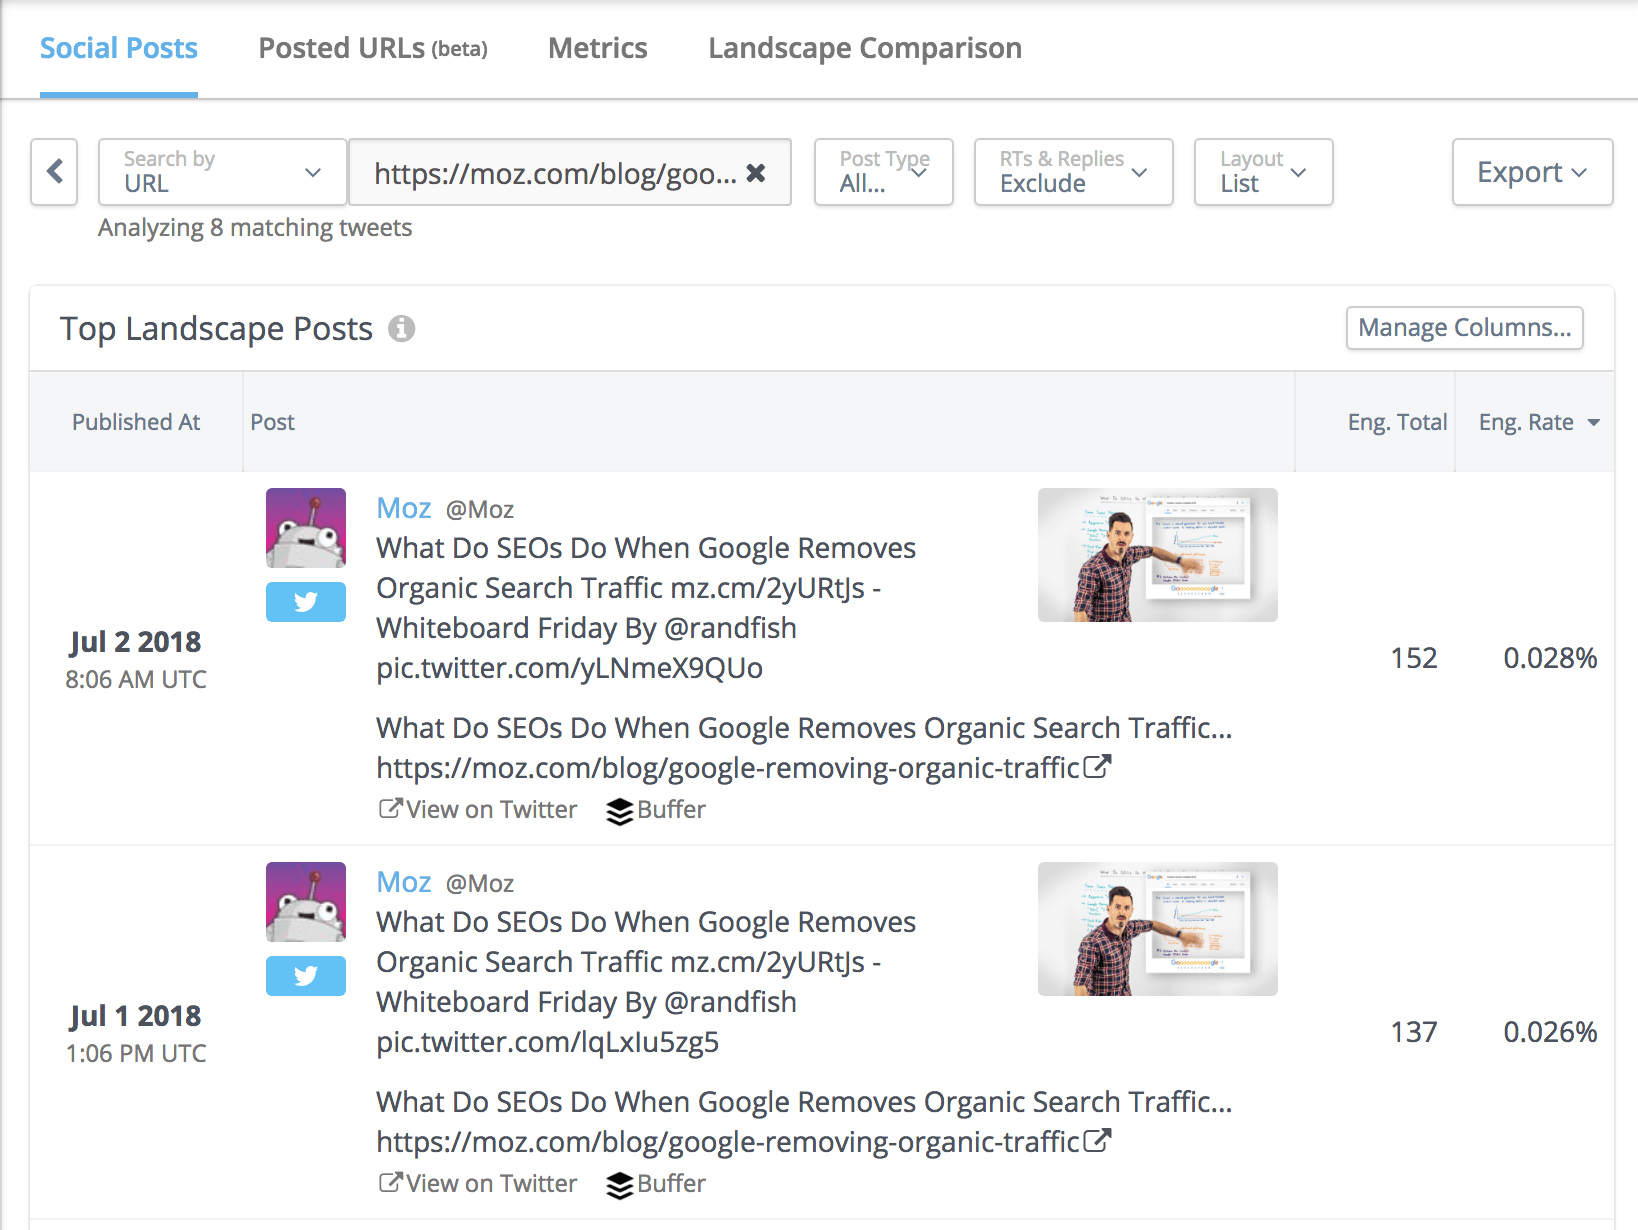
In the above example, I’ve pasted a single URL into the Social Posts search box for a recent Whiteboard Friday from Moz that they shared 8 times in the last 30 days. In this way, you can dig into the details behind the shares that drove success.
Was there a particular channel where you found success? Did a certain bit of imagery or copy make the difference? Posted URLs Analysis will bring together all of the data related to shares of that single URL to get clear answers to these questions.
Ready to Transform Your Content Promotion Strategy?
These new Posted URL Analysis tools are live in Rival IQ and available to all current subscribers. If you haven’t tried Rival IQ yet, you can give this a spin along with our collection of analytics tools to help you improve your social media engagement and grow your followers.
If you’d like to have a live walkthrough, check out these two webinars where we show off these new tools and how you can use them to improve your strategies’ effectiveness.
Analyzing Your Content Promotion on Social
Follow That Link: Insights for Better Content Curation