We Know You Need Data Fast!
Marketers constantly need to show how they are positively impacting the business with clear metrics and reports, so they need marketing analytics tools that enable them to access, analyze and create reports quickly and easily. One of Rival IQ’s competitive advantages is our on-demand export of analytics to PowerPoint and other formats.
Our customers love this capability but wanted more! They asked us to create a section of the application where they could put their favorite charts all in one place. Sort of a personal dashboard of their most frequently used Rival IQ analytics. Also, while customers have loved the ability to slice and dice the data interactively on Rival IQ, they asked us to make these customized data sets easier to create and export to PowerPoint.
Rival IQ launches Favorite Charts & Custom Charts
Today, we launched two new report features: Custom Charts and Favorite Charts.
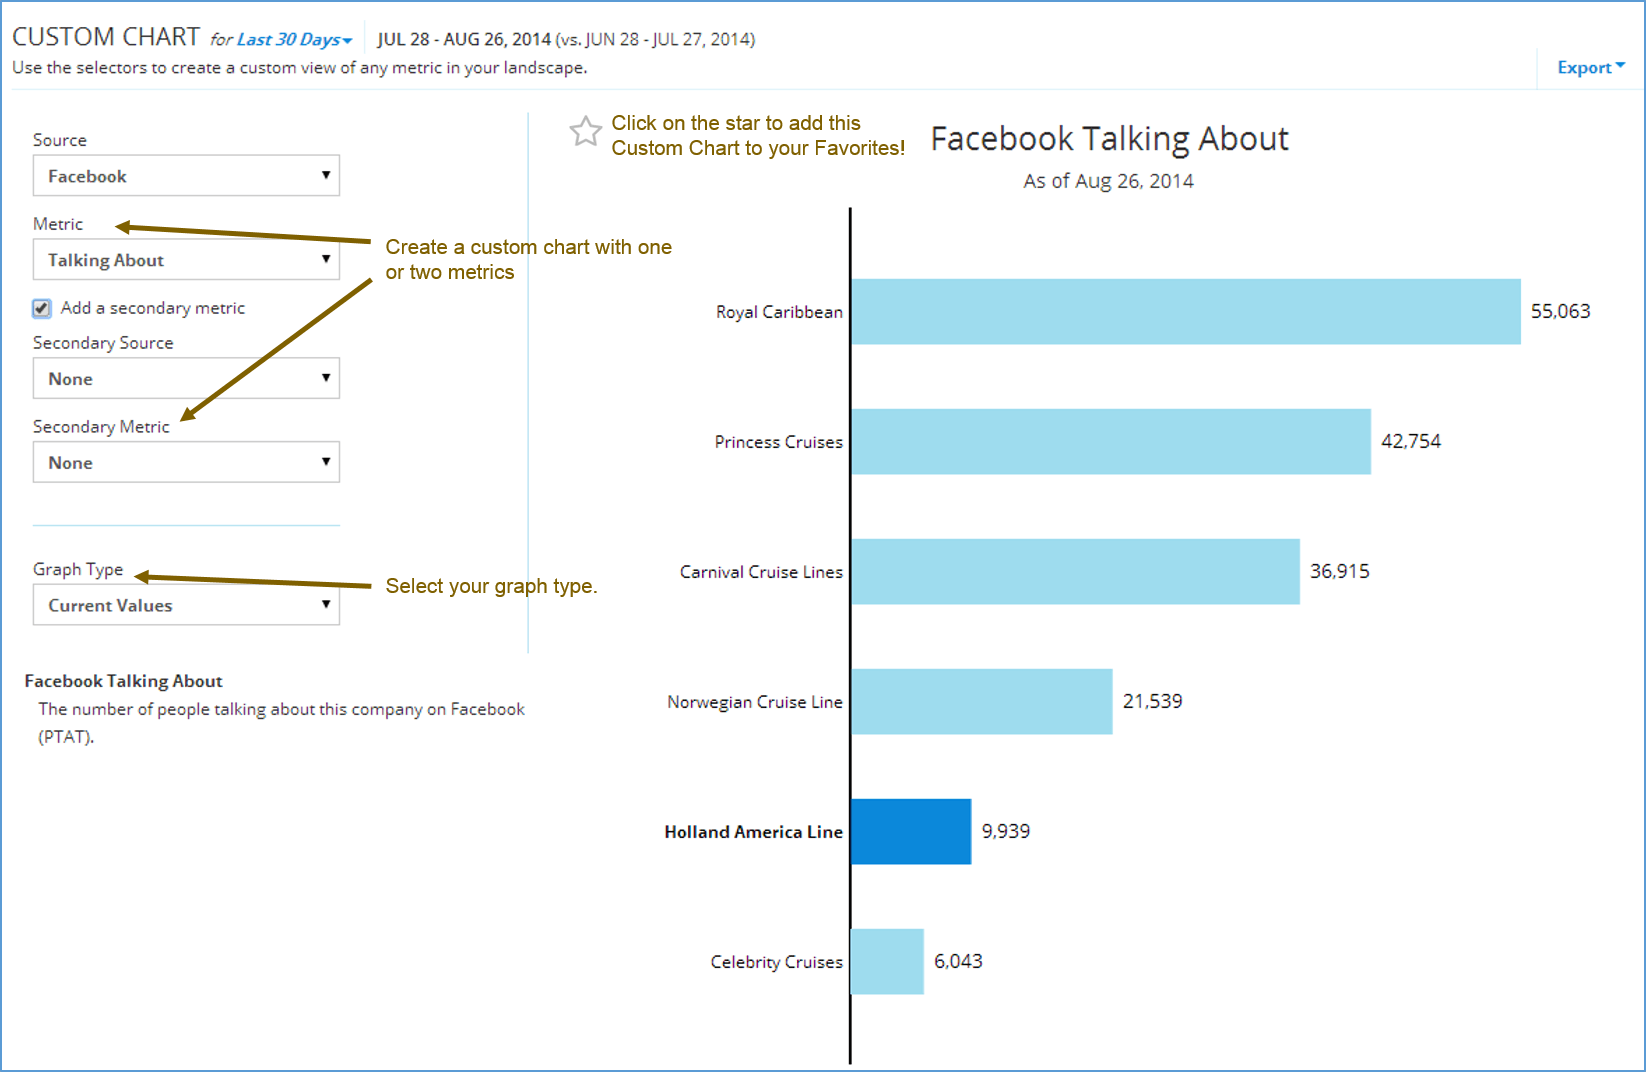
Now, customers can easily create Custom Charts with one or two data dimensions in a matter of seconds, and then export those charts to PowerPoint, CSV, PDF or PNG. Custom Charts can be created with data from six social networks, Twitter, Facebook, LinkedIn, Google Plus, YouTube and Instagram, as well as Web domain authority and links.
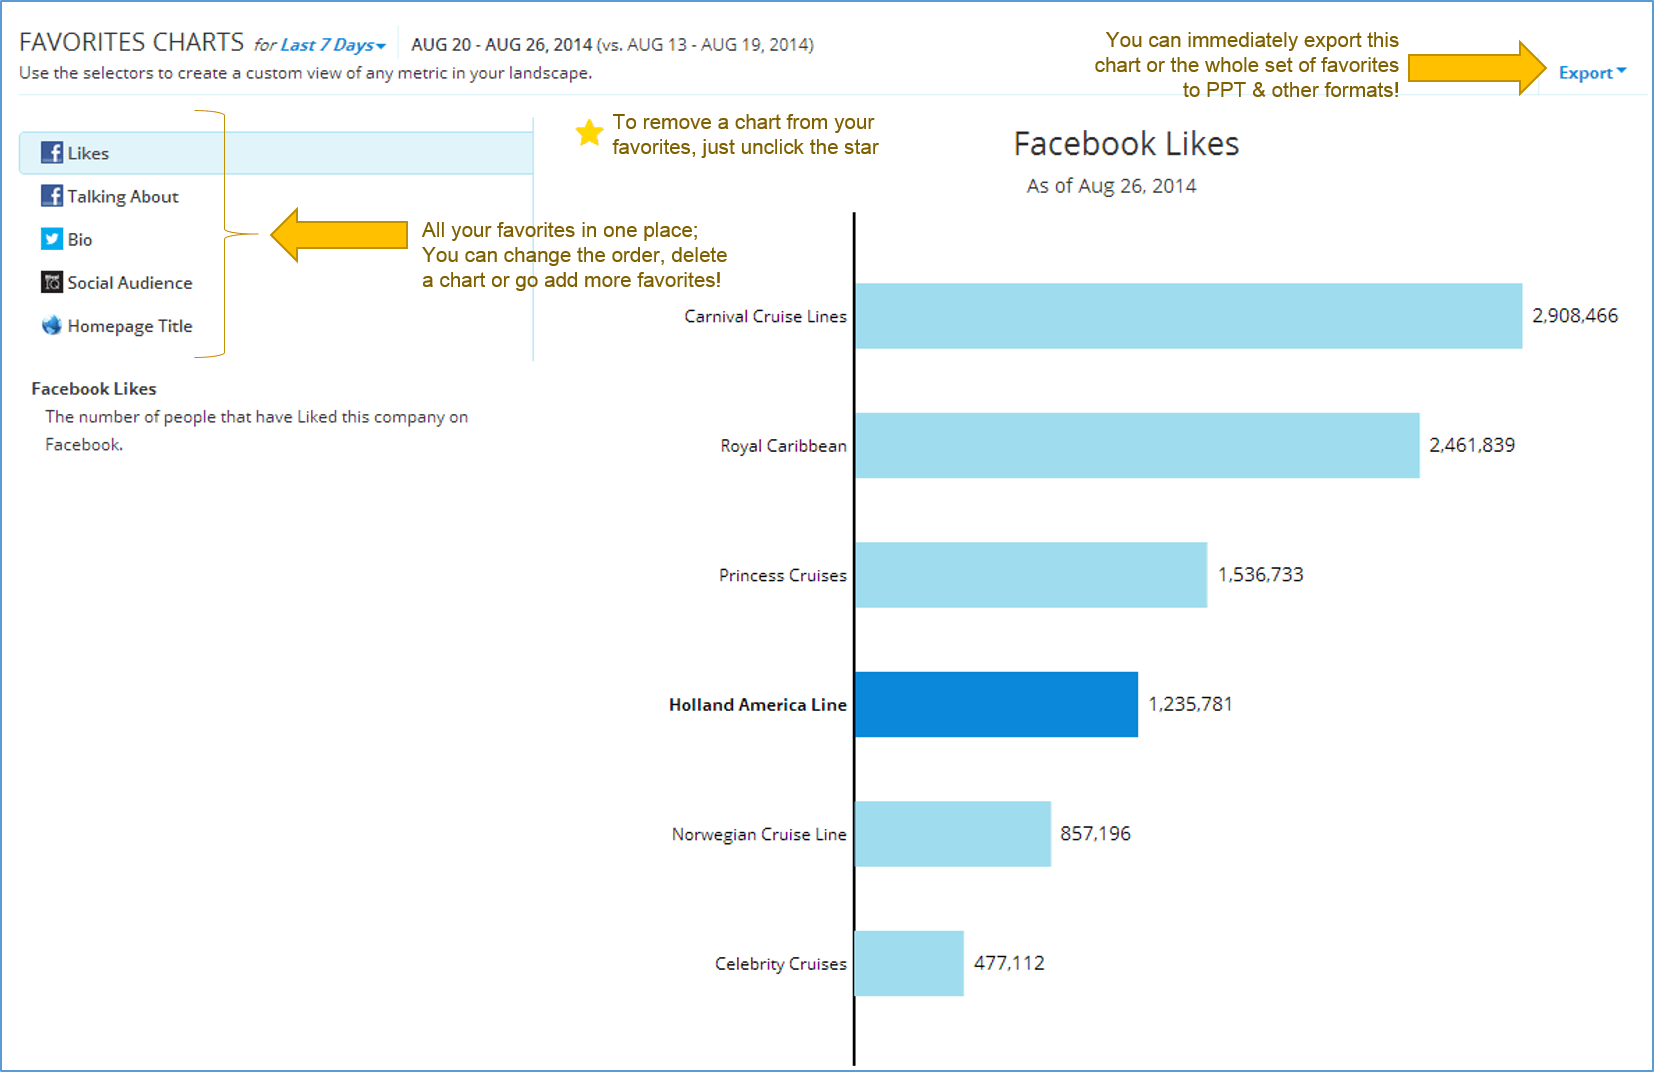
The new Favorite Charts enables users to easily select any Detailed Metrics chart or a Custom Chart to create their own set of reports, accessible all in one place. A user’s Favorite Charts can be immediately exported one by one or as a complete set to PowerPoint or other formats. Charts can easily be added to or removed from the Favorite Charts list with a click of the mouse.
Both new Chart features provide analytics for a competitive landscape of companies, so a user can track both their own organization and their top competitors.
How to use the New Charts on Rival IQ
1. Go to Detailed Metrics section of the application: This is the section of Rival IQ where you can dig into analytics across six social networks from audience to activity to engagement to social positioning. There are also reports on domain authority and Website links, and now, these new Custom and Favorite Chart sections!
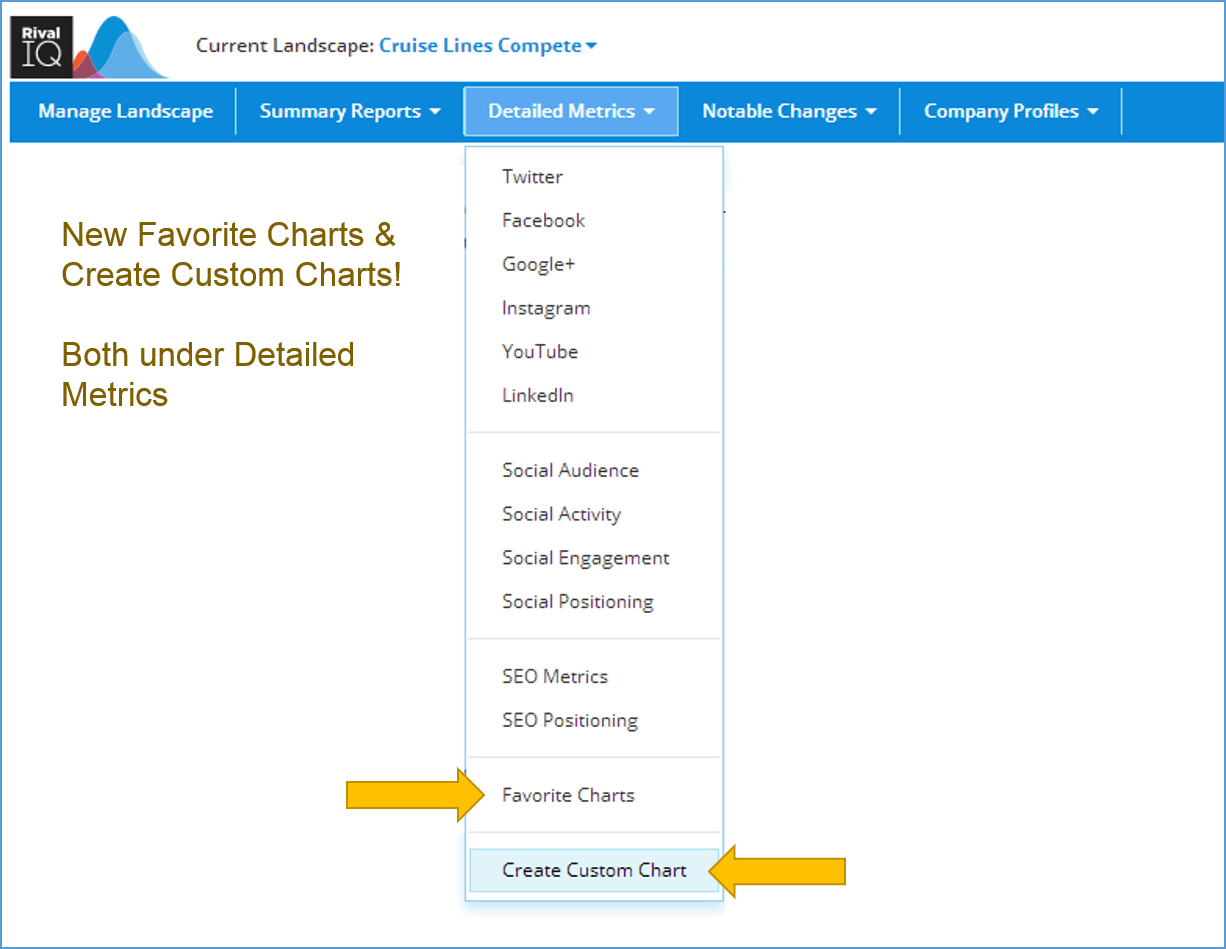
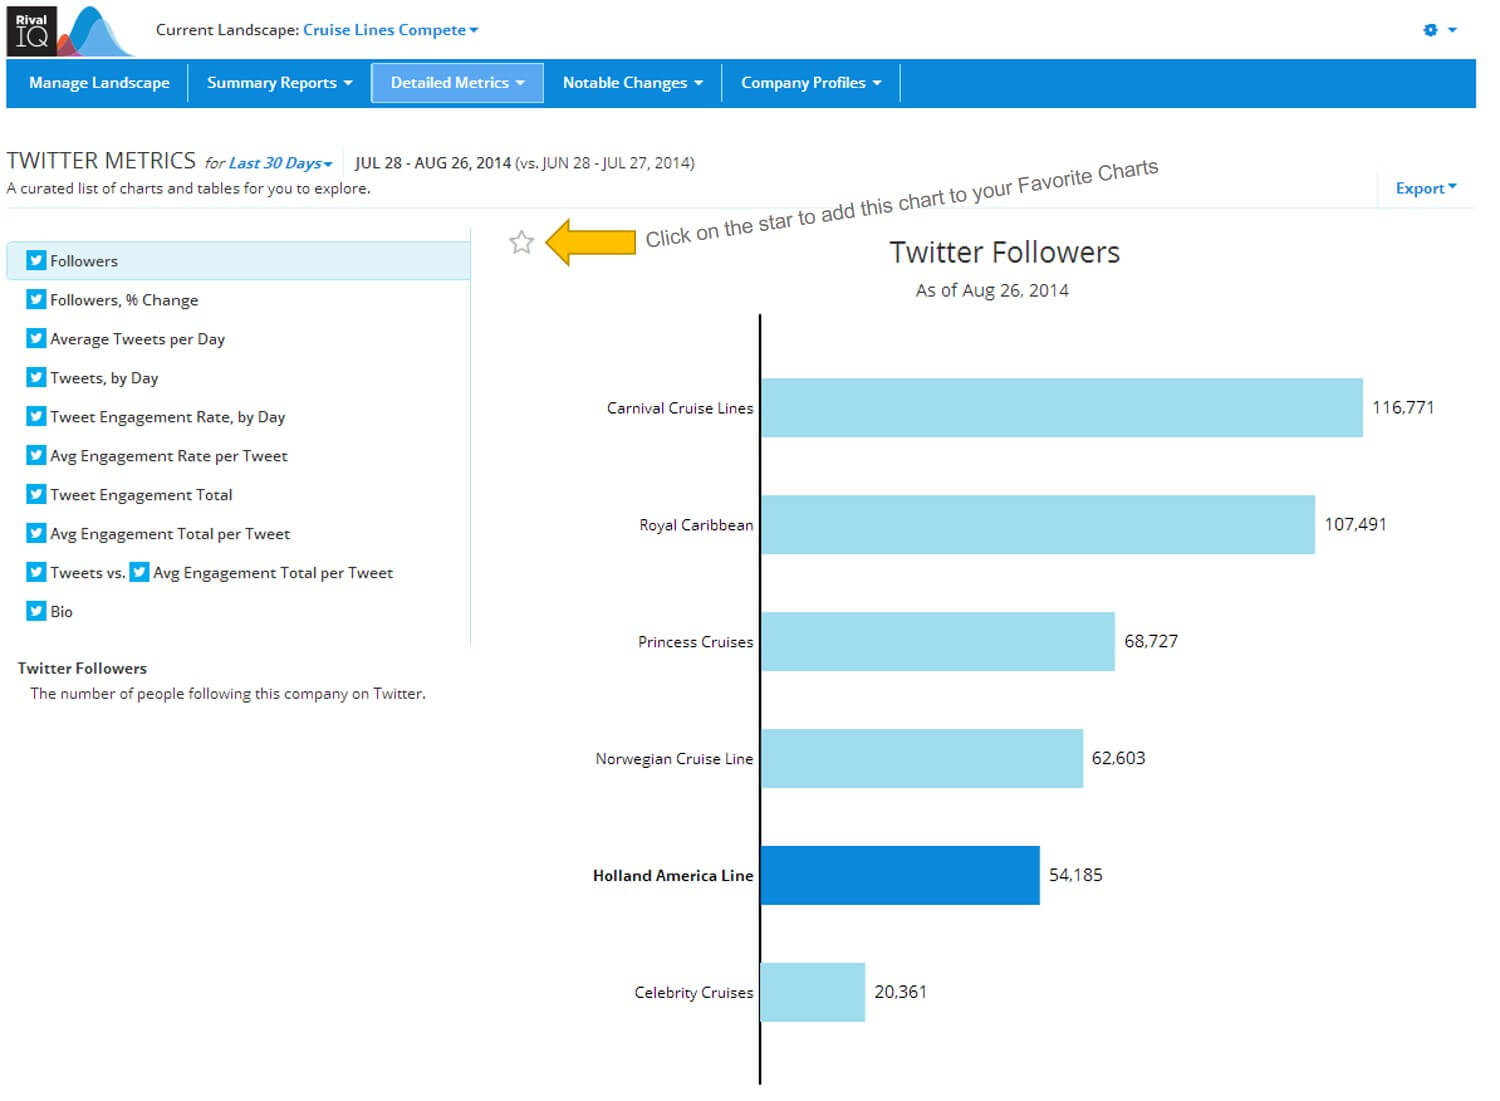
2. Go to your favorite Detailed Metrics section and add a chart to Favorites! I like starting with Twitter analytics! Next to every chart is a “star” icon. If you want to add a chart to your Favorite Charts, simply click on the star icon. It will go from a gray empty star to a filled-in gold star!
3. Go to Favorite Charts and explore your list of favorites! You’ve created your first set of Favorite Charts. Add as many charts you want to this list. Move the charts around to group similar charts together or delete charts you don’t want anymore. Once you set up your favorites, bookmark that page, and make that your first stop on Rival IQ each time you log in!
4. Create a Custom Chart with your own data dimensions! Sometimes one dimension is just not enough, and we know some of you love to geek out with your data! With Custom Charts, you can pick your source and metric and graph type. For example, maybe you want to compare number of tweets and average engagement. Play with the charts all you want, and when you create one that’s a keeper, simply click on the gold star and save it to your favorites so you don’t lose it!!
Making Comprehensive Digital Marketing Analytics Fast, Easy and Competitive!
These two new charts build on Rival IQ’s comprehensive analytics capability, which delivers social performance across six networks, SEO keyword rankings and Website content – all with competitive context.
Custom Charts and Favorite Charts are available to customers today as part of all monthly subscription packages. Our free trial users also have complete access to these new charts.
Keep the great feedback coming!
This is another example of how we listen to our customers and deliver analytics in the way they need to be successful. We welcome ongoing customer feedback on these features and the product overall.
Send your ideas to support@rivaliq.com!