As a social media marketer, you have myriad demands on your time. This spring, we’ve focused on launching several new features to simplify using data in your day-to-day social media work.
In this release, you’ll see a number of additions to our Instagram Insights and LinkedIn Page Analytics. Plus, we’ve added a fantastic new Social Posts preview to speed your research and auditing capabilities.
And, we have an exciting new beta release of Popular Topics, a textual analysis of the social content in your landscape.

Walk through all the new features with Product Manager Tiffany Lin.
Watch the recorded webinarMore Effective Instagram Promoted Posts and Simplified Stories Reports
Instagram is an important channel for showcasing your brand, company, and products. Social users have a lot of attention on Instagram right now, and with the resources of Facebook at its back, Instagram will continue to innovate. As the platform expands its capabilities, we have even more features and analytics in Rival IQ to help you optimize your Instagram investments.
Promoted Posts Insights
Finally, there’s a way to measure your Instagram post promotions in Rival IQ to help you make the most of your ad budgets. With this feature, you have access to organic and promoted metrics for your Instagram posts. We provide all of these post-level metrics you’d expect with organic/promoted breakdowns including engagement, likes, comments, reach, impressions, and video views.
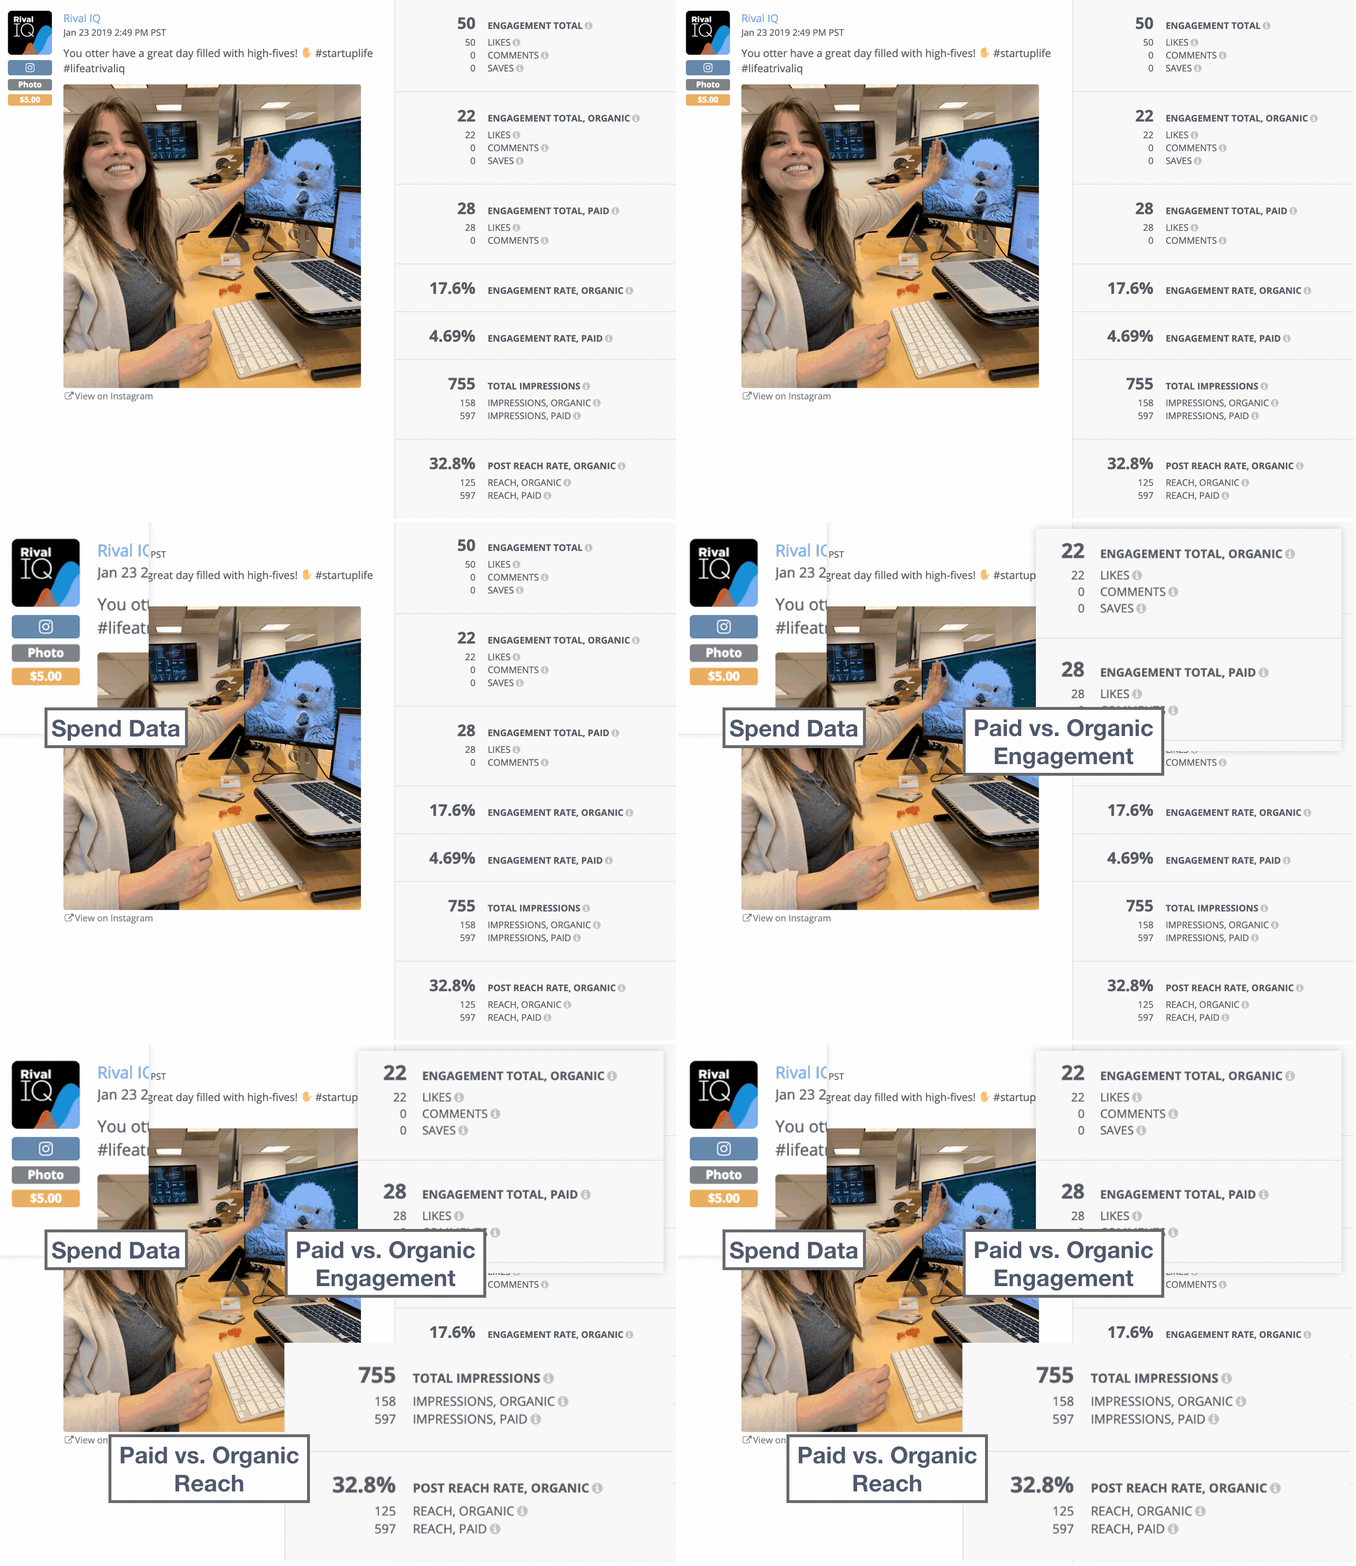
Promoted Posts Insights Brings Organic And Paid Metrics Together in One Place
Stories and Posts Metrics, Now in Custom Dashboards
With this feature, you can report on metrics from Instagram Stories and Posts in your Rival IQ Custom Dashboards, including post and Story reach, post and Story reach rates, Story retention, engagement, and more. In Custom Dashboards, you’ll have access to aggregates of these new metrics as well.
To help you build your Custom Dashboards more quickly, we’ve created two new dashboard templates for reporting on the performance of your Instagram activities. If you haven’t used templates in Custom Dashboards yet, they’re pre-built, customizable reports that give you a strong starting point for designing exactly the reports you need.
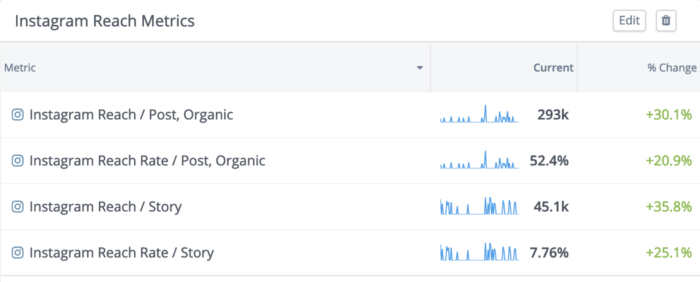
A wide range of Instagram Post and Story Metrics are Available in Custom Dashboards
Easily Measure Video Performance on LinkedIn
Marketing on LinkedIn continues to be a powerful, though perhaps underused, part of the social media marketer’s playbook. As many professionals spend time on LinkedIn, there’s an opportunity to capture some of that attention to bolster your brand. To help your LinkedIn reporting and analytics efforts, we’ve added new LinkedIn Page Analytics features, too.
Video Update Analytics
With this release, you’ll now get video update posts along with the rest of your LinkedIn analytics, and we’ve included new native video metrics such as views and minutes watched.
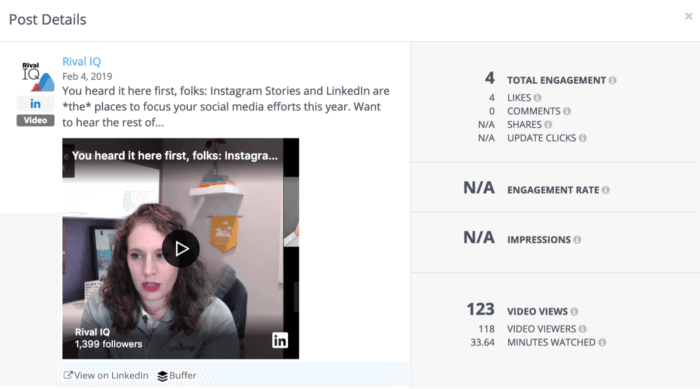
LinkedIn Video Updates Include Engagement, Video View, and Minutes Watched Metrics
LinkedIn Update Metrics, Now in Custom Dashboards
To help you build your Custom Dashboards more quickly, we’ve created a new dashboard template for reporting on the performance of your LinkedIn marketing activities.
We’ve also added additional LinkedIn metrics to your Custom Dashboards, including post reach/impressions, engagement, paid vs. organic follower adds, and more.
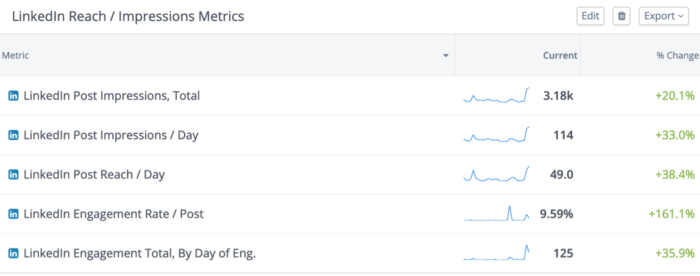
LinkedIn Reach & Engagement Metrics in Custom Dashboards
Quickly Review the Posts Behind the Numbers
It’s spring, at least in the Northern Hemisphere, and we’ve been excited to do a little bit of in-app spring cleaning as well.
Social Posts Preview
In Social Posts, we’ve added a new preview to every table that reveals the actual posts behind the numbers. For example, in the Hashtag panel, when you see that a particular hashtag has high performance, just click the row. We’ll instantly pop up a preview showing exactly which posts are driving that number.
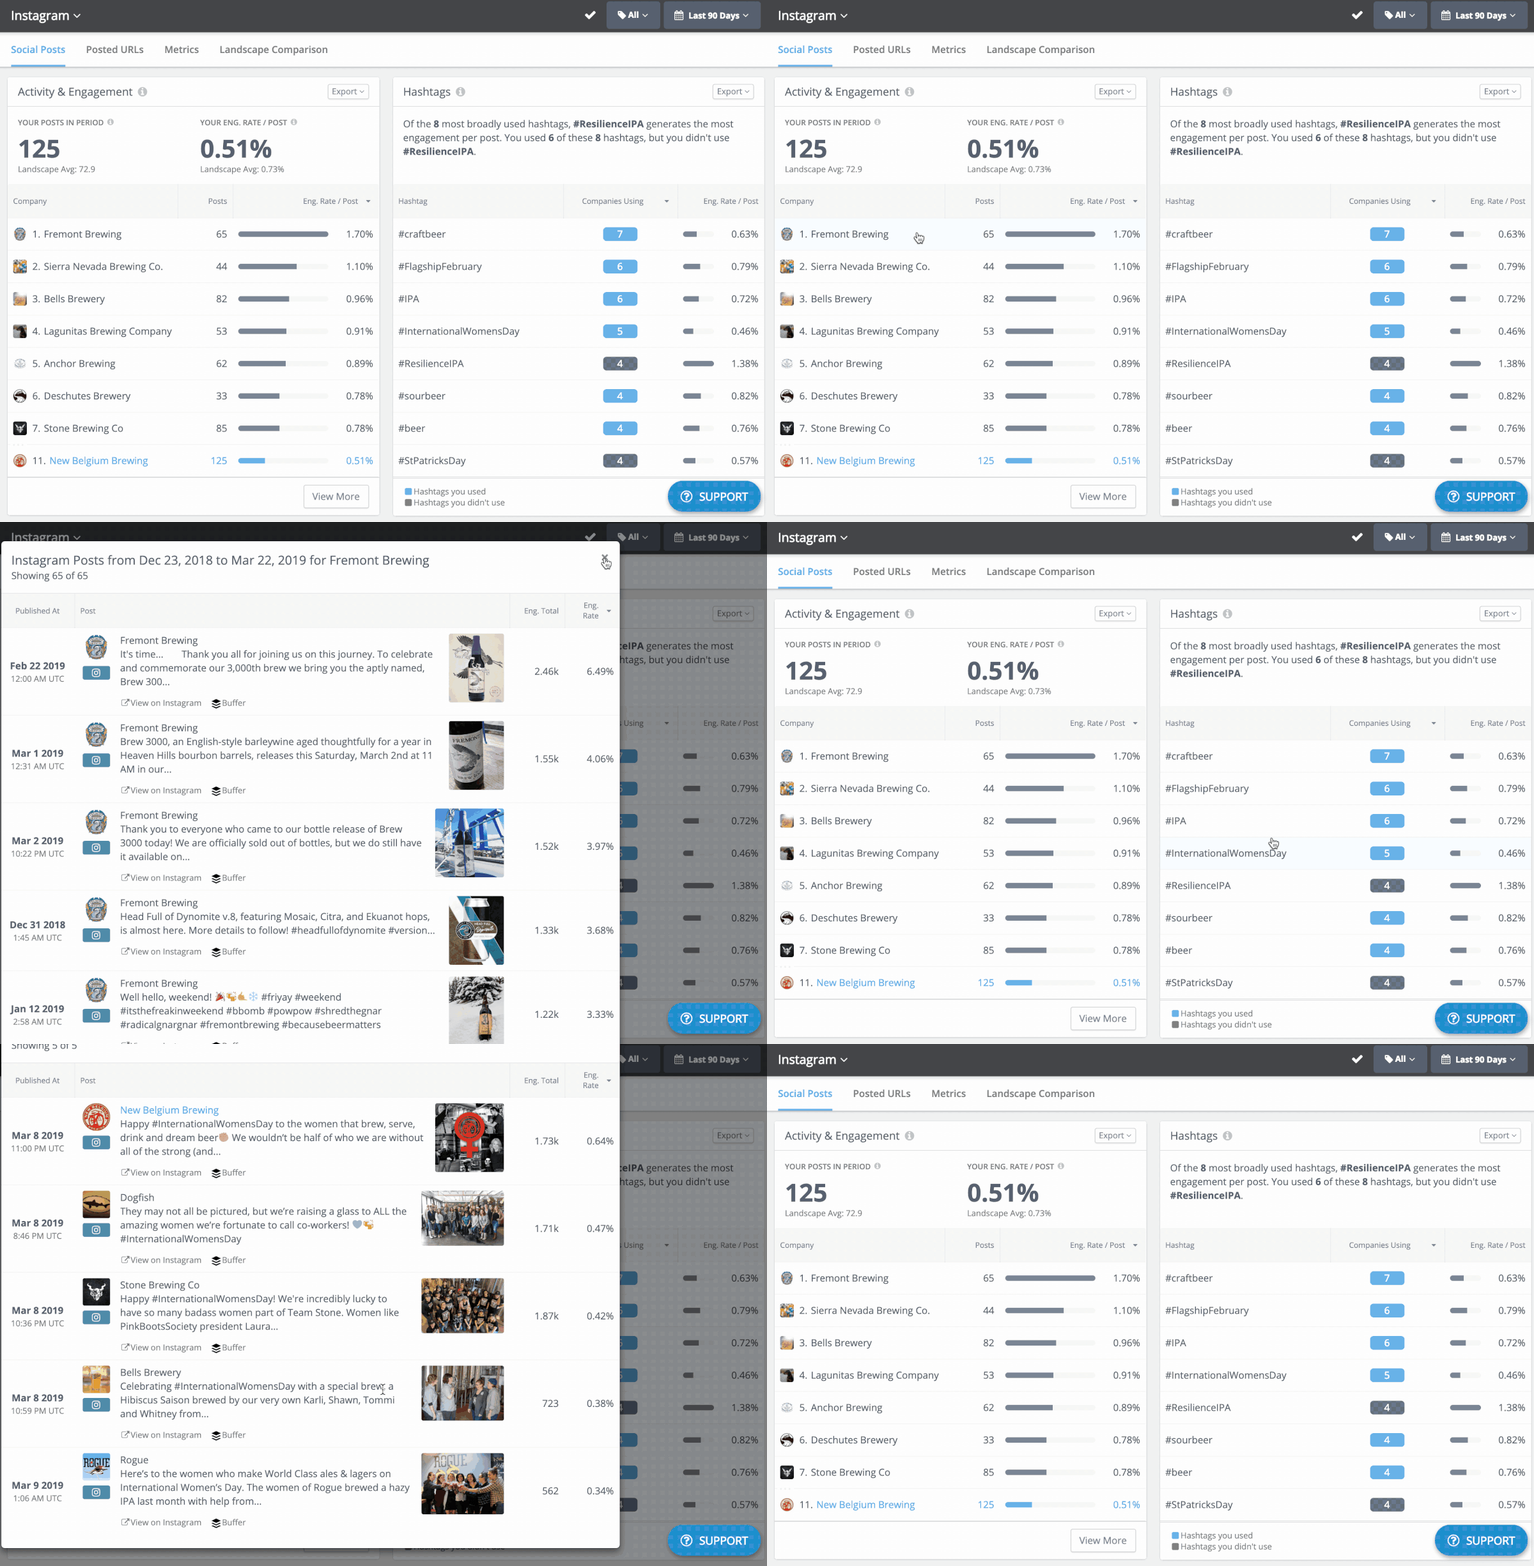
Social Posts Preview Makes Digging In A Breeze
Updated Side Navigation
We’ve streamlined the side navigation for our social-related product areas. We have two goals with this change. The first is to bring the core social functions of Rival IQ together. Second, we wanted to help our customers understand the differences between the public, competitive data we provide, and the private, more detailed data that pertains only to presences you manage.
Now, you’ll find both types of data in the “Social Analytics” area of the product, with two subsections, “Competitive Public Data” and “Your Private Data.”
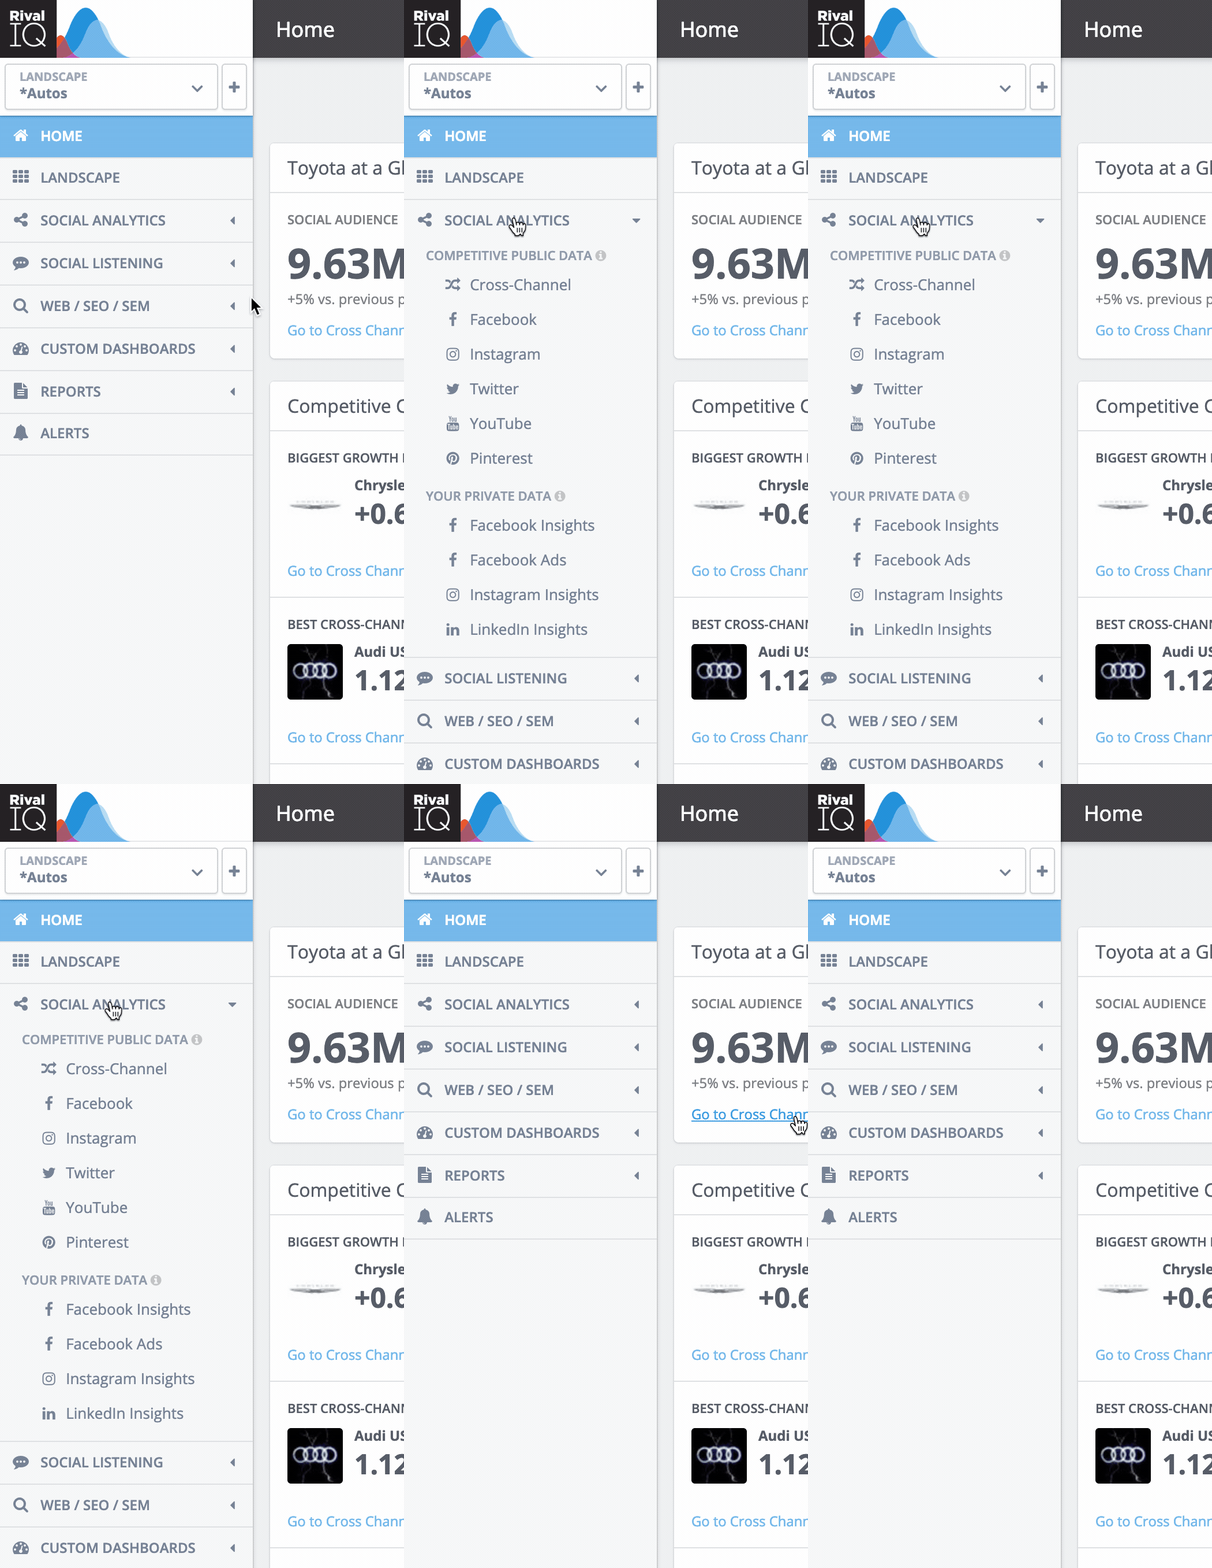
Social Analytics All In One Place
Uncover Popular Topics in Your Landscape’s Social Content
Part of understanding the performance of your social content is understanding the words and topics contained within your posts and how they affect your engagement.
With our new beta feature Popular Topics, you’ll have the power of our natural language processing, helping you discover commonly used topics in your landscape and whether you also use them. You’ll also easily find the most engaging topics and which competitor is discussing them.
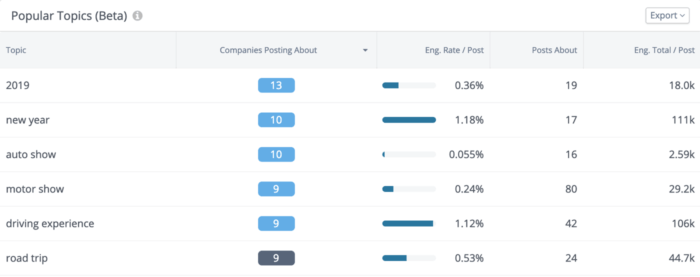
An Automotive Industry Example: Discover popular topics in your landscape and how they perform.
If you’ve used the hashtag analysis features in Social Posts, you’ll find that these new beta features work similarly. For each topic that we extract, there are sortable metrics for the breadth of usage, average engagement, and post counts, among others.
This feature is still in early beta, so we’d appreciate any and all feedback you have! Send us a note on Intercom , email to support@rivaliq.com, or via Twitter.
Looking to Learn More?
If you’d like to find out more about any of the new features we’ve launched this spring, you’re in luck! We have a collection of resources that are here to help.
- Register for a live webinar on April 2nd with Tiffany Lin, Rival IQ Product Manager, as she walks through each of these new features and takes your questions.
- Read the Instagram Promoted Posts Getting Connected Guide.
- Ask our Customer Success team a question.
You’ve made it this far: now march on into Rival IQ, and have a look for yourself!
