“Marketing is no longer about the stuff you make, but the stories you tell.” – Seth Godin, author, marketer, entrepreneur
Telling your story with data happens well when you’re able to gain insight. Without insight, your data can act as fluff. At Rival IQ, we don’t like fluff. You shouldn’t settle for fluff either. Your data should be actionable and easy to read. With each new feature, we get you closer to the action.
Today we released a set of new features in Rival IQ that change the way you experience your data. You’ll be able to spot trends and outliers with new visualization tools.

Together these new Rival IQ features:
Enhance your story
Create captivating data visualization with layers of data that help your audience understand and gain insights.
End the copy-and-paste nightmare
Transform reports for your unique needs within Rival IQ, changing the way you see and experience data.
Spot trends faster
Maneuver through big data sets with ease, identifying key points on sight with social post visualizations.
New Feature Lineup:
Post Grid Layout
You now can view social posts images in a grid pattern. This grid view allows you to spot visual trends and outliers in social posts. Like other layouts, you can sort by different metrics including the engagement rate, engagement total, or by comments.
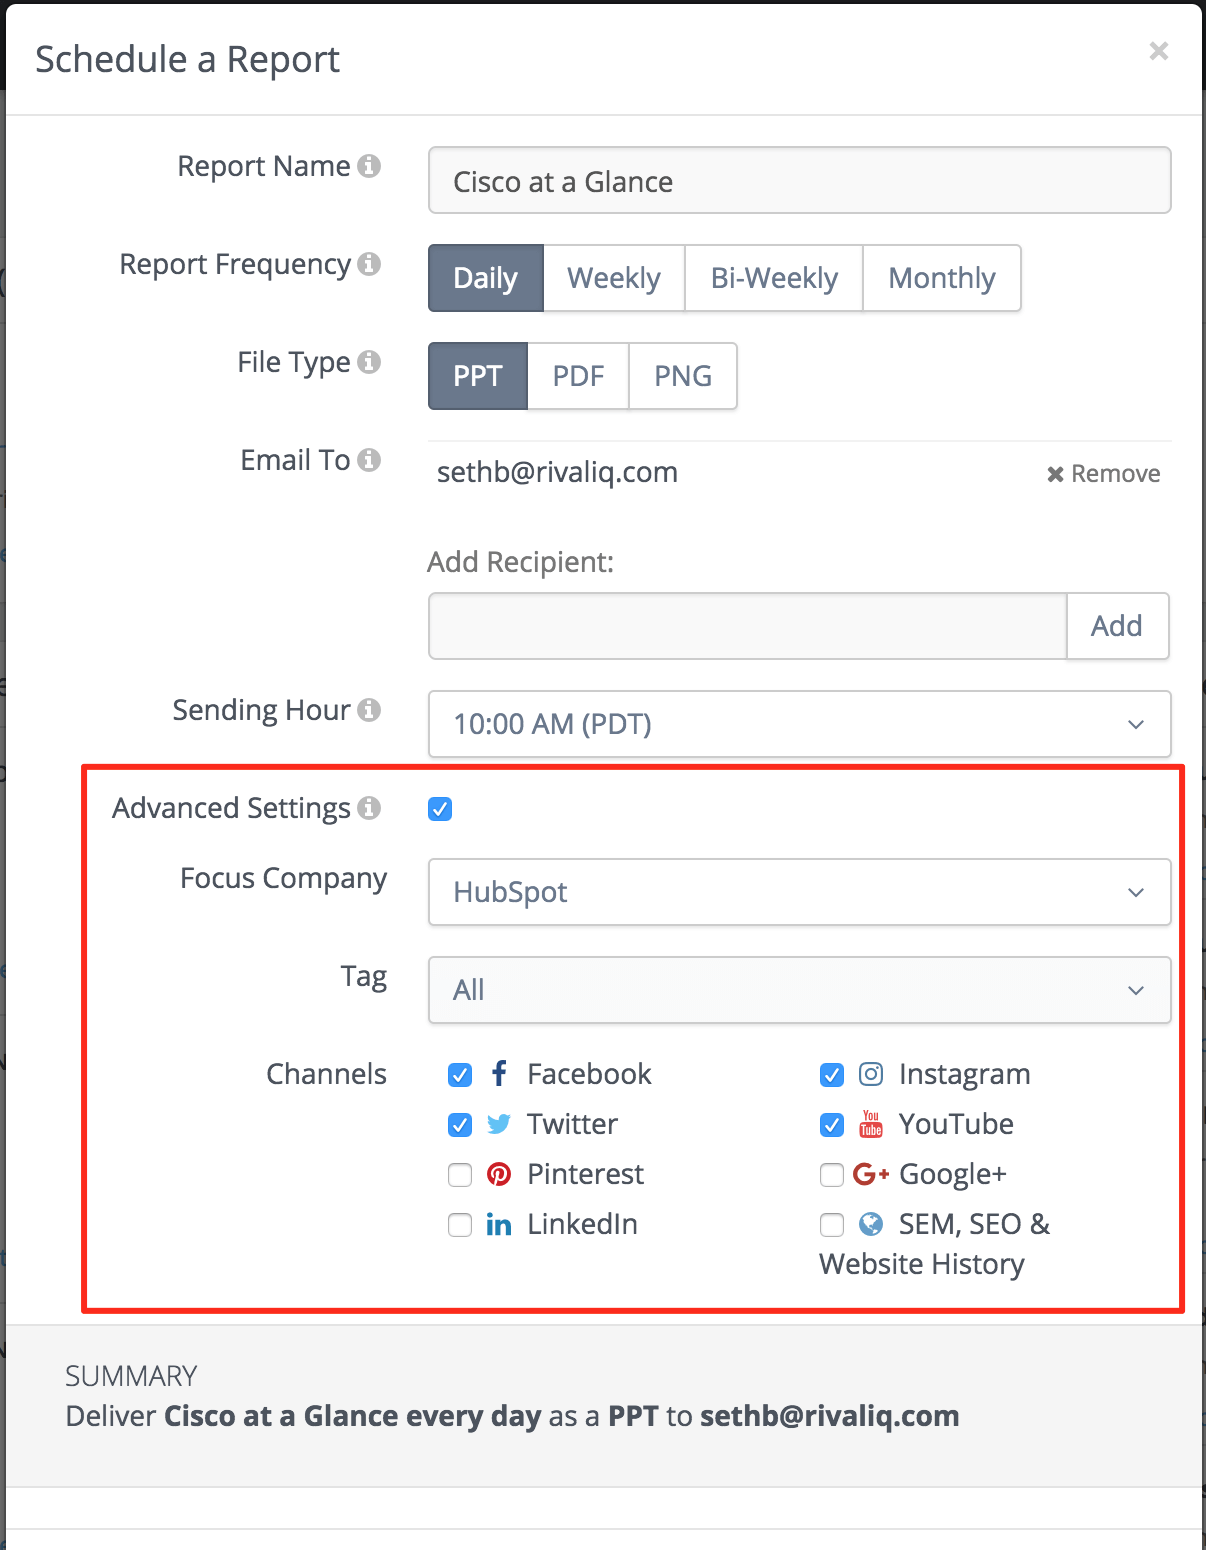
Advanced Export Settings
You now have the ability to customize your settings even further. Advanced export settings allow you remove the focus company from your landscape as well as override the channel set, tags and even delivery times. Whether you’re an agency or a brand this set of customizations in exporting a report will make life simpler. You can now use one landscape in a multitude of ways.
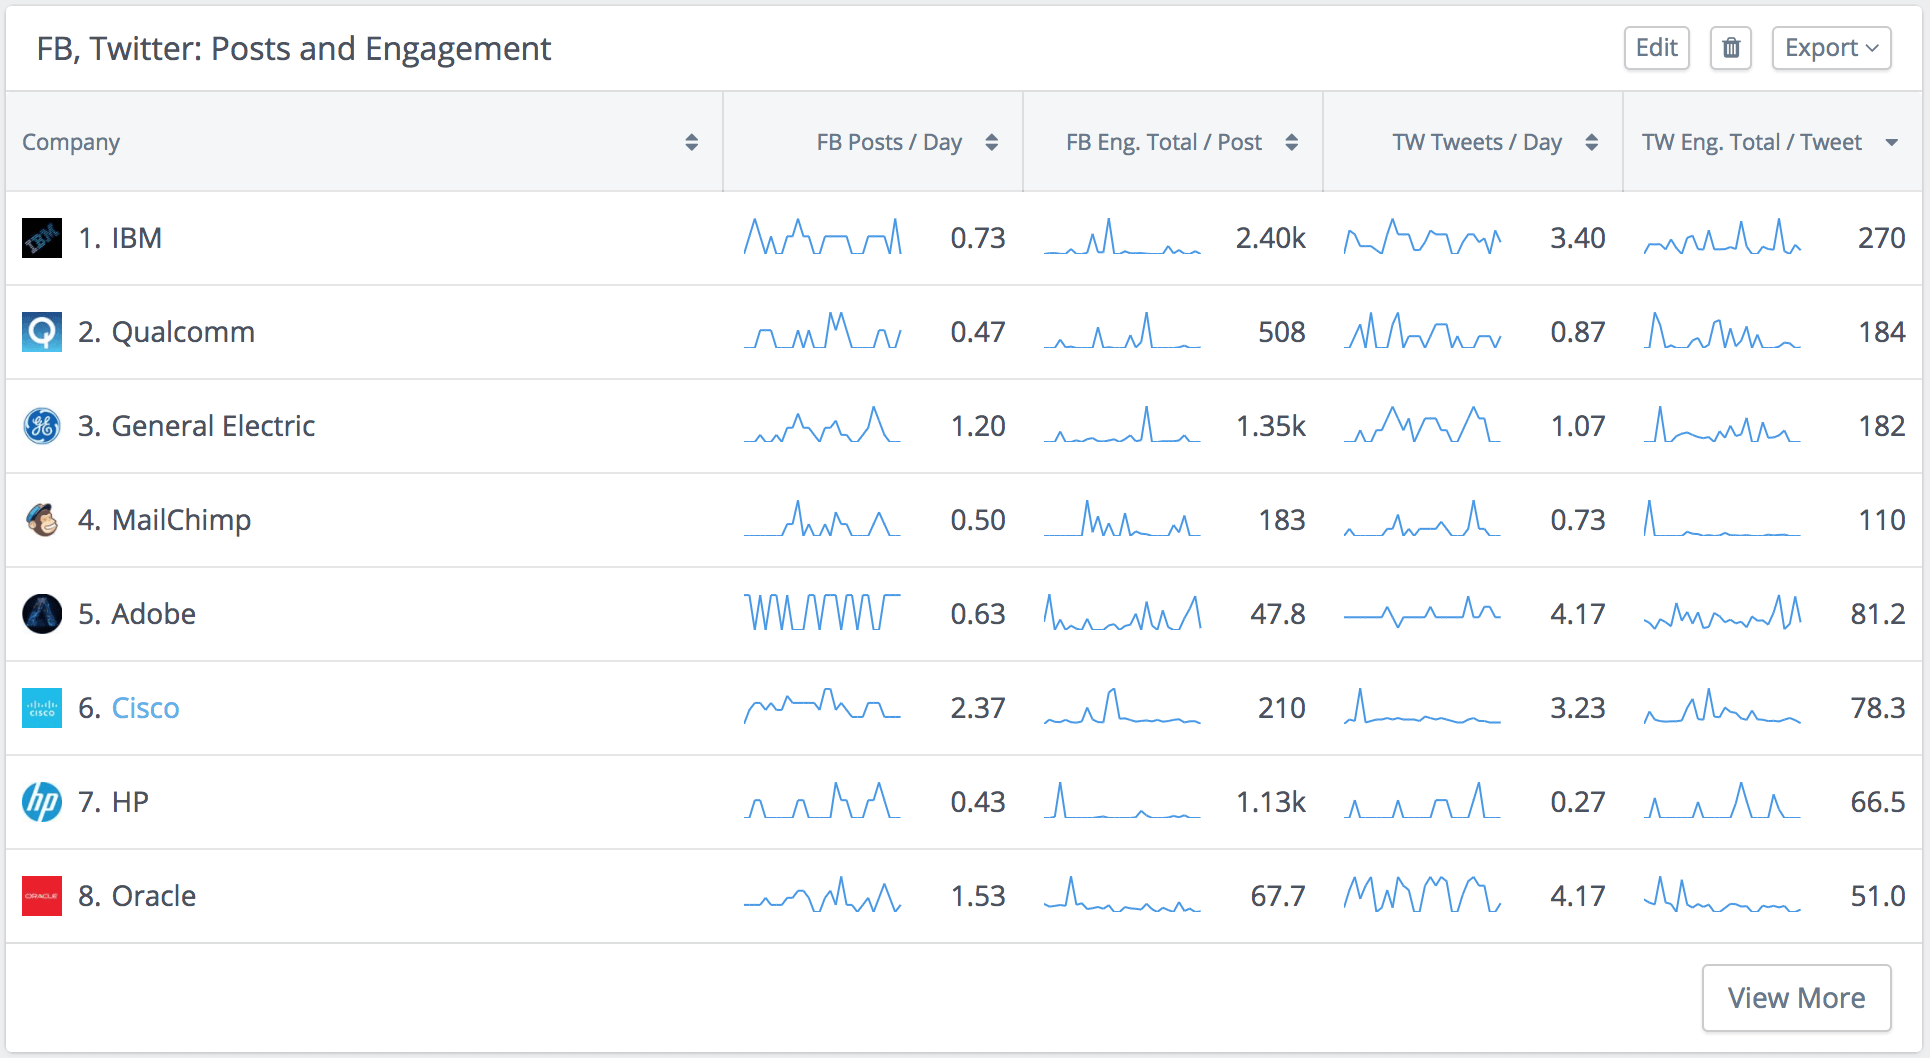
Sparklines
Now available in custom dashboards, sparklines are data lines that show change over time. You’ll be able to use these as layers on your tables, visualizing trends and identifying spikes in performance. With sparklines added to your table, you can clarify engagement reports comparing performance over time and providing a report that tells your whole story at a glance.
Improved Navigation
New icons in the sidebar make it more scannable, helping you find what you need faster. You’ll also notice fixed table headers prevent the headers from scrolling off the page. Now you’ll know exactly what you’re looking at, no matter the table length.
These new features will be available for all customers.