We’re thrilled to announce the launch of an expanded set of metrics for your private social analytics in Rival IQ.
We know that you want full access to the most complete set of analytics possible when it comes to measuring your own social performance. In this release, we’ve added more than 120 metrics to Custom Dashboards for Facebook Insights, Instagram Insights, Twitter Analytics, and LinkedIn Page Analytics. Plus, we have a few additional CSV and scheduled export goodies you’re sure to love.
Read on!
Access all of your private social metrics in one place
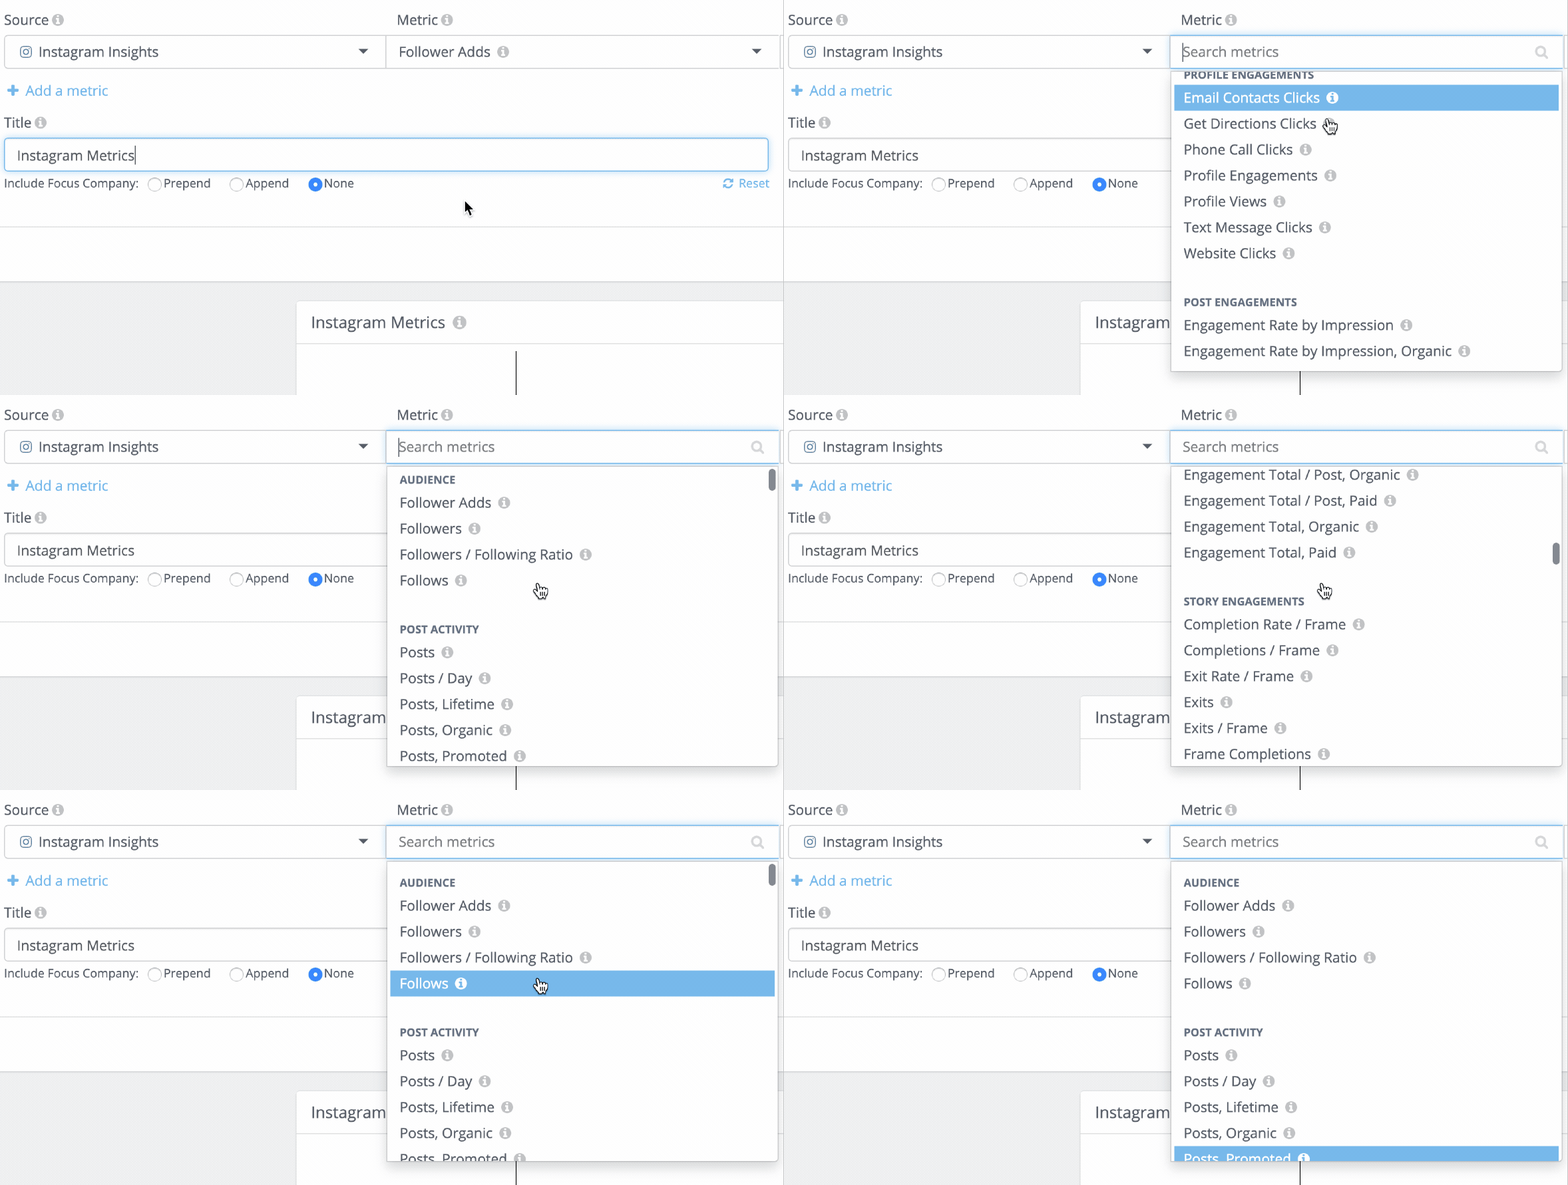
For social media marketers looking to maximize their performance, having access to the best, most detailed metrics possible is critical. For social accounts you’ve connected to Rival IQ, you get access to an even larger set of detailed metrics, from impressions to video views, many with breakdowns between paid and organic activity.
More than 120 new metrics
In this release, we’ve added more than 120 new metrics you can use to report and analyze in Custom Dashboards. They include data points in the following categories.
-
- Presence-level metrics: These metrics describe activity, impressions, and engagement at the profile level, and we receive them directly from platforms. Examples of presence-level metrics include total impressions by day, follower count by day, profile views, consumptions and engagement by day, reach breakdowns by age/gender, and more.
- Post-level metrics: These metrics describe the performance of social posts, and we compute these aggregates using the underlying post data. Examples of post-level metrics include average impressions per post and total engagement per impression.
- Story-level metrics (Instagram only): These metrics describe the performance of Stories and the frames that compose them. Examples of Story-level metrics include average impressions per frame and total Story impressions.

You’ll get to the reports and analysis you need with all these metrics.
Updated metric names for consistency and clarity
With so many metrics and channels at our fingertips, it’s important that we all are on the same page. In this release, we’ve updated (many of) the metric names within the private data sections of Rival IQ.
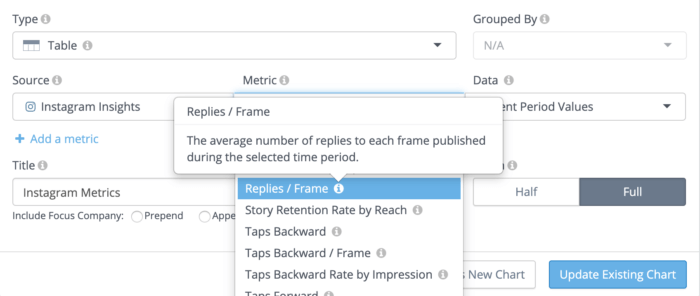
Now, you’ll find a predictable pattern for the naming of metrics that come from the presence vs. ones we calculate using the underlying post data. And of course, you’ll always find info bubbles by every metric name, providing additional context and clarity to the metric you’re examining.

clear naming and helper tooltips will keep you on track
Clarifying Stories and frames
One notable change we made during this renaming process was to redefine our naming around Instagram Stories. Now, here’s how we describe things:
- Frame: A single image or video that you’ve added to your Story
- Story: A collection of frames contained within a single calendar day

Keep your story metrics straight!
In the example above, this handle posted Stories on 27 out of the last 90 days. On days when they posted, they posted 3.26 frames per day on average.
Analyze your metrics your way
At Rival IQ, we aim to give you the flexibility to analyze and visualize your data in the ways you need to find insights and results. That said, sometimes the savviest of you need to do even more!
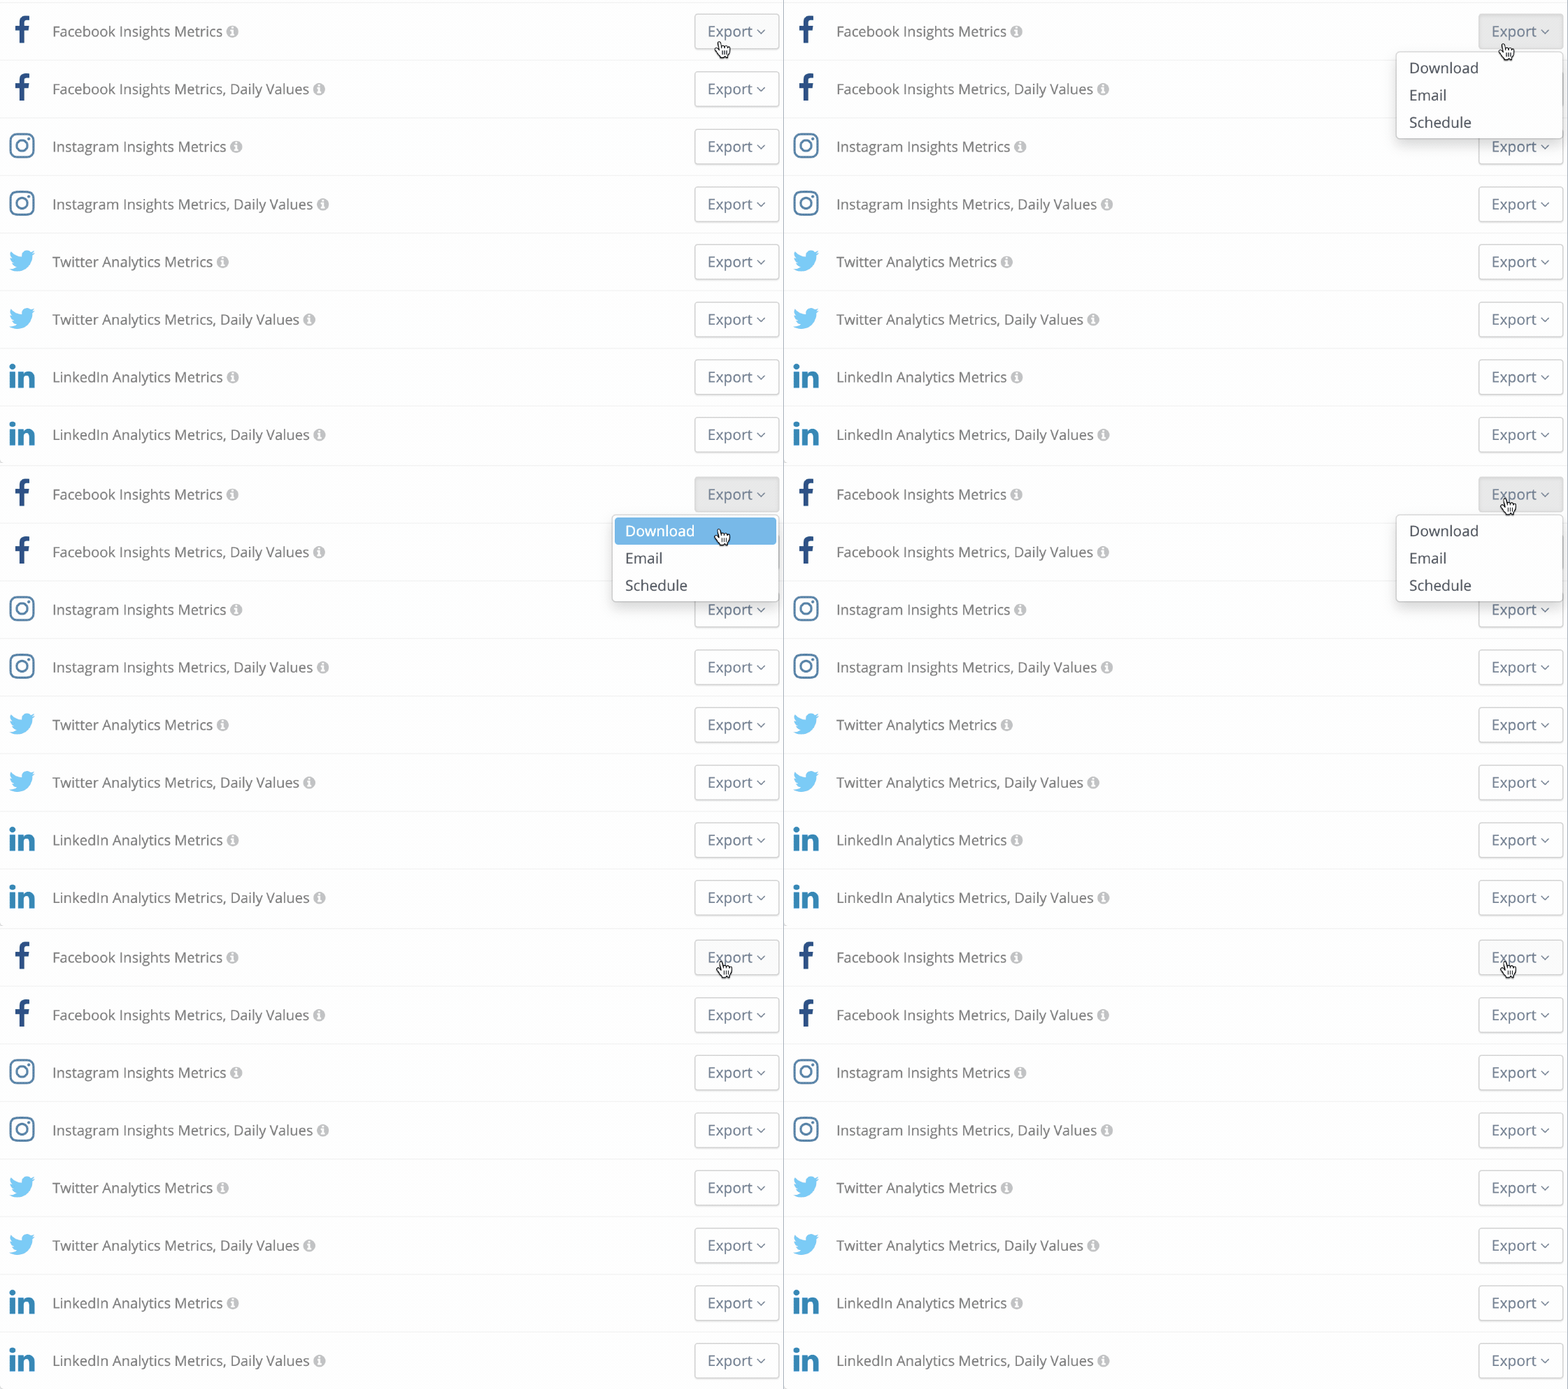
In this release, we’ve added a complete set of private data CSV downloads in our Reports section. Now, you can export your metrics from Facebook Insights, Instagram Insights, Twitter Analytics, and LinkedIn Page Analytics for the entire time period you have selected. If you have multiple companies in your landscape for which you have private data access, we’ll include the data for all companies in your landscape.

easily access all your metrics
Additionally, you have your choice of downloading aggregate metrics or daily values for the entire time period you have selected.
Easily share and integrate Scheduled Exports
As marketers, we have a need to share the reporting and analysis with those around us. Years ago, we started providing Scheduled Exports to simplify your periodic reporting. With Scheduled Exports, you receive an email with a fresh copy of your report at the frequency you desire.
In this most recent release, we’ve introduced Embeddable Links for Scheduled Exports, giving you a stable link (URL) to access the most recent version of your Scheduled Export.
You can use this link in a variety of useful ways:
- Bookmark them or include them in your team wiki for easy access to your current reports, particularly for users who don’t have Rival IQ accounts.
- Embed them (CSV links) into Google Sheets using the IMPORTDATA function to quickly gain access to your most up-to-date data.
- For image reports, include them in 3rd-party dashboard systems that can display images (e.g., Geckoboard).
- Use them (image links) in an <img> tag to embed your reports directly onto a web page.
This image is a scheduled export from RIval IQ.
In the example above, we’ve embedded a live scheduled export from Rival IQ into this web page. So meta.
What’s Next?
If you’re looking to get the most from your social media analytics and you’re already a Rival IQ customer, here’s where you can find all of the goodies we just launched.
- Private Social Metrics in Custom Dashboards
- CSV Exports for private social data
- Embeddable Links for Scheduled Exports
If you’re not already a Rival IQ customer, go grab a free trial and check all of this out!
